Introduction
The control of beverages quality and freshness is of increasing interest for both the consumer and the beverages industries. Classical analytical techniques such as various chromatography, spectrometry, and etc are however time-consuming, expensive, and laborious which can hardly be done on-site or on-line. For quality control, it is necessary to monitor the evaluation of a group of certain components that reflects the process of ageing and spoilage of a beverage product. These components can be numerous or unknown and the problem appear to be quite difficult. Besides, it is impractical and very hard to compare the results of instrumental analysis to biological sensing [
1]. The advent of ‘Disposable Taste Sensor’ opened the way to a new kind of analytical approach of complex samples based on synthesis of global chemical information [
2]. A preliminary study towards the development of a simple but reliable, one-shot, disposable ‘taste sensor’ which functions on a new concept of global selectivity is currently under development by Universiti Sains Malaysia. The disposable ‘Taste Sensor’, coupled with pattern recognition tools is capable of providing chemical fingerprint that represent a combination of all the chemical components, ideally suitable for simple, real-time testing and monitoring the quality of food or beverages. The basic principle behind the disposable taste sensor system is to combine non-specific and overlapping sensors signals with pattern recognition routines. The sensor array in this system produces signals, which are not specific for any particular components in the samples. The signal pattern generated is related to certain features or qualities of the sample. These qualities can be determined by a computer trained to recognize the class of response patterns related to the sample under study
. This is thus a similar correlation to how the human sense organs produce signal patterns to be qualitatively interpreted by the brain [
10].
The disposable ‘Taste Sensor’ is a replacement to the conventional electrodes, which is bulky and expensive. The sensor array is an integration of working electrodes and reference electrode together in a single strip based on screen-printing technology, in order to miniaturize and to simplify the instrumentation for decentralized analysis [
3]. Screen-printing technology is particularly attractive for the production of disposable sensors. The ‘memory effect” between one sample to another is avoided, and the phenomenon referred to as “electrode fouling” which is one of the main drawbacks of the electrochemical sensors is overcomed. As the sensor described here is targeted for one-time use, sterilization or cleaning to avoid contamination is no longer needed. Also sensor durability or usage lifetime, which is particularly important for conventional electrode, no longer becomes an issue, needed to be taken into consideration. Besides that, common problem related to conventional sensors like sensor respond drifting due to leaching of active agents in the membrane is also overcome as the membrane sensor is always new prior to use. The disposable ‘taste sensor’ system consists of an array sensor based on screen-printed disposable lipid membrane strips, multi-channel high impedance data acquisition device and pattern recognition tools.
Food shelf life especially dairy products such as fluid milk varies with the age and type of ingredients, the process, the packaging, the environmental conditions during distribution, and consumer holding. Manufacturers can control the first three factors to ensure the initial quality of the product, however the last two conditions are not within their control. The “freshness” or “quality” of beverage products ultimately depends on existing distribution, marketing systems and consumer food storage habits. At the point where products move from manufacturer to regional distribution centers, temperature or humidity changes will cause abuse to products resulting in quality loss. Hence, product code date such as sell-by-date or use-by date which manufacturer put on packages to give consumers information about product freshness cannot always be equated with its potential shelf life. Therefore, it is necessary for the description or monitoring of analysis pertaining to quality assurance. The present paper is devoted to analytical evaluation of the disposable ‘Taste Sensor’ capable of distinguishing between fresh and spoiled milk and to follow the deterioration of the quality of milk when milk is stored at room temperature. The system was tested on two types of commercial milk, the Ultra High Temperature (UHT) milk and the pasteurized milk.
Experimental
Fabrication of Disposable Taste Sensor by Screen–printing technology
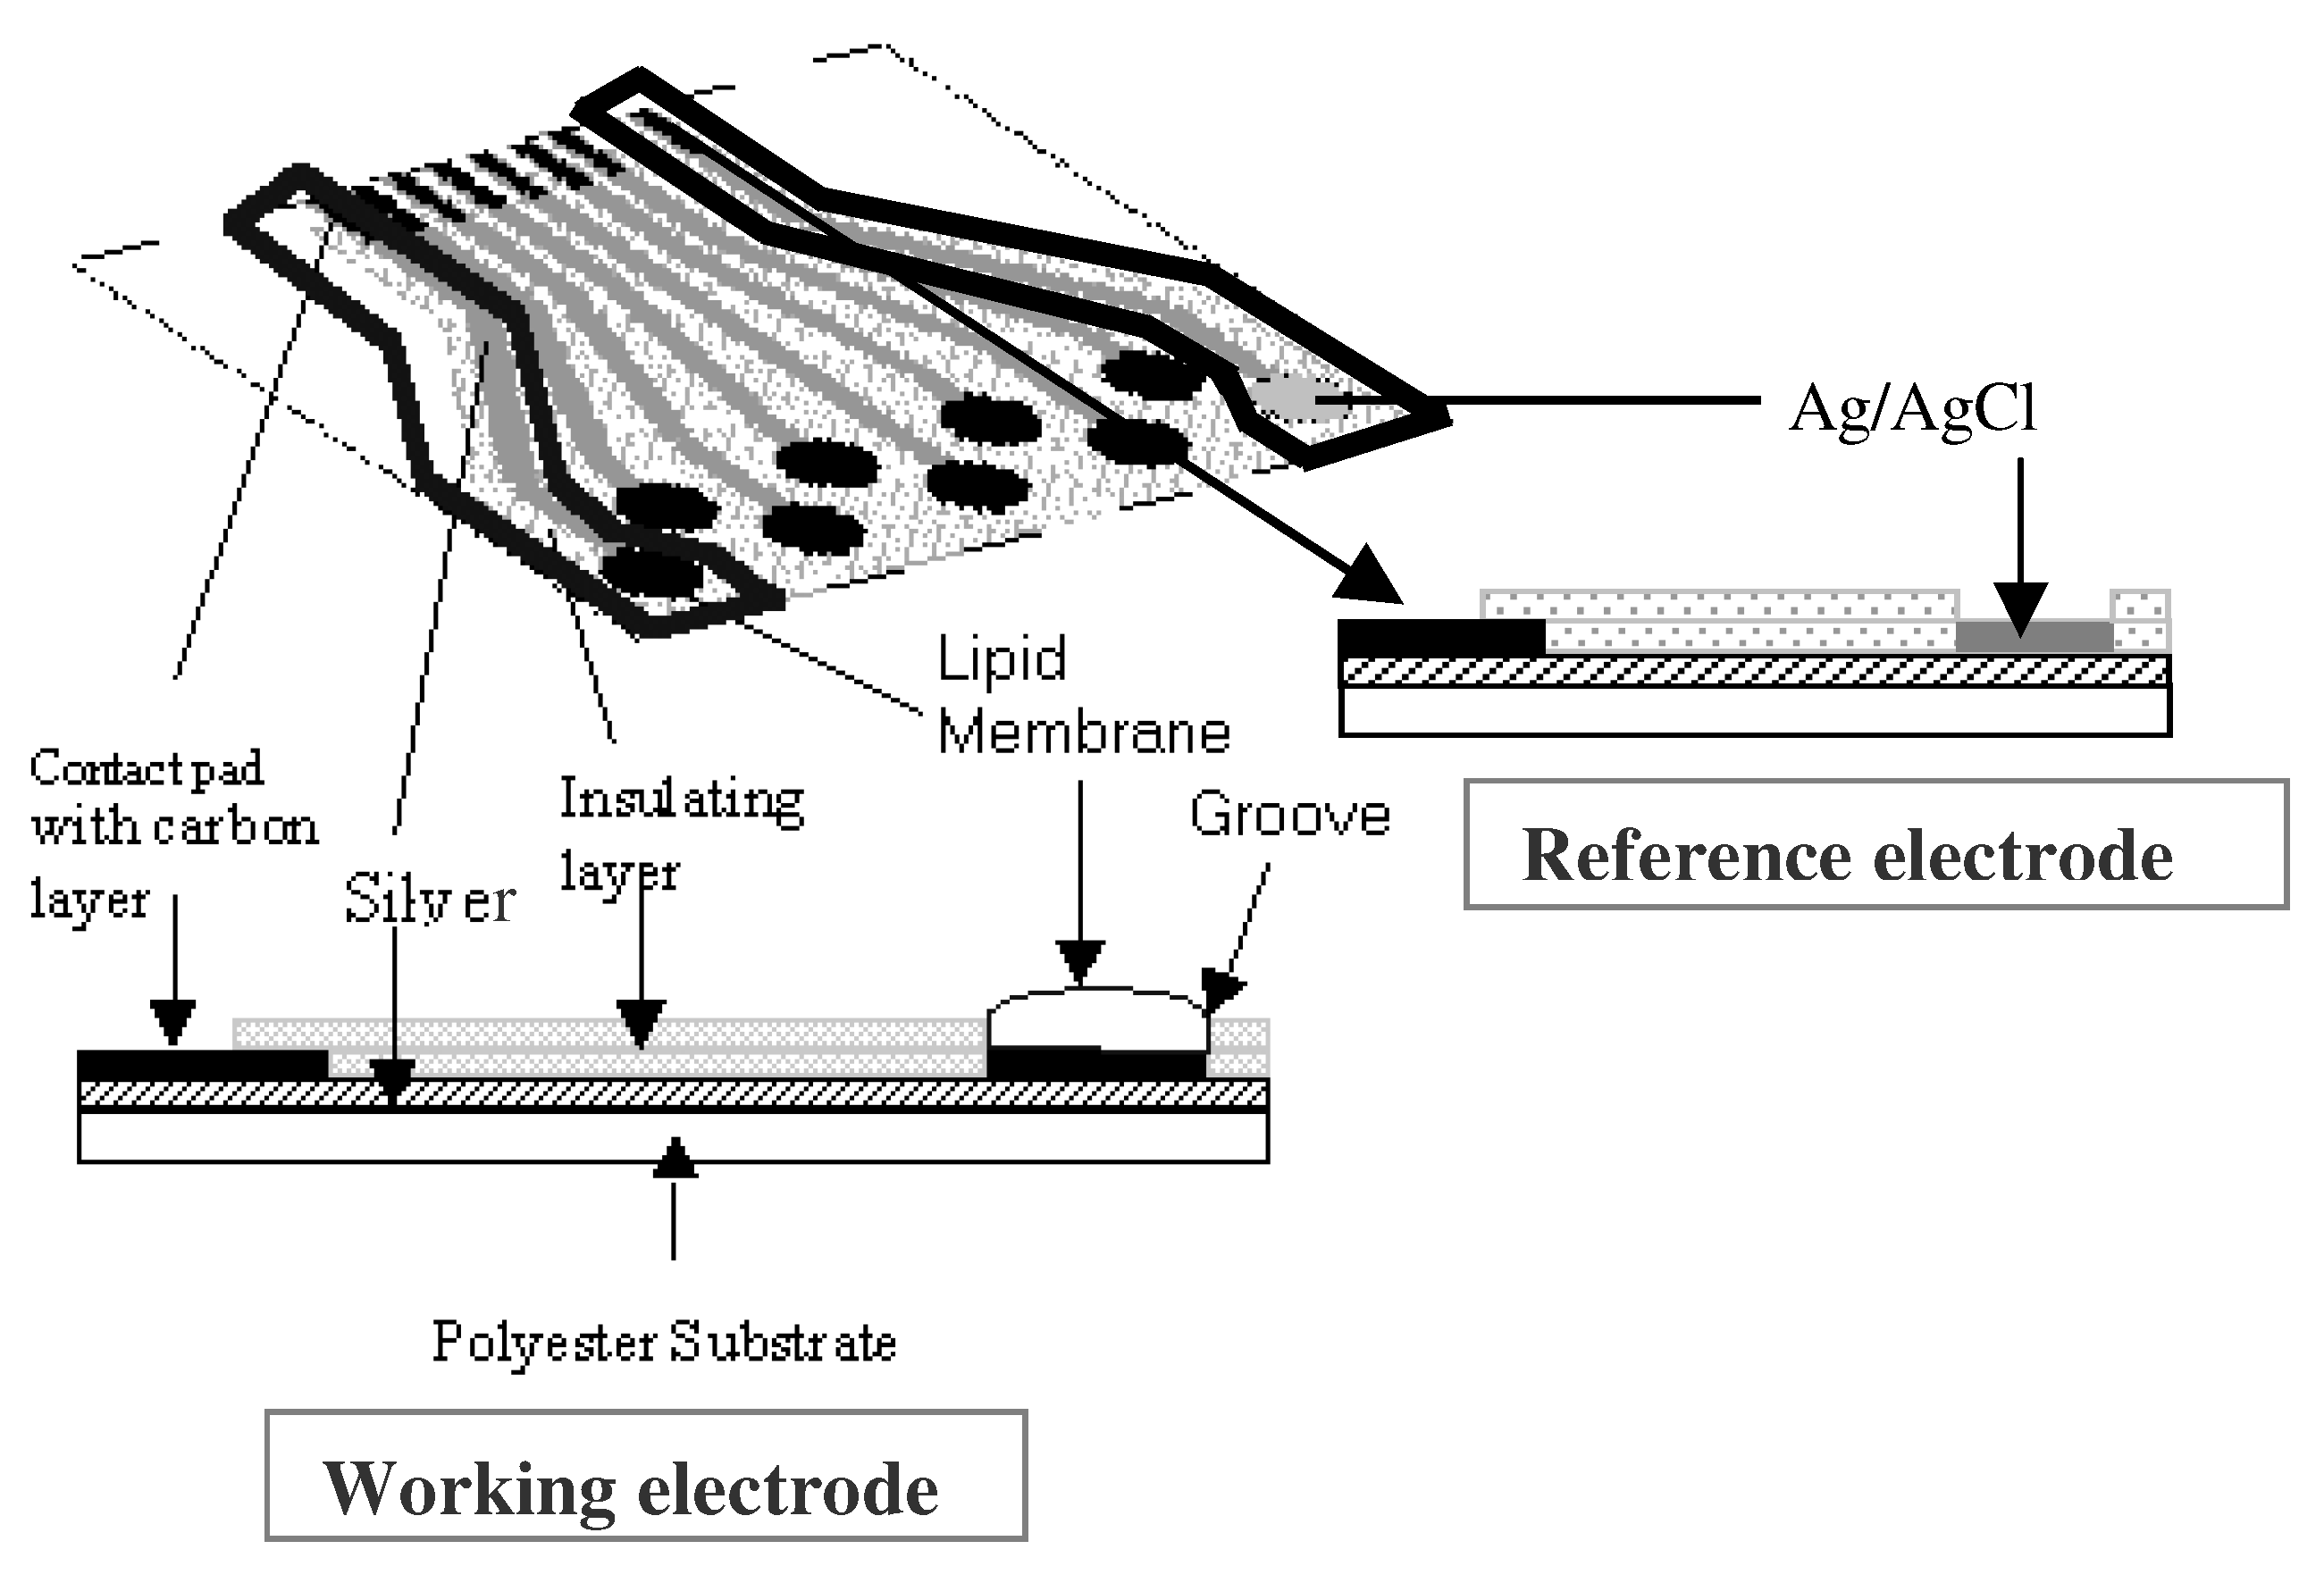
The design and fabrication of the disposable taste sensors were carried out in Universiti Sains Malaysia with the help from Scrint (M) Sdn Bhd. Malaysia. Screen-printing technology is a technique whereby the screens allow ink to be applied on to a substrate with a squeegee in a particular size, shape and sequence of the print. Each of the screen-printed electrodes was printed in an array of eight working electrodes and a reference electrode. The fabrication process of the sensor was carried out in four consecutive printing steps including printing of silver track, graphite layer, Ag/AgCl and protective layer (insulation) on the polyester substrate. For the first layer, nine conducting paths were printed with silver ink (Electrodag ® 425A). Subsequently, nine conducting pads and circular working electrode areas were printed with graphite-based ink (Electrodag ® 440B), followed by Ag/AgCl (Electrodag ® 7019) as the reference electrode. Four insulating layers were printed on the polyester substrate to create circular grooves. Finally lipid membranes were deposited onto the eight circular grooves to complete the working electrodes. This is done by dispensing or dropping of cocktail solution containing components of lipid membrane using the high precision fluid dispenser from Musashi Engineering, Inc. The lipid materials used, as listed in
Table 1, are similar to those reported by Toko [
4].
Figure 1 shows the cross-sectional view of a disposable screen-printed lipid-membrane taste sensor with the working electrode and a reference electrode integrated into a single strip. The disposable strip consists of 8 circular graphite working electrode and an Ag/AgCl working electrode each with diameter of 4 mm. The strip is printed on a planar, polyester substrate of thickness 250 μm.
The dimension of each strip is 3.8 cm x 5.7 cm.
Figure 2. shows the disposable taste sensor system comprising of an eight-channel high impedance multi-interface meter from Fylde Scientific, UK, the disposable screen-printed lipid membrane strips and pattern recognition tools.
Figure 1.
Cross-Sectional view of a screen-printed lipid membrane sensor.
Figure 1.
Cross-Sectional view of a screen-printed lipid membrane sensor.
Milk measurement
Samples of both pasteurized and UHT milk were bought over the counter. At the first stage, the evaluation of the disposable taste sensor system for fresh-spoiled milk was carried out. Three sets of measurements consist of four different brands of milk were collected immediately after the package was opened and then left opened, at room temperature for 48 hours, and then measured again.
At the second stage, only one brand out of the four brands was selected from each type of milk. Randomly, we have chosen Anlene brand for UHT milk and I Cal for pasteurized milk. The first measurements were taken during the first hour of opening and later at the 6th hour, 12th hour, 16th hour, 24th hour, 26th hour and finally on the 48th hour when the milk was surely spoiled. Data collections were repeated eight times for both samples except for the last measurement (taken on the 48th hour) where only three sets of data were collected. The disposable sensors were rinsed with distilled water before they were being immersed into the samples. One minute of conditioning was performed before data collection started and all measurements were taken for sixty seconds with ten seconds of interval with the disposable taste sensor system.
Data analysis
The raw data obtained from the experiments were analyzed by a pattern recognition technique called principle component analysis (PCA). All PCA were performed with the statistical package SPSS (Statistical Programme for Social Scientist) 9.0 for Windows. PCA is a mathematical transform, which can be to explain variation in experimental data [
5]. PCA reduces the immense data set to plots, which can be easily used to classify or group the observation.
Results and Discussion
Classification between fresh and spoiled UHT and pasteurized milk
At the first stage of the experiment, measurements were taken from four different brands of packaged UHT and pasteurized commercial milk.
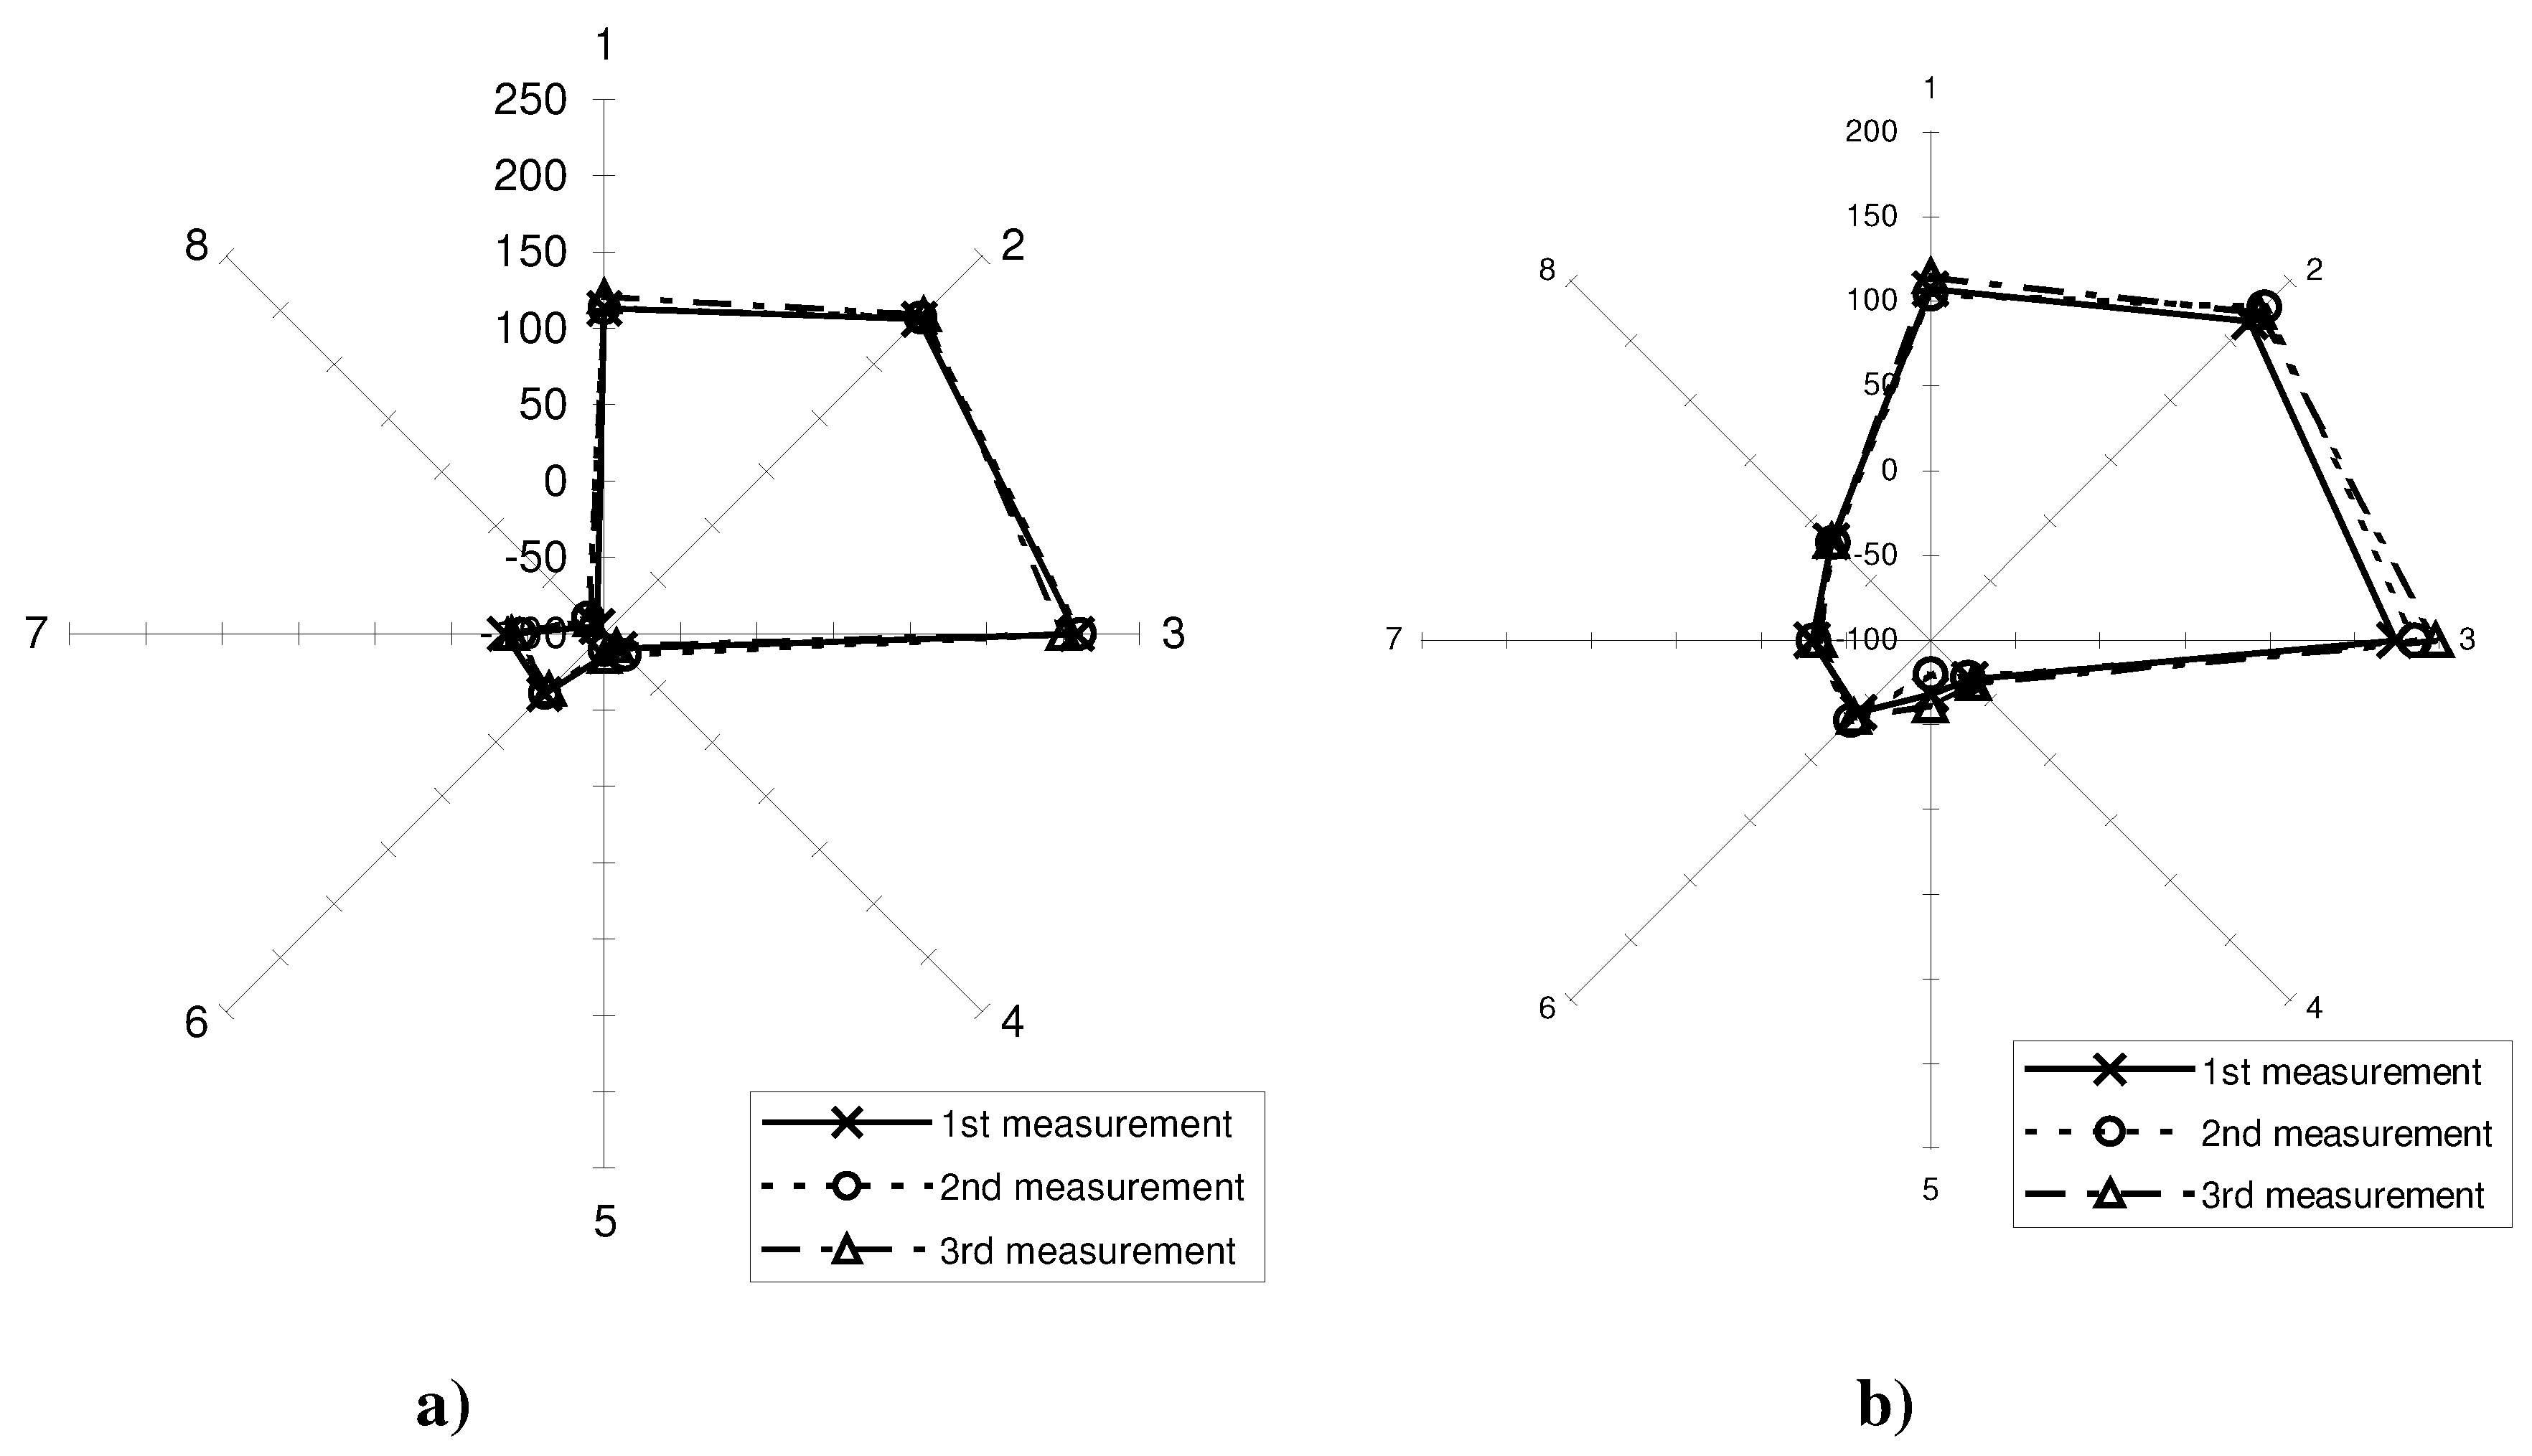
Figure 3a and
Figure 3b. show the response patterns for fresh and spoiled milk in one of the samples of pasteurized milk - I Cal as an example. As can be seen, both patterns impart two different unique fingerprints, which differ the fresh milk from the spoiled one. Three measurements of the same brand of milk have been performed to ensure the repeatability of the disposable strips. The relative standard deviation between the three different measurements for channels 1 to 8 respectively was about 2mV-6mV for fresh I Cal milk and 1mV-12mV for spoiled I Cal milk. However, according to Hibbert[
9], in method of analysis using arrays of sensor, present difficulties especially with regard to accuracy and precision. Precision is usually indicated by standard deviation (usually reported as relative standard deviation) of a set of data. However in this paper, the accuracy and precision is presented by presenting the same sample a number of times to the array [
9]. The original data obtained from the measurements of the UHT and pasteurized milk were visualized using PCA, (
Figure 4). PCA aims at reducing the dimension of data without losing information. In terms of the machine learning paradigms PCA is an unsupervised learning method and is used to decide whether a set of pattern classify naturally into groups or not. Therefore, PCA is able to highlight some clusters without having any prior knowledge of the classes to be expected and it can prove the performance of the system [
6].
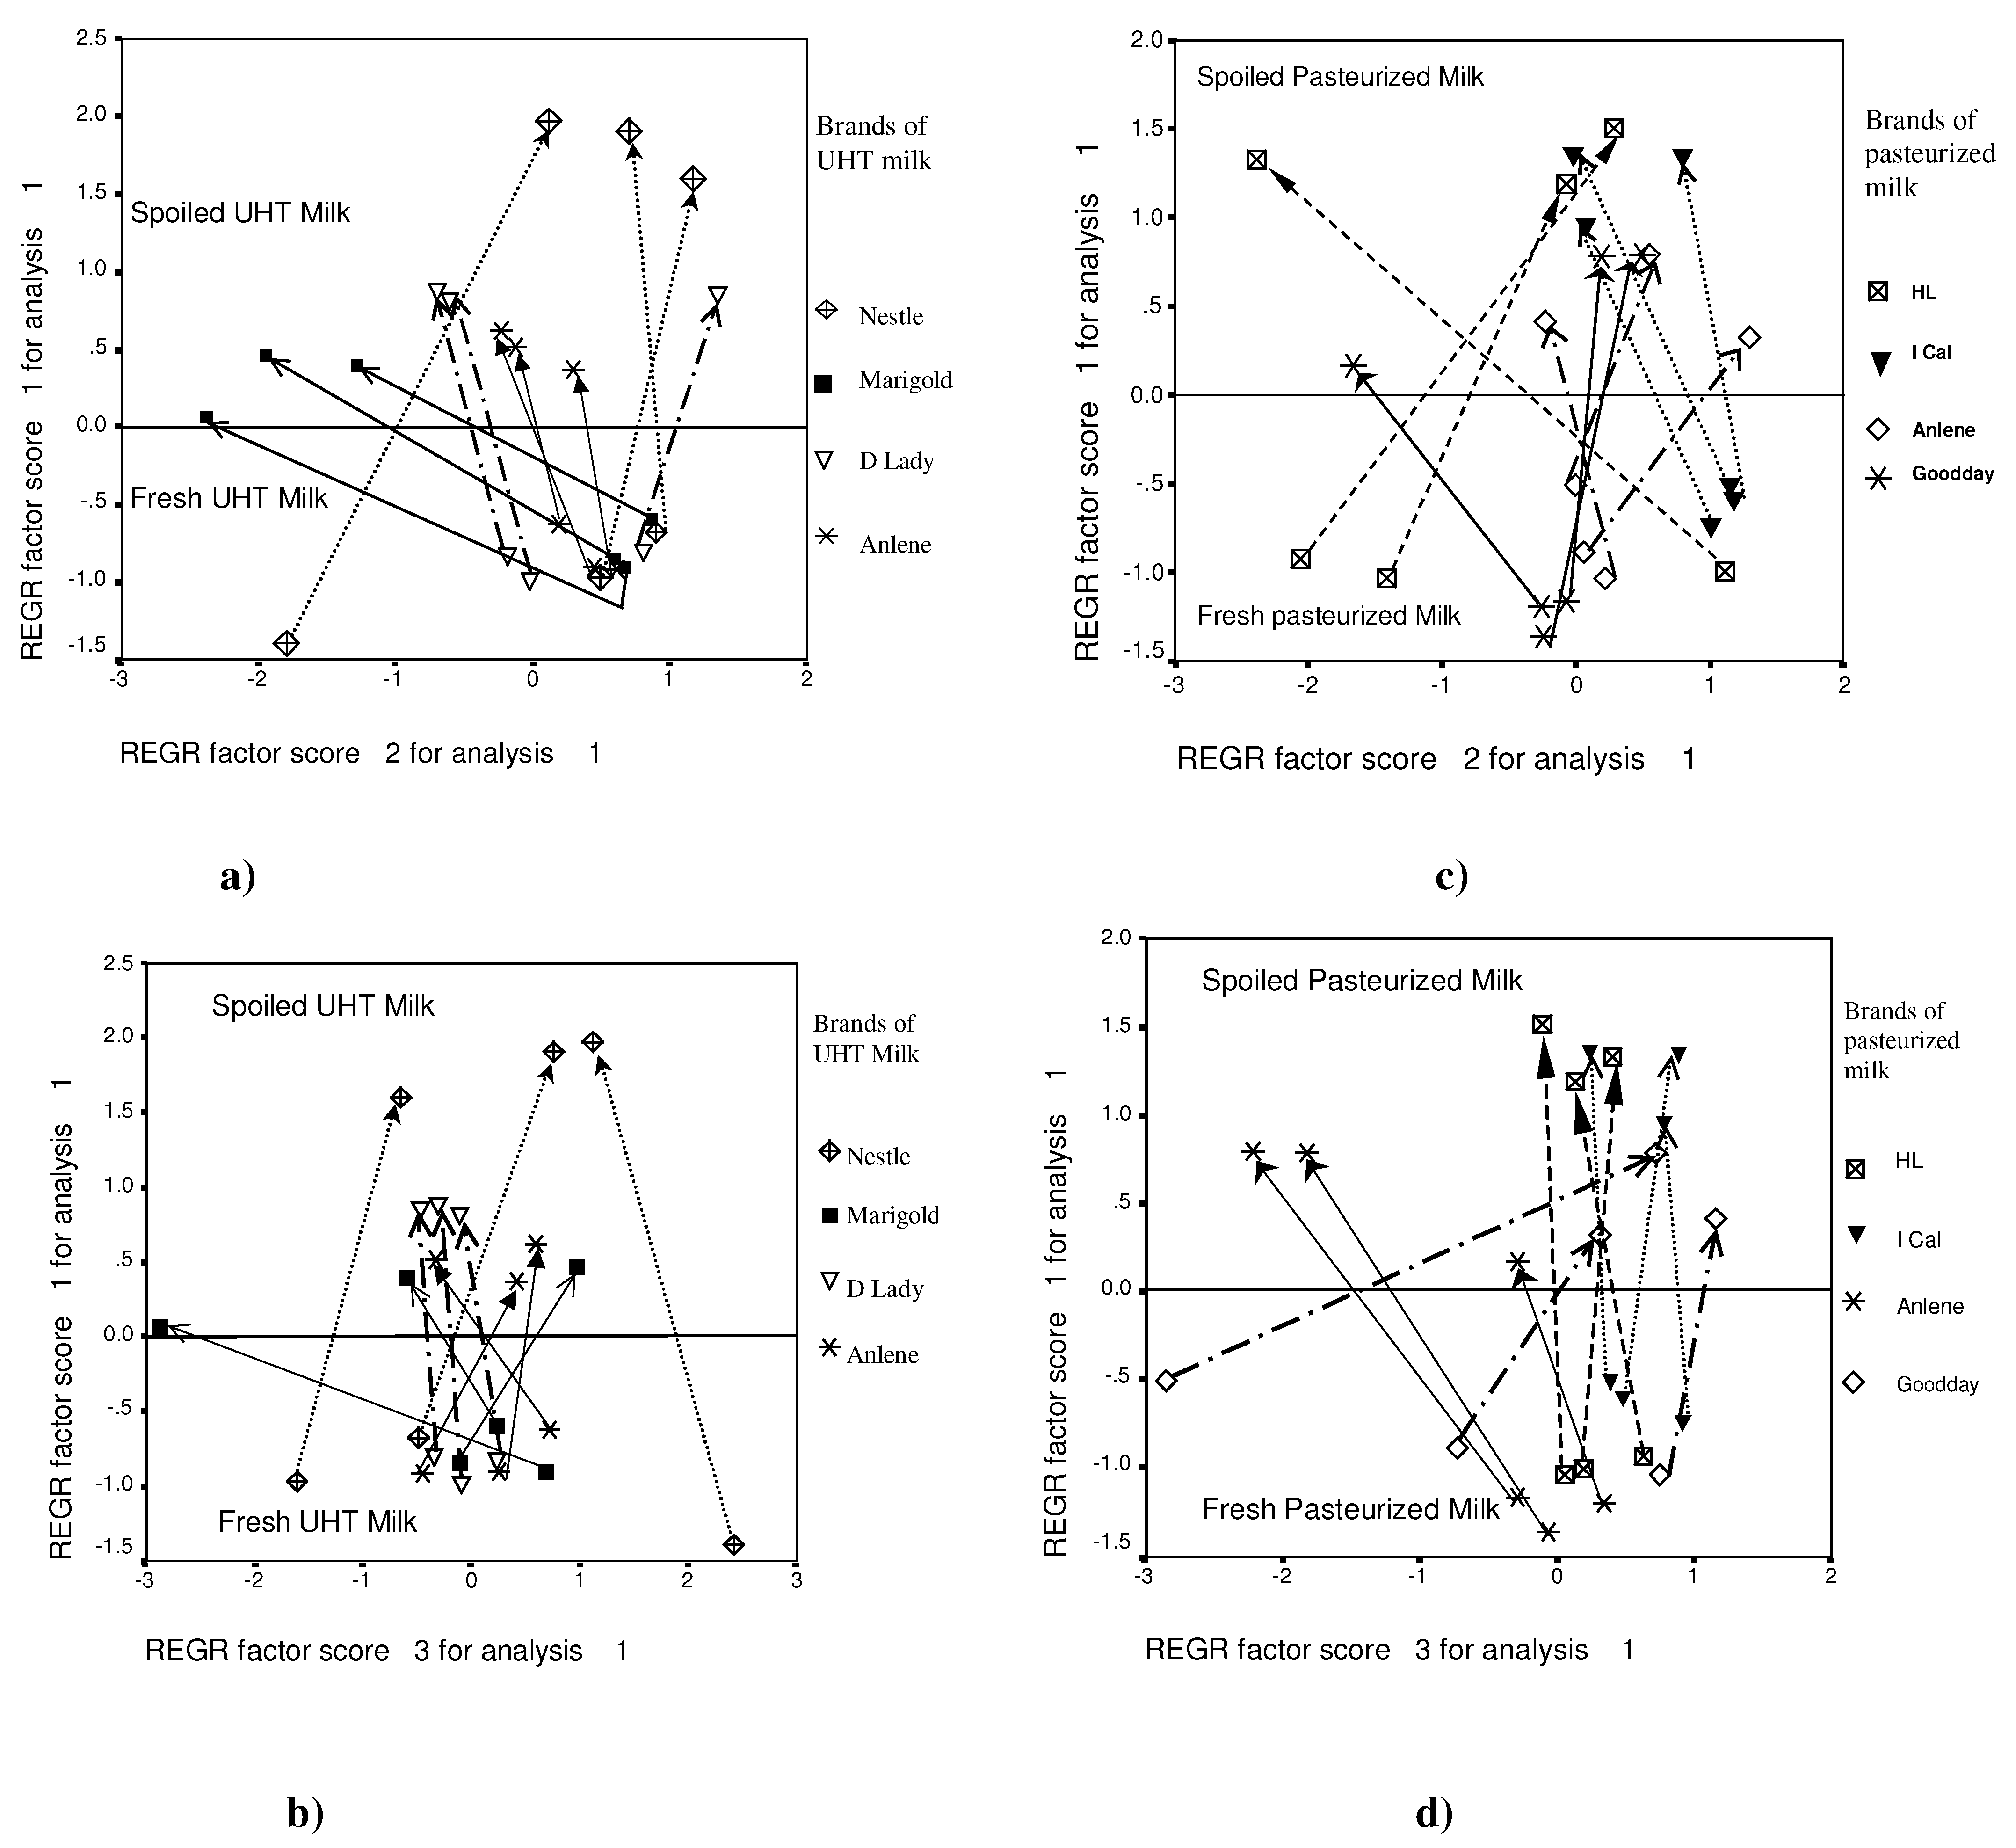
Figure 4 presents the PCA plots discriminating between the fresh and spoiled samples.
Table 2 shows the eigenvalues and percentage variance of the response data. The first three principal components contained more than 85% of total variance and eigen values of greater than 1. These three principal components have the most relevant information to classify the fresh milk from the spoiled ones. In
Figure 4a and
Figure 4c, Principal Components 1 (PC1) vs. Principal Components 2 (PC2) are graphically shown. Together both PCs account for 73.2% of total variance for UHT milk and 73.9%
Figure 3.
Response pattern of disposable sensor array for three measurements of (a) I Cal Fresh (0 hour) pasteurized milk and (b) I Cal spoiled (48 hours) pasteurized milk.
Figure 3.
Response pattern of disposable sensor array for three measurements of (a) I Cal Fresh (0 hour) pasteurized milk and (b) I Cal spoiled (48 hours) pasteurized milk.
for pasteurized milk. Additionally, PC1 vs. PC3 plots also showed similar tendencies (see
Figure 4b and
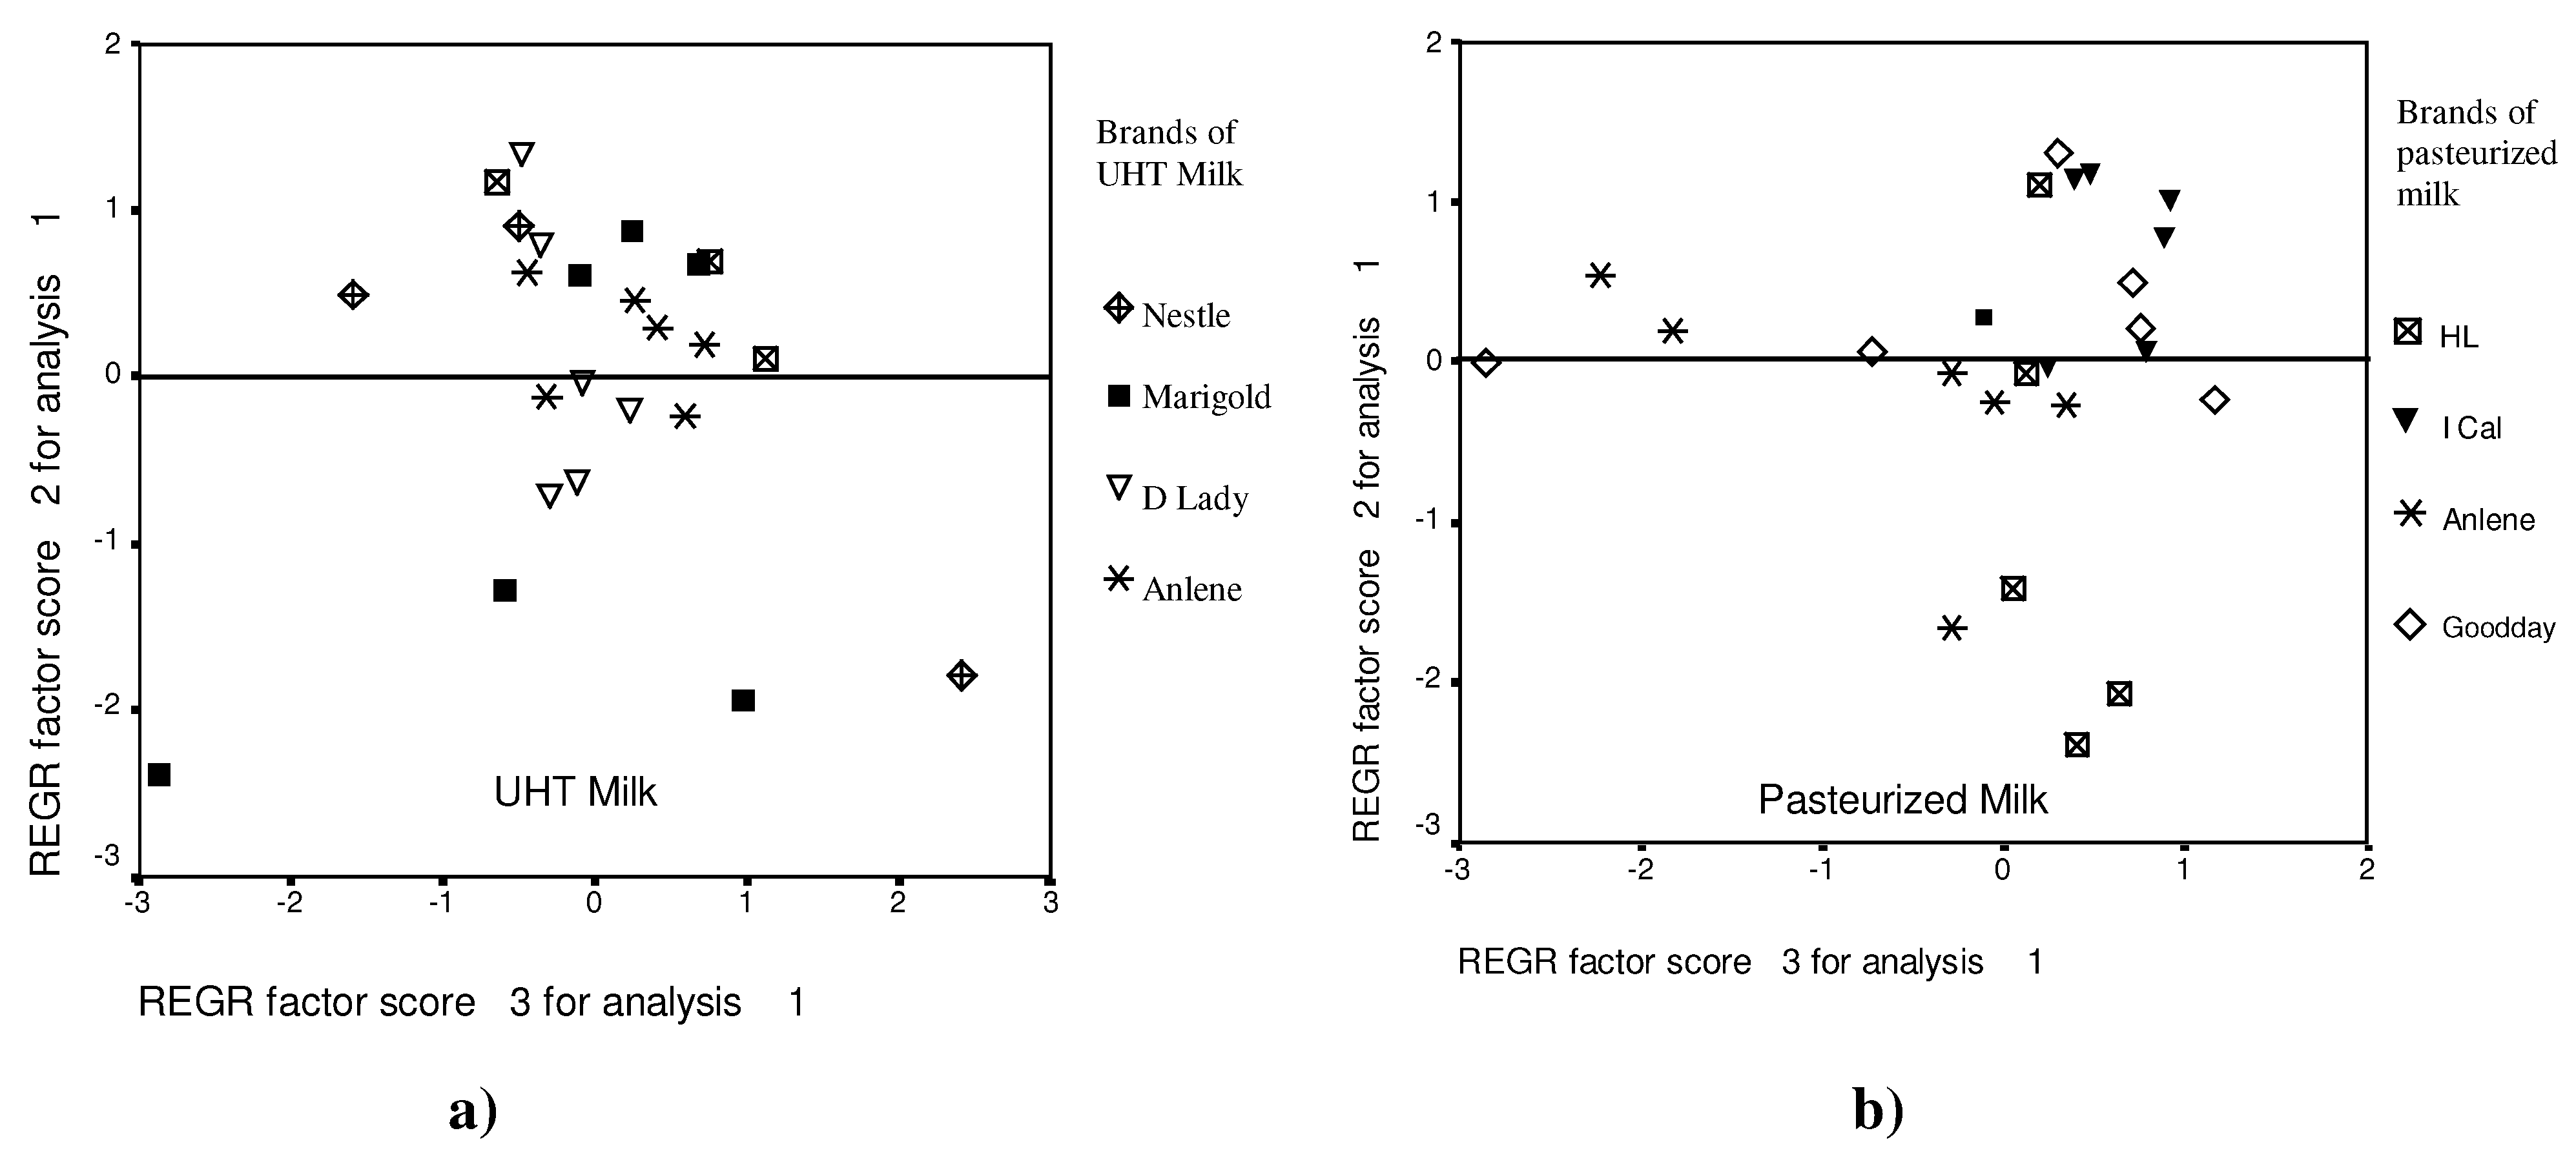
Figure 4d). However, these tendencies were less clear in the PC2 vs. PC3 plots (see
Figure 5a and
Figure 5b). As can be observed from
Figure 4., there is a clear distinction between the fresh and spoiled data for both pasteurized and UHT milk. The plots are divided into two regions with PC1 discriminating between the two classes. The upper region of the zero axis indicates the region for spoiled milk whereas the lower one indicates the region for fresh milk. The arrows show the transition passage from fresh to spoiled for each milk sample.
The evolution with time of milk quality
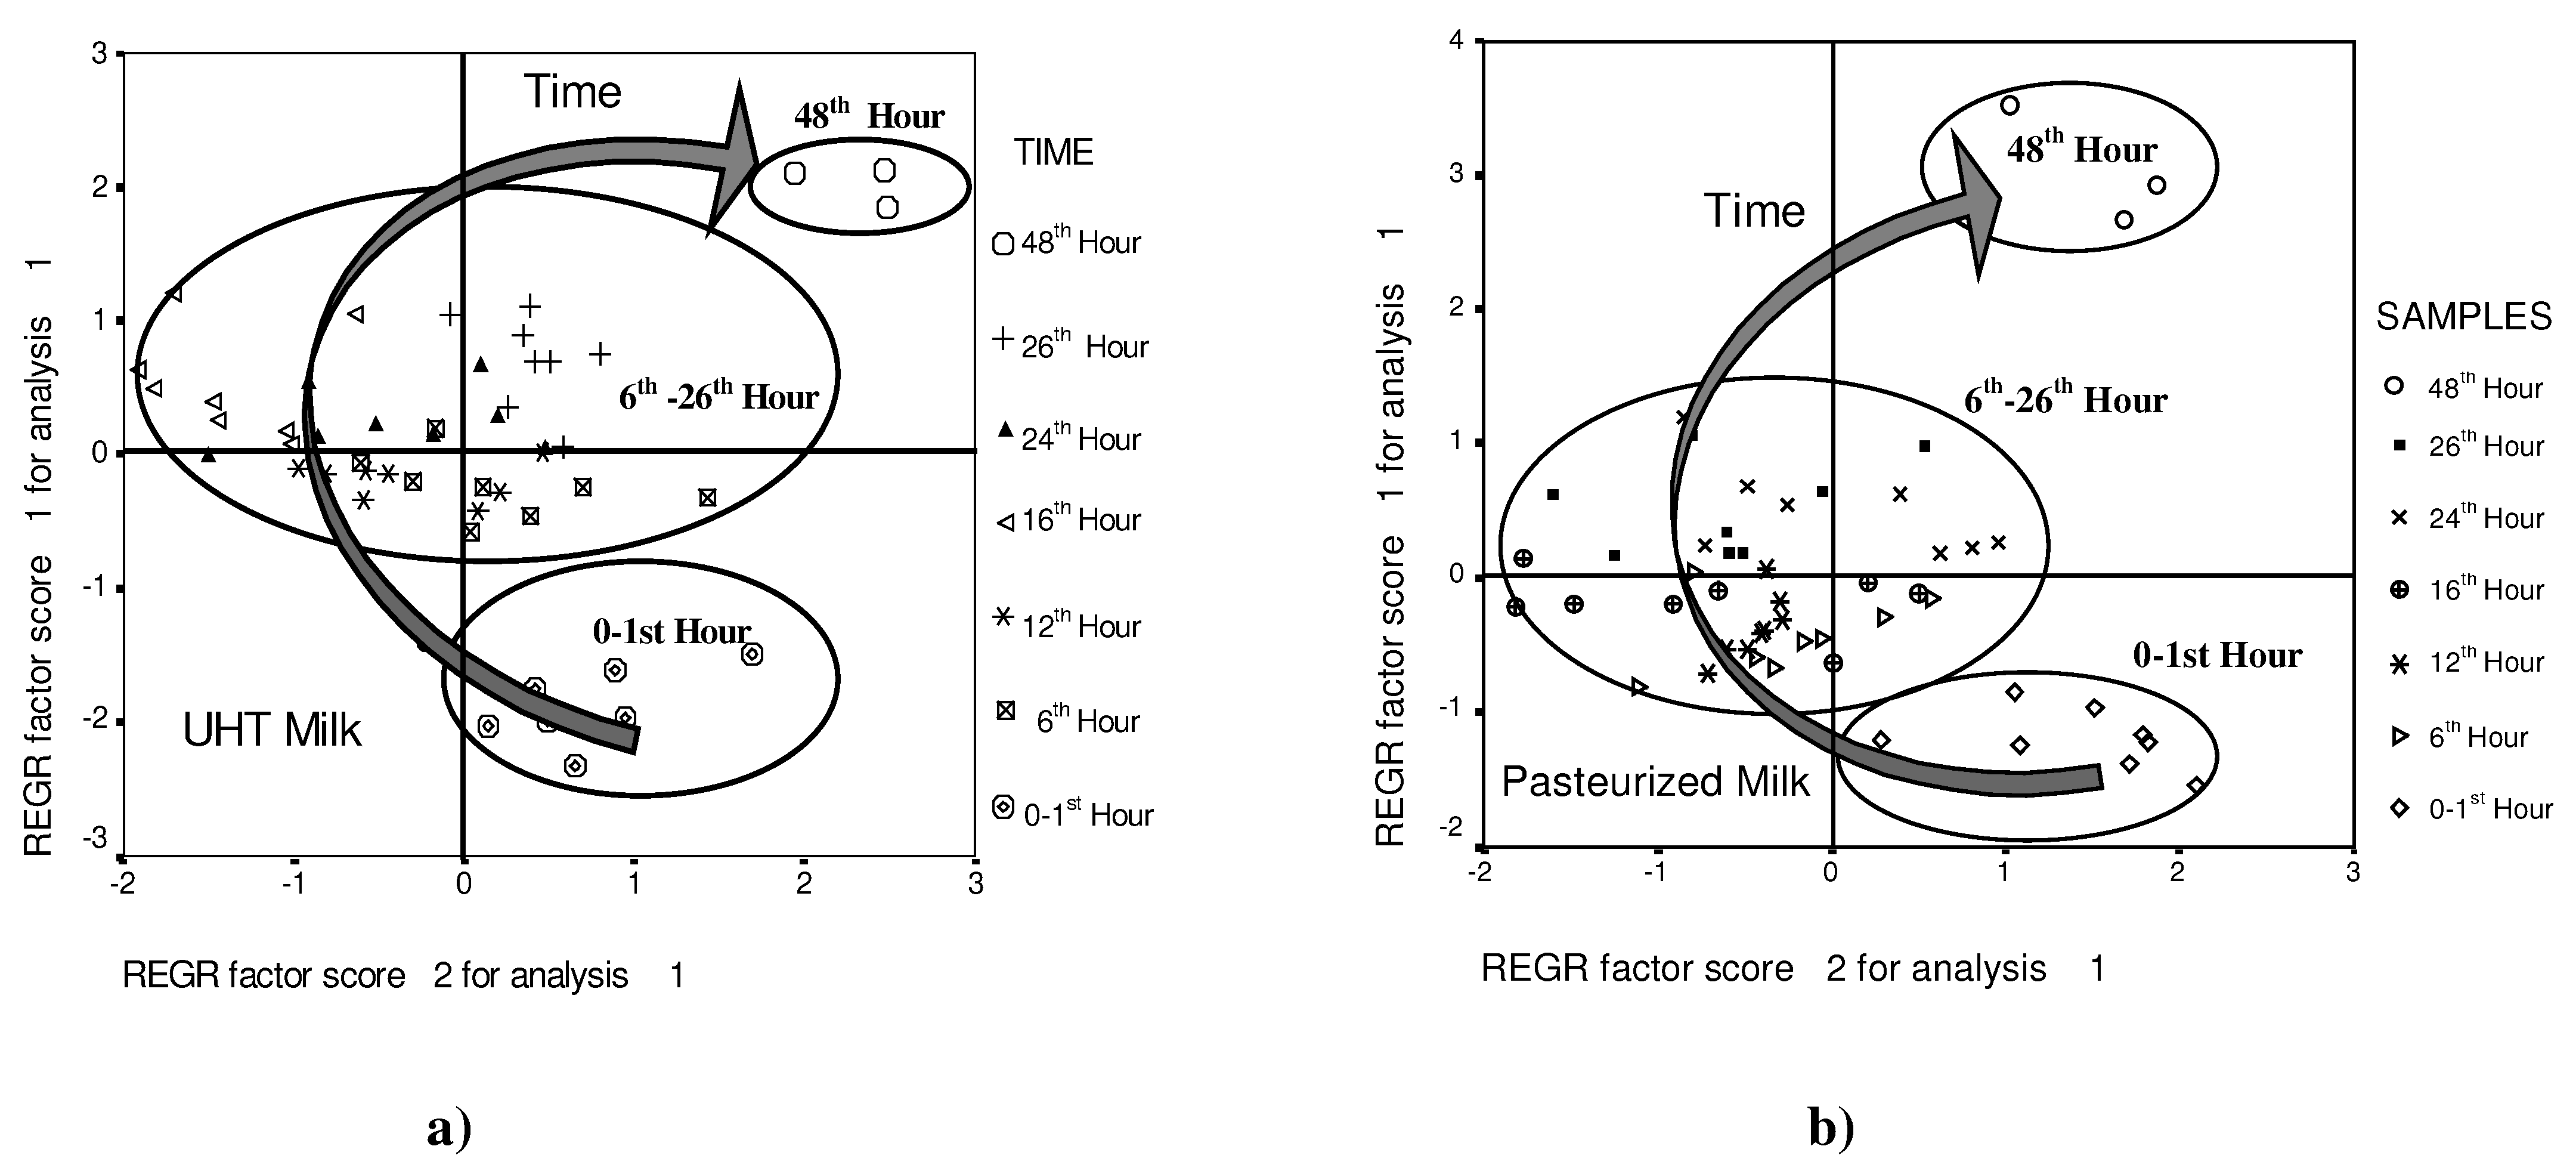
The second part of the present work has been designed as an attempt to monitor the deterioration of the quality of milk due to microbial growth when milk is stored at room temperature. Study was performed using the UHT and pasteurized milk and the PCA plots which display the results of the milk analysis are shown in
Figure 6a and
Figure 6b. A dependence of disposable sensor array data on milk storage time can be observed.
The PCA of the milk freshness data showed a characteristic development of the milk quality dependent on storage time. The first and second principal component described 66.1% of total variance for UHT milk and 66.8% for pasteurized milk.
Figure 4.
Discriminating abilities of the disposable ‘Taste Sensor’ system between fresh. (0 hour) and spoiled (48 hours) milk (a)(b) UHT Milk and (c)(d) Pasteurized Milk.
Figure 4.
Discriminating abilities of the disposable ‘Taste Sensor’ system between fresh. (0 hour) and spoiled (48 hours) milk (a)(b) UHT Milk and (c)(d) Pasteurized Milk.
The plots can be divided into three parts. With increasing storage time, the PCA plots extend from right lower corner through the middle and to the right upper corner of the plots in both the above figures. An interesting observation can be made: the position of the samples (although partly of them are overlap) follow a path that bend upwards with the time order. The ‘freshness maps’ reflect the deterioration process or evolution features of milk quality with time due to microbial growth. The system appeared to be able to distinguish different categories of the ageing process of milk. Rapid evolution of milk quality can be observed in the starting period of storage time due to the distance of the data points, which are quite far from the others. The second data range (6th-26th hour) is less evolving, thus indicating slow variations of milk quality. The last points are taken on the 2nd day when milk was surely spoiled and the points shown are distant from the others.
Figure 5.
‘Score plots’ of a principal component analysis with the second principle component vs the third principle component for fresh-spoiled (a) UHT and (b) pasteurized milk data.
Figure 5.
‘Score plots’ of a principal component analysis with the second principle component vs the third principle component for fresh-spoiled (a) UHT and (b) pasteurized milk data.
Figure 6.
‘Score plots’ of a principal component analysis. First and second principal component correlated with the storage time.(a) UHT Milk and (b) Pasteurized Milk.
Figure 6.
‘Score plots’ of a principal component analysis. First and second principal component correlated with the storage time.(a) UHT Milk and (b) Pasteurized Milk.
Changes in milk quality due to bacterial activities are quite subtle and it occurs well before any physical changes can be noticed and as such, it can be evident that the disposable taste sensor is able to trace the evolution of the quality of milk. As the present work is only a preliminary approach, we propose further research in this direction should be widened in future in order to keep perishable food remains of satisfactory quality for consumer to purchase.
Table 2.
Eigenvalue and percentage variance of the PCA analysis of response data.
Table 2.
Eigenvalue and percentage variance of the PCA analysis of response data.
| UHT Milk | Pasteurized Milk |
| Component | 1 | 2 | 3 | Component | 1 | 2 | 3 |
| Eigenvalue | 4.017 | 1.842 | 1.090 | Eigenvalue | 4.185 | 1.564 | 1.061 |
| % of Variance | 50.207 | 23.026 | 13.628 | % of Variance | 1.564 | 19.548 | 71.855 |
| Cumulative % | 50.207 | 73.233 | 86.861 | Cumulative % | 1.061 | 13.258 | 85.113 |
Conclusion
Primary results presented in this paper show the utility of the disposable taste sensor system for testing and monitoring the quality of milk for human consumption. The PCA method permits a good classification between the fresh and spoiled milk. In the case of monitoring the milk quality when it is stored at room temperature, the disposable taste sensor system together with pattern recognition technique, PCA is able to show a characteristic development of the milk quality dependent on storage time. In conclusion, the system described may be of great use in the dairy industry. However the field of applications may further be widened and thus, it might become a challenging promise for the food and beverage industry.


