In-situ LIF Analysis of Biological and Petroleum-based Hydraulic Oils on Soil

University of Potsdam, Institute of Chemistry, Karl-Liebknecht-Str. 24-25, D-14476 Potsdam-Golm, Germany
*
Author to whom correspondence should be addressed.
Sensors 2005, 5(1), 61-69; https://doi.org/10.3390/s5010061
Submission received: 2 September 2004
/
Accepted: 20 December 2004
/
Published: 28 February 2005
(This article belongs to the Special Issue Sensors for Environmental Monitoring)
Abstract
:Absorption and fluorescence properties of 4 hydraulic oils (3 biological and 1 petroleum-based) were investigated. In-situ LIF (laser-induced fluorescence) analysis of the oils on a brown sandy loam soil was performed. With calibration, quantitative detection was achieved. Estimated limits of detection were below ca. 500 mg/kg for the petroleum-based oil and ca. 2000 mg/kg for one biological oil. A semi-quantitative classification scheme is proposed for monitoring of the biological oils. This approach was applied to investigate the migration of a biological oil in soil-containing compartments, namely a soil column and a soil bed.
Introduction
Due to the limitation of petroleum resources and to potential environmental risks arising from the usage of petroleum products there is a strong interest to substitute petroleum-based lubricants, oils and fuels by renewable and better biodegradable products. Properties, environmental benefits and risk assessment of so-called green lubricants, often also referred to as oleochemical or vegetable-based lubricants, have been discussed [1-3]. For Germany, the following numbers may be illustrating [1]: In the year 1998, about 1 million tons of lubricants were sold, ca. 150,000 tons among these were hydraulic oils (ca. 100,000 tons for stationary, 50,000 tons for mobile devices, [4]). It is believed that about 50%, i.e. ca. 500,000 tons of lubricants, entered the environment as pollutants [5]. As an estimate, only 2.5% of the lubricants are considered to be of biological origin [1]. In the last years much effort has been undertaken to replace petroleum products as constituents of hydraulic oils. The German federal environmental agency (Umweltbundesamt UBA, Berlin) has awarded readily biodegradable hydraulic oil products. Nevertheless, most hydraulic oil products still contain petroleum product constituents. Today, biological hydraulic oils are composed of the following types of basic liquids: Unsaturated (native) esters (rape seed oil, sunflower oil, etc.), unsaturated, synthetic ethers (trimethylolpropane-, TMP-oleates, etc.), saturated synthetic esters (dicarbonic acid esters, etc.), polyglycoles, and other basic fluids (petroleum product-based, polyalpha-olefines (PAO), etc.).
Over the last decades, laser-induced fluorescence (LIF) spectroscopy has been employed and continuously been improved as powerful analytical tool for the analysis of petroleum products in the environment [6-8]. A particular advantage of LIF spectroscopy is the potential for on-site, in-situ and sub-surface characterization of contaminated waters and soils. Oil fluorescence properties such as spectral signature, intensity and decay time, can be used to identify and to quantify oils in the environment. In the following, we will demonstrate the application of LIF spectroscopy to characterize biological and petroleum-based oils, and to monitor the migration of a biological oil in soil-containing compartments, namely a soil column and a soil bed. This work is thus part of our attempt to employ laser-based techniques for environmental analysis and to make progress from laboratory to field applications ([9-11, 15] and literature cited therein).
Experimental
The following oils were investigated: Oil 1 (Plantohyd 40N, Fuchs, Mannheim, Germany, yellow liquid) and oil 2 (Bio Hy Gard, John Deere, Bruchsal, Germany, reddish orange liquid) contain natural esters from vegetable oils, oil 3 (ECONA E46, DEA, Hamburg, Germany, yellow liquid) contains ethers synthesized from vegetable oil precursors, whereas oil 4 (J 20 C, John Deere, Bruchsal, Germany, brownish yellow liquid) is a conventional petroleum product.
A mobile LIF spectrometer was obtained from Optimare GmbH (Wilhelmshaven, Germany). This device, called OPTIMOS (oil pollution transportable independent monitoring system), has been described in detail [15]. Briefly, it includes a flash lamp-pumped Nd:YAG-laser (pulse duration ca. 10 ns) as excitation source and an intensified CCD camera (1024×128 pixels, minimum gate width less than 5 ns) in combination with a spectrograph as detection system (typical spectral resolution ca. 3 – 5 nm). For the measurements, the OPTIMOS was operated at λexc=266 nm (typical pulse energy 500 μJ) or 355 nm (5 mJ) using cut-off filters (WG 295 or GG 385 Schott/ITOS, Mainz, Germany), respectively, to reduce backscattered excitation light. Background correction (CCD noise) was achieved by subtracting the signal of a dark measurement. LIF measurements from soil surfaces were performed using a simple sensor head with bifurcated fiber bundles (quartz fibers with ca. 100 μm diameter for excitation and detection) connected to a plain circular metal plate. This resulted in an anti-parallel orientation of excitation and emission optical paths (180°-geometry). Towards the soil surfaces, the fiber was protected by a quartz glass window of 3 mm thickness. For earlier investigations a demo-setup using a N2-laser as the excitation light source (λexc = 337 nm) was used [15].
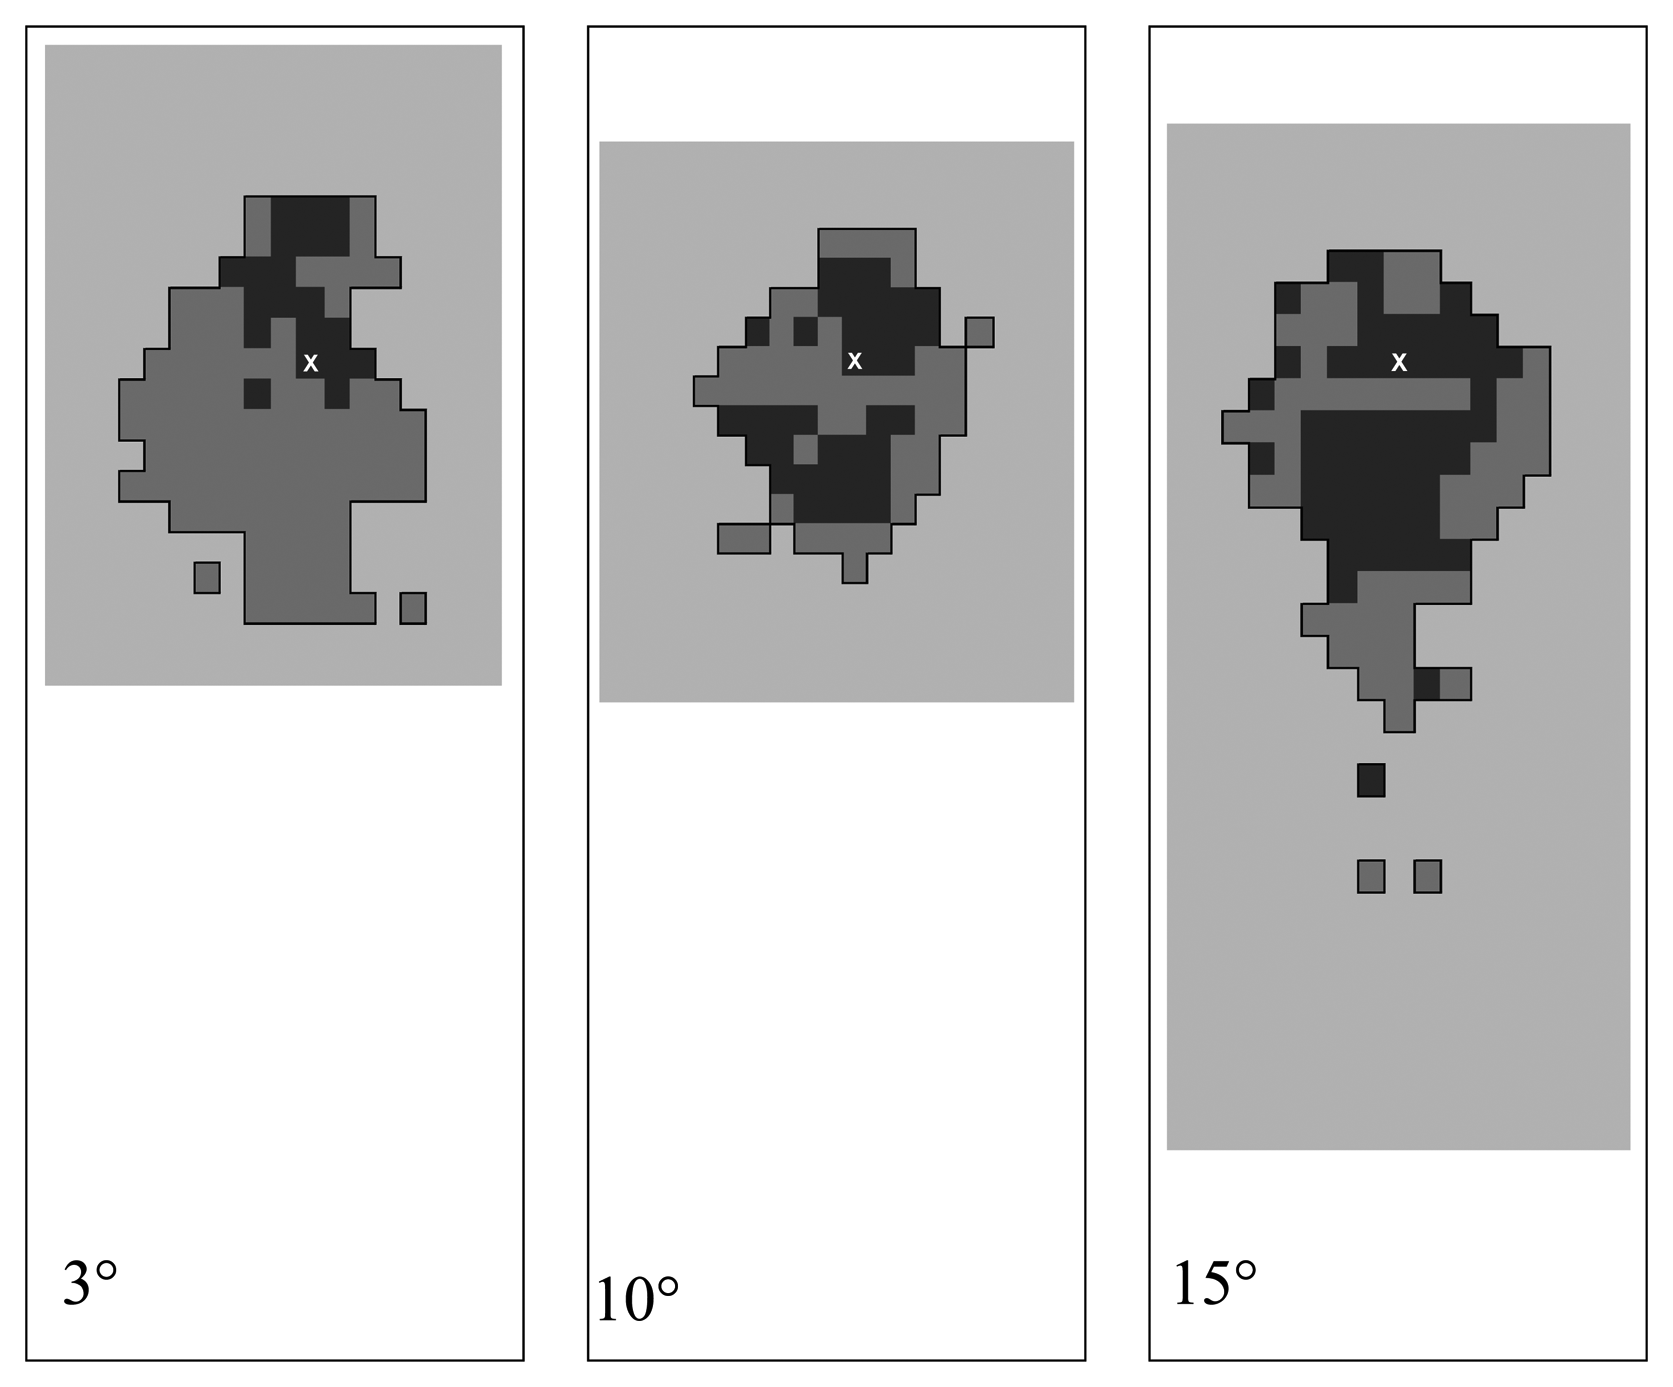
As model soil, an air-dry brown sandy loam from the site of the Federal Agricultural Research Center (FAL) in Braunschweig, Germany, was used. Soil columns were packed by FAL staff in plexiglass tubes, typically with 100 mm inner diameter, 3 mm wall thickness. As soil bed, turfs of natural soil with grassy vegetation were sampled at the FAL site and placed upon sandy loam in a frame (size 180 × 180 cm size), in which the grass was grown. To monitor oil migration, for each investigation 1 l of oil 2 was added with a funnel at the top of the soil column and at different positions of the soil bed. For the latter, three angles of inclination were chosen (3°, 10°, 15°, with respect to the earth surface). For each measurement approximately 100 locations were scanned using LIF spectroscopy.
Absorption and fluorescence spectra of neat and diluted oils were recorded on a Lambda 2 photometer and LS 50 luminescence spectrometer (both Perkin-Elmer, Überlingen, Germany), respectively (typical spectral resolutions ca. 1 – 3 nm). All solvents used in the study were of analytical reagent grade. For the preparation of oil-spiked soil samples, a solution of the oils in n-pentane was added to the soil. After mixing using a spade, the samples were placed on a shaking tablett and n-pentane was evaporated in the fume cabin by skaking for three hours. The samples were analyzed immediately upon preparation. Limits of detection (LOD) were calculated by division of the threefold standard deviation of five measurements of the uncontaminated sandy loam by the slope of the calibration line.
Results and discussion
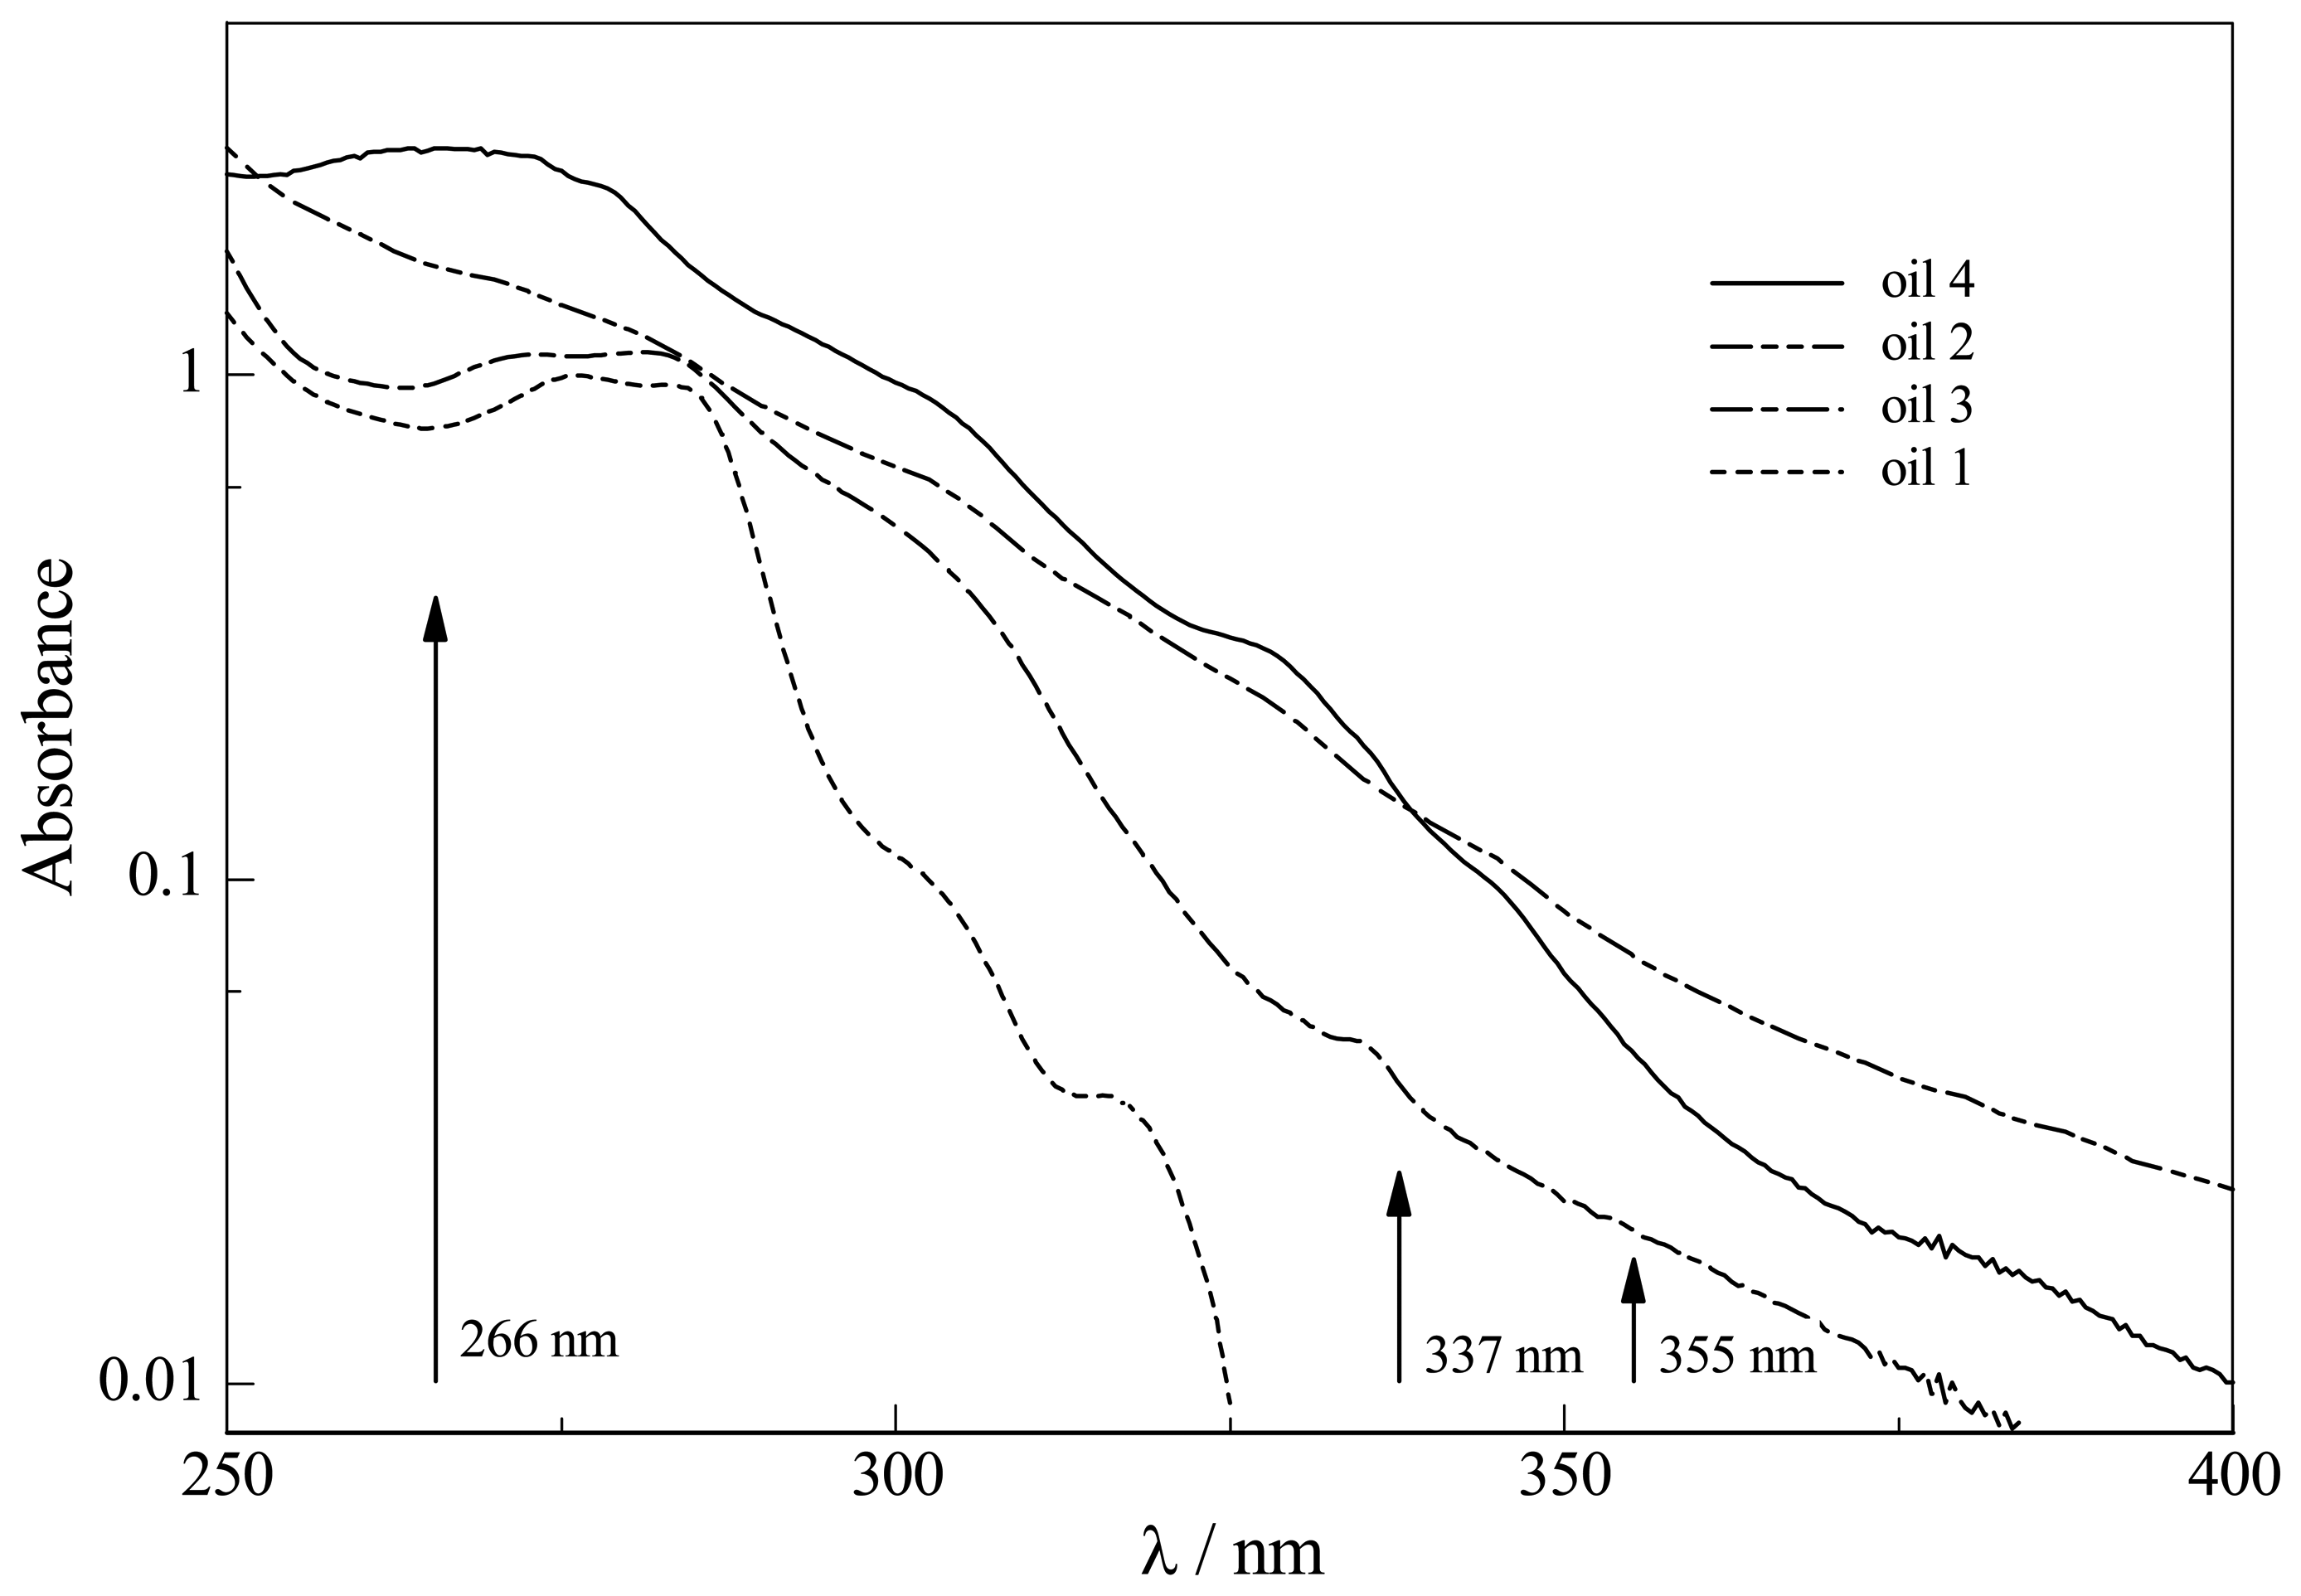
The absorption spectra of the oils are characterized by a continuous increase from the red to strong absorbances in the UV spectral region. Absorption onsets of diluted oils were concentration dependent and were found, for example, in the 350 to 400 nm region for a dilution of 5 g/L oil in cyclohexane (Figure 1). In the semi-logarithmic representation, the oils showed long-wavelength absorption tails with almost linear behavior. In Figure 1, this is most pronounced for oil 2. Such a behavior, which has also been found for crude oils, asphaltenes, humic substances, etc., has been interpreted in terms of the so-called Urbach phenomenology [12-15].
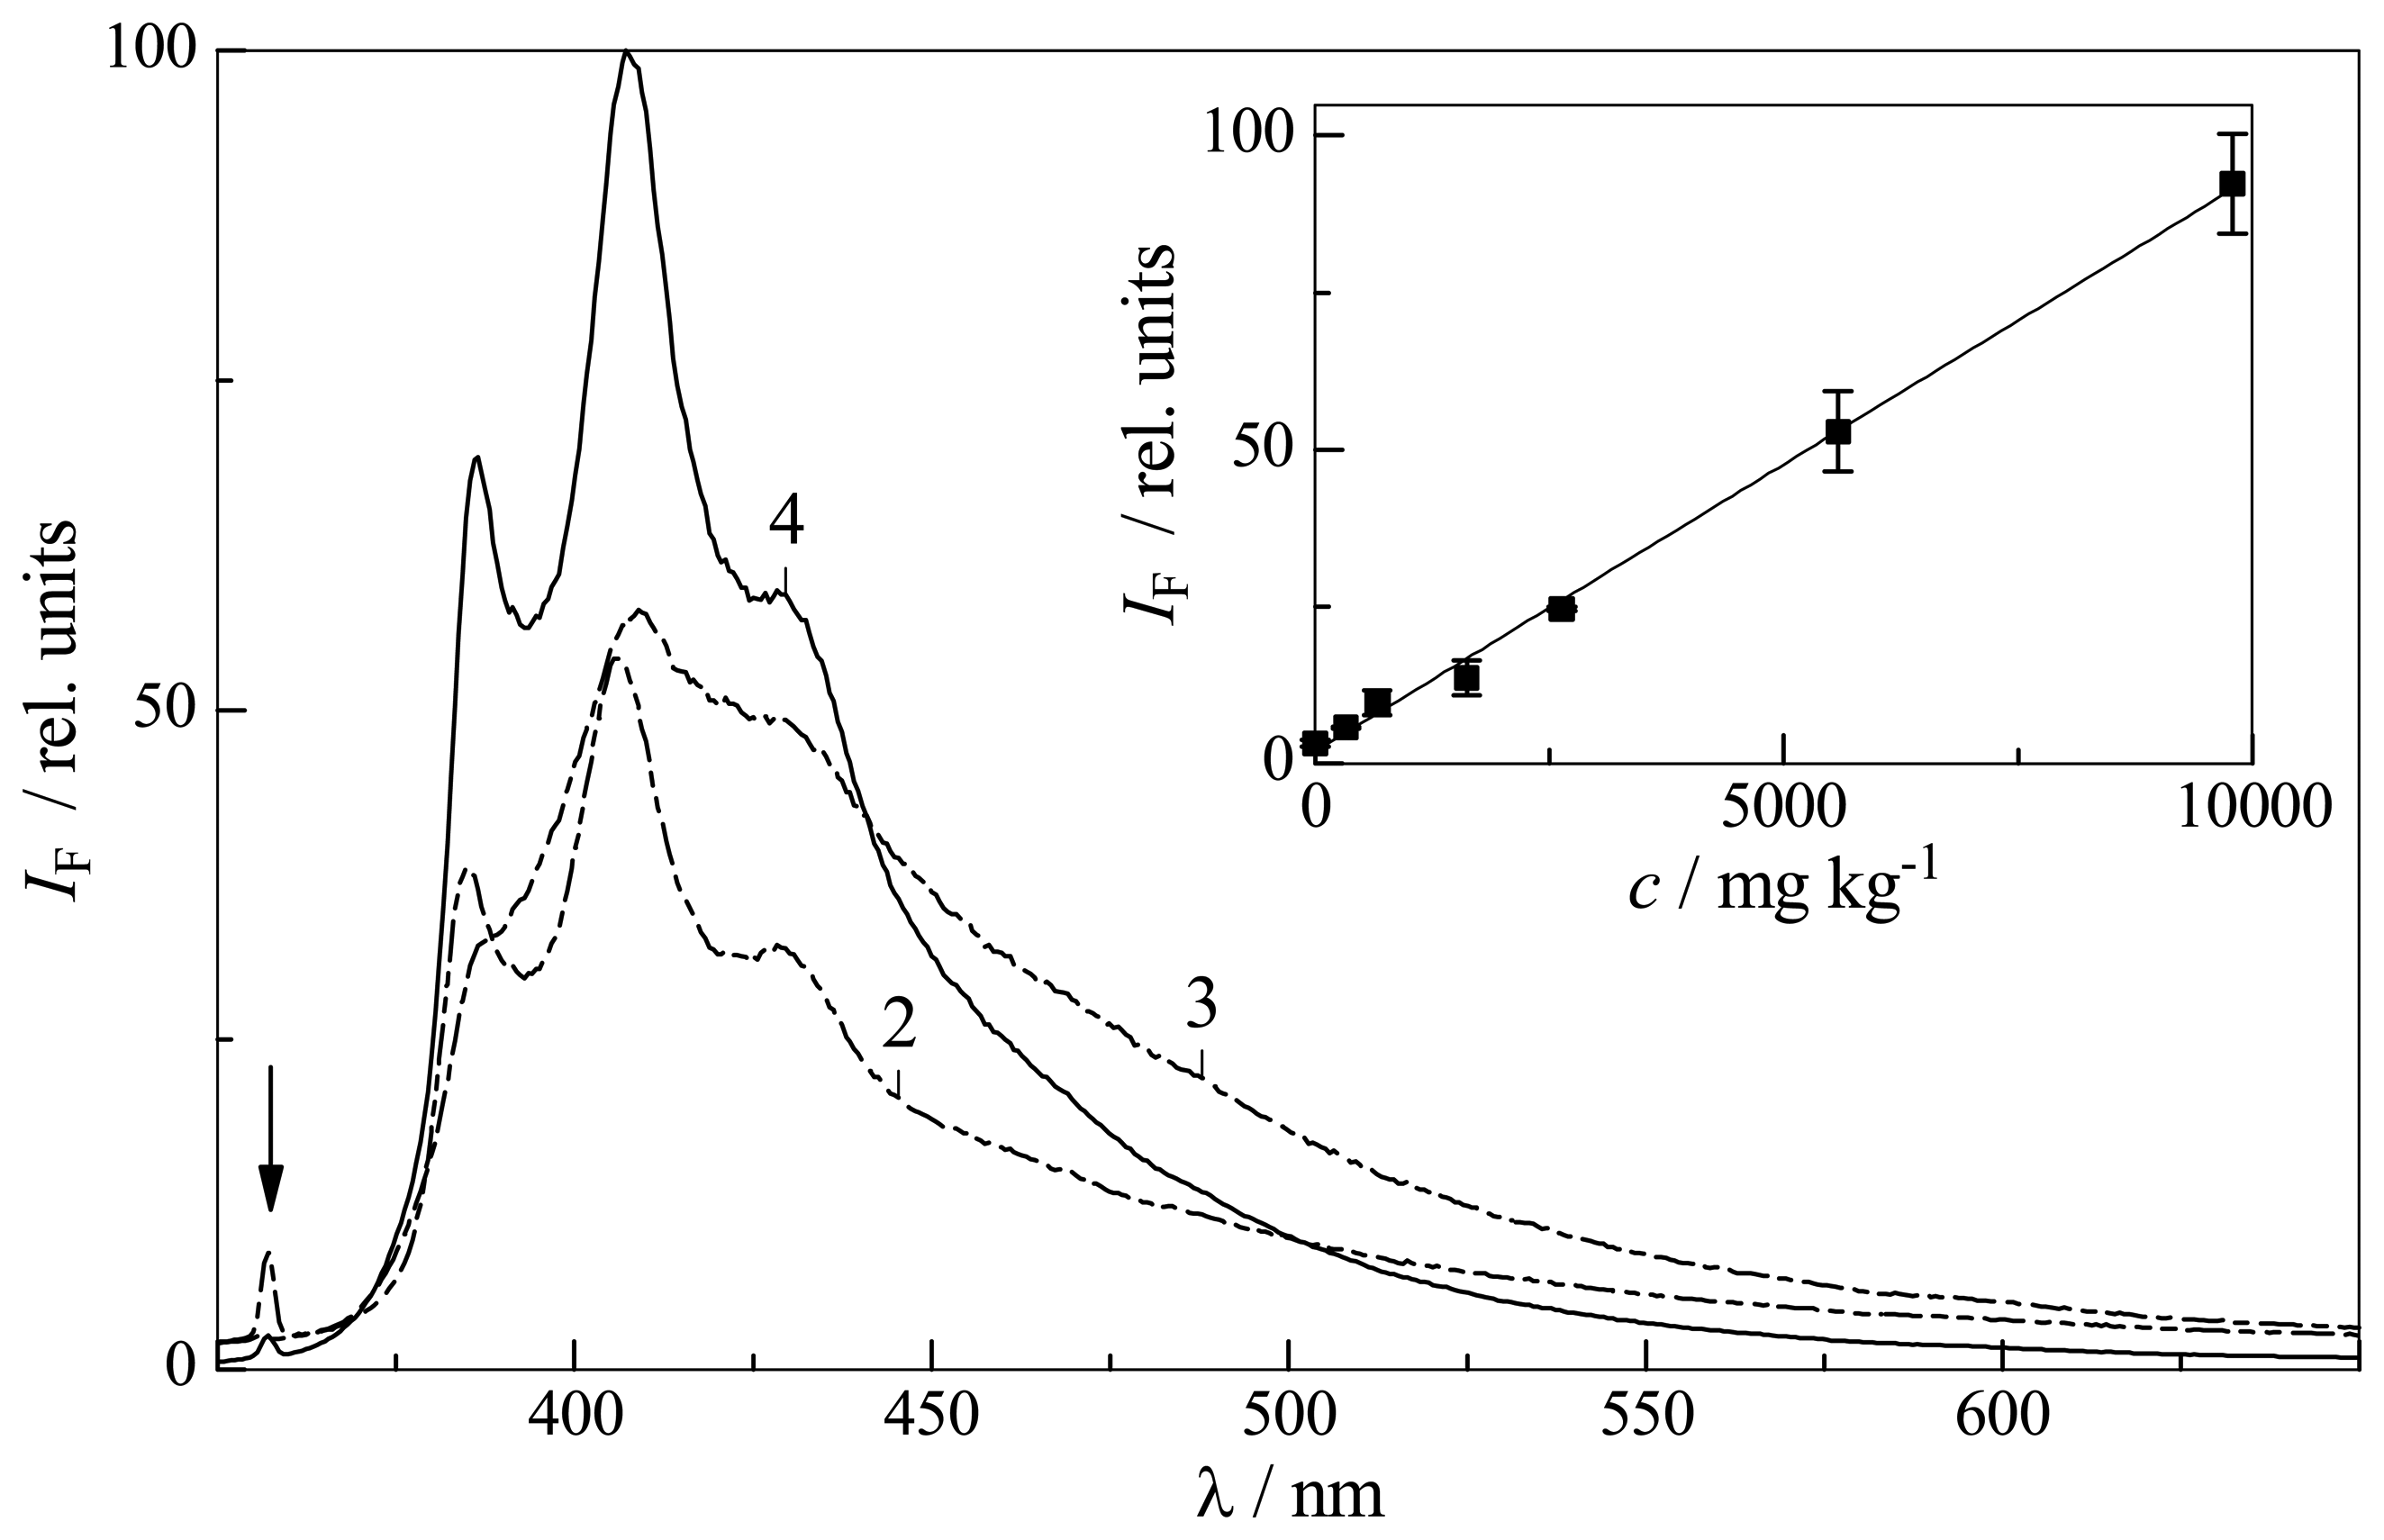
Under laser irradiation the neat (i.e., undiluted) oils under investigation showed distinct native fluorescence. As examples, LIF spectra (fluorescence intensity IF vs. wavelength λ) obtained with 355 and 266 nm excitation are shown in Figures 2 and 3.
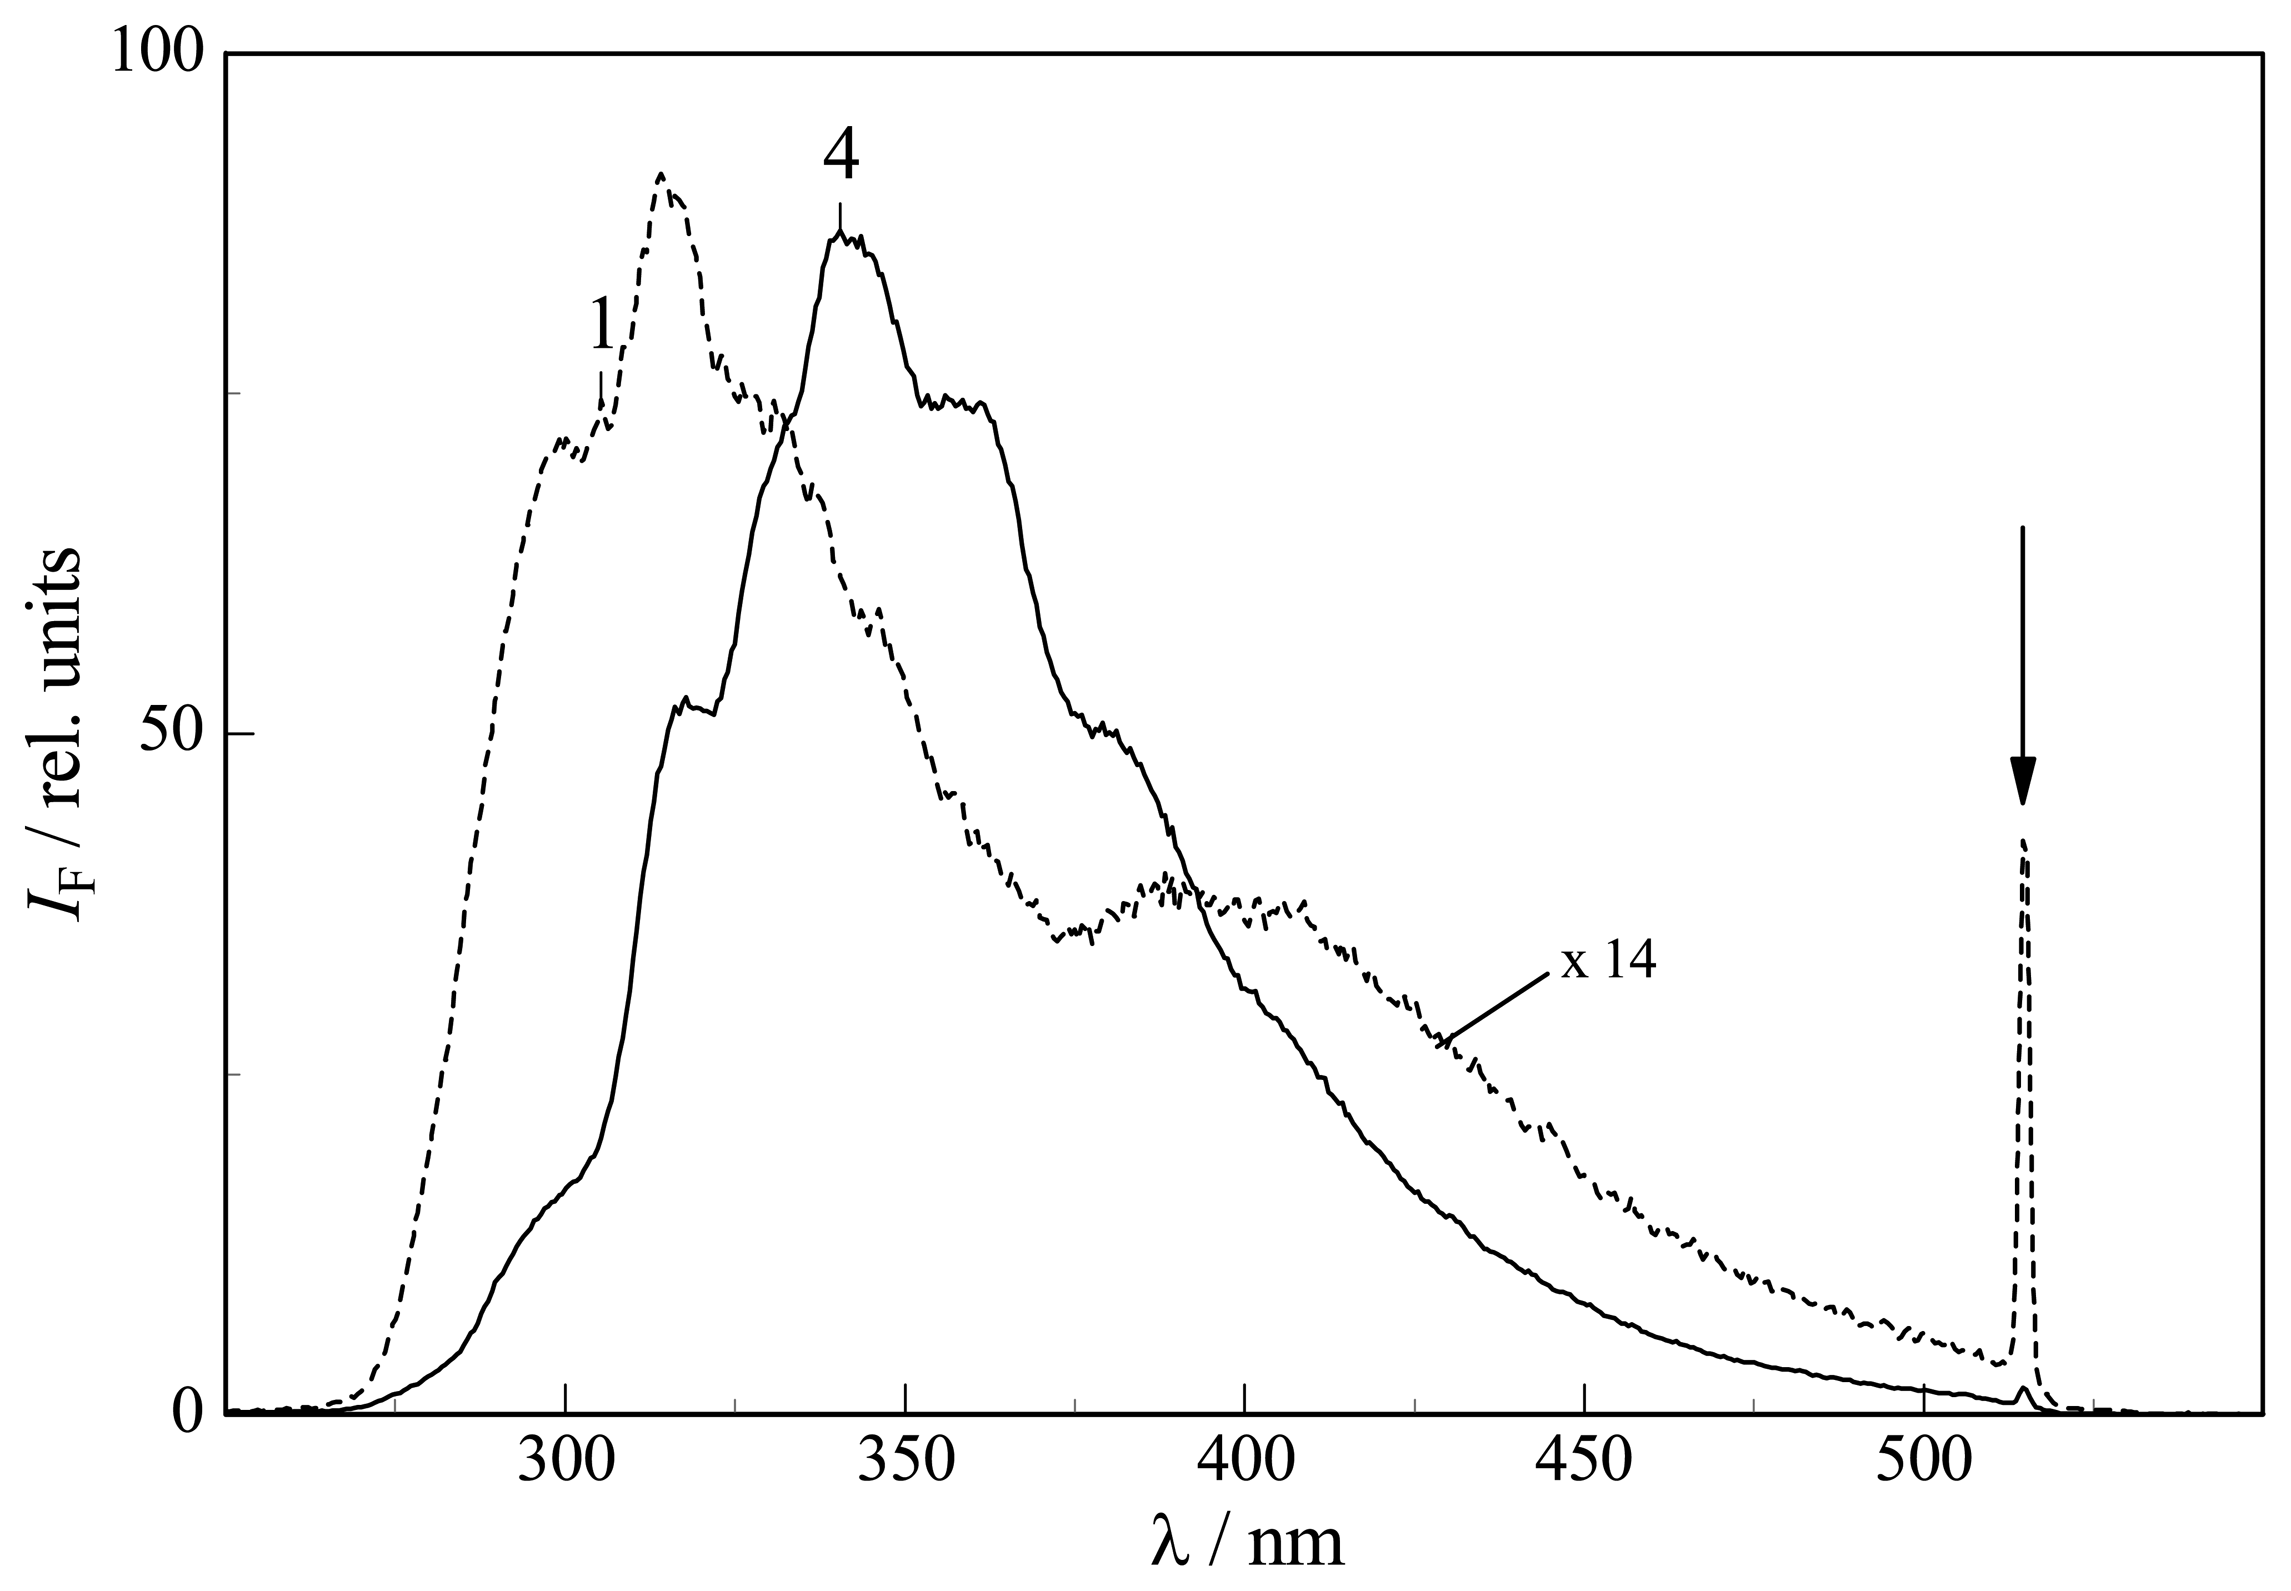
Usually, LIF spectra of oil products are featureless with single broad maxima in the 350 to 500 nm spectral region. It is therefore noteworthy that the oils 1 – 4 exhibited more structured emissions, displaying between 300 and 430 nm partly resolved minima and maxima and some clearly discernible shoulders. Since we do not precisely know origin, processing and composition of the commercial oil products, the fluorescence spectra obtained cannot be related to fluorophoric oil components. Rather, the overall signals are taken as spectral signatures characteristic for the neat oils. Closer inspection of the spectra in Figure 2 allows the following observations: (i) The fluorescence appearance of the biological oils 2 and 3 clearly resembles that of the petroleum-based oil 4. This may be due to identical or at least similar additives present in the oils. (ii) The fluorescence spectra strongly depend on excitation wavelength. Oil 1, which showed no fluorescence under 337 and 355 nm excitation due to the negligible absorption, can conveniently be excited at 266 nm (cf. Figure 3). Also the fluorescence onsets correlate with excitation wavelengths, as illustrated by comparison of oil 4 fluorescence signals in Figure 2 (λexc=355 nm, onset at ca. 375 nm) and Figure 3 (λexc=266 nm, onset ca. 275 nm). (iii) Quantitatively, the fluorescence efficiencies, as measured by the integrated LIF spectra, of the oils vary considerably. E.g., for excitation at 266 nm, where the oil absorbances are expected to be similar (cf. Figure 1), the overall fluorescence of oil 1 is more than one order of magnitude below that of oil 4 (Figure 3). This is in accordance with our earlier finding that, for a given excitation wavelength, fluorescence efficiencies of neat (petroleum-based) oils can be strongly different [15]. Also, there is a clear indication that biological oils are less fluorescent than petroleum-based oils.
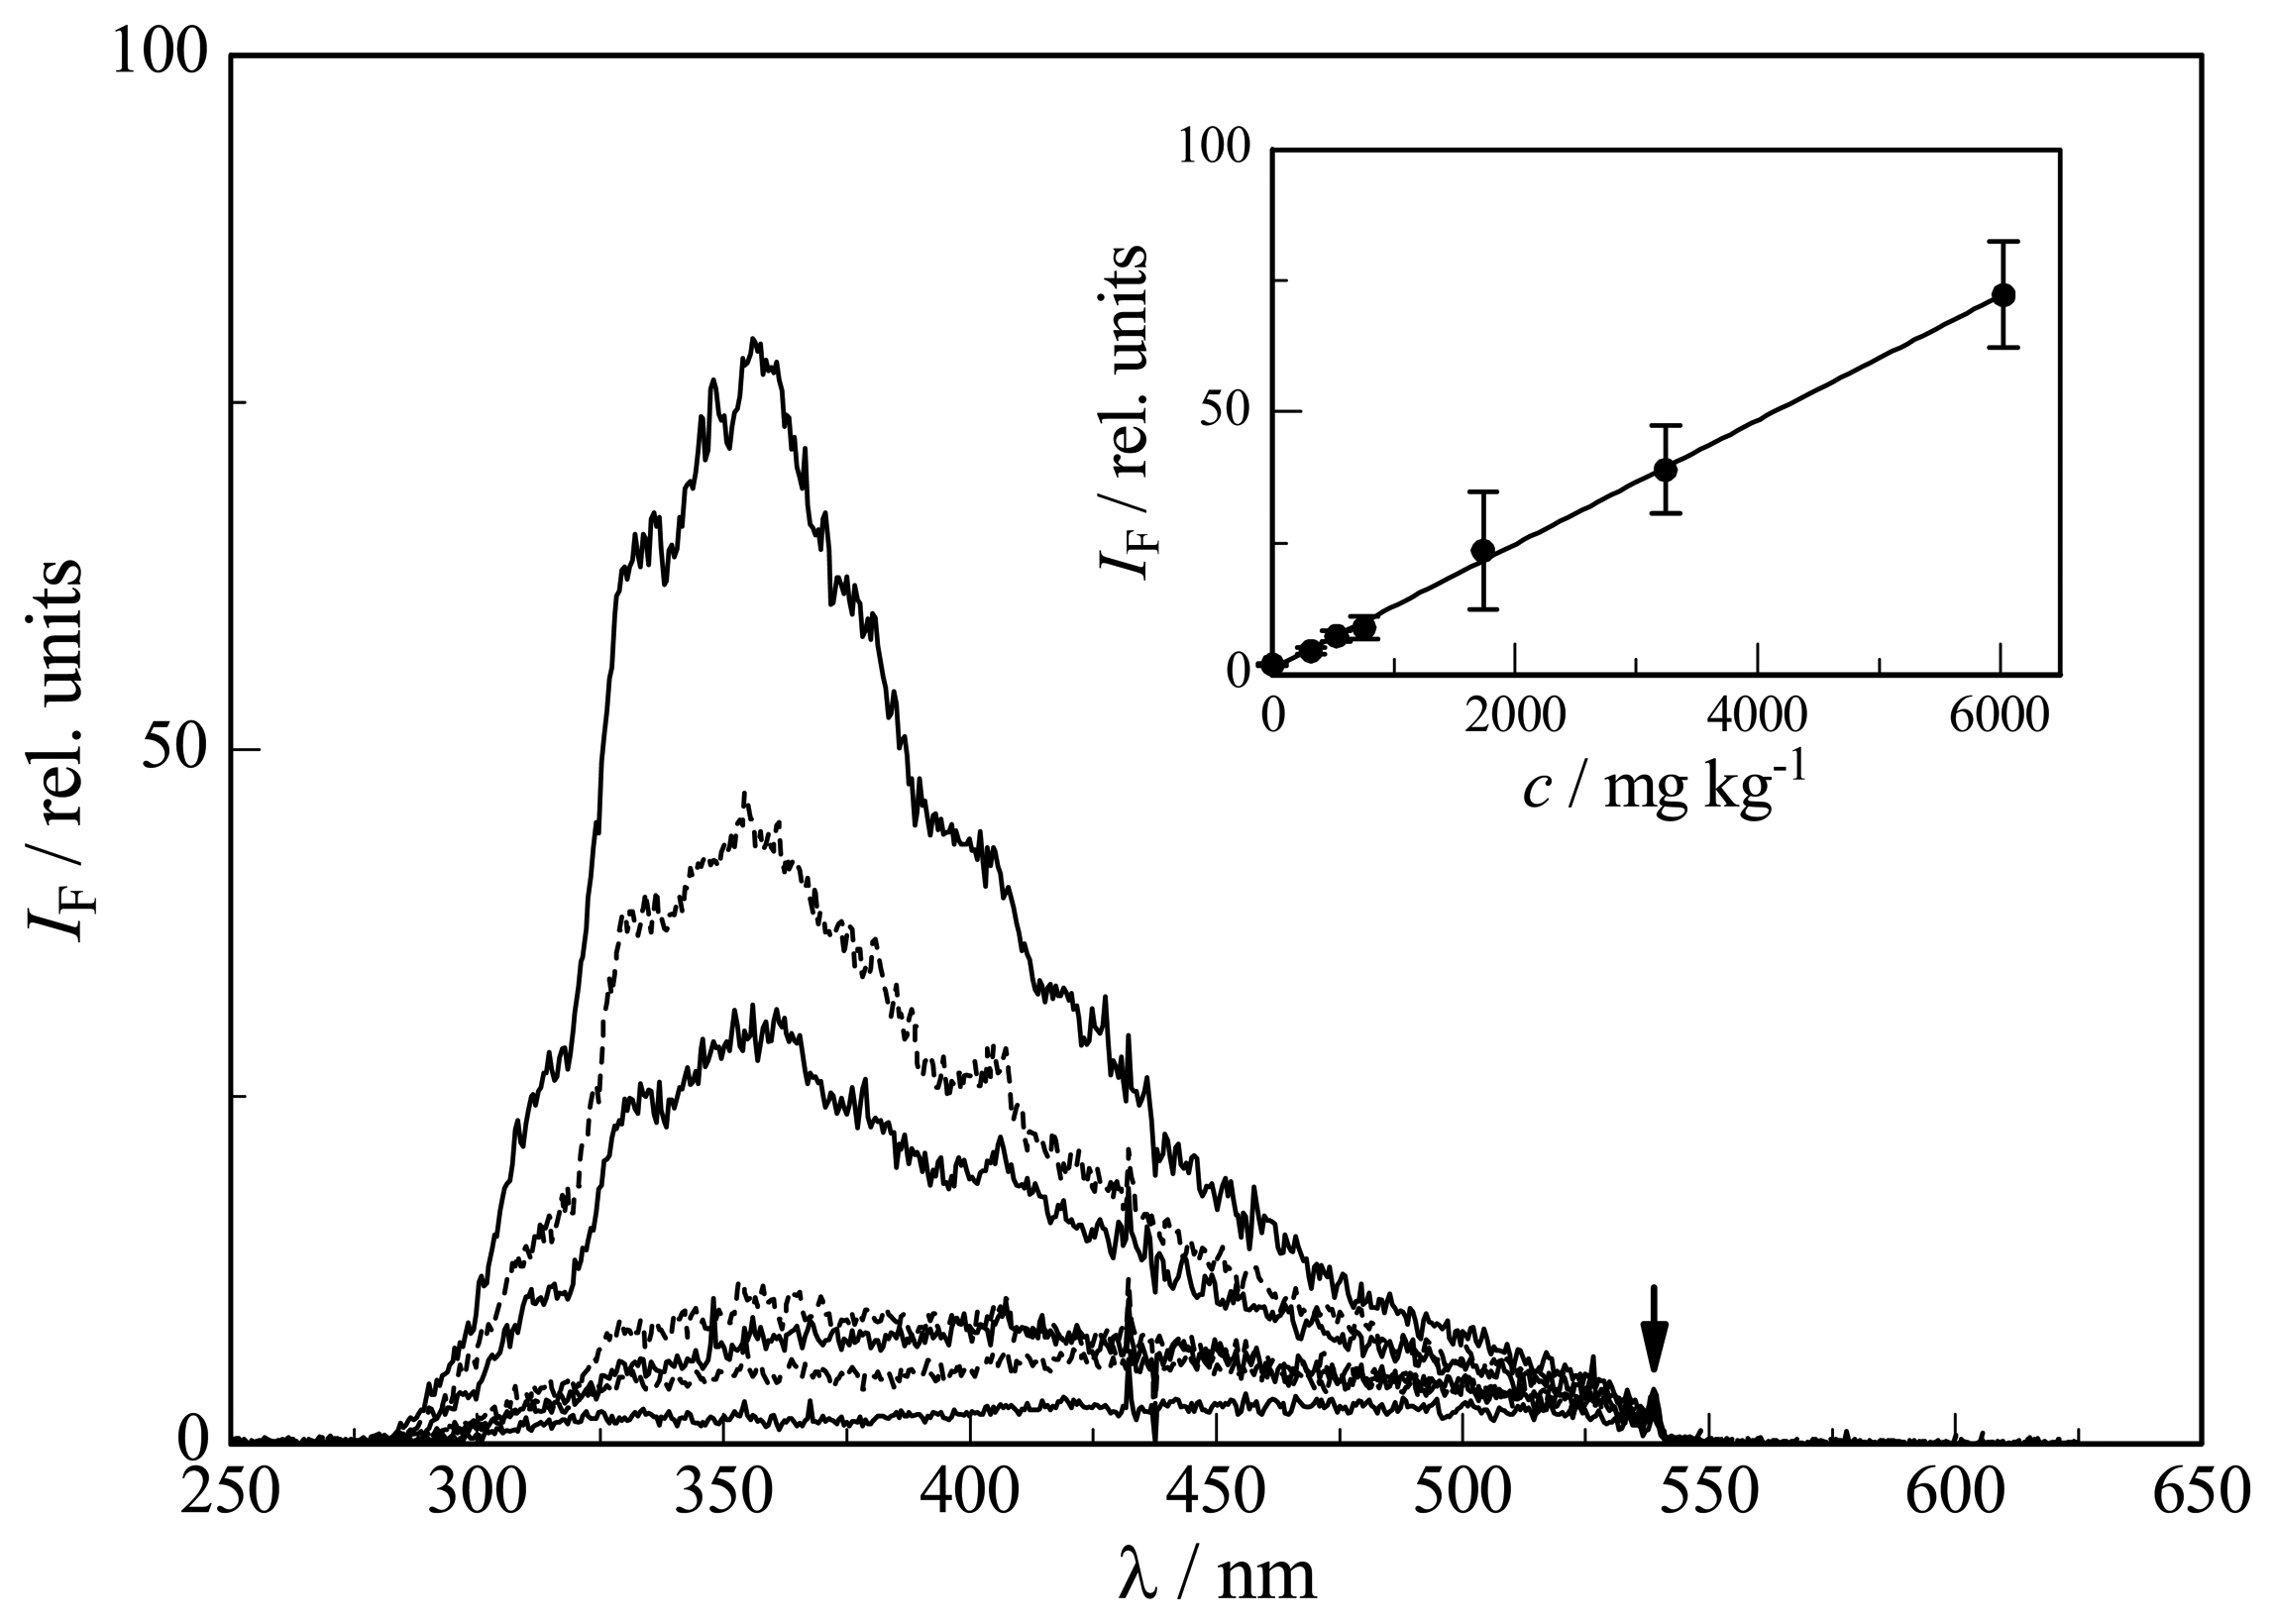
Natural soils are strongly light scattering and usually also strongly light absorbing media of very heterogeneous nature. In comparison to solution phase investigations, LIF analysis of oils directly from soil surfaces is therefore much more difficult. Shown in Figure 4 are LIF spectra of oil 4 in a concentration range of c = 300 – 6.000 mg/kg on the brown soil (sandy loam) and the background signal from the undoped soil (blank).
The reduced quality of the fluorescence signals obtained is the price paid for in-situ soil investigation, i.e. an analysis without prior separation of analyte (oil) and matrix (soil). Despite somewhat reduced signal-to-noise ratio, the LIF signal intensities were clearly suitable for quantification of the oil content. This is illustrated by the calibration plot showing a linear relationship between IF and c (inset of Figure 4). The limit of detection for oil 4 on the typical German soil are estimated to be below 500 mg/kg, which meets the requirements of typical regulatory values for petroleum-based oils as given for instance by the so-called Dutch list [16]. This list gives two values for petroleum product contaminations of soils: A reference concentration (R value) of 1,000 mg/kg above which additional investigations of the soils are recommended, and an intervention concentration (I value) of 5,000 mg/kg above which soil remediation is proposed. Thus, with appropriate calibration, in-situ LIF analysis of soils contaminated with petroleum-based oils can be performed quantitatively (even, as first approximation, without consideration of soil optical properties [15]). Given their significantly lower fluorescence efficiencies it was found that such a procedure is not very useful for biological oils. For example, the detection limit for oil 2 on the sandy loam is estimated to be around 2000 mg/kg (inset of Figure 2). More precise limits of detection are therefore not given for oils 1 – 3. In the following we will instead propose an alternative approach.
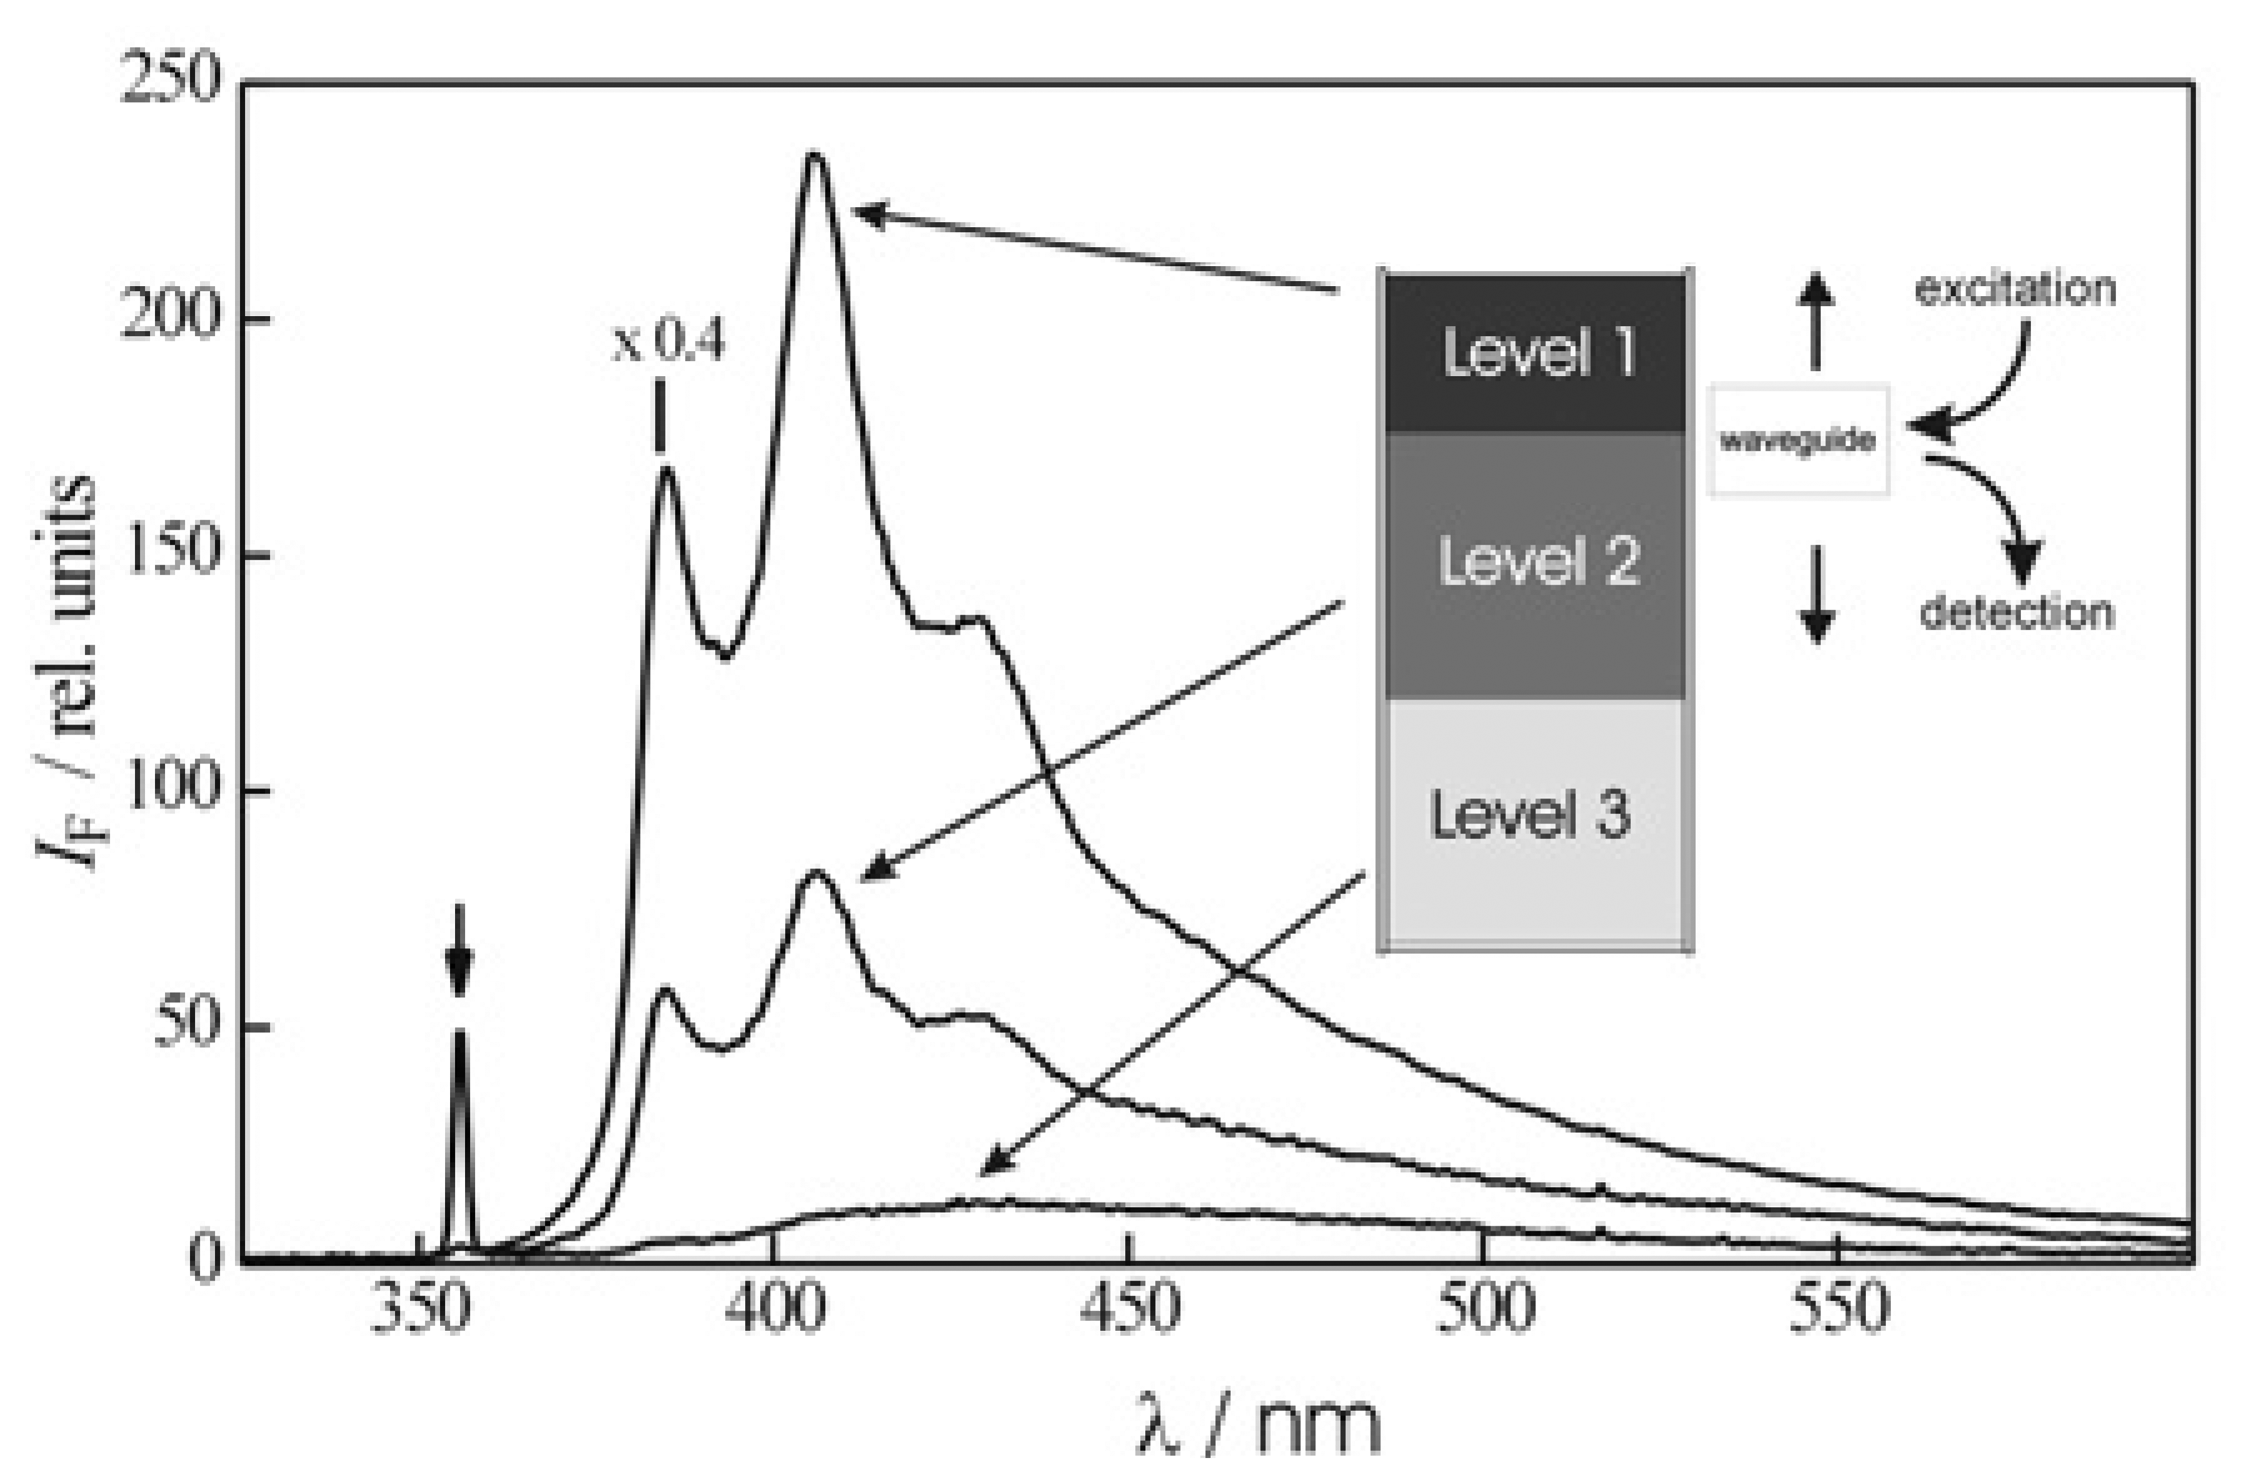
For environmental monitoring and screening purposes it is often sufficient to infer the presence of an analyte with a classification scheme. Better than the most simple detect/non-detect scheme is e.g., a three-level classification with the following regimes: Below threshold (non-detect, level 3), intermediate concentrations (level 2), and excess concentration (level 1), e.g. in neat or saturated oil zones. We have taken this approach to study and visualize the migration of oils in soil-containing compartments, namely a soil column and a grass-covered soil bed. As example, Figure 5 shows LIF spectra of oil 2 which has migrated down the soil column.
In this example of a semi-quantitative application, various concentration levels are assigned to LIF spectra on the basis of spectral features and fluorescence intensities. Level 1 corresponds to the LIF signal of the pure oil phase, exemplified in Figure 5 by the upper trace with a maximum relative IF signal of ca. 600. Level 2 is characterized by significantly lower LIF signals, albeit with clearly discernible spectral signature of oil fluorescence. This is exemplified by the middle trace with a maximum relative IF signal of ca. 80 and corresponds to the soil zone which is less than oil-saturated. At level 3 below that (compare lowest trace in Figure 5 with a maximum relative IF signal of ca. 12), signals were recorded which did not display these spectral signatures. This can be signals from the soil background or slightly above. Figure 6 gives an example of an imaging application of LIF spectroscopy for oil 2 migrating down the grass-covered soil bed for different angles of inclination (3°, 10°, 15°).
As described above, IF signal intensities and and oil levels have been assigned by a triple grey code: Dark areas represent oil-saturated zones (level 1), middle grey regions are below oil saturation, and the light grey regions reflects background signals. From Figure 6, it is clearly visible that the higher angle of inclination leads to increased oil mobility on the grassy surface.
Conclusions
In comparison to the petroleum-based oil, the biological oils under investigation exhibited significantly reduced fluorescence efficiencies. Instead of a calibration-based quantitative analysis, as suitable for petroleum-based oils, a three-level classification scheme is proposed for the semi-quantitative in-situ analysis of biological oils in soil containing compartments. As example, oil migration in soil-column and soil bed was addressed. Future work is necessary to improve the in-situ detection of biological oils and to elucidate their transport behavior more comprehensively.
Acknowledgments
This work was performed in co-operation with the Bundesforschungsanstalt für Landwirtschaft (Braunschweig, Germany). It is a pleasure to thank Wolfgang Paul and Christine Schütt for the fruitful collaboration and the Fachagentur Nachwachsende Rohstoffe (Gülzow, Germany) for financial support.
References
- Willing, A. Lubricants based on renewable resources - an environmentally compatible alternative to mineral oil products. Chemosphere 2001, 43, 89. [Google Scholar]
- Boyde, S. Green lubricants. Environmental benefits and impacts of lubrication. Green Chemistry 2002, 4, 293. [Google Scholar]
- Maleque, M.A.; Masjuki, H.H.; Sapuan, S.M. Vegetable-based biodegradable lubricating oil additives. Industr. Lubr. Tribol. 2003, 55, 137. [Google Scholar]
- Heine, C. Bioschmierstoffe in der kommunalen Praxis; Gülzower Fachgespräche, Hamm 26. Mai. 1999, Fachtagung lokale Agenda 21, Fachagentur nachwachsende Rohstoffe e.V., 1999; p. 78. [Google Scholar]
- www.Pflanzenoelinitiative.de/English/inhalt.htm (access Sept. 17, 2003).
- Balshaw-Biddle, K.; Oubre, C.L.; Ward, C.H. (Eds.) Subsurface monitoring using laser fluorescence; Lewis Publishers: Boca Raton, FL, 2000.
- Lieberman, S.H.; Knowles, D.S. Cone penetrometer deployable in situ video microscope for characterizing sub-surface soil properties. Field Anal. Chem. Technol. 1998, 2, 127. [Google Scholar]
- Quinn, M.F.; Alemeddine, O.; Al-Awadi, E.; Mukhopadhyay, A.; Qabazard, A.M.; Al-Rasheedi, M.; Ismail, A.J. The application of laser-induced fluorescence techniques for the measurement of hydrocarbons in the groundwater of Kuwait. Instr. Science Technol. 2002, 30, 79. [Google Scholar]
- Löhmannsröben, H.-G.; Roch, Th.; Schultze, R.H. Laser-induced fluorescence (LIF) spectroscopy for in situ analysis of petroleum products and biological oils in soils. Polycyclic Aromatic Compounds 1999, 3, 165. [Google Scholar]
- Löhmannsröben, H.-G.; Roch, Th. In situ laser-induced fluorescence (LIF) analysis of petroleum product-contaminated soil samples. J. Environ. Monit. 2000, 2, 17. [Google Scholar]
- Fernandez-Trujillo, R.; Hengstermann, T.; Lemke, M.; Löhmannsröben, H.-G.; Schober, L.; Schultze, R.H. Field screening Europe 2001; Breh, W., et al., Eds.; Kluwer Academic Publishers: Dordrecht, Boston, 2002; Volume 145. [Google Scholar]
- Mullins, O.C.; Zhu, Y. First observation of the Urbach tail in a multicomponent organic system. Appl. Spec. 1992, 46, 354. [Google Scholar]
- Mullins, O.C.; Mitra-Kirtley, S.; Zhu, Y. The electronic absorption edge of petroleum. Appl. Spec. 1992, 46, 1401. [Google Scholar]
- Illenseer, C.; Löhmannsröben, H.-G.; Schultze, R.H. Application of laser-based ion-mobility (IM) spectrometry for the analysis of polycyclic aromatic compounds (PAC) and petroleum products in soils. J. Environ. Monit. 2003, 5, 780. [Google Scholar]
- Schultze, R.H.; Lemke, M.; Löhmannsröben, H.-G. Laser in environmental and life sciences; Hering, P., Lay, J.P., Stry, S., Eds.; Springer: Berlin, 2004; p. 79. [Google Scholar]
- Rosenkranz, D.; Einsele, G.; Harreß, H.-M. Bodenschutz.; E. Schmidt: Berlin, chapter 8935; vol. 2, pp. p. 1–27, and chapter 8936, vol. 2, 1; 1995. [Google Scholar]
Figure 1.
Absorption spectra (semi-logarithmic representation) of the hydraulic oils in cyclohexane solution (5 g/L, 1 cm optical path length). Arrows denote the laser excitation wavelengths employed.
Figure 1.
Absorption spectra (semi-logarithmic representation) of the hydraulic oils in cyclohexane solution (5 g/L, 1 cm optical path length). Arrows denote the laser excitation wavelengths employed.

Figure 2.
Fluorescence spectra of the neat hydraulic oils (λexc=355 nm). The arrow marks a spectral feature originating from laser stray light. For oil 2 maxima can be assigned at 386, 407 and 429 nm. The location of the fluorescence onset at ca. 375 nm and of the first peak at 386 nm might be influenced by the cut-off filter. The inset shows calibration data for oil 2 on the brown soil (λexc=266 nm).

Figure 3.
LIF spectra of neat oil product 1 and 4 (λexc= 266 nm, arrow marks stray light). The location of the fluorescence onsets might be influenced by the cut-off filters.
Figure 3.
LIF spectra of neat oil product 1 and 4 (λexc= 266 nm, arrow marks stray light). The location of the fluorescence onsets might be influenced by the cut-off filters.

Figure 4.
LIF spectra of hydraulic oil 4 on the brown soil (λexc = 266 nm, arrow marks stray light). The inset shows calibration data for two independently spiked soil series (λexc = 266 nm, IF values obtained from integrated spectra).
Figure 4.
LIF spectra of hydraulic oil 4 on the brown soil (λexc = 266 nm, arrow marks stray light). The inset shows calibration data for two independently spiked soil series (λexc = 266 nm, IF values obtained from integrated spectra).

Figure 5.
LIF spectra of hydraulic oil 2 on a column packed with a sandy loam.

Figure 6.
LIF spectroscopy for in situ profiling of spreading hydraulic oil 2 on a grass covered soil surface. The “X” denotes the point were the oil was added.
Figure 6.
LIF spectroscopy for in situ profiling of spreading hydraulic oil 2 on a grass covered soil surface. The “X” denotes the point were the oil was added.

© 2005 by MDPI ( http://www.mdpi.org). Reproduction is permitted for non-commercial purposes.
Share and Cite
MDPI and ACS Style
Lemke, M.; Fernández-Trujillo, R.; Löhmannsröbenc, H.-G. In-situ LIF Analysis of Biological and Petroleum-based Hydraulic Oils on Soil. Sensors 2005, 5, 61-69. https://doi.org/10.3390/s5010061
AMA Style
Lemke M, Fernández-Trujillo R, Löhmannsröbenc H-G. In-situ LIF Analysis of Biological and Petroleum-based Hydraulic Oils on Soil. Sensors. 2005; 5(1):61-69. https://doi.org/10.3390/s5010061
Chicago/Turabian StyleLemke, Matthias, Rebeca Fernández-Trujillo, and Hans-Gerd Löhmannsröbenc. 2005. "In-situ LIF Analysis of Biological and Petroleum-based Hydraulic Oils on Soil" Sensors 5, no. 1: 61-69. https://doi.org/10.3390/s5010061