Article

Response Behaviour of a Hydrogen Sensor Based on IonicConducting Polymer-metal Interfaces Prepared by the ChemicalReduction Method

Chair for Sensors and Solid State Ionics, Faculty of Engineering, Christian Albrechts University, Kaiserstraße 2, D-24143 Kiel, Germany
*
Authors to whom correspondence should be addressed.
Sensors 2006, 6(4), 284-297; https://doi.org/10.3390/s6040284
Submission received: 26 July 2005 / Accepted: 28 February 2006 / Published: 7 April 2006

Abstract

:
A solid-state amperometric hydrogen sensor based on a protonated Nafion membrane and catalytic active electrode operating at room temperature was fabricated and tested. Ionic conducting polymer-metal electrode interfaces were prepared chemically by using the impregnation-reduction method. The polymer membrane was impregnated with tetra-ammine platinum chloride hydrate and the metal ions were subsequently reduced by using either sodium tetrahydroborate or potassium tetrahydroborate. The hydrogen sensing characteristics with air as reference gas is reported. The sensors were capable of detecting hydrogen concentrations from 10 ppm to 10% in nitrogen. The response time was in the range of 10-30 s and a stable linear current output was observed. The thin Pt films were characterized by XRD, Infrared Spectroscopy, Optical Microscopy, Atomic Force Microscopy, Scanning Electron Microscopy and EDAX.

Introduction

Interest in hydrogen gas sensing has rapidly increased, because hydrogen gas is renewable, abundant, efficient and unlike other alternative fuels, provides zero emission. The product of hydrogen combustion is water, making it the most environmentally friendly fuel. Hydrogen can be used as a fuel in conventional combustion engine and fuel cells. Public transport fueled by hydrogen is very likely in near future. However, if handled carelessly, hydrogen is dangerous for transport, storage and use as many other fuels. As a result, safety remains a top priority in all the aspects of hydrogen energy and sensing hydrogen leakages of storage and transportation equipment has become very essential. Although different types of sensors are currently investigated [1-3], most of them show poor response in sensing low hydrogen concentrations, therefore work should be focused on the development of sensor devices with very high sensitivity and selectivity towards hydrogen, especially at or near room temperature.
Solid-state sensors for hydrogen have employed a number of solid electrolytes (proton conductors), e.g., hydrogen uranyl phosphate (HUP), zirconium phosphate and antimonic acid [4,5]. Especially solid electrolyte polymers (SEP) bear great promise for the construction of solid-state sensors, one of the most common SEP being the perfluorosulfonic acid polymer membrane (commercially named Nafion®). Polymers containing ions have been referred to as ionic polymers that consist of fixed covalent ionic groups such as those located at the end of side-chains so as to position themselves in their preferred orientation to metal ions. Therefore, they can create nano-channels, so-called cluster networks. Ionic polymers in contact with a conductive medium such as a metal (being called ionic polymer metal components, IPMCs) allow to perform electrochemical reactions especially by choosing noble metals as a electrocatalysts. This ionic polymer technology has drawn significant attention and is now popular in various sectors of industries [6].
There are many reports describing the process of metallization of ionic polymers, e.g., mechanical, electrochemical and chemical reduction processes [7]. An efficient way of depositing noble metals onto the membrane appears to be achievable by chemical reduction because of low investment and production cost. This method can be divided into two types, the Takenaka-Torikai method [8] and the impregnation-reduction method [9]. The latter technique has been applied in the present investigation to obtain mechanically stable electrodes with good interfacial contact [10].
Amperometry is a method of electrochemical analysis in which the signal of interest is a current that is approximately linearly dependent upon the concentration of the gas. Amperometric sensor devices show a very simple construction and can be mass-produced cheaply by uncomplicated technologies [11]. A wide range of amperometric sensors had been developed for many gaseous compounds [12]. Moreover, amperometry can detect gases at part-per-million (ppm) to percent concentrations with very high precision. In this paper, we show the development of an amperometric detector which is primarily concerned with the coating of a Pt electrode by the chemical reduction method applied to both sides of the membrane and testing the sensing performance of this Pt | Nafion electrode at ambient temperature. The response of the sensor to fixed concentrations of hydrogen gas is being reported. Surface characterization techniques such as XRD, Infrared Spectroscopy, Optical Microscopy, Atomic Force Microscopy and Scanning Electron Microscopy have been used to analyze the chemically prepared electrodes.

Experimental

Nafion® 177 membranes were purchased from Aldrich and pretreated at 100 °C in double-distilled water, thereafter in 3% hydrogen peroxide solution at the same temperature for one hour and were again boiled in double-distilled water 2-3 times to remove excess H2O2 on the membrane. The cleaned membrane was then ion-exchanged (H+ form) with 1 M H2SO4 acid solution for 2 hours and then, finally 2 times in double-distilled water, each time for 30 min. All samples were stored in distilled water at least overnight and until being used in further experiments.
The ionic polymer-metal electrodes were formed by employing ionic polymers which became then chemically treated with an ionic salt solution of a metal complex by the impregnation-reduction (I-R) method [13]. Commercially available metal complexes such as tetra-ammine platinum chloride hydrate (Pt(NH3)4Cl2) from Sigma Aldrich were used in aqueous concentrations of 0.001, 0.01 and 0.1 M. The membrane was stretched and fixed in a polyacrylic holder with a circular opening of 16 mm in diameter. The metal complex solution was exposed to the membrane for 3 hours at a fixed pH value of 11-12 maintained by the addition of ammonium hydroxide solution. Then, the membrane was rinsed 2-3 times with double distilled water. The impregnated metal ions [Pt(NH3)4]2+ were reduced by using a strong reducing agent, sodium tetrahydroborate (NaBH4), with concentrations from 0.01 to 0.08 M for 2 hours. The reducing solution was replaced every 20 min. Both impregnation and reduction were carried out at room temperature. Subsequently, a similar procedure was applied to the other side of the membrane in order to get the second electrode with the same thickness as the first one. Similarly, the impregnated metal ions [Pt(NH3)4]2+ were reduced by using a weak reducing agent, potassium tetrahydroborate (KBH4), with concentrations from 0.01 to 0.08 M, under the same conditions as mentioned above.
All chemically reduced ionic polymer-metal surfaces were examined by a high resolution optical microscope (LEICA MZ26) and a scanning electron microscope (Philips XL30). X-ray diffraction (Seifert XRD 3000) patterns were recorded by using Cu Kα radiation generated at 10 kV and 5 mA with the wavelength of λ = 1.54 Å in the Bragg-Brentano sample configuration. The pattern was obtained in the 2 θ ranges from 30 to 90° with a step size of 0.05° and 5 s per step. The crystal structure and particle size were determined by using the crystallographic analysis software Peakfit and Winfit.
The schematic diagram of the assembled hydrogen sensor is shown in Fig. 1. Sensor testing was performed at ambient pressure and room temperature with a common moisture of RH 50-60% at a flow rate of 80 sccm. High purity dry hydrogen and hydrogen-nitrogen gas mixtures (Messer-Griesheim, Germany), containing 1, 10 and 100% hydrogen partial pressures, were used for the measurements. The parent gas from the gas cylinder was diluted by mixing it with N2 in various ratios from ppm to percentage level using commercial mass-flow controllers (EL-Flow mass flow meter/controller, Bronkhorst, Ak Ruurlo, Netherlands) and monitored by a computer. Hydrogen gas response of the cell was performed with an Ionic Systems (Stuttgart, Germany) potentiostat, galvanostat and electrometer which was interfaced by a GPIB card connected to a PC. The data were collected with regard to changes in the current and response time as a function of the hydrogen partial pressures. Sensor output signals were measured every second and stored in a computer file for post-run analyses. Gas exposure times were typically 60 s or the time specified in the figure captions, during which time the sensor signal would usually reach a steady state plateau. Sensitivity is defined as the slope of the calibration curve in units of μA per percentage or μA ppm-1 and the response time t90 is defined as the time to reach 90% of the change of the steady state signal.

Results and discussion

Surface characteristics of electrode

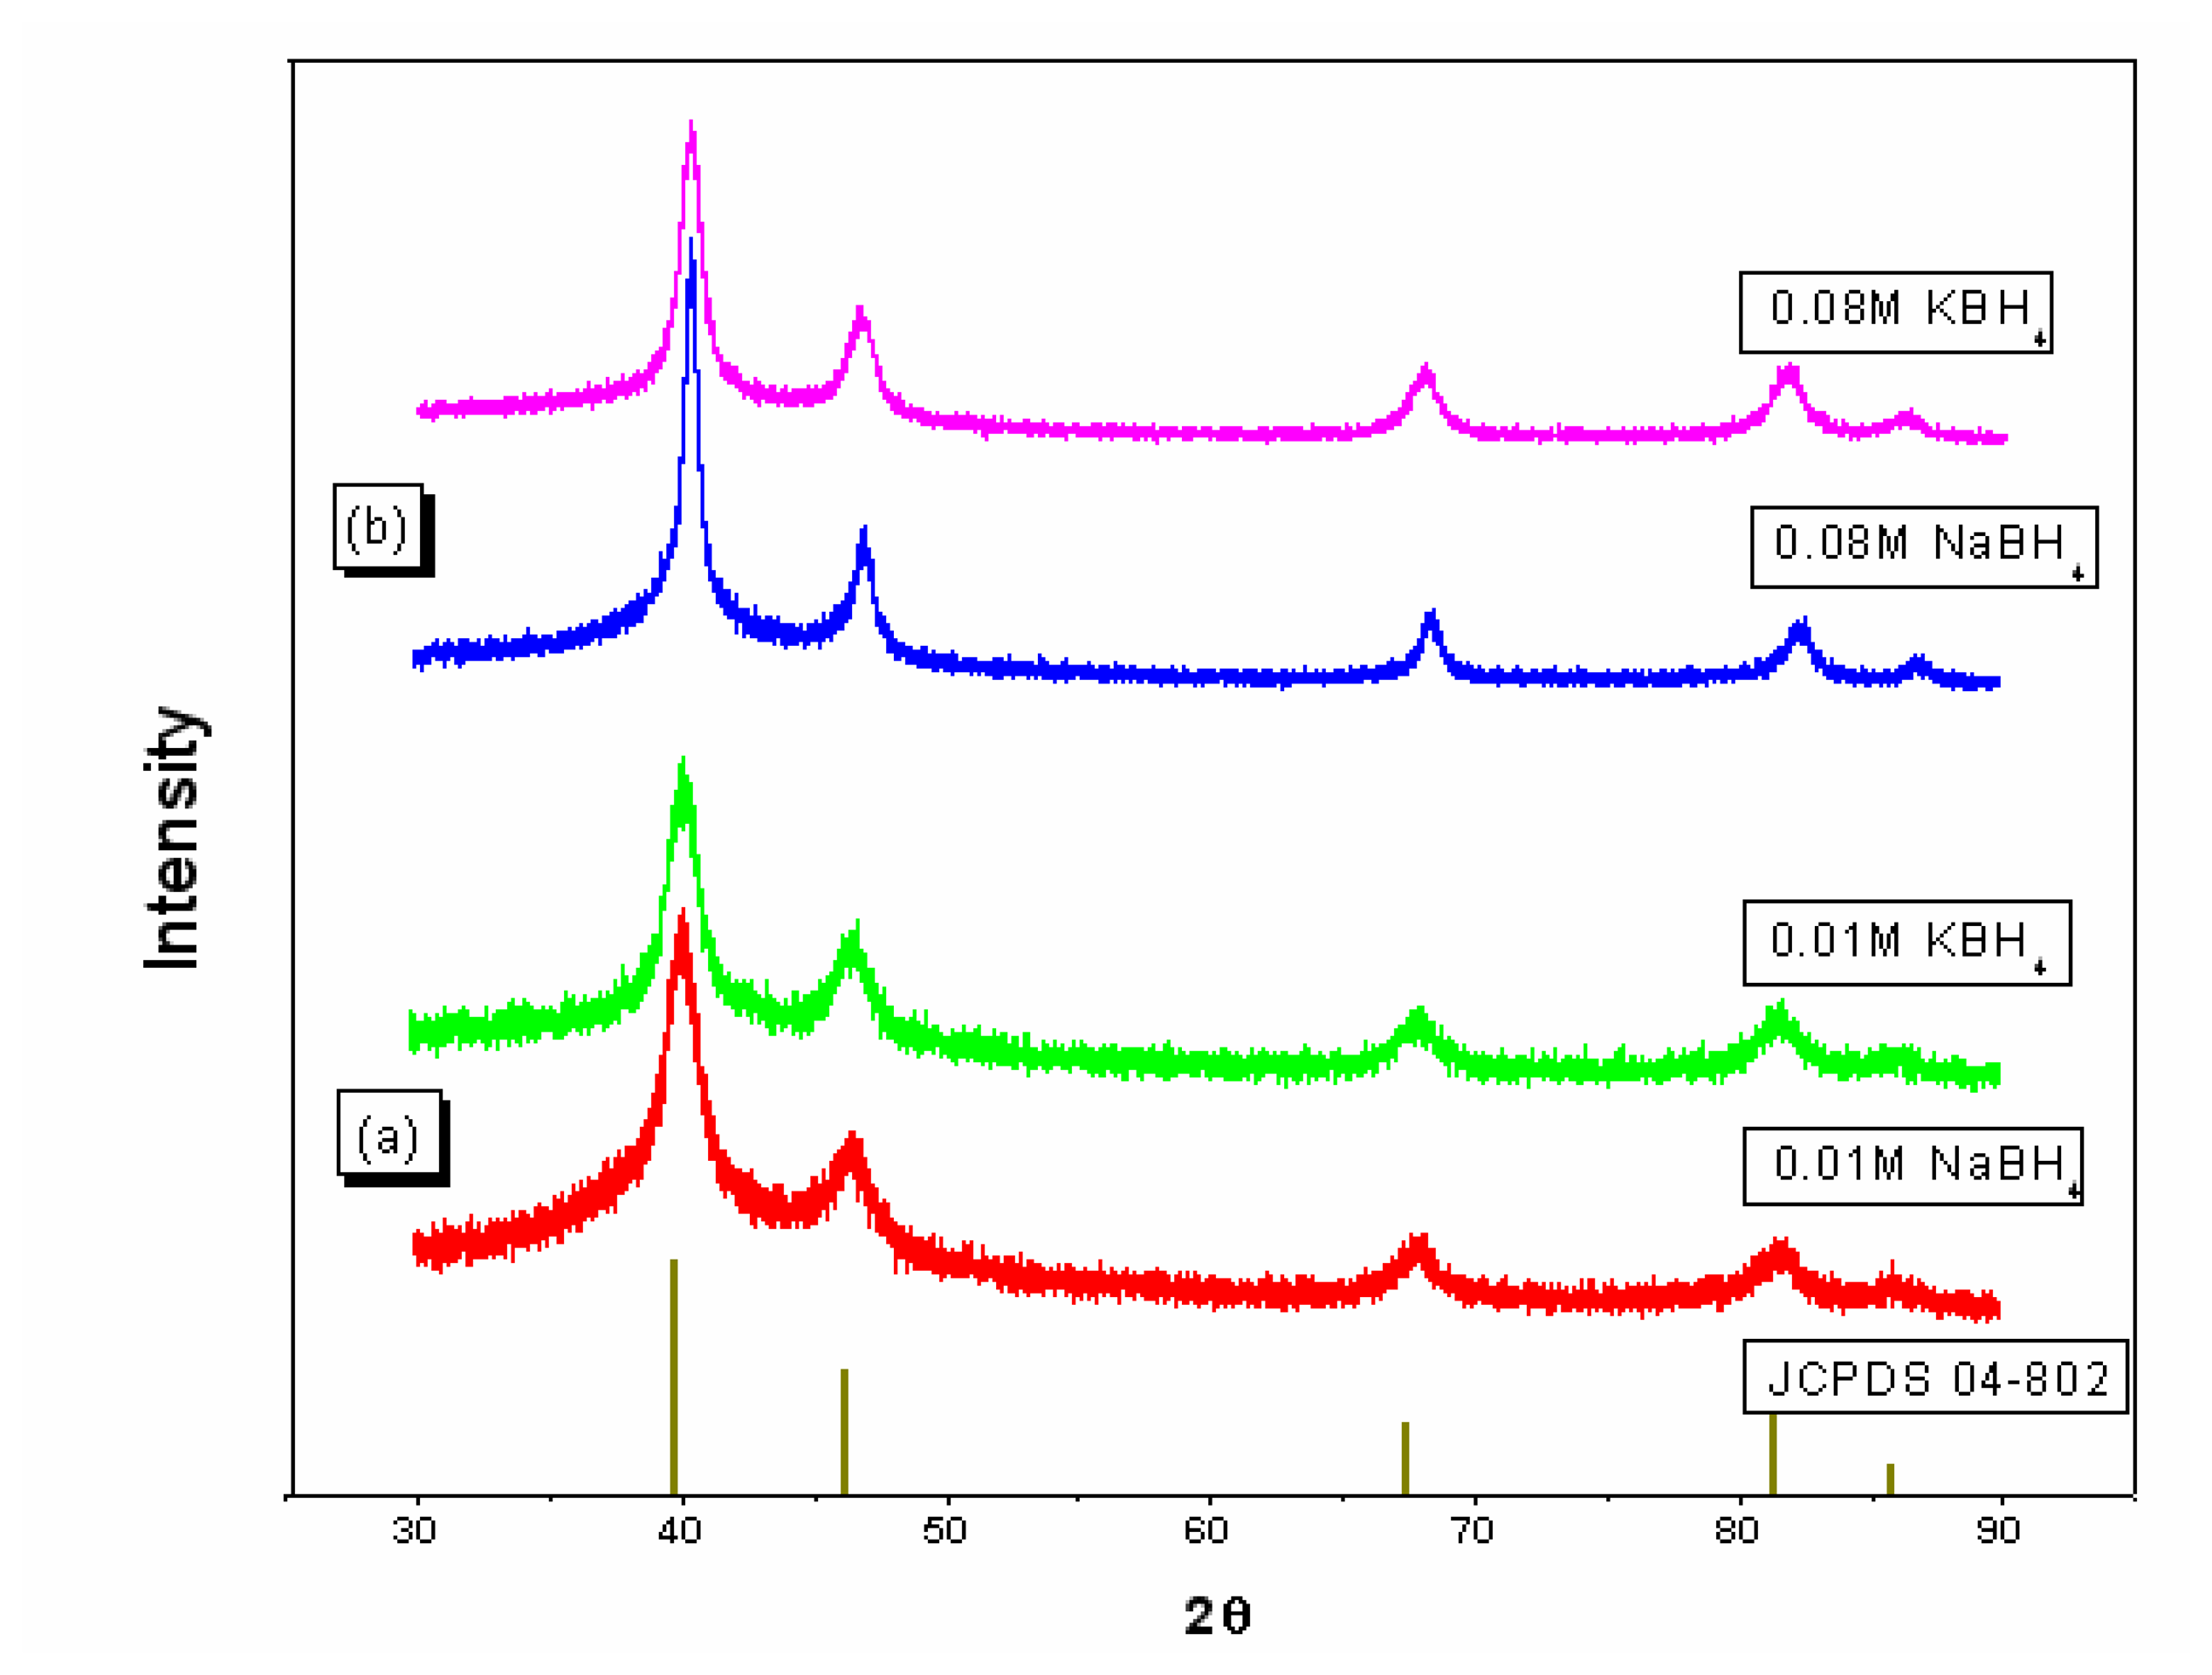
Figure 2 shows the X-ray diffraction patterns of the platinum electrode samples prepared by using the two different metal salts. The two patterns in the bottom panel were recorded for the sample prepared with 0.01 M concentration of NaBH4 and KBH4 as a reducing agent. The two top patterns were recorded with the sample prepared with 0.08 M concentration of NaBH4 and KBH4 as a reducing agent. Initially, both sets of samples were impregnated with 0.01 M concentration of Pt(NH3)4Cl2. The bottom pattern shows the data of the standard JCPDS card 4-802 [14]. All peaks could be well indexed according to the standard. All four XRD patterns show only Pt peak angles, irrespective of the type and concentration of the reducing agent, i.e. the impregnated Nafion membrane contains [Pt(NH3)4]2+ ions which were reduced completely. A clear XRD pattern was obtained from both strong and weak reducing agents which shows the complete reduction process of metal ions over the Nafion membrane provided with good interfacial contact between the electrode and electrolyte. Lower concentration peaks show larger distortion than in the case of higher concentrations, as well as larger broadening, which is attributed to induced strain between the Pt particles. Smaller particle sizes are expected in the case of broader peaks, in which lower concentrations of NaBH4 show larger broadening than KBH4 due to the higher reduction rate of the Na compound. The size of the Pt particles was calculated using Scherrer's equation [15], evaluating the FWHM of the peak broadening by using the peakfit program. The subtraction of the instrumental broadening is included; those expressions are described elsewhere [16]. The calculated crystallite size diameter (d) values for different concentrations are shown in Table 1.
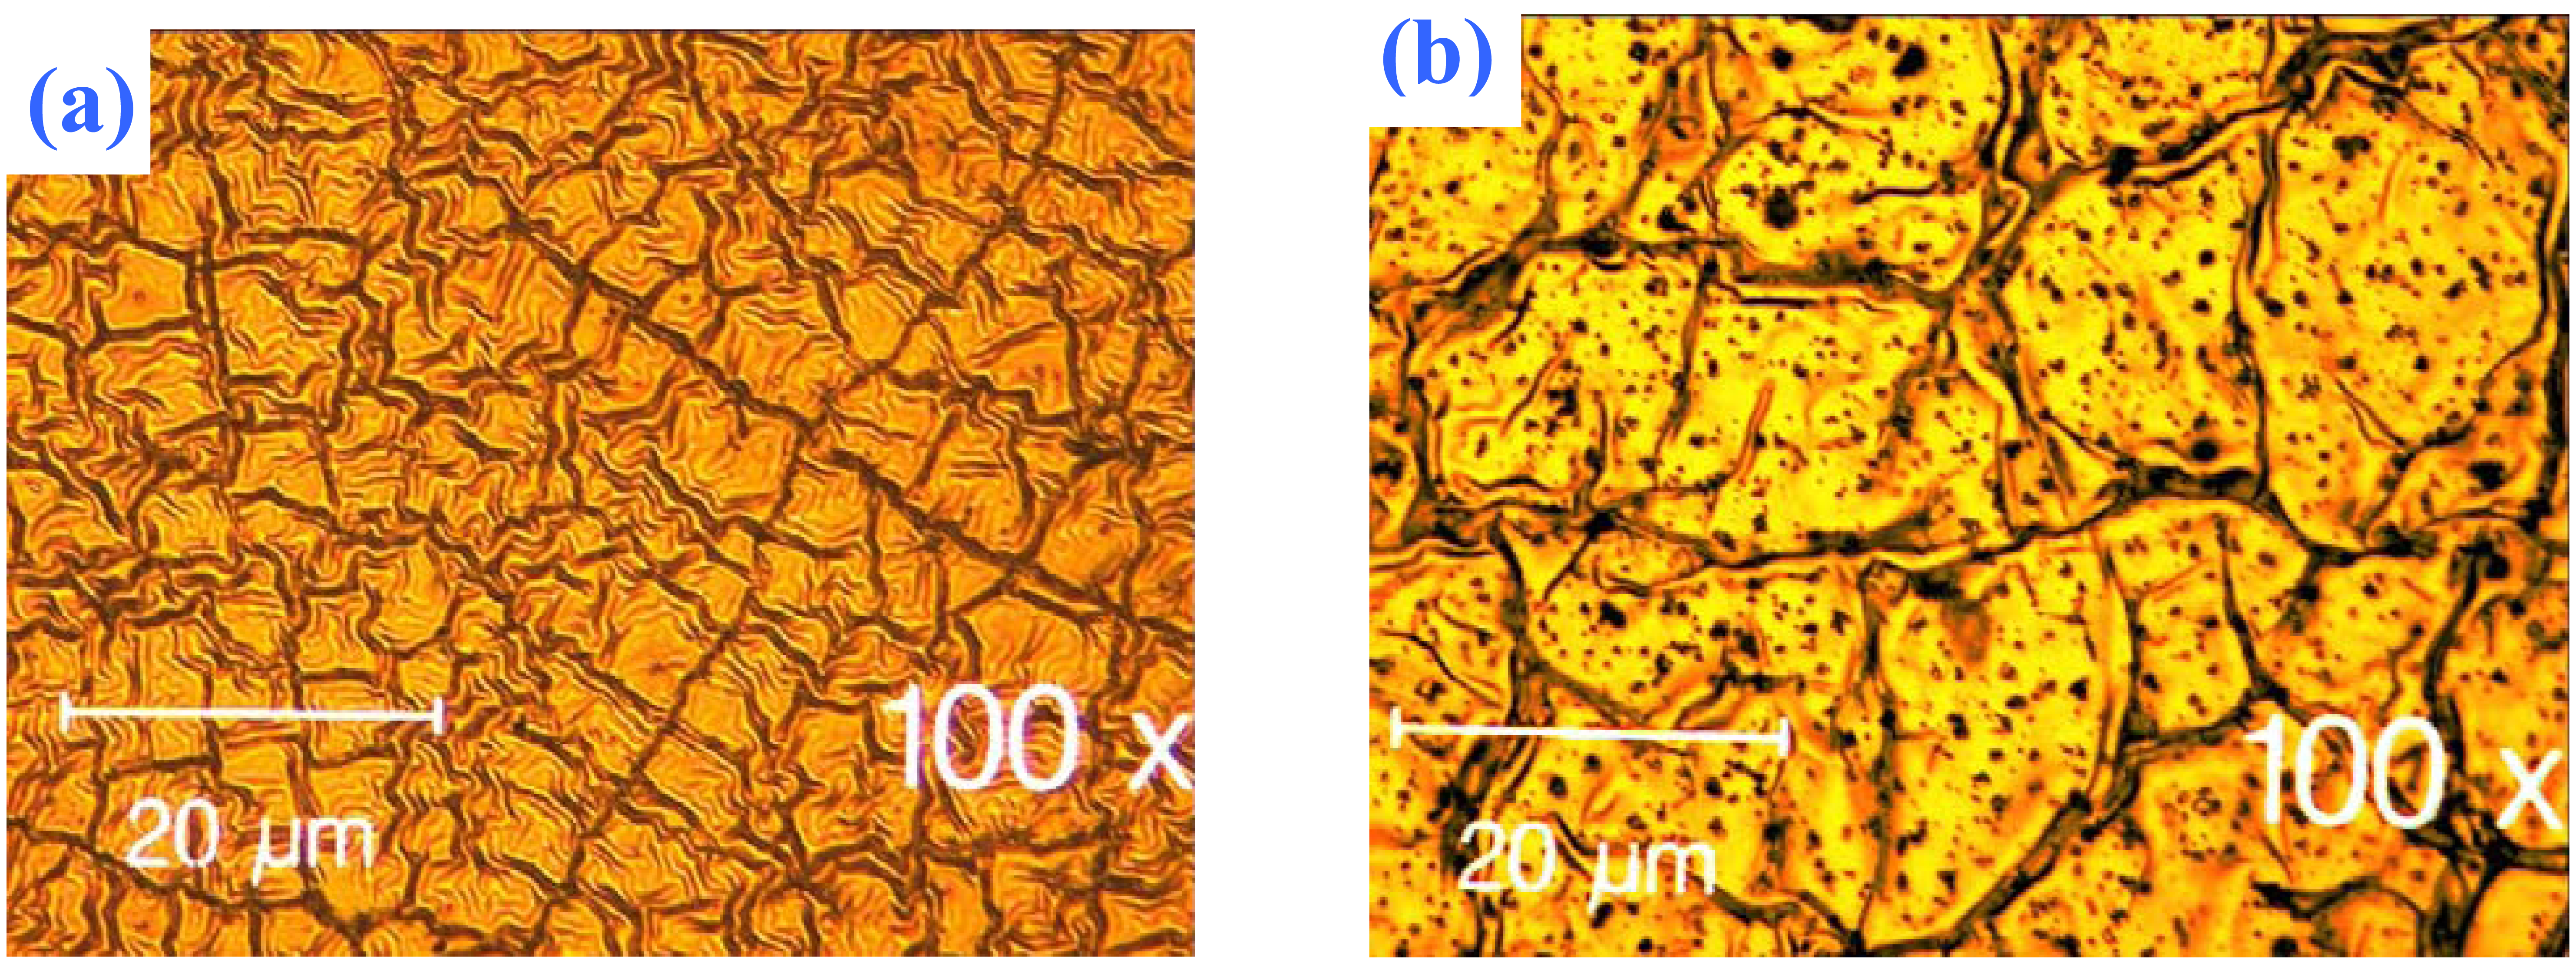
Optical micrographs of the chemically reduced ionic polymer-platinum electrode surfaces are shown in Fig. 3. The Pt surface of the sample prepared from 0.01 M NaBH4 shows highly strained and smooth reflecting surfaces, whereas in the case of 0.01 M KBH4 less strain and larger particle size is observed. XRD crystallite size analyses for the corresponding samples were in agreement. In addition, both sample surfaces have shown a major difference in porosity. The samples prepared with KBH4 as reducing agent have given more homogeneous pores than NaBH4. Porous structures were obtained due to the fact of the weak reducing nature of the potassium compound. Similar conditions were followed to prepare Pt electrodes using NaBH4 and KBH4 as well, in which the reduction rate differed from one another. The higher the reduction rate the more strain and particle growth is observed, whereas the weak reducing agents show less strain and slow growth rate, resulting in uniform small pores.
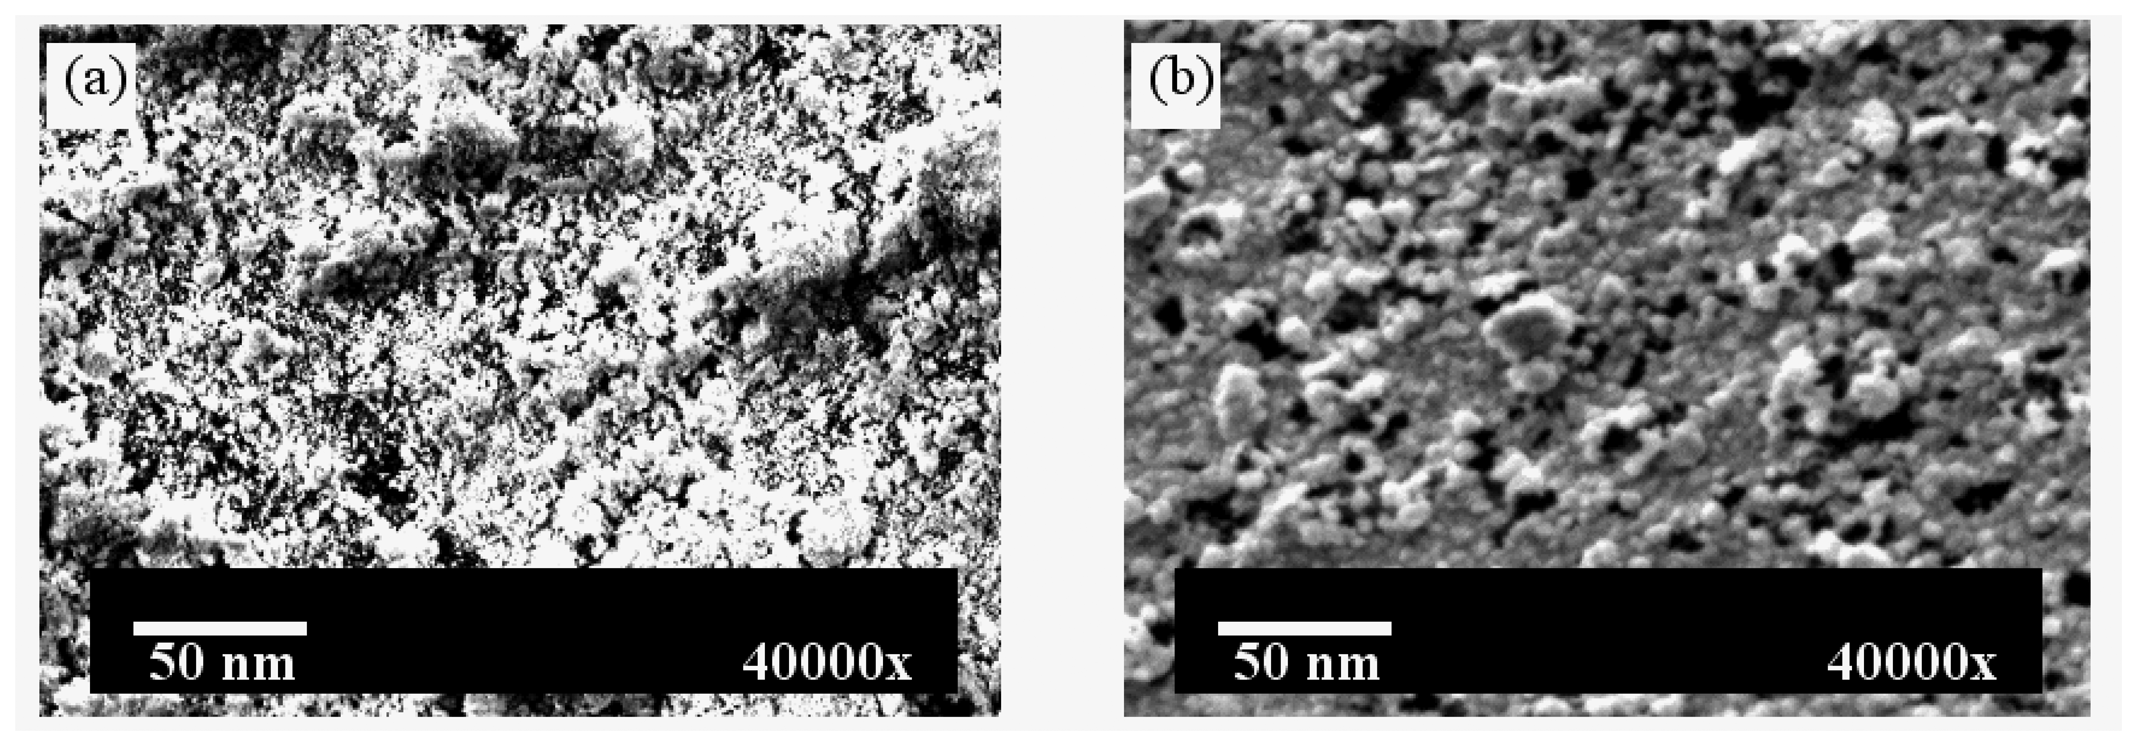
Figure 4 shows the SEM images of the Pt particles deposited on the Nafion membrane of different crystallite sizes, which are in agreement with the size calculated from the XRD peak analysis. Energy dispersive X-ray spot analysis shows Pt peaks in M and L energy levels and a small percentage of fluorine and carbon peaks due to the base perfluorated polymer membrane.

Working principles of the sensor

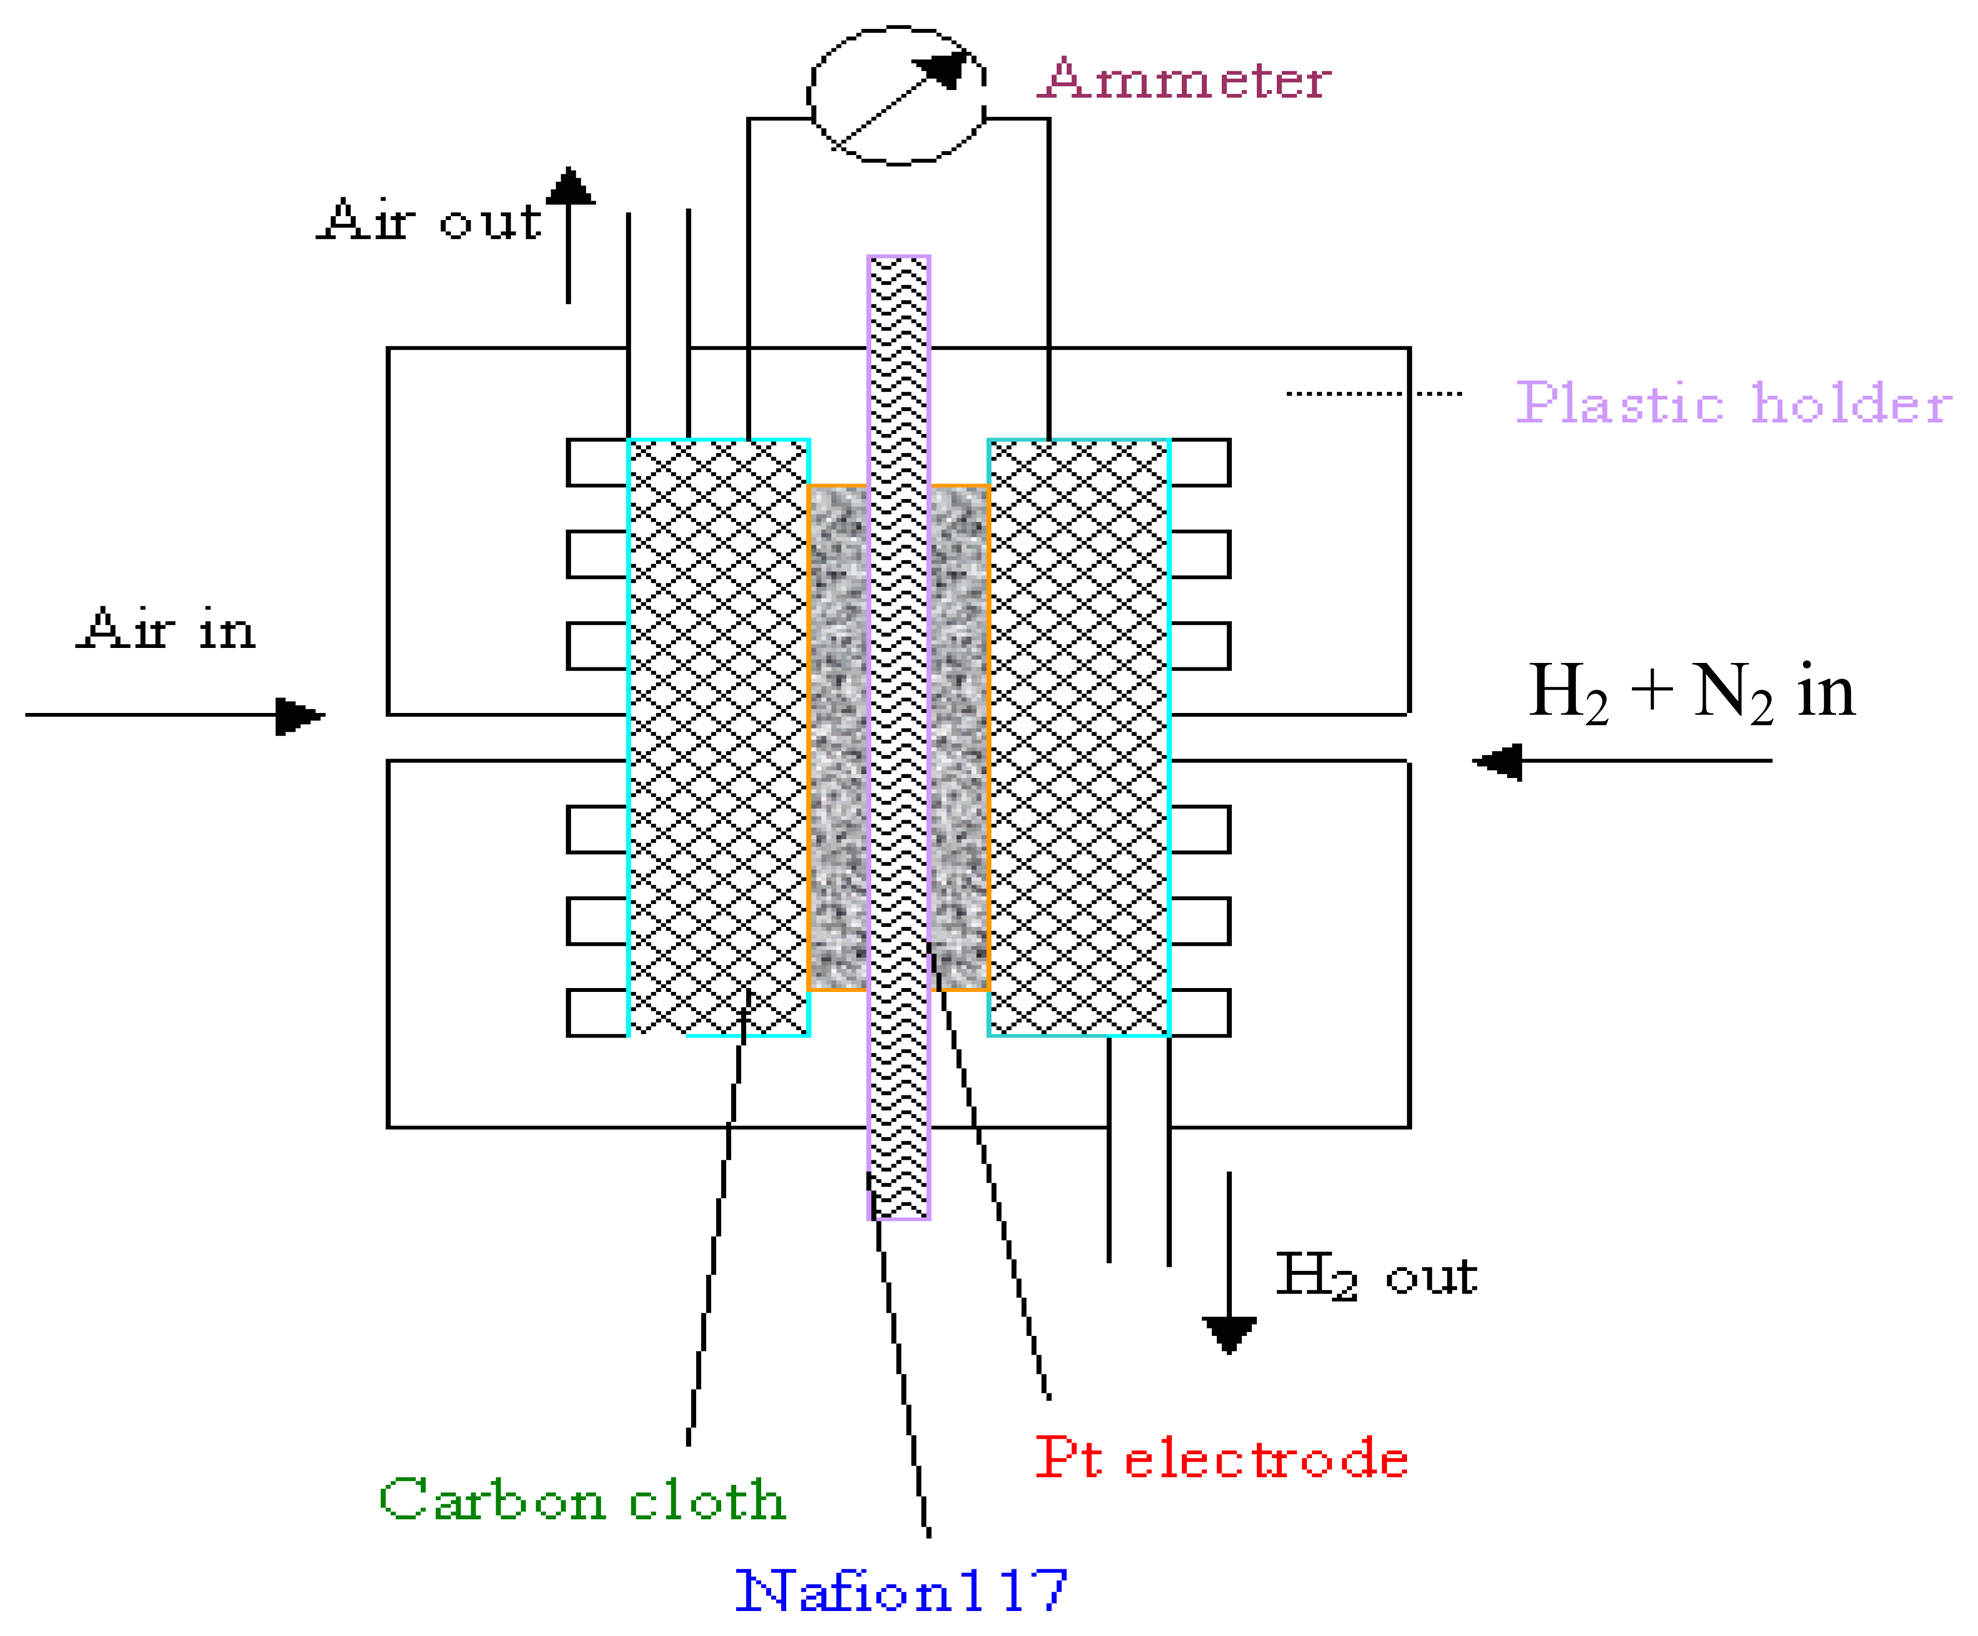
The Pt/Nafion sensor element assembly fixed with a Plexiglas arrangement is shown schematically in Fig. 1. The sensing performance of the amperometric sensor was conducted for the detection of hydrogen in nitrogen. The following electrochemical processes take place at the electrodes, i.e. oxidation at the anode side,
H 2 ( g ) 2 H + + 2 e
and reduction at the cathode side [17].
1 / 2 O 2 + 2 H + + 2 e H 2 O ( liq )
The reference electrode of the sensor is air, i.e. the hydrogen activity (or combined water and oxygen activities) in air is used as a reference for the above mentioned electrochemical cell. Under short-circuit conditions, reaction (1) occurs at the sensing electrode, whereas reaction (2) occurs at the counter electrode. The sensor response current is controlled by the diffusion rate of bulk hydrogen or the oxidation rate of hydrogen. When the oxidation rate of hydrogen is much higher than the diffusion rate, the electrochemical reaction is a diffusion-limited process.
A carbon cloth with numerous micropores of about 0.1 μm aperture was used instead of a capillary hole-type diffusion barrier, which simplifies the structure of the sensing electrode chamber compared to the hole-type arrangement [18]. The presence of carbon paste coated on carbon cloth as a current collector ensures the gas diffusion controlled process. The fundamental process for sensing hydrogen gas can be described in four steps: (i) the gas (H2) diffuses through the carbon barrier to the electrode and is then absorbed on the sensing electrode H2ads, (ii) the electrochemical reaction (1) occurs, (iii) the protons move toward the counter electrode through the proton-conducting Nafion membrane, (iv) the resulting reaction product (2) desorbs from the counter electrode and diffuses away. The electronic charge is transferred to or from the electrode in step (ii) which will then be passed through the external circuit [19]. In amperometry, the observed Faradaic current is due to the electrochemical reaction and the current, dQ/dt, where Q is the charge transferred to the electrode by the chemical reaction.
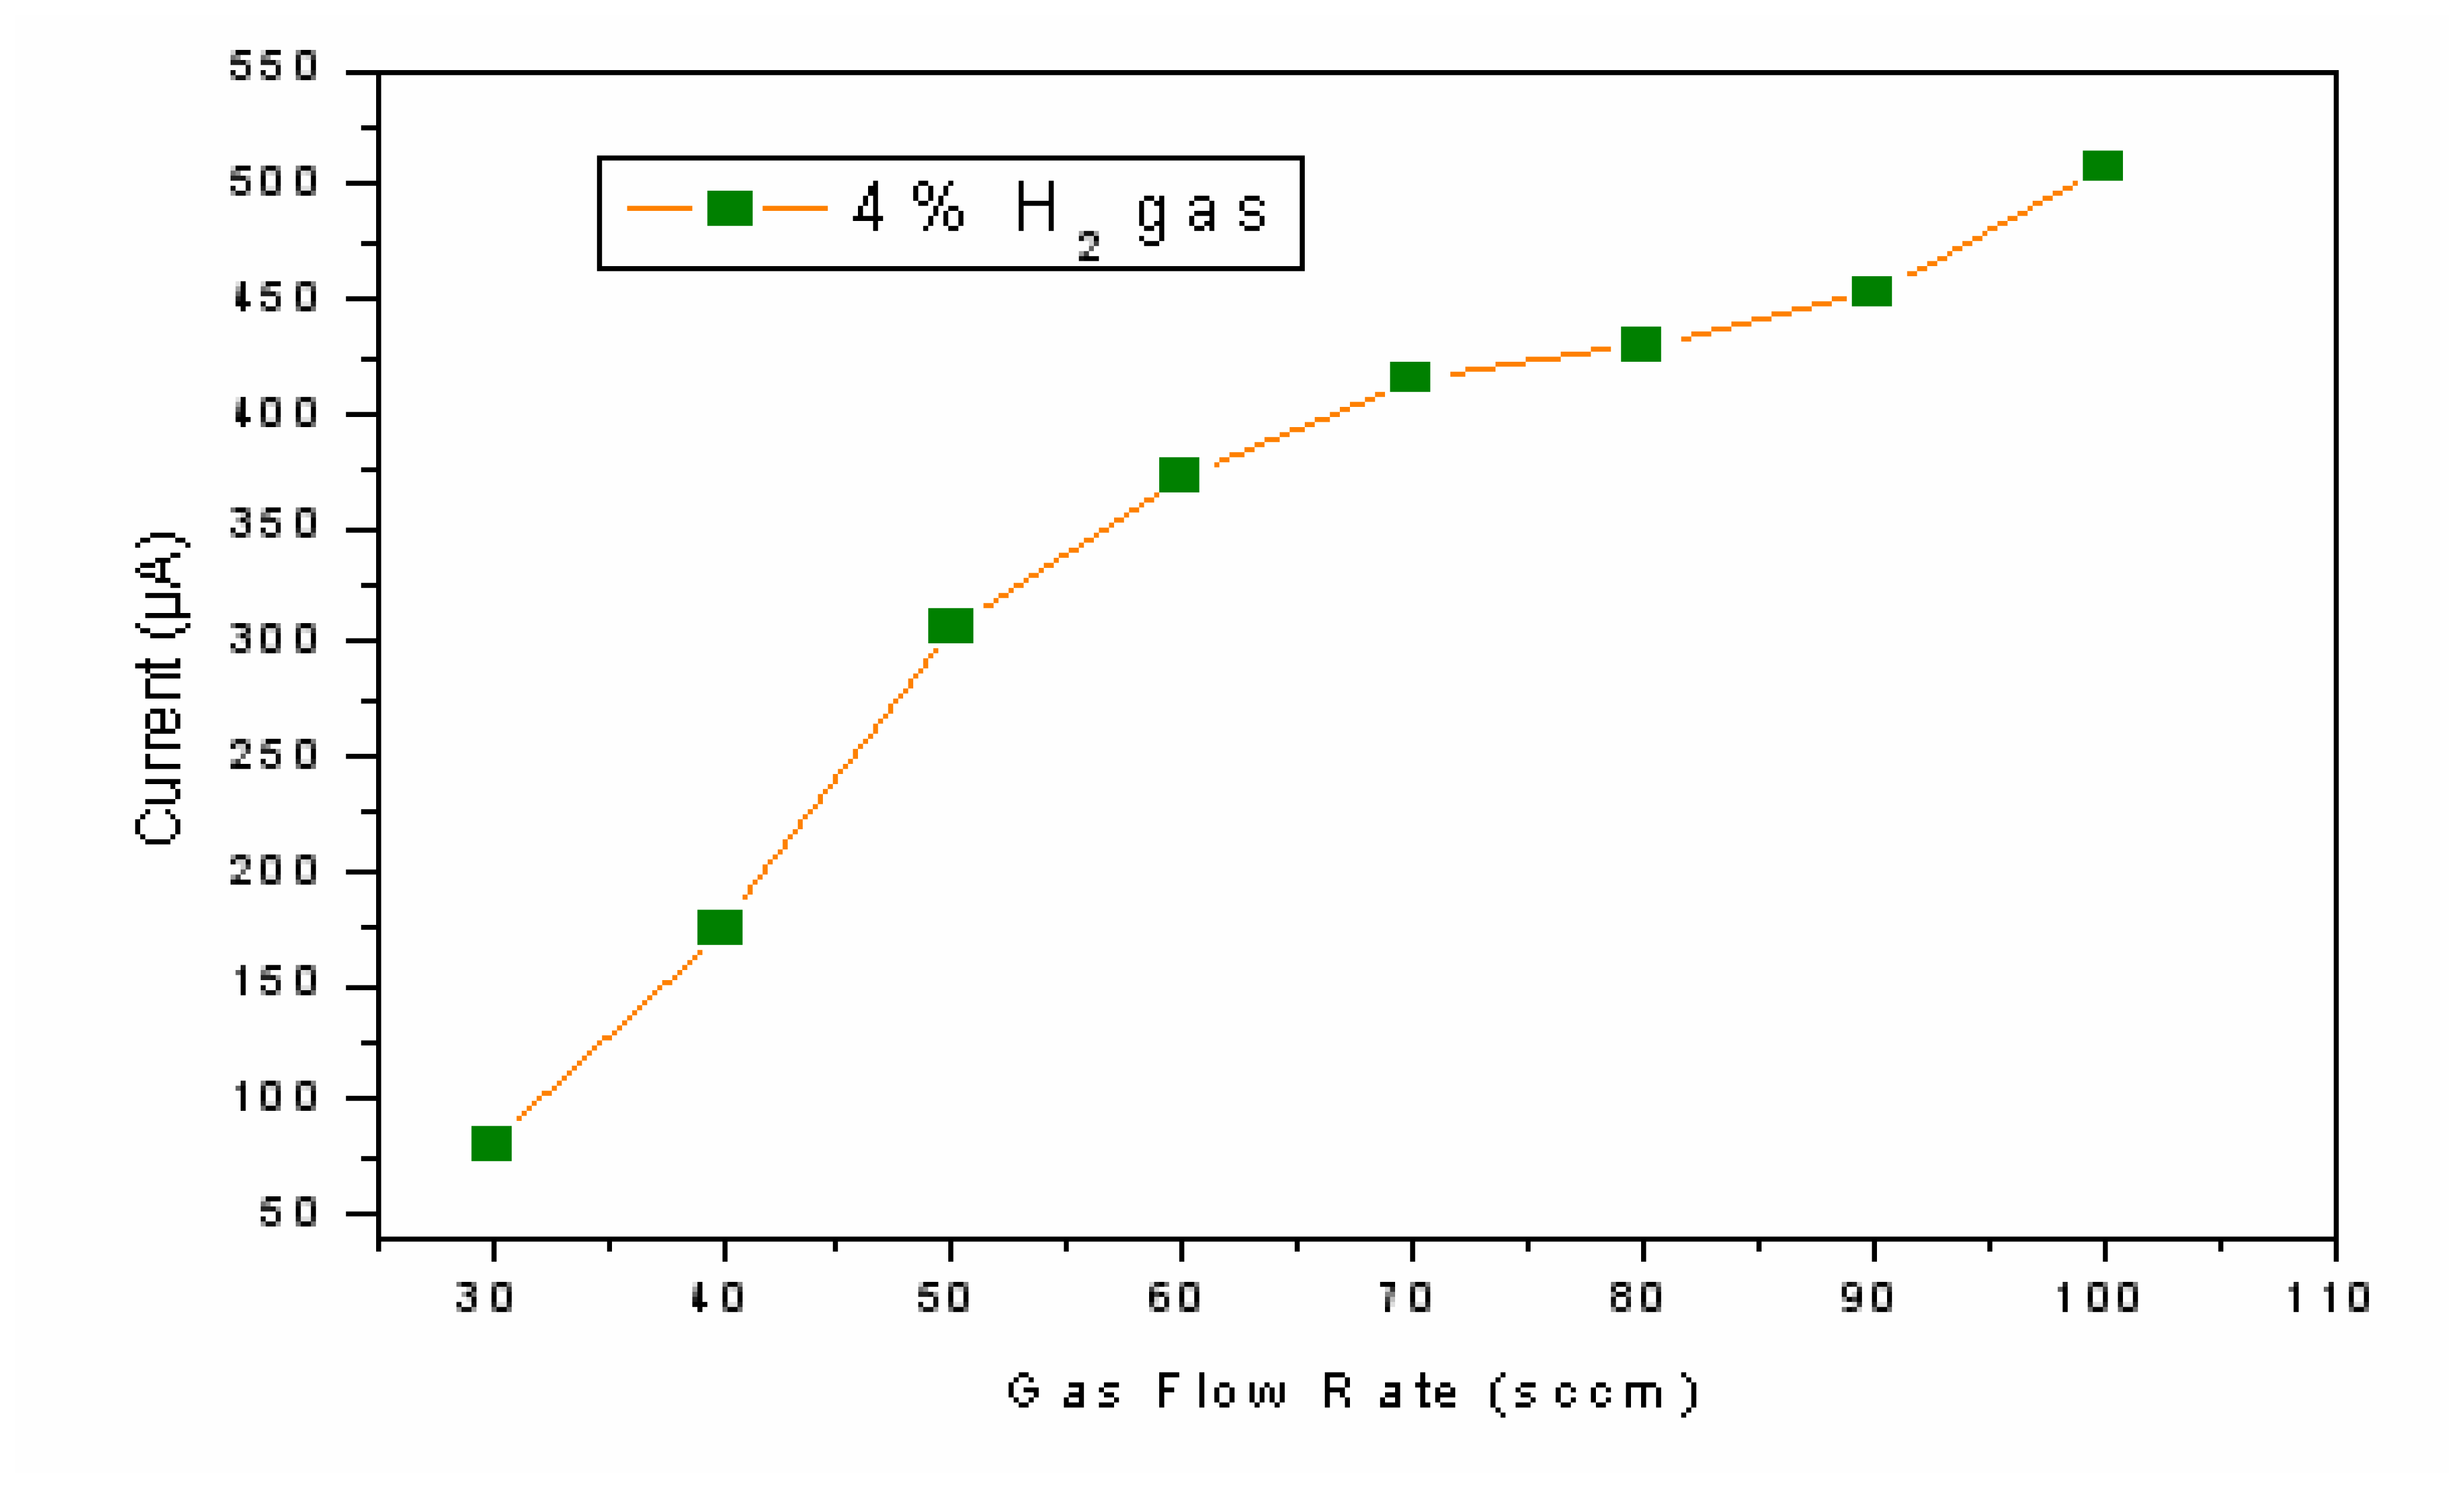
Because the electrochemical reaction is a diffusion-limited process, the hydrogen gas flow rate and carbon diffusion barrier will influence the resulting response signal. Figure 5 shows the gas flow rate versus output current for the sensor under the exposure of 4% hydrogen. It can be seen that the response signal increases steeply before the flow rate reaches 40 sccm, then increases steadily, and shows nearly a plateau at 70-80 sccm, the gas diffusion in carbon cloth was limited in this flow rate range. In the present work, all sensor measurements were performed at 80 sccm constant flow rate.

High H2 gas concentration response (NaBH4)

The performance of the hydrogen sensor was observed by employing the Pt | Nafion (0.01 M Pt(NH3)4Cl2 and 0.04 M NaBH
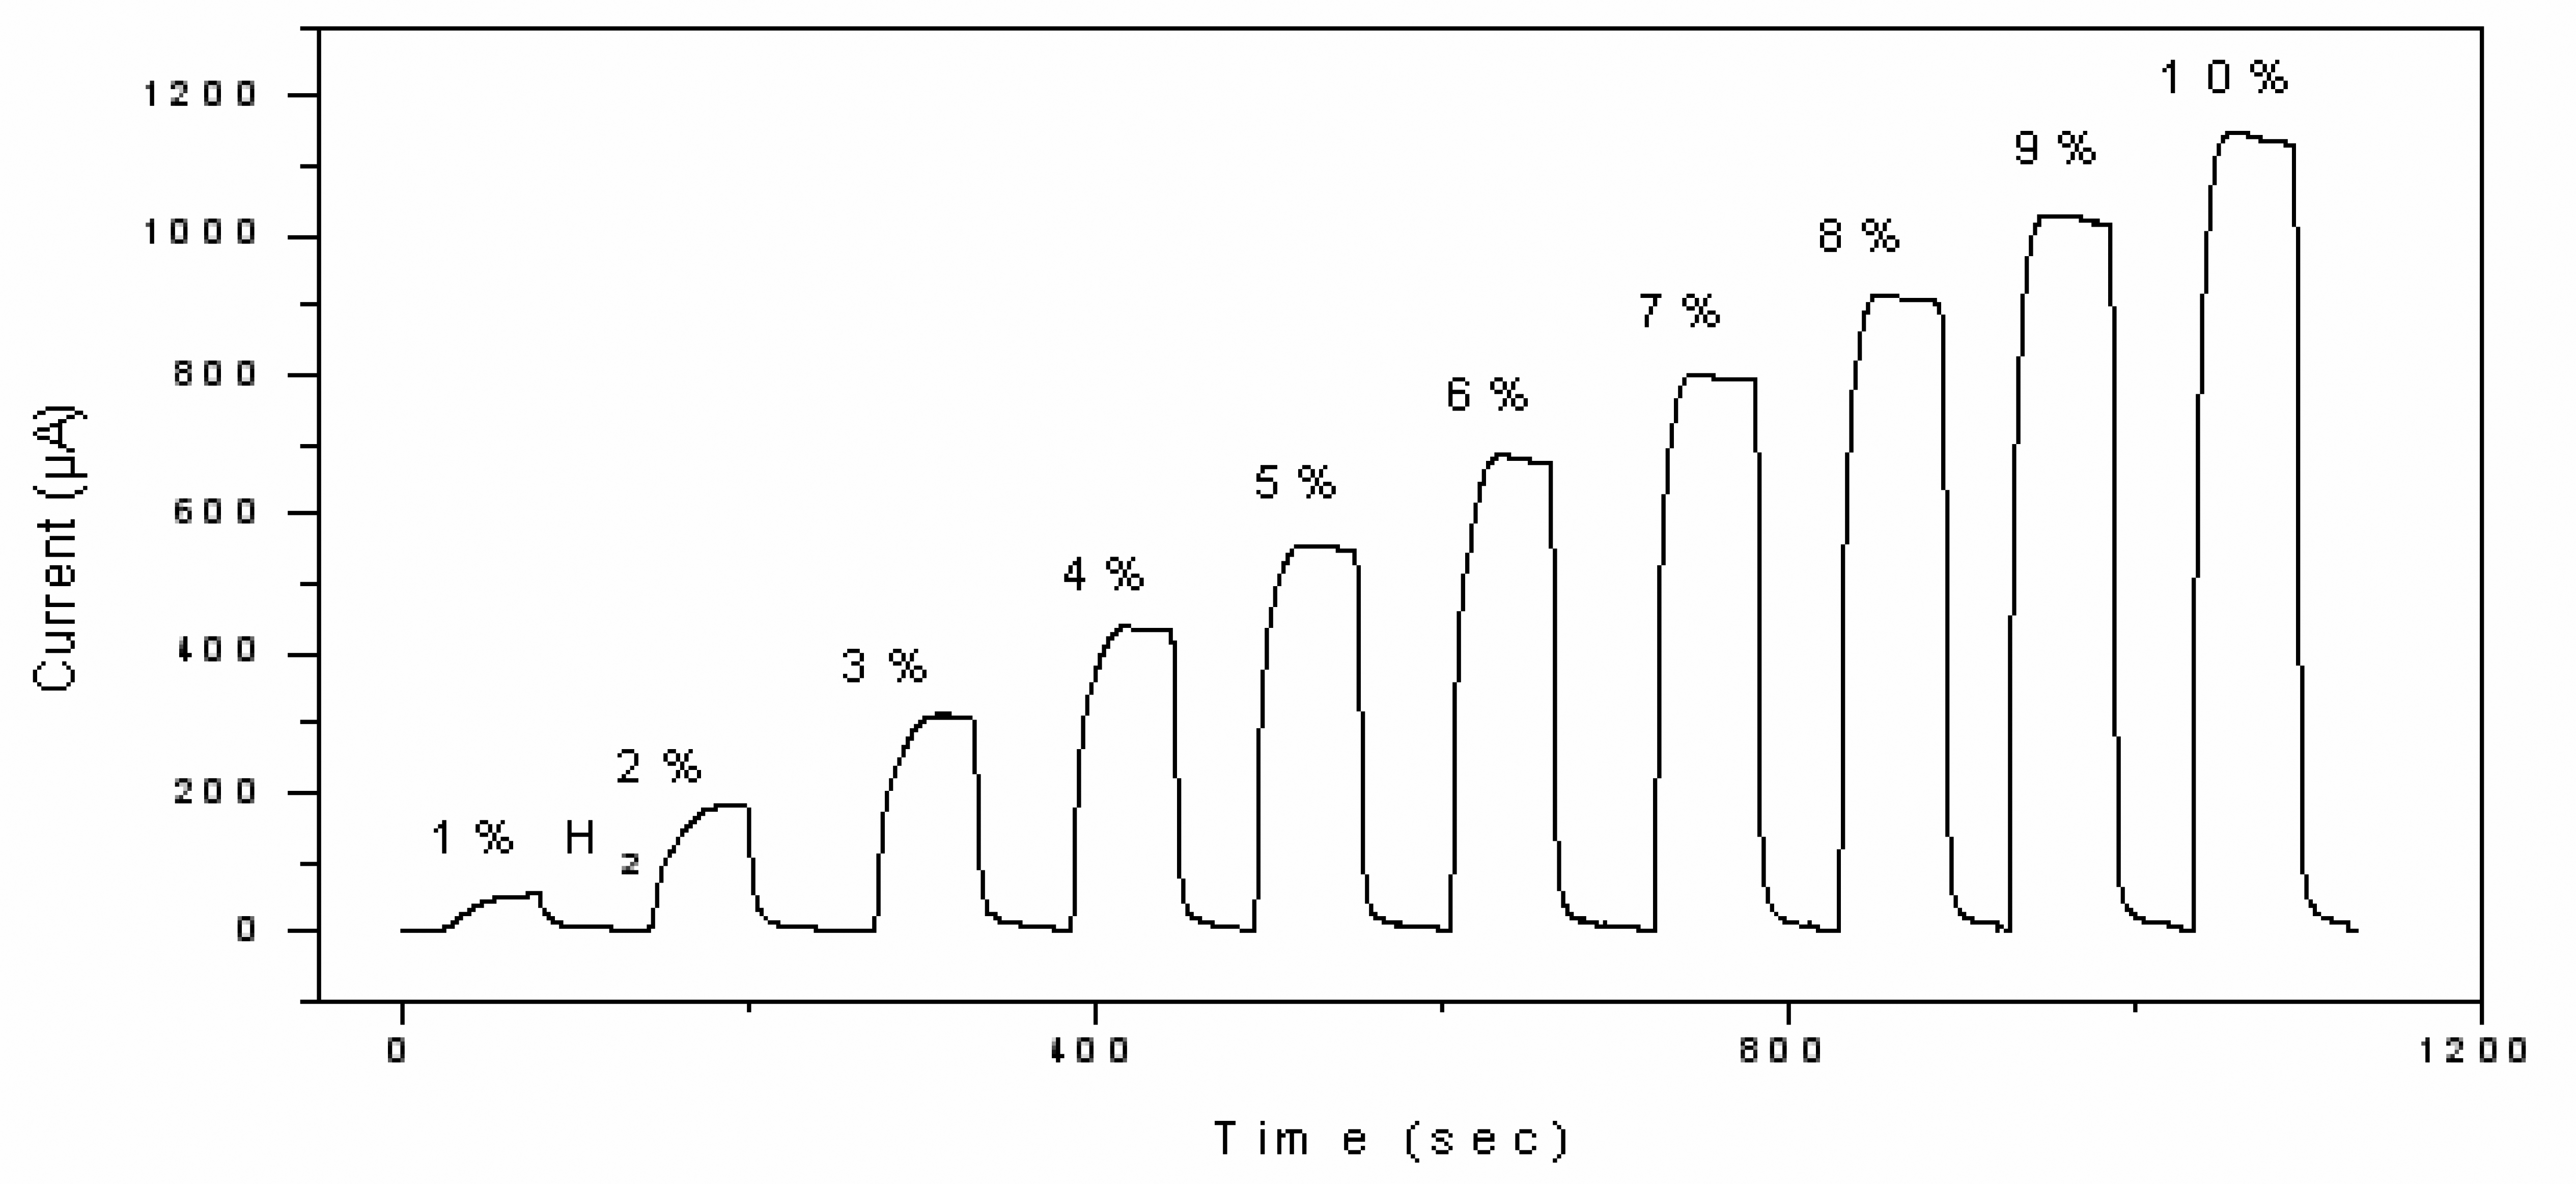
4) assembly for different concentration steps of hydrogen in nitrogen at room temperature. The response curve for 1 min exposure of 1-10% H2 gas is shown in Fig. 6.
Different gas concentrations were tested in the ranges beginning at 1% and then going up to 10% hydrogen in steps of one percent hydrogen partial pressure for 1 min each time. The calibration plot of steady current of the sensor versus hydrogen concentration is shown in Fig. 7. A linear relationship between the output current and the hydrogen concentration was observed for both forward and reverse direction of changes in the concentration from 1 to 10% of hydrogen gas. According to Fig. 7, the linear regression equation is y = - 47.66 + 119.79x, where y and x are the response current (μA) of the sensor and the concentrations (%) of hydrogen, respectively. The average maximum sensitivity was observed to be 0.01 μA cm-2ppm-1, 0.007 μA cm-2ppm-1 and 0.008 μA cm-2ppm-1 in the hydrogen partial pressure ranges of 1-2%, 3-7% and 8-10%, respectively. The response time (t90) to achieve a change in the signal level of 90% was typically less than 5-15 s. Both the response and recovery times decrease with increasing hydrogen concentration. When the samples were tested at low H2 concentrations (ppm level) a non-linear behaviour was observed.

Low H2 gas concentration response (KBH4)

Optical micrographs of the Pt electrode surfaces prepared with 0.01-0.08 M KBH4 have shown a more porous nature than with 0.01-0.08 M NaBH4. Such porous surfaces are suitable for the detection of low H2 gas concentrations. In order to proof the concept, ppm level concentrations were tested with the samples prepared with 0.01-0.08 M KBH4. Typical step responses of the sensor element Pt | Nafion (0.01 M Pt(NH3)4Cl2 and 0.01 M KBH4) to various concentration steps of 100-1000 ppm hydrogen in nitrogen at room temperature are shown in Fig. 8. Linear output current responses were observed for different samples over this hydrogen concentration range as shown in Fig. 9. The average maximum sensitivity of the sensor is 0.0026 μA cm-2ppm-1 in the range of 100-1000 ppm, which is about 3 times higher than reported [20]. Between 100 and 1000 ppm hydrogen, the response time is of the order of 25 and 5 s, in both forward and reverse direction, respectively. For practical purposes, the detection of hydrogen at the low ppm level is important. The same sets of samples were exposed to 10-50 ppm hydrogen gas. The response curve for 1 min exposure of 10-50 ppm H2 gas is shown in Fig. 10. Linear output current responses were observed for different samples over the hydrogen concentration ranges as shown in Fig. 11. The average maximum sensitivity of the sensor is 0.0046 μA cm-2ppm-1 in the range of 10-50 ppm. A summery of both high and low detection ranges with different sensitivities are listed in Table 2.
Compared with the sensors prepared by using NaBH4, a linear response was observed for hydrogen gas concentrations at the percentage level, whereas in the case of the sensor prepared by using KBH4, the linear response was extended up to the ppm level.
This behaviour of the different types of reducing agent can be explained by the achievement of the high effective electrode surface area via the porous structure. The electrochemical oxidation of hydrogen takes place along the three-phase boundary sites, where the Pt catalyst, solid electrolyte Nafion and H2 gas come together, which was observed largely in KBH4 samples. The porous structure obtained in KBH4 samples is a major advantage for very low concentration level detection. The small pore size structure provides more three-phase boundary sites for the electrochemical oxidation to occur. Thicknesses of the electrodes were observed in surface profilometry, which depend on concentrations of the reducing agent being used. The sensitivity performance shows a wide range.
However, the sensitivity is proportional to the charging current rather than the electrode thickness. The optimum sensitivity was observed with an electrode prepared using 0.01 M concentration of KBH4 as a reducing agent, the layer thickness of which was about 0.3 μm. Electrodes prepared with higher KBH4 concentrations (i.e., 0.06-0.08 M) have thicker Pt deposits but their active surface areas and hydrogen sensitivities were lower than those of the 0.01 M KBH4 electrode. This may be accounted for by the fact that the thicker Pt deposits have a larger average Pt particle size or isolated Pt particles are formed, which may not fulfil the three-phase boundary conditions for gas sensor applications.
The effective electrode area is sensitively varied by the amount of the reducing agent rather than the amount of [Pt(NH3)4]2+ ions. When the amount of the Pt(NH3)4Cl2 solution was varied within the range 0.001-0.1 M with a fixed value of KBH4 solution (0.04 M), the charging current values were in the range 0.07-1.2 μA. But, when the reacted amounts of KBH4 solution were changed within the range 0.01-0.08 M while that of the Pt(NH3)4Cl2 solution was fixed at 0.01 M, the current was observed to be in a wider range of 0.05-0.3 μA. This suggests that, compared to the ion-exchange step, the reduction conditions have greater effects on the microstructure of the resulting electrodes. The response time (t90) was typically less than 10-30 s. Figure 12 shows the results of a cyclic exposure of the Pt | Nafion sensor element to 50 ppm hydrogen and no hydrogen. Identical maximum output currents were observed for several cycles changing within one minute from 0 to 50 ppm hydrogen. The diagram shows that the sensor remains stable over a substantial number of cycles. It should be pointed out that, when the hydrogen concentration is above 1000 ppm, with increasing hydrogen concentration, the amount of water and heat generated by the reactions of the sensor increase simultaneously. Hence, the conductivity of the Nafion and the temperature of the sensor are inclined to increase, which likely results in nonlinearity of the response current. A drift in the output current was in the range of 2% per day.

Conclusions

The structure and gas-sensing performance of the short-circuited amperometric sensor composed of a catalytic Pt film and solid polymer membrane was presented. The Pt electrodes prepared with strong and weak reducing agents showed a stable, fast and linear response to hydrogen gas from percentage to ppm level. Combination of high active surface areas and porous electrodes allow the application of the device over a wide range of hydrogen gas detection at room temperature. The simple construction of the sensor and its performance characteristics make the investigated device very promising for practical applications. Further work is also in progress on tailoring the Pt catalyst structure to improve the drift in the output current and reduce catalyst loading.

References

  1. Bouchet, R.; Rosini, S.; Vitter, G.; Siebert, E. Solid-state hydrogen sensor based on acid-doped polybenzimidazole. Sens. Actuators B 2001, 76, 610. [Google Scholar]
  2. Favier, F.; Walter, E.C.; Zach, M.P.; Benter, T.; Penner, R.M. Hydrogen sensors and switches from electrodeposited palladium mesowire arrays. Science 2001, 293, 2227. [Google Scholar]
  3. Baselt, D.R.; Fruhberger, B.; Klaassen, E.; Cemalovic, S.; Britton, C.L.; Patel, S.V.; Mlsna, T.E.; McCorkle, D.; Warmack, B. Design and performance of a microcantilever-based hydrogen sensor. Sens. Actuators B 2003, 88, 120. [Google Scholar]
  4. Miura, N.; Kato, H.; Ozawa, Y.; Yamazoe, N.; Seiyama, T. Amperometric Gas sensor using solid-state proton conductor sensitive to hydrogen in air at room temperature. Chem. Lett. 1984, 11, 1905. [Google Scholar]
  5. Fukatsu, N.; Kurita, N. Hydrogen sensor based on oxide proton conductors and its application to metallurgical engineering. Ionics 2005, 11, 54. [Google Scholar]
  6. Opekar, F.; Štulĺk, K. Electrochemical sensors with solid polymer electrolytes. Analytica Chimica Acta 1999, 385, 151. [Google Scholar]
  7. Vork, F.T.A.; Janssen, L.J.J.; Barendrecht, E. Oxidation of hydrogen at platinum-polypyrrole electrodes. Electrochim, Acta 1986, 31, 1569. [Google Scholar]
  8. Takenaka, H.; Torikai, E.; Kawami, Y.; Wakebayashi, N. Solid polymer electrolyte water Electrolysis. Int. J. Hydrogen Energy 1982, 7, 397. [Google Scholar]
  9. Millet, P.; Durand, R.; Dartyge, E.; Tourillon, G.; Fontaine, A. Precipitation of metallic platinum into Nafion ionomer membranes. J. Electrochem. Soc. 1993, 140, 1373. [Google Scholar]
  10. Ogumi, Z.; Inatomi, K.; Hinatsu, J.T.; Takehara, Z.I. Application of the SPE method to organic electrochemistry—XIII. Oxidation of geraniol on Mn,Pt-Nafion. Electrochim, Acta 1992, 37, 1295. [Google Scholar]
  11. Cao, Z.; Buttner, W.J.; Stetter, J.R. The properties and applications of amperometic gas sensors. Electroanalysis 1992, 4, 253. [Google Scholar]
  12. Chang, S.C.; Stetter, J.R.; Cha, C.S. Amperometric gas sensors. Talanta 1993, 40, 461. [Google Scholar]
  13. Millet, P.; Pineri, M.; Durand, R. New solid polymer electrolyte composites for water Electrolysis. J. Appl. Electrochem. 1989, 19, 162. [Google Scholar]
  14. Langford, J.I. X-ray powder diffraction studies of Vitromet samples. J. Appl. Cryst. 1971, 4, 164. [Google Scholar]
  15. Cullity, B.D. Elements of X-ray Diffraction; Addison-Wesley Publishing Company, Inc: USA, 1978; pp. 102–108. [Google Scholar]
  16. Sakthivel, M.; Weppner, W. Development of a hydrogen sensor based on solid polymer electrolyte membranes. Sens. Actuators B. in press.
  17. Miura, N.; Kato, H.; Yamazoe, N.; Seiyama, T. Fundamentals and applications of chemical sensors. Proceedings of the American Chemical Society; 1986; pp. 203–214. [Google Scholar]
  18. Hong, Y.J.; Oh, S.M. Fabrication of polymer electrolyte fuel cell (PEFC) H2 sensors. Sens. Actuators B 1996, 32, 7. [Google Scholar]
  19. Stetter, J.R. Transduction in amperometric gas sensors. Proc. Electrochem. Soc 1993, 93(7), 193. [Google Scholar]
  20. Samec, Z.; Opekar, F.; Crijins, G.J.E.F. Solid-state hydrogen sensor based on a solid-polymer electrolyte. Electroanalysis 1995, 7, 1054. [Google Scholar]
Figure 1. Schematic diagram of the ionic polymer-metal component sandwiched between Plexiglas compartments.
Sensors 06 00284f1
Figure 2. X-ray diffraction pattern of the Pt | Nafion® electrode assembly prepared from 0.01 M Pt(NH3)4Cl2 and different reductant concentrations (a) 0.01 M NaBH4 and KBH4, (b) 0.08 M NaBH4 and KBH4.
Sensors 06 00284f2
Figure 3. Optical micrograph of Pt electrode deposited on Nafion117 membrane using 0.01 MPt(NH3)4Cl2 and reductant concentration (a) 0.01 M NaBH4 and (b) 0.01 M KBH4.
Sensors 06 00284f3
Figure 4. Scanning electron micrograph of Pt electrode deposited on Nafion117 membrane using 0.01 M Pt(NH3)4Cl2 and reductant concentration (a) 0.01 M NaBH4 and (b) 0.01 M KBH4.
Sensors 06 00284f4
Figure 5. Variation of the output current for different flow rates at 4% H2 for the sensor assembly Pt | Nafion® with an electrode area of 2 cm2 prepared from 0.01 M Pt(NH3)4Cl2 and 0.01 M NaBH4 (sample N1).
Sensors 06 00284f5
Figure 6. Response behaviour of the Pt | Nafion electrode sensor element with an area of 2 cm2 prepared from 0.01 M Pt(NH3)4Cl2 and 0.04 M NaBH4 (sample N4) for hydrogen gas in the low concentration range of 1-10%.
Sensors 06 00284f6
Figure 7. Linear relation for 0.04 M NaBH4 (sample N4) concentration over a wide range of hydrogen concentration (1-10%) and a sensing area of 2 cm2. The dotted lines are results from calibrations with different samples.
Sensors 06 00284f7
Figure 8. Response behaviour of the Pt | Nafion electrode sensor element with an area of 2 cm2 prepared from 0.01 M Pt(NH3)4Cl2 and 0.01 M KBH4 (sample K1) for hydrogen gas in the low concentration range of 100-1000 ppm.
Sensors 06 00284f8
Figure 9. Linear relation for 0.01 M KBH4 (sample K1) concentration over a wide range of hydrogen concentration (100-1000 ppm) and a sensing area of 2 cm2. The dotted lines are results from calibrations with different samples.
Sensors 06 00284f9
Figure 10. Response behaviour of the Pt | Nafion electrode sensor element with an area of 2 cm2 prepared from 0.01 M Pt(NH3)4Cl2 and 0.01 M KBH4 (sample K1) for hydrogen gas in the low concentration range of 10-50 ppm.
Sensors 06 00284f10
Figure 11. Linear relation for 0.01 M KBH4 (sample K1) concentration over a low level of hydrogen concentration (10-50 ppm) and a sensing area of 2 cm2. The dotted lines are results from calibrations with different samples.
Sensors 06 00284f11
Figure 12. Cyclic behaviour of 50 ppm hydrogen and pure nitrogen gas exposure to the sensor element Pt | Nafion® with an electrode area of 2 cm2 prepared from 0.01 M Pt(NH3)4Cl2 and 0.01 M KBH4 (sample K1) at one minute time intervals.
Sensors 06 00284f12
Table 1. Average crystallite diameter (d) of the Pt grains deposited at the surface of the Nafion electrolyte prepared from Pt(NH3)4Cl2 of 0.01 M concentration and two different reductant concentrations.
Angle (2θ)d(nm) 0.01 M NaBH4d(nm) 0.01 M KBH4d(nm) 0.08 M NaBH4d(nm) 0.08 M KBH4
39.7° (111)1628211262
46.2° (200)2432116135
67.5° (220)4956142158
81.2° (311)4651105117
85.7° (222)233092108
Table 2. A list of average maximum sensitivities of two different sensors in detection range from percentage to ppm level.
ReductantDetection rangeAvg. Max. Sensitivity (μA cm-2ppm-1)
0.04 M NaBH41-2%0.01
3-7%0.007
8-10%0.008
0.01 M KBH410-50 ppm0.0046
100-1000 ppm0.0026

