Antibody Immobilization on Waveguides Using aFlow–Through System Shows Improved Listeria monocytogenesDetection in an Automated Fiber Optic Biosensor: RAPTORTM

Abstract
:Introduction
Results and Discussion
Instrument set up and fiber preparation for antibody immobilization
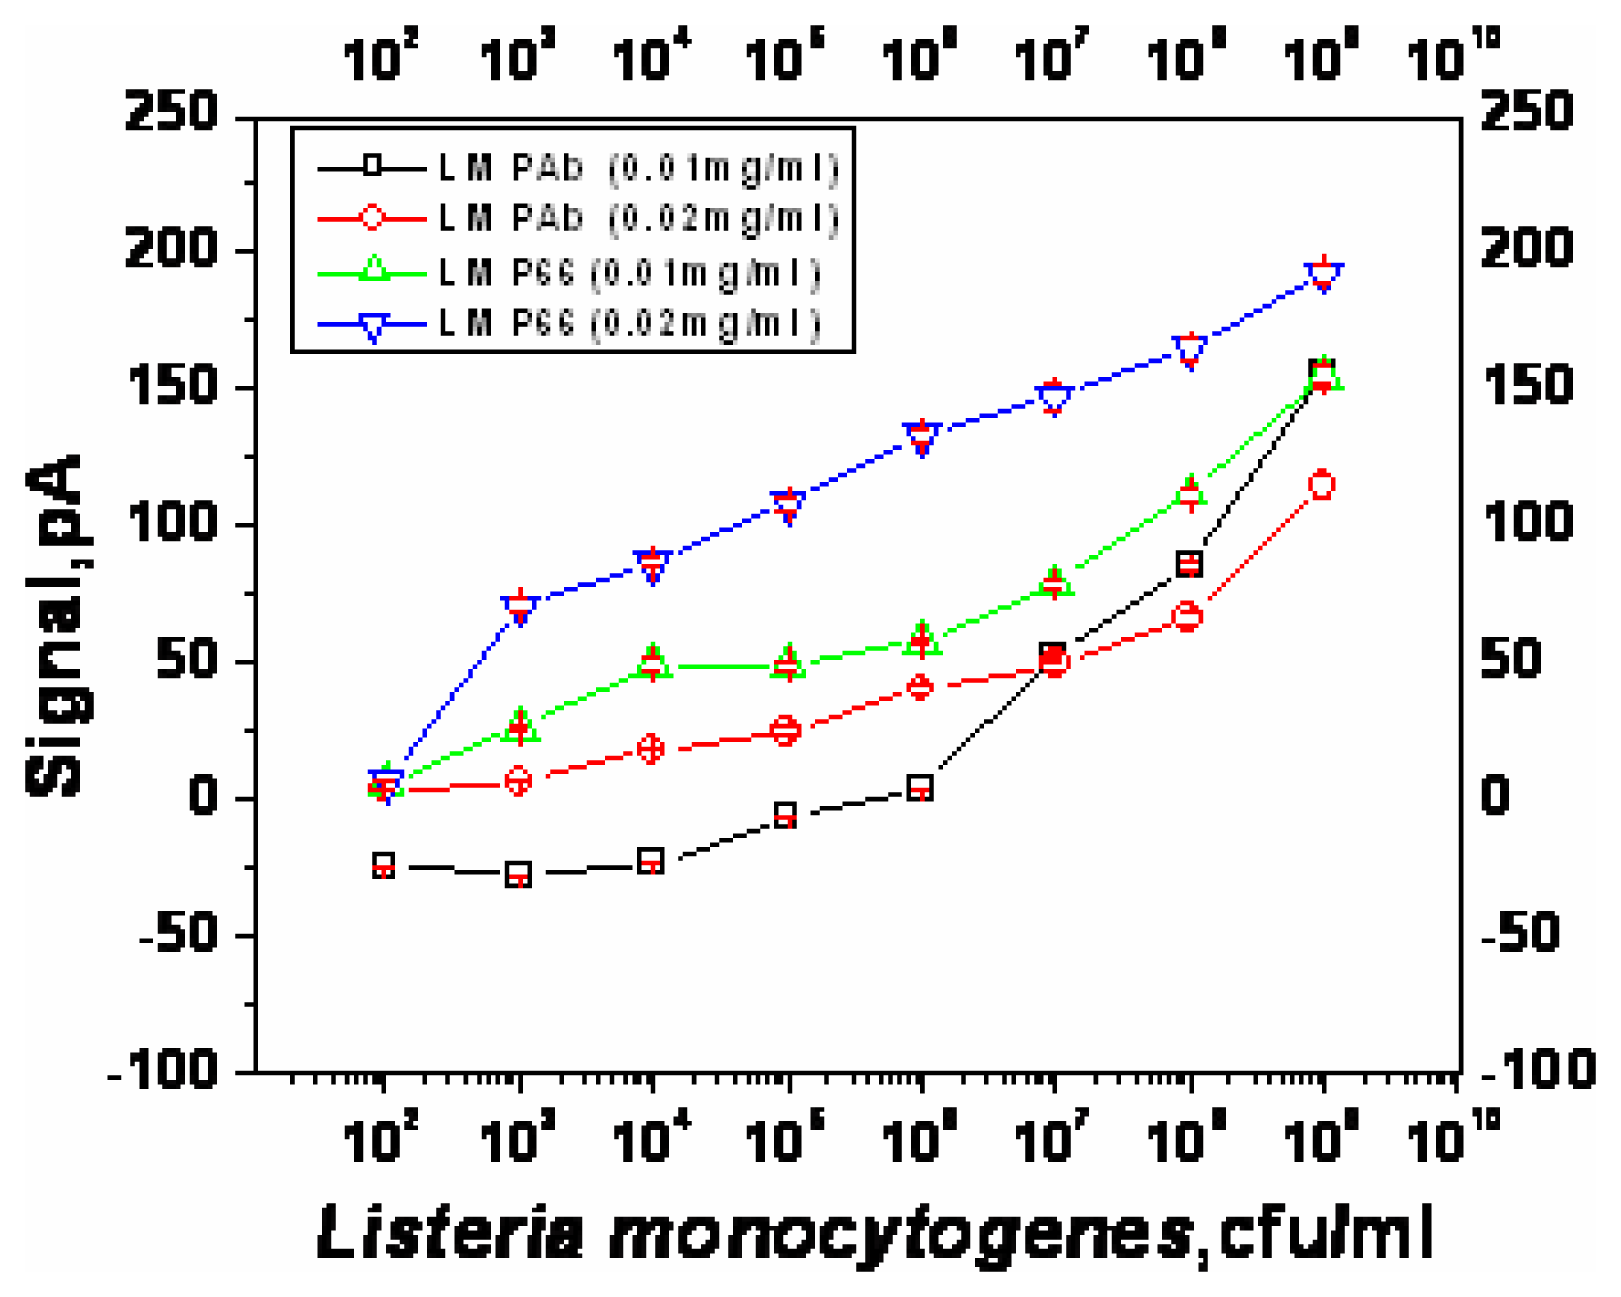
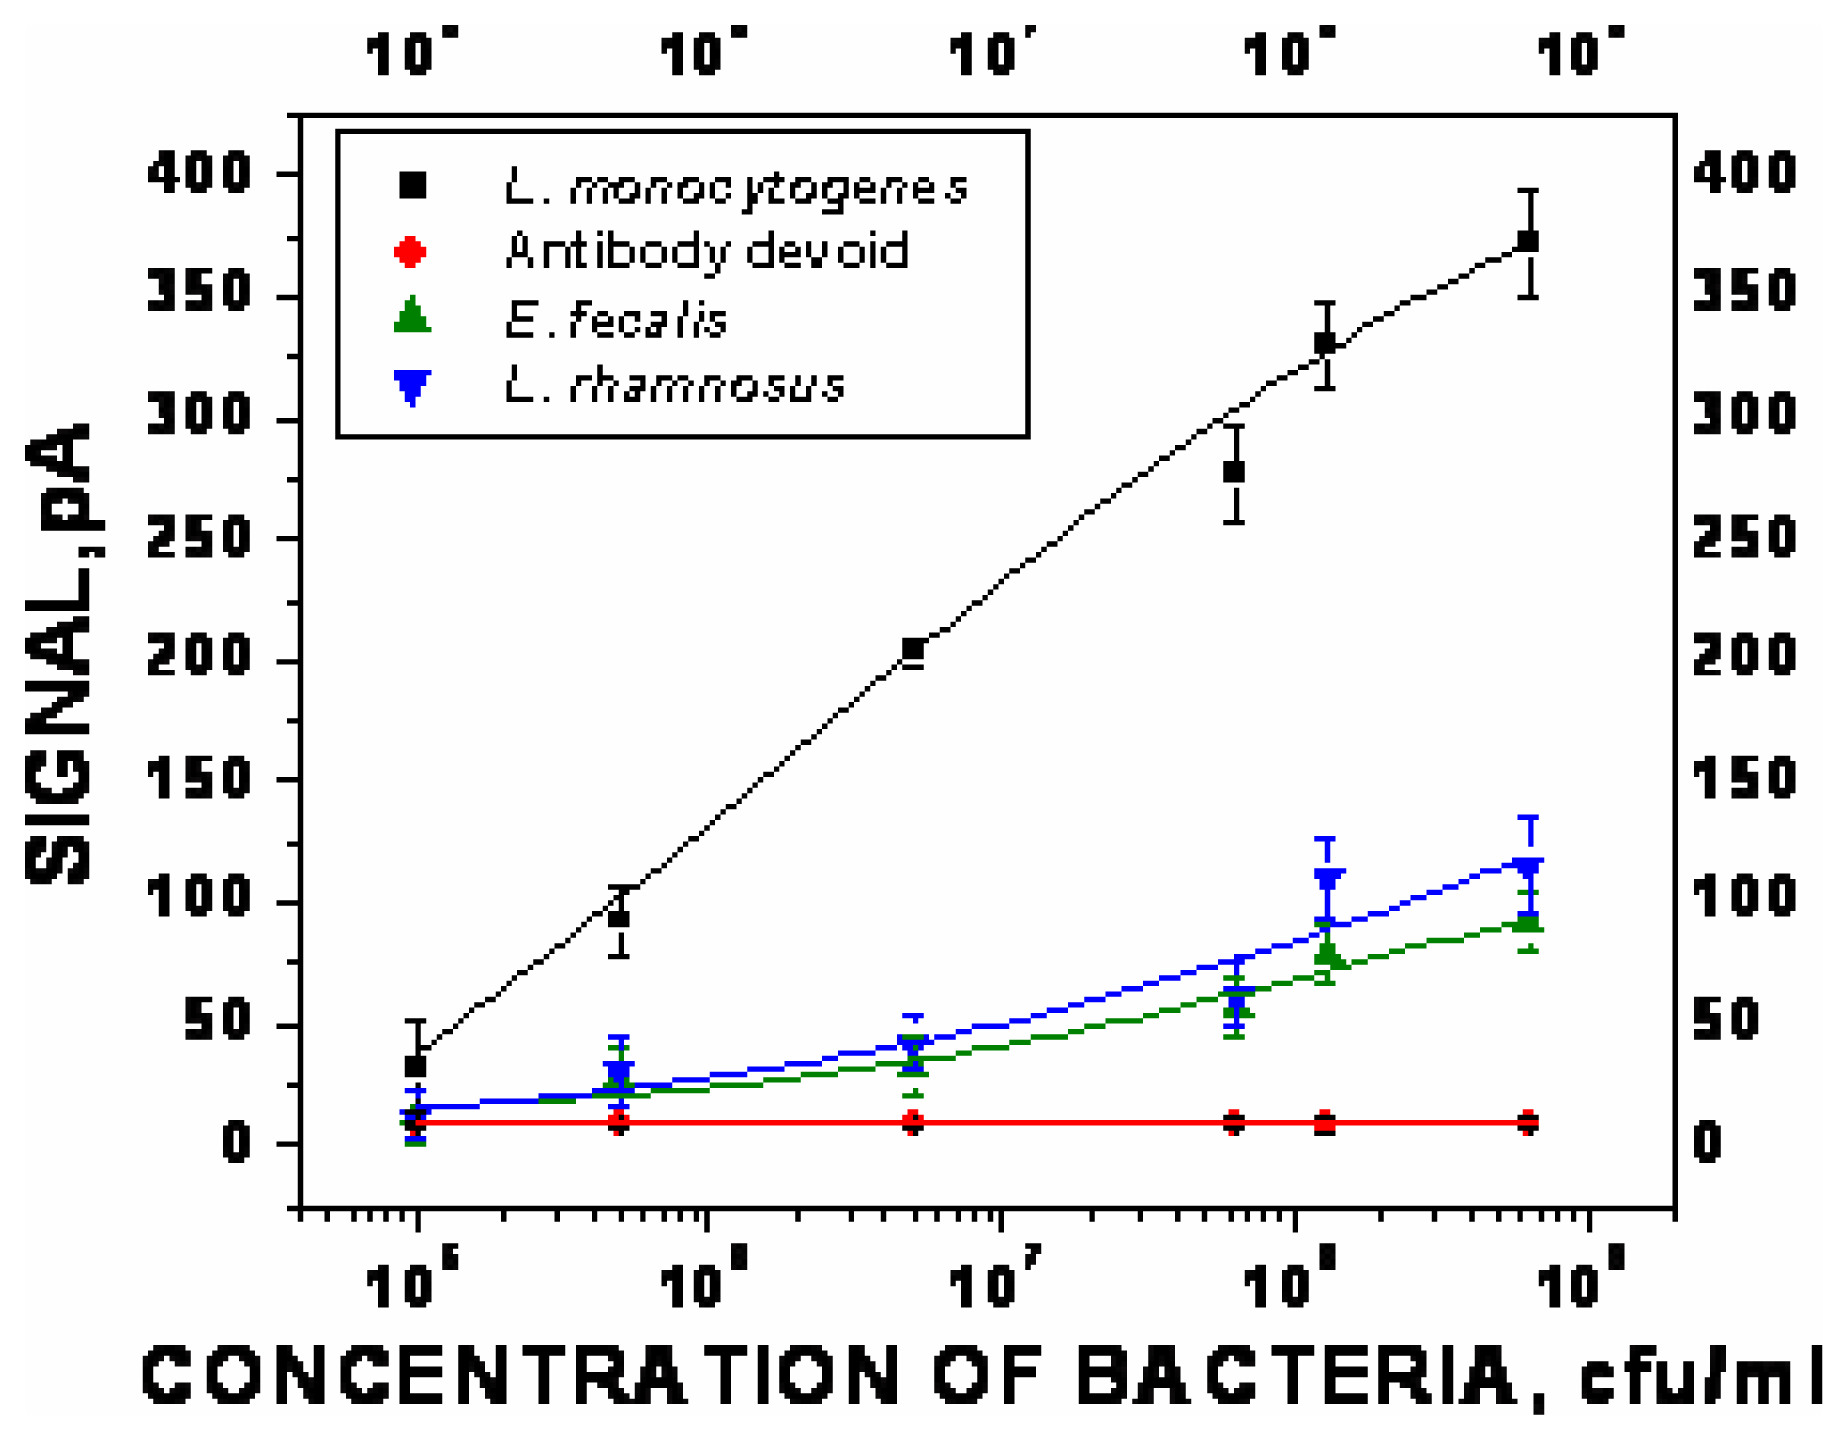
Optimization of sandwich assay for detection of Listeria monocytogenes
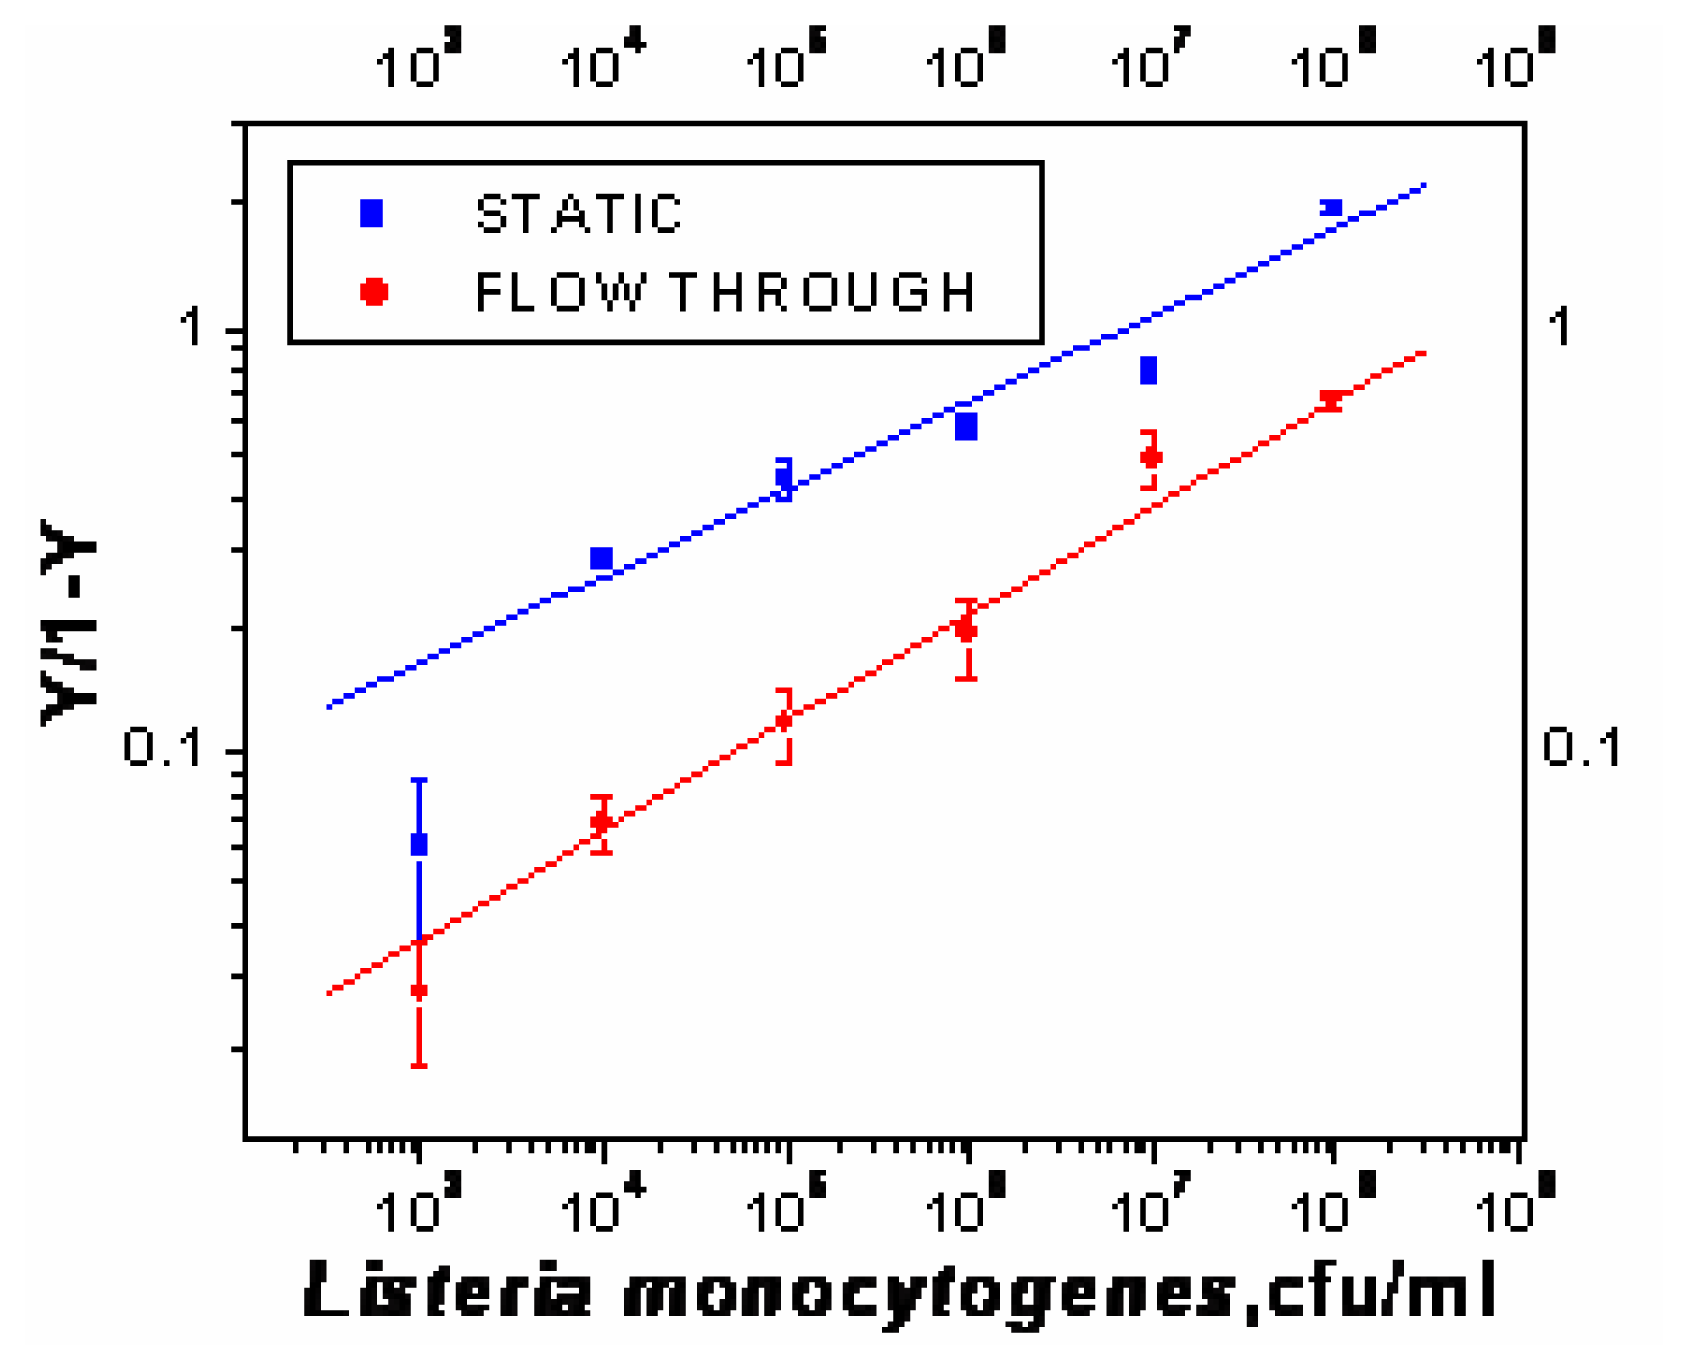
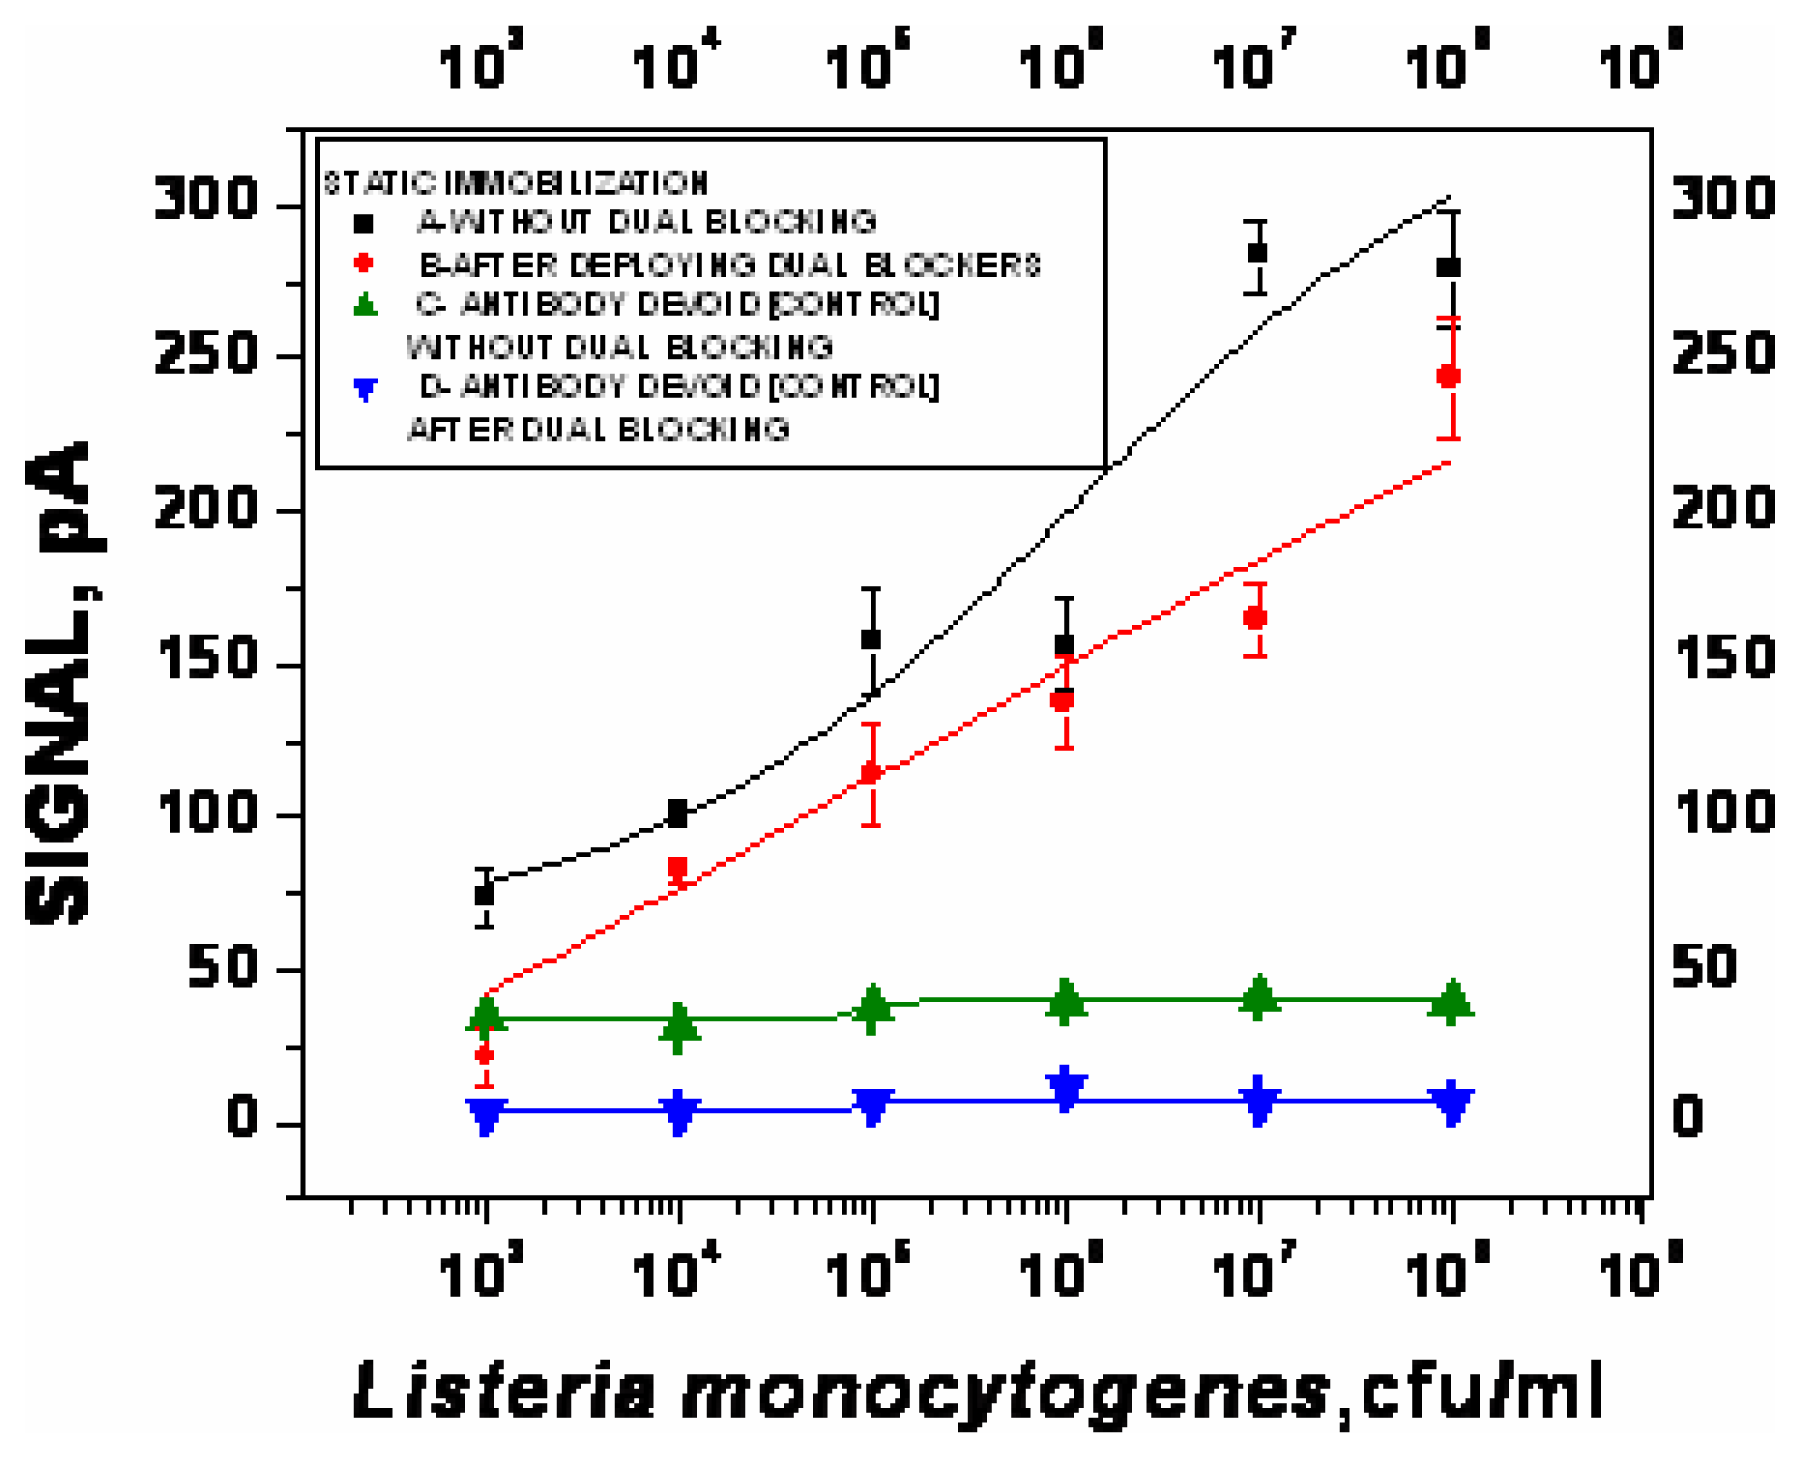
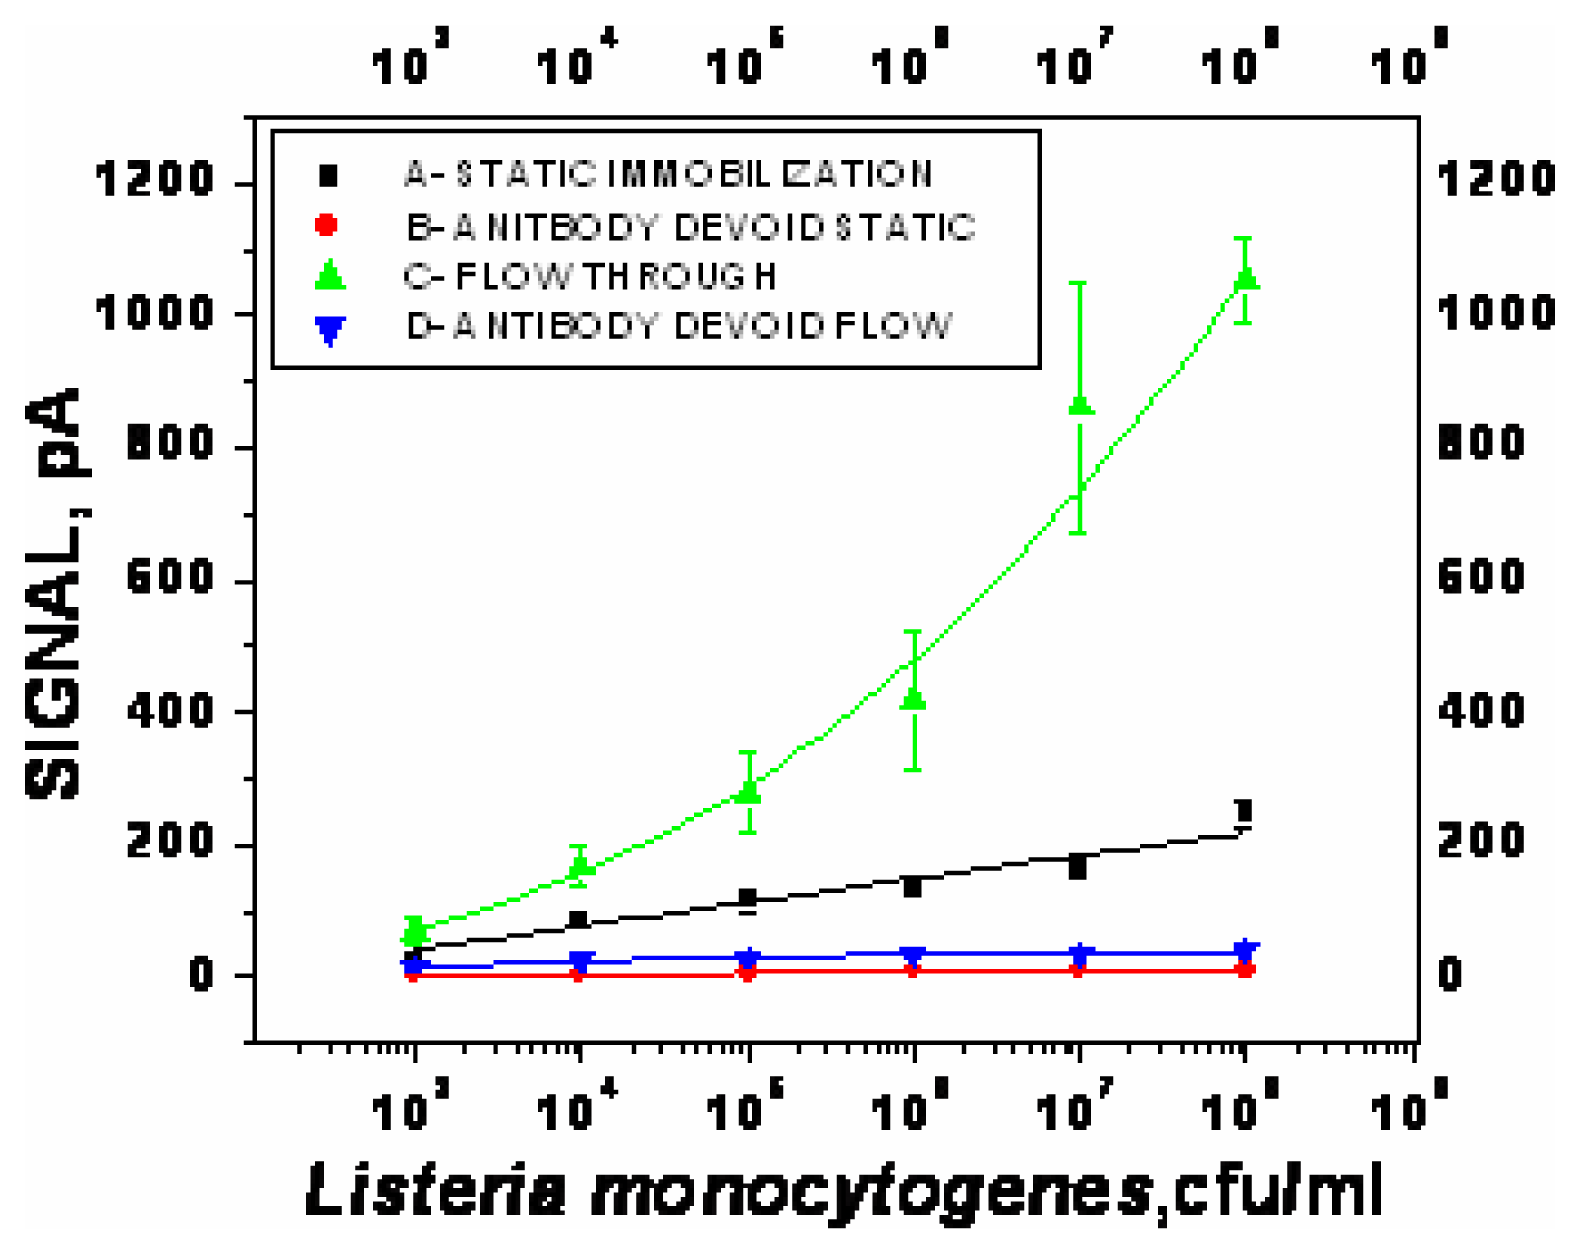
 - χ2= 4.6 ×10⁻¹, R2=0.99) and repeated under similar conditions. The two lower lines (
 - χ2=5434.6, R2=0.74;
 - χ2=9.5×10⁻¹, R2=0.97) represent the sigmoid fit of signals obtained without any antibody immobilization (controls) in the static and flow through mode respectively.
Analysis of spiked food samples with RAPTOR
Experimental Section
Bacteria and media
Frankfurter sample preparation
Reagents and antibodies
Antibody labeling
Fiber preparations and instrument setup
- (i)
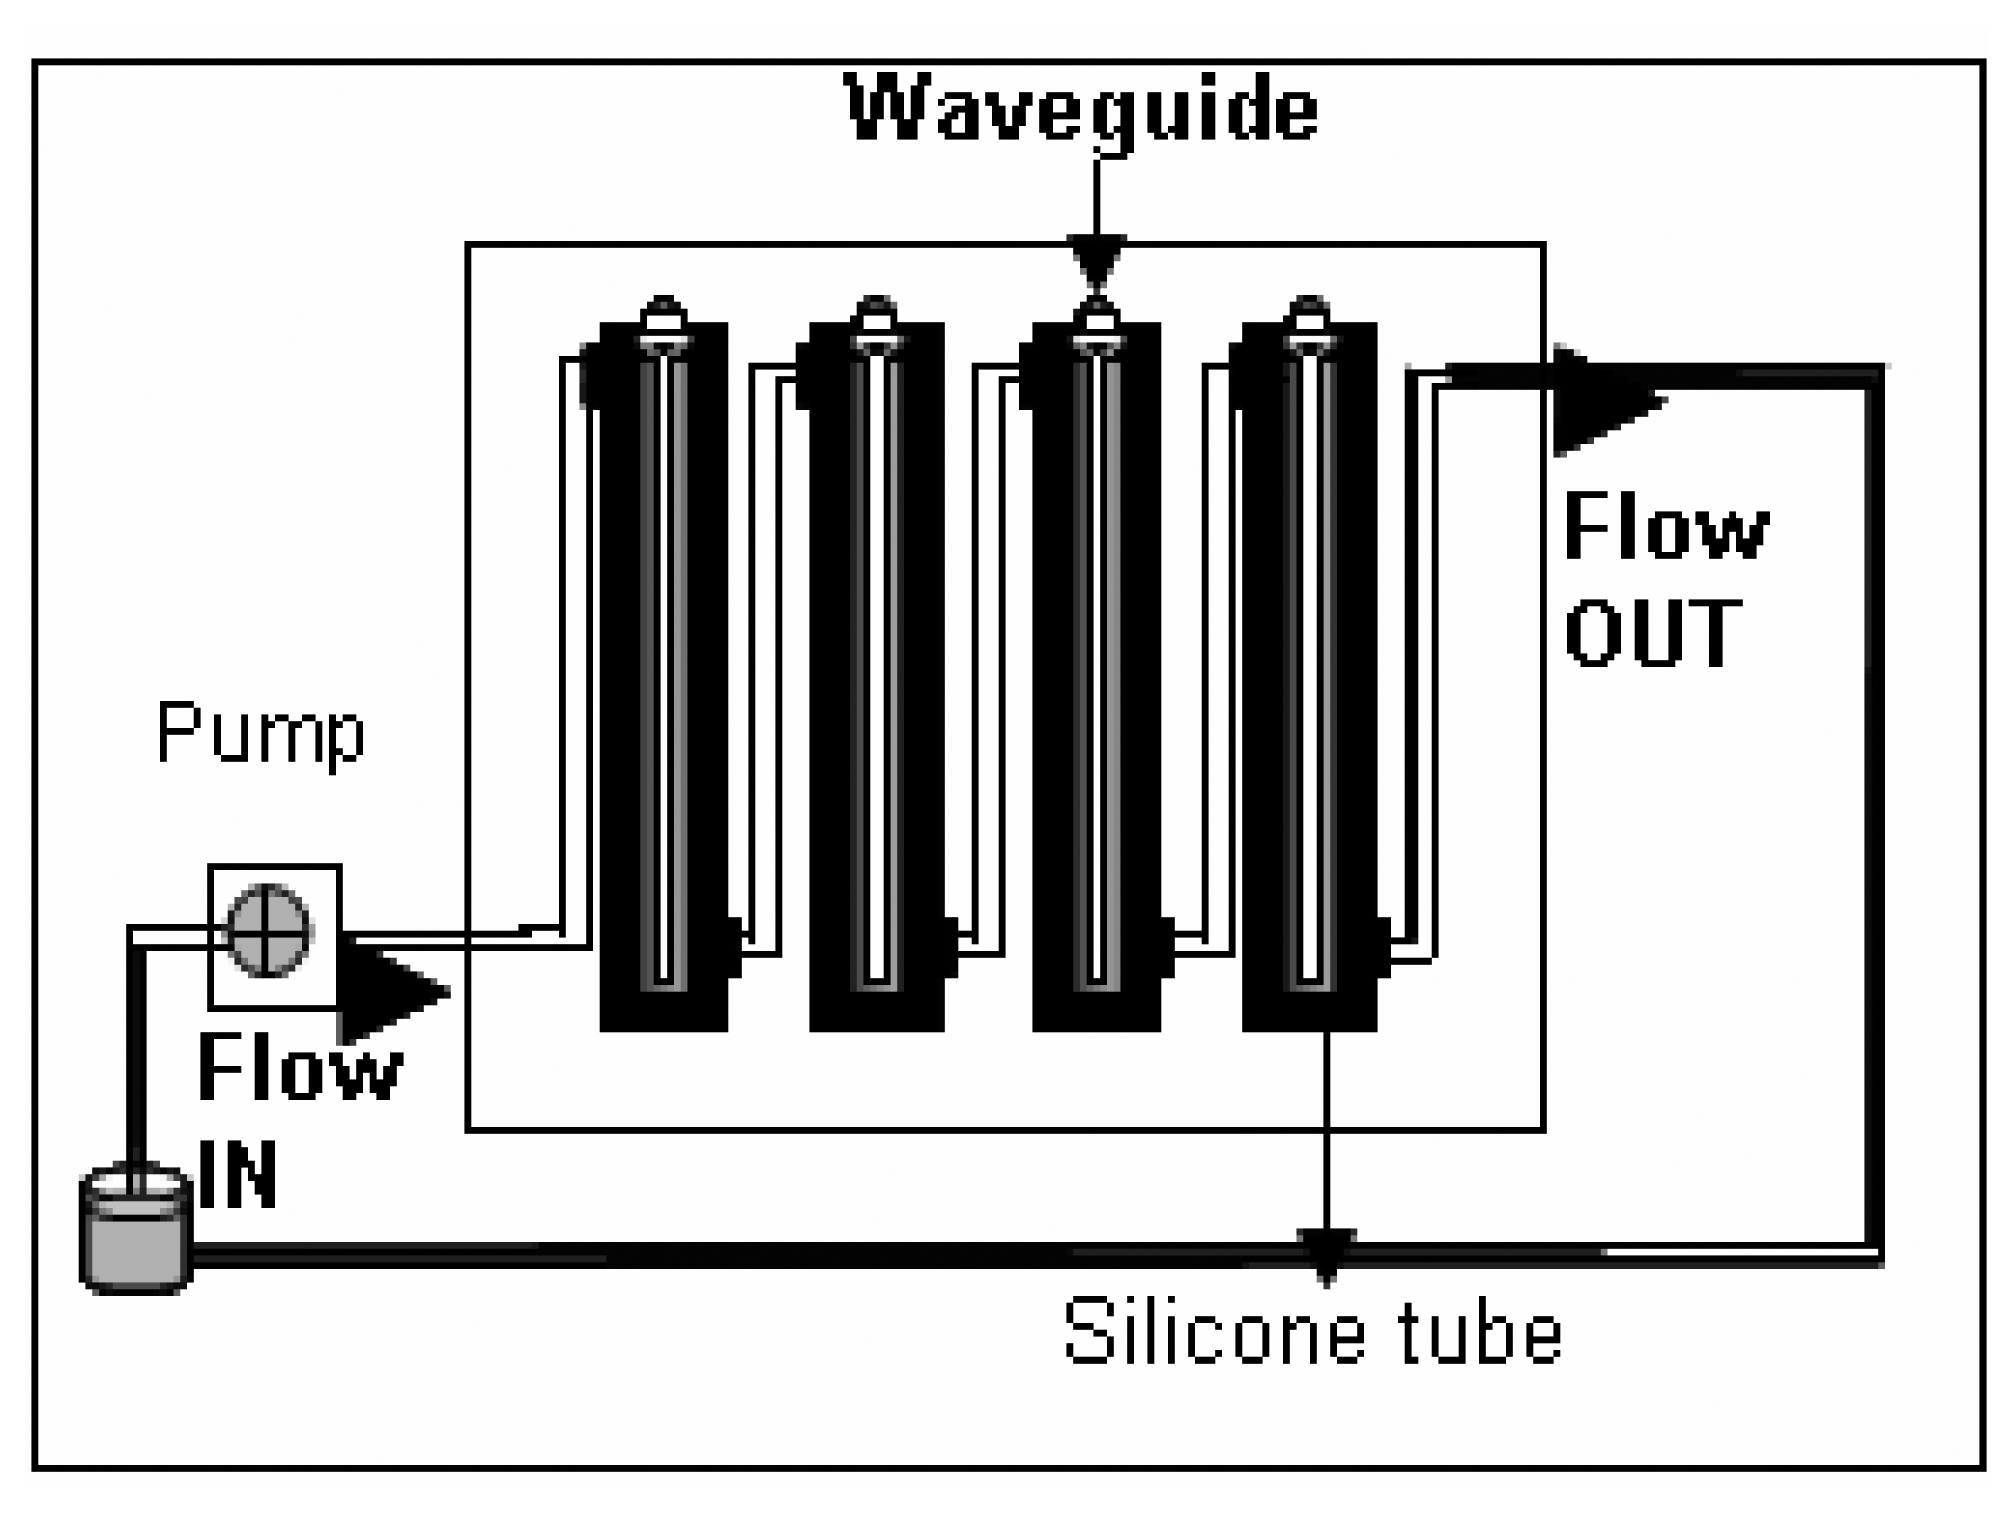
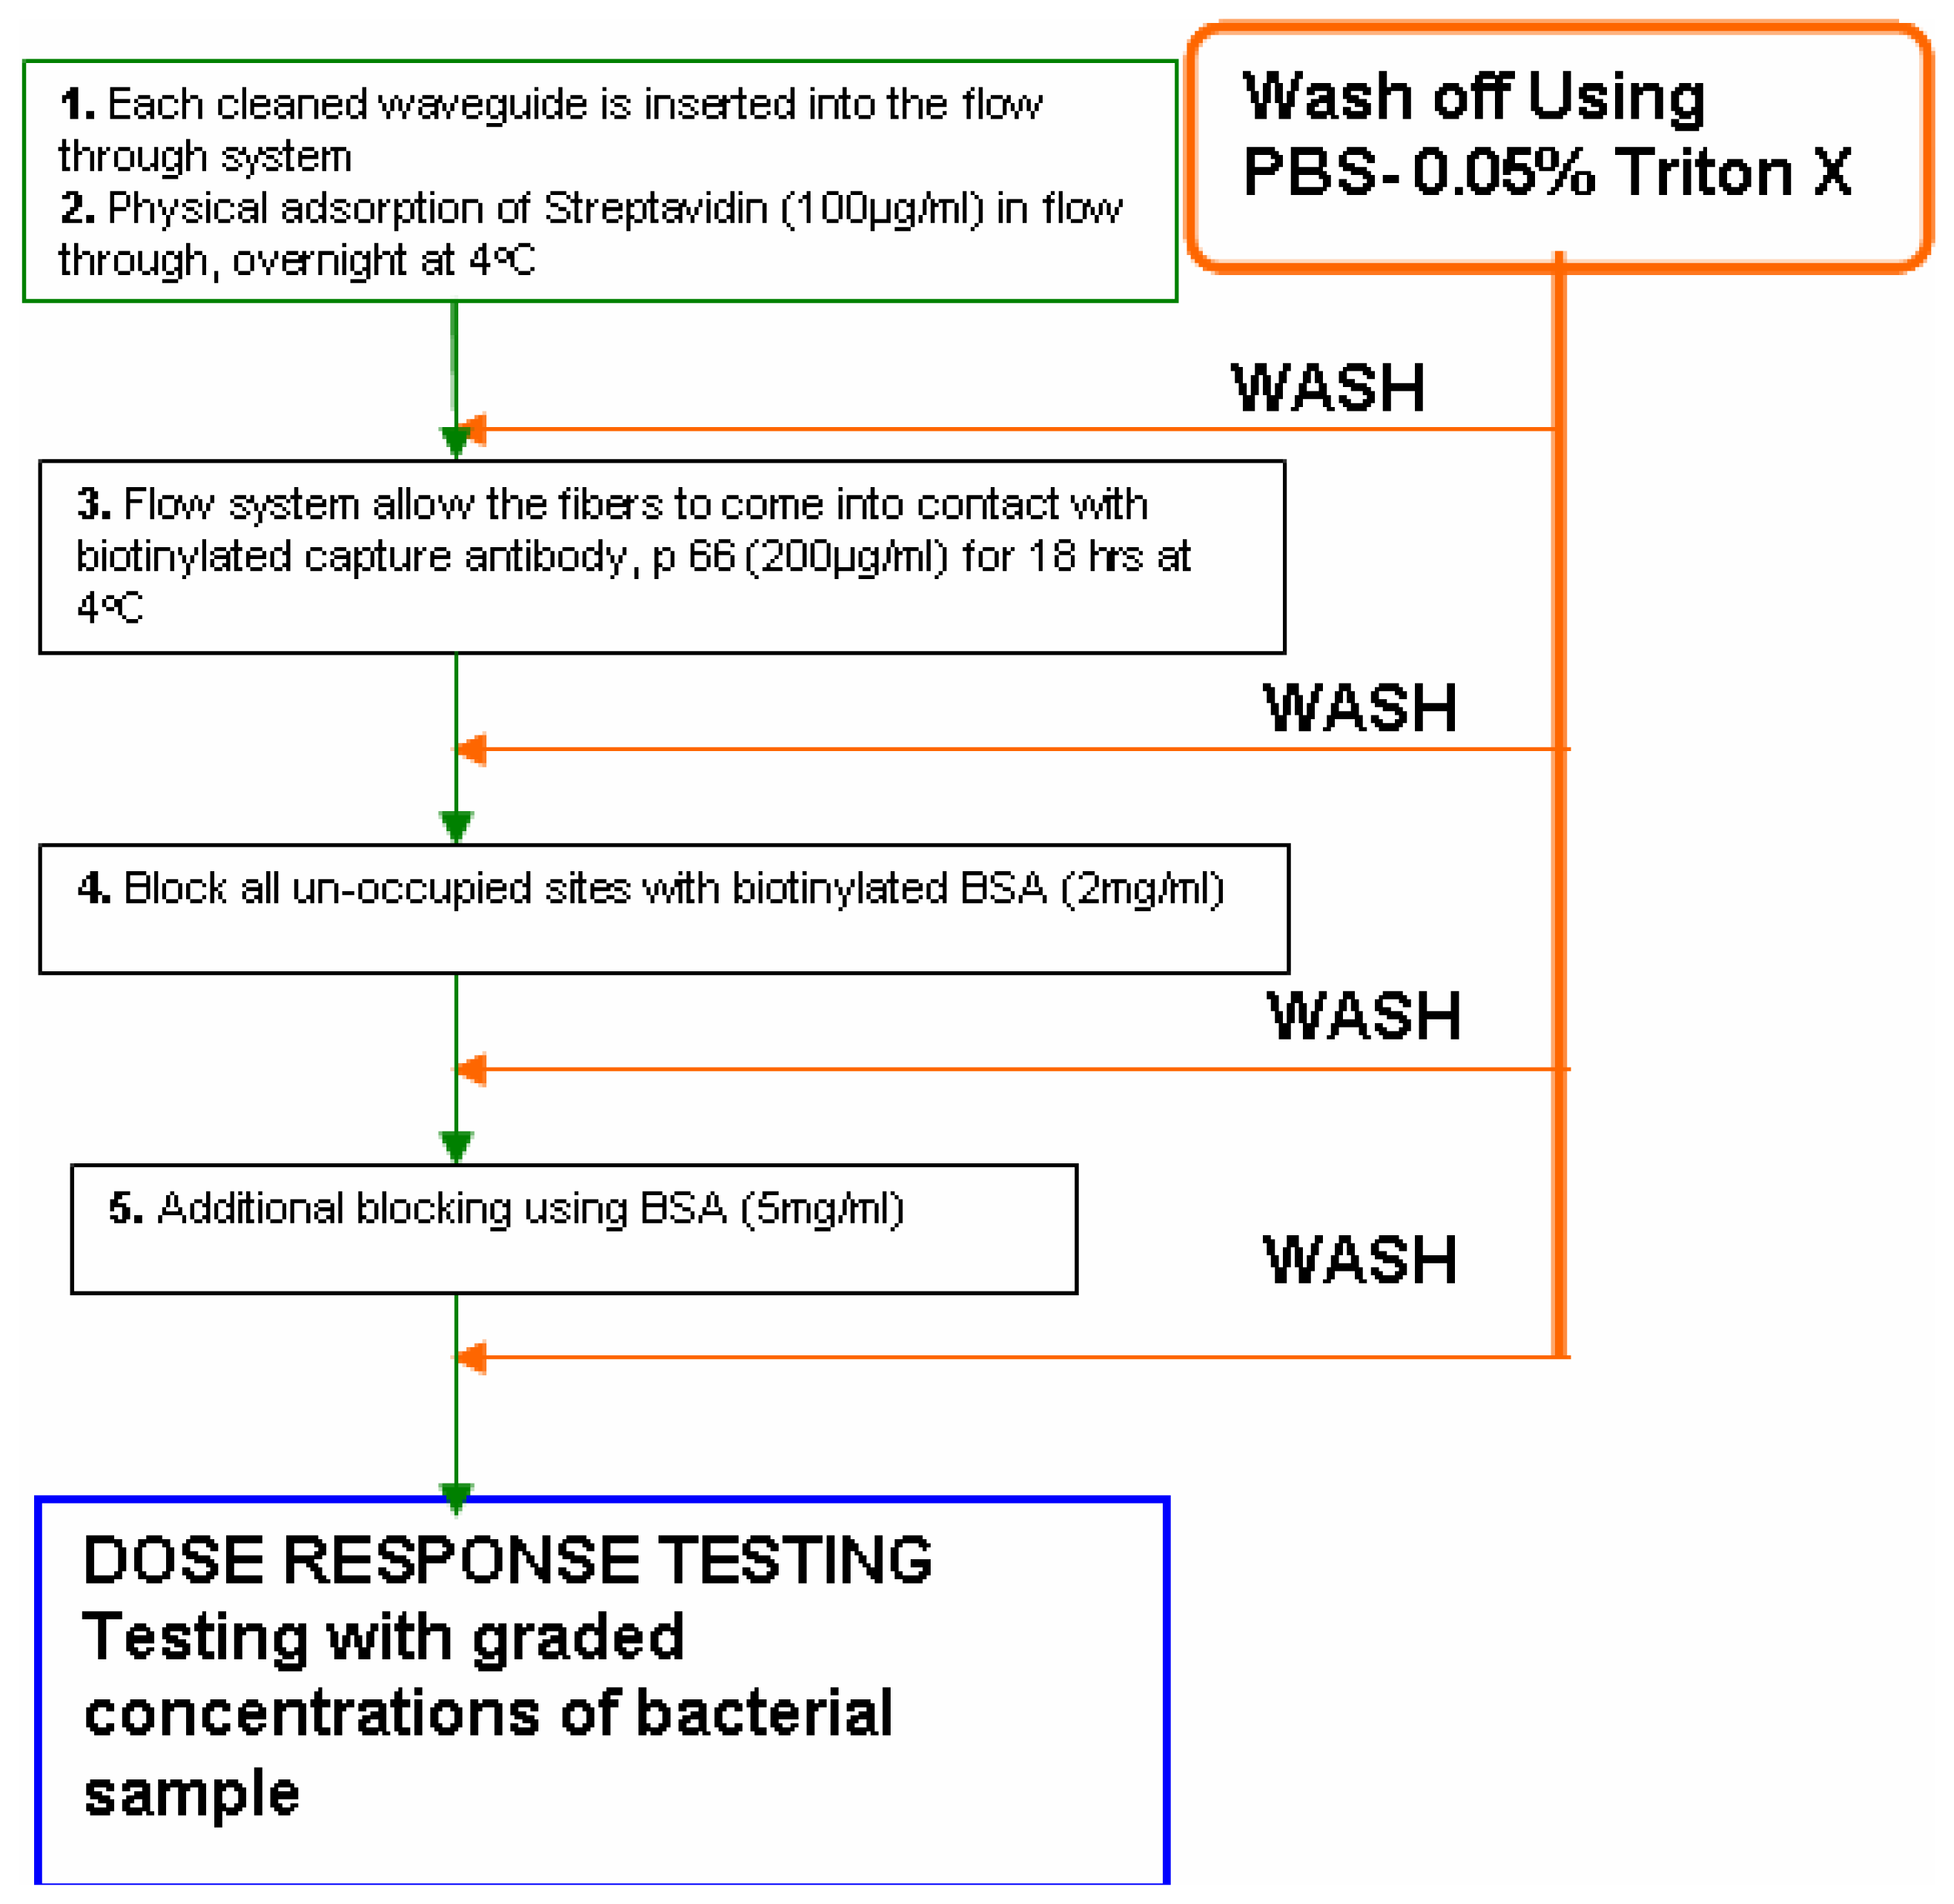
- The flow- through systemPolyclonal antibodies for L. monocytogenes were immobilized onto the polystyrene fibers of the RAPTOR™ using a flow-through system as follows. The system essentially consisted of four silicone tubes provided with inlets and outlets for flow through of the fluids as shown in Fig 1. All four tubes were connected in series with silicone tubing (inner diameter of 0.64 mm). All fluids were pumped using a peristaltic pump at 150 μl/min. Four fiber optic waveguides (precleaned in 50% ethanol, air-dried and further cleaned by sonication in PBS buffer) were inserted into each of the silicone tubes and sealed. All stages of incubations were done at 4°C, unless otherwise mentioned. Fig 2 shows the details of the different stages of the incubation of the fibers for the sandwich assay.Briefly, 100 μg/mL of streptavidin (in PBS) was allowed to run over the fibers overnight. Following a wash off step, using PBS-Triton (0.02 M phosphate buffered saline (PBS) containing 0.05 % Triton X-100), the fibers were treated with 200 μg/mL of a biotinylated capture antibody (PAb-P66) in PBS for 18 h. Then, a two stage blocking step was deployed so as to prevent non-specific binding. At first, all the fibers were blocked with b-BSA (2 mg/mL) followed by a wash off and further blocking of the fiber surface was achieved using BSA (5 mg/mL). This blocking protocol was developed after comparing with different blockers.
- (ii)
- The static immobilization systemBriefly, the static immobilization process consisted of inserting fibers into 100 μl pipette tips with the dispensing ends sealed with a sealant and incubated overnight at 4°C with 90 μl of 100 μg/ml streptavidin (in PBS). Fibers were then rinsed with PBS-Triton and incubated with 90 μl of 200 μg/ml biotinylated capture antibody (LM PAb or PAb-P66) in PBS at 4°C for 18 h in a pipette tip [10]. Finally, a two stage blocking of the fibers using biotinylated BSA and BSA as described above was carried out to improve the sensor response to L. monocytogenes. For this purpose, one of the two waveguides which were immobilized with antibody P66 was not blocked while the other one received two stage blocking. Two waveguides without immobilized antibody served as controls. Of these two, one received two-stage blocking while the remainder received no blocking.
- (iii)
- The coupon setupWaveguides with capture antibodies were mounted into the disposable coupon according to the manufacturer's direction (Research International). The waveguides were inserted through the mounting hole in the edge of the coupon and optically cured adhesive was applied at the mounting hole edge. The coupon was then put under a UV light for 40 min to cure the glue. Once the fibers had been glued into the coupon, the coupon cover tape was applied to form the last surface of the fluidics channels.
- (iv)
- Automated RAPTOR assayAn assembled coupon was inserted into the RAPTOR™ and measurements were done automatically by running a pre-programmed baseline recipe for each baseline reading and an assay recipe for each sample reading. During the baseline recipe, the fibers were first incubated with labeled detection antibody (MAb-C11E9) for 5 min. Then the labeled- antibody was returned to the holding vial and the fibers were rinsed three times with PBS-Triton. The laser diodes excited each of the four fibers and the fluorescence signal (baseline signal) was recorded for 6 s.The assay recipe consisted of incubating the fibers with a 0.9 ml sample for 8 min, rinsing three times with PBS-Triton, and incubating the fibers with labeled antibody for 5 min. After the labeled antibody incubation, the antibody was returned to the holding vial for next measurement and the fibers were rinsed again. Finally, the excitation lasers were turned on, and the fluorescence signal was recorded for 6 s.
Sandwich assay
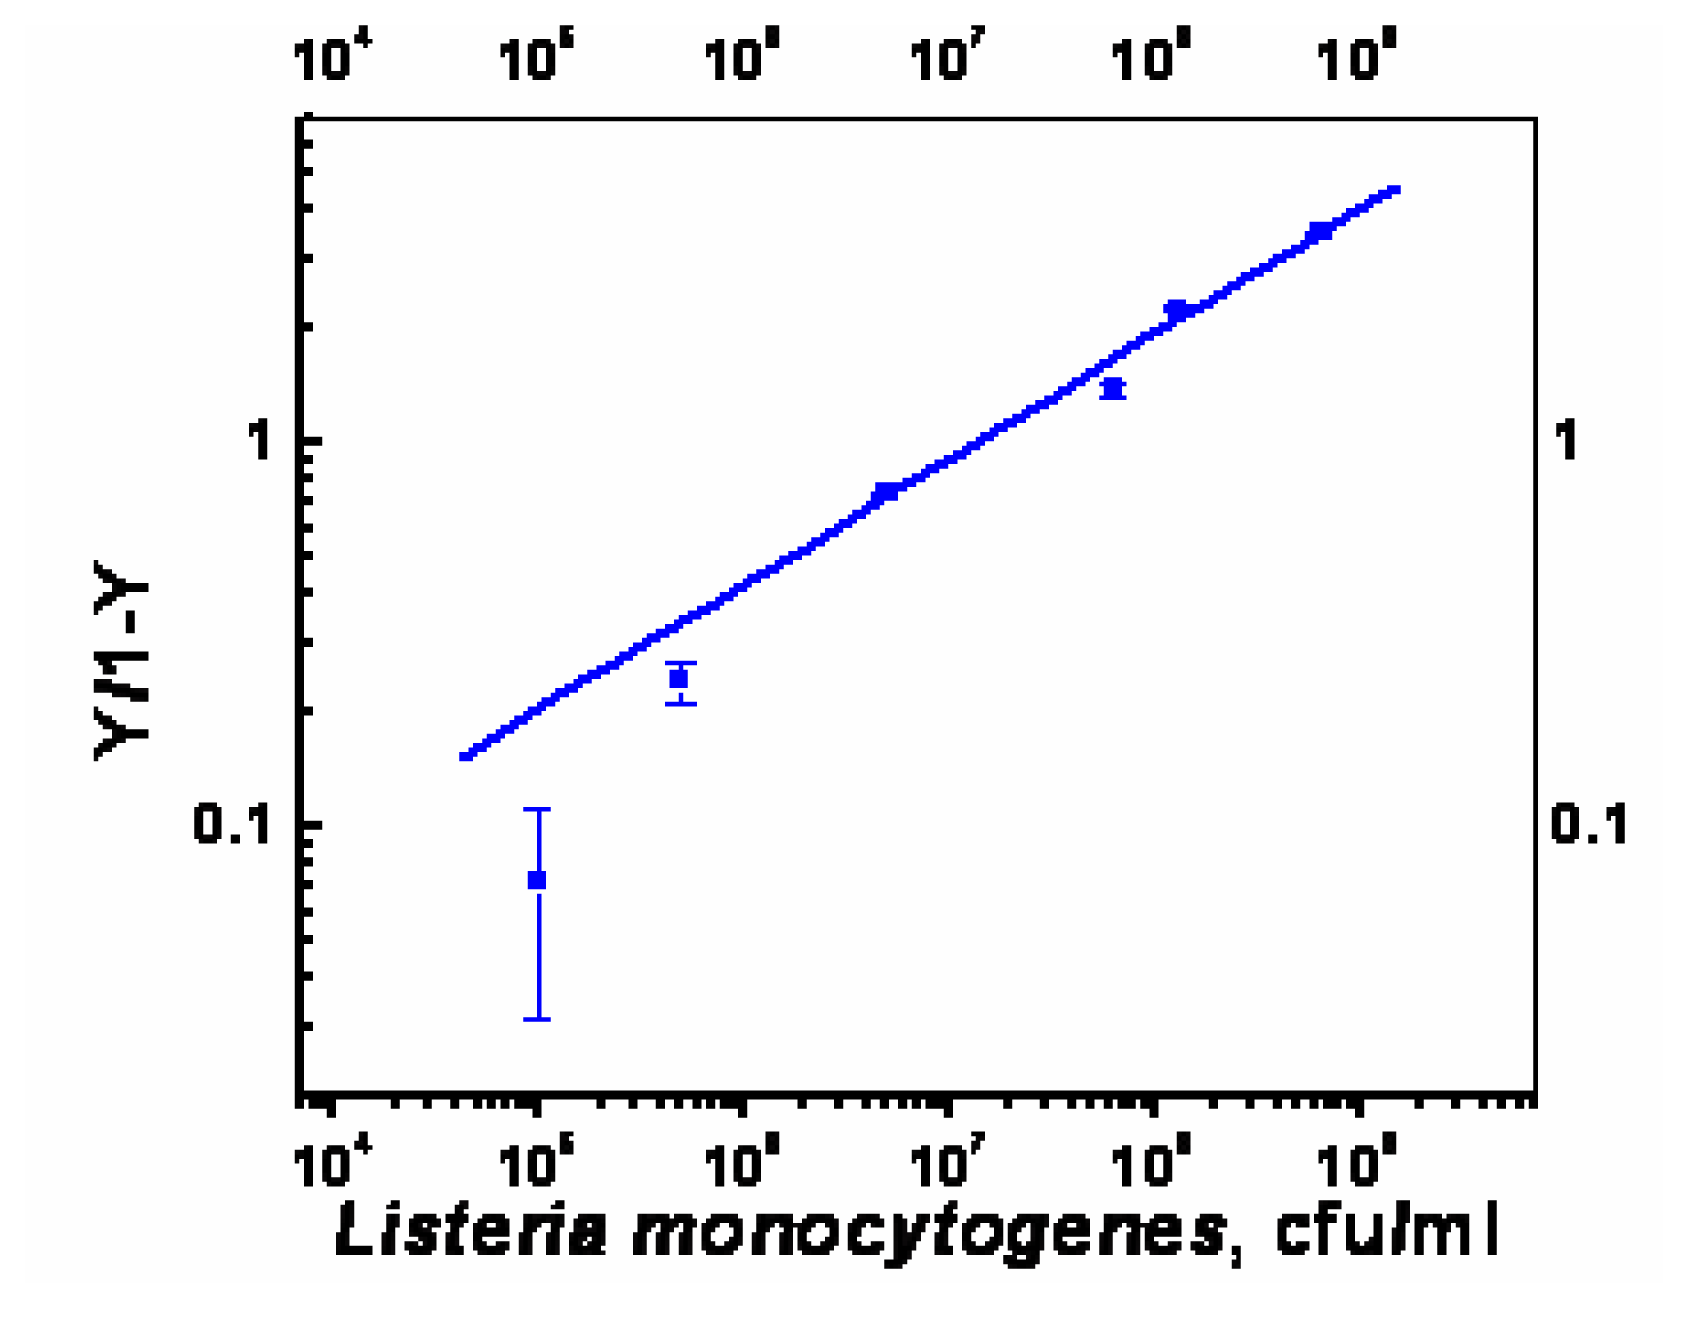
Data analyses
Acknowledgments
References
- Donnelly, C. W. Listeria monocytogenes: A continuing challenge. Nutr. Rev. 2001, 59, 183–194. [Google Scholar]
- Rocourt, J.; BenEmbarek, P.; Toyofuku, H.; Schlundt, J. Quantitative risk assessment of Listeria monocytogenes in reaty-to-eat foods: the FAO/WHO approach. FEMS Immunol. Med. Mircobiol. 2003, 35, 263–267. [Google Scholar]
- Gasanov, U.; Hughes, D.; Hansbro, P.M. Methods for the isolation and identification of Listeria spp and Listeria monocytogenes: a review. FEMS Microbiol. Rev. 2005, 29, 851–875. [Google Scholar]
- Taitt, C. R.; Anderson, G. P.; Ligler, F. S. Evanescent wave fluorescence biosensors. Biosens. Bioelectron. 2005, 20, 2470–2487. [Google Scholar]
- Marazuela, M. D.; Moreno-Bondi, M. C. Fiber-optic biosensors - an overview. Anal. Bioanal. Chem. 2002, 372, 664–682. [Google Scholar]
- Donaldson, K. A.; Kramer, M. F.; Lim, D. V. A rapid detection method for Vaccinia virus, the surrogate for smallpox virus. Biosens. Bioelectron. 2004, 20, 322–327. [Google Scholar]
- DeMarco, D. R.; Saaski, E. W.; McCrae, D. A.; Lim, D. V. Rapid detection of Escherichia coli O157:H7 in ground beef using a fiber-optic biosensor. J. Food Prot. 1999, 62, 711–716. [Google Scholar]
- Anderson, G. P.; King, K. D.; Cuttino, D. S.; Whelan, J. P.; Ligler, F. S.; MacKrell, J. F.; Bovais, C. S.; Indyke, D. K.; Foch, R. J. Biological agent detection with the use of an airborne biosensor. Field Anal. Chem. Technol. 1999, 3, 307–314. [Google Scholar]
- Bhunia, A. K.; Geng, T.; Lathrop, A. A.; Valadez, A.; Morgan, M. T. Optical immunosensors for detection of Listeria monocytogenes and Salmonella Enteritidis from food. Proc. SPIE 2004, 5271, 1–6. [Google Scholar]
- Geng, T.; Morgan, M. T.; Bhunia, A. K. Detection of low levels of Listeria monocytogenes cells by using a fiber-optic immunosensor. Appl. Environ. Microbiol. 2004, 70, 6138–6146. [Google Scholar]
- Tims, T. B.; Dickey, S. S.; Demarco, D. R.; Lim, D. V. Detection of low levels of Listeria monocytogenes within 20 hours using an evanescent wave biosensor. Am. Clin. Lab. 2001, 20, 28–29. [Google Scholar]
- Jung, C. C.; Saaski, E. W.; McCrae, D. A.; Lingerfelt, B. M.; Anderson, G. P. RAPTOR: A fluoroimmunoassay-based fiber optic sensor for rapid detection of biological threats. IEEE Sens. J. 2003, 3, 352–360. [Google Scholar]
- Kramer, M. F.; Lim, D. V. A rapid and automated fiber optic-based biosensor assay for the detection of Salmonella in spent irrigation water used in the sprouting of sprout seeds. J. Food Prot. 2004, 67, 46–52. [Google Scholar]
- Anderson, G. P.; Nerurkar, N. L. Improved fluoroimmunoassays using the dye Alexa Fluor 647 with the RAPTOR, a fiber optic biosensor. J. Immunol. Methods 2002, 271, 17–24. [Google Scholar]
- Bhunia, A. K.; Ball, P. H.; Fuad, A. T.; Kurz, B. W.; Emerson, J. W.; Johnson, M. G. Development and characterization of a monoclonal antibody specific for Listeria monocytogenes and Listeria innocua. Infect. Immun. 1991, 59, 3176–3184. [Google Scholar]
- Dykes, G. A. Behaviour of Listeria monocytogenes on two processed meat products as influenced by temperature or attached growth during preincubation. Food Microbiol. 2003, 20, 91–96. [Google Scholar]
- Chen, W. T.; Ladisch, M. R.; Geng, T.; Bhunia, A. K. Membrane for selective capture of the microbial pathogen Listeria monocytogenes. AIChE J. 2005, 51, 3305–3308. [Google Scholar]
- Segel, I. H.; Segel, A. H. Biochemical Calculations; Wiley: New York, 1976. [Google Scholar]
- Petrenko, V. A.; Vodyanoy, V. J. Phage display for detection of biological threat agents. J. Microbiol. Methods 2003, 53, 253. [Google Scholar]
- Nanduri, V.; Sorokulova, I. B.; Samoylov, A.M.; Simonian, A.L.; Petrenko, V. A.; Vodyanoy, V. Phage as a molecular recognition element in biosensors immobilized by physical adsorption. Biosens. Bioelectron 2006. In Press. [Google Scholar]


| Capture antibody | Concentration (μg/ml) | Lowest detectable cell numbers (cfu/ml) | Response at the lowest detectable cell numbers (pA) |
|---|---|---|---|
| LM PAb | 10 | ∼1×10⁸ | 85.6 |
| 20 | ∼1×10⁴ | 18.3 | |
| PAb-P66 | 10 | ∼1×10³ | 26.4 |
| 20 | ∼1×10³ | 71.1 | |
| Immobilization of capture antibody, PAb-P66 | Effective Dissociation Constant, Kd (cfu/ml) | Binding Valency |
|---|---|---|
| Static | 4×10⁵ | 4.9 |
| Flow through (150μl/min) | 7×10⁴ | 3.9 |
| Number of cells inoculated/g | Cell number (cfu/ml) after enrichment | pH of the cell suspension after enrichment |
|---|---|---|
| 1 cfu/g | 5±0.6 × 10⁶ | 6.85 |
| 10 cfu/g | 5.4±0.6 × 10⁷ | 6.85 |
| 100 cfu/g | 6.2±0.6 × 10⁸ | 6.78 |
© 2006 by MDPI ( http://www.mdpi.org). Reproduction is permitted for noncommercial purposes.
Share and Cite
Nanduri, V.; Kim, G.; Morgan, M.T.; Ess, D.; Hahm, B.-K.; Kothapalli, A.; Valadez, A.; Geng, T.; Bhunia, A.K. Antibody Immobilization on Waveguides Using aFlow–Through System Shows Improved Listeria monocytogenesDetection in an Automated Fiber Optic Biosensor: RAPTORTM. Sensors 2006, 6, 808-822. https://doi.org/10.3390/s6080808
Nanduri V, Kim G, Morgan MT, Ess D, Hahm B-K, Kothapalli A, Valadez A, Geng T, Bhunia AK. Antibody Immobilization on Waveguides Using aFlow–Through System Shows Improved Listeria monocytogenesDetection in an Automated Fiber Optic Biosensor: RAPTORTM. Sensors. 2006; 6(8):808-822. https://doi.org/10.3390/s6080808
Chicago/Turabian StyleNanduri, Viswaprakash, Giyoung Kim, Mark T. Morgan, Daniel Ess, Byoung-Kwon Hahm, Aparna Kothapalli, Angela Valadez, Tao Geng, and Arun K. Bhunia. 2006. "Antibody Immobilization on Waveguides Using aFlow–Through System Shows Improved Listeria monocytogenesDetection in an Automated Fiber Optic Biosensor: RAPTORTM" Sensors 6, no. 8: 808-822. https://doi.org/10.3390/s6080808