Review

Biosensing with Luminescent Semiconductor Quantum Dots

1
Center for Bio/Molecular Science and Engineering, Code 6900, U.S. Naval Research Laboratory, Washington, DC 20375-5320, USA
2
Division of Optical Sciences, Code 5611, U.S. Naval Research Laboratory, Washington, DC 20375-5320, USA.
3
George Mason University, 10910 University Blvd, MS 4E3, Manassas, VA 20110 USA.
4
Chemical & Biomolecular Eng. Dept. Johns Hopkins University, Baltimore, MD 21218 USA
*
Authors to whom correspondence should be addressed.
Sensors 2006, 6(8), 925-953; https://doi.org/10.3390/s6080925
Submission received: 12 April 2006 / Accepted: 9 June 2005 / Published: 24 August 2006
(This article belongs to the Special Issue Supramolecular Sensors)

Abstract

:
Luminescent semiconductor nanocrystals or quantum dots (QDs) are a recently developed class of nanomaterial whose unique photophysical properties are helping to create a new generation of robust fluorescent biosensors. QD properties of interest for biosensing include high quantum yields, broad absorption spectra coupled to narrow size-tunable photoluminescent emissions and exceptional resistance to both photobleaching and chemical degradation. In this review, we examine the progress in adapting QDs for several predominantly in vitro biosensing applications including use in immunoassays, as generalized probes, in nucleic acid detection and fluorescence resonance energy transfer (FRET) - based sensing. We also describe several important considerations when working with QDs mainly centered on the choice of material(s) and appropriate strategies for attaching biomolecules to the QDs.

1. Introduction

The most common method of detecting and quantitating biomolecules still remains the use of fluorescence [1,2]. As such fluorescent probes have found widespread use in myriad biosensing applications including immunoassays, nucleic acid detection, resonance energy transfer studies, clinical/diagnostic assays and cellular labeling, to name but a few [1-3]. Many of the organic dye and protein-based fluorophores currently in use do, however, suffer from serious chemical and photophysical liabilities. These include pH dependence, self-quenching at high concentrations, susceptibility to photo-bleaching, short-term aqueous stability, narrow absorption windows coupled to broad red-tailed emission spectra via small Stokes shifts, and short excited state fluorescent lifetimes [1,2]. Over time, this has resulted in the synthesis of a vast library of fluorophores, many of which are geared towards very specific applications; for example the staining of cellular mitochondria organelles with MitoTracker dyes or using tetramethylrhodamine for resonance energy transfer quenching of a proximal fluorescein donor in a Taqman-based nucleic acid assay [1,4].
Since their first description in a biological context [5,6], colloidal luminescent semiconductor nanocrystals or quantum dots (QDs) have elicited a great deal of interest in the biosensing community due to their unique fluorescent properties. Cumulatively, these fluorescent properties may overcome some of the liabilities of conventional organic and protein-based fluorophores to help create a new generation of robust biosensors. Here we examine the progress in adapting QDs for various biosensing applications. For the purposes of this review we define biosensing loosely as the utilization of biomolecular specificity to detect and/or quantitate other molecules (which may or may not be of biological origin). This is distinct from using QDs to label/track cells or for in-vivo imaging, recently reviewed in references [7-12]. We also provide an overview of several important considerations when working with QDs including choice of material, capping ligand, effect of overall size, and the available methods for biofunctionalization.

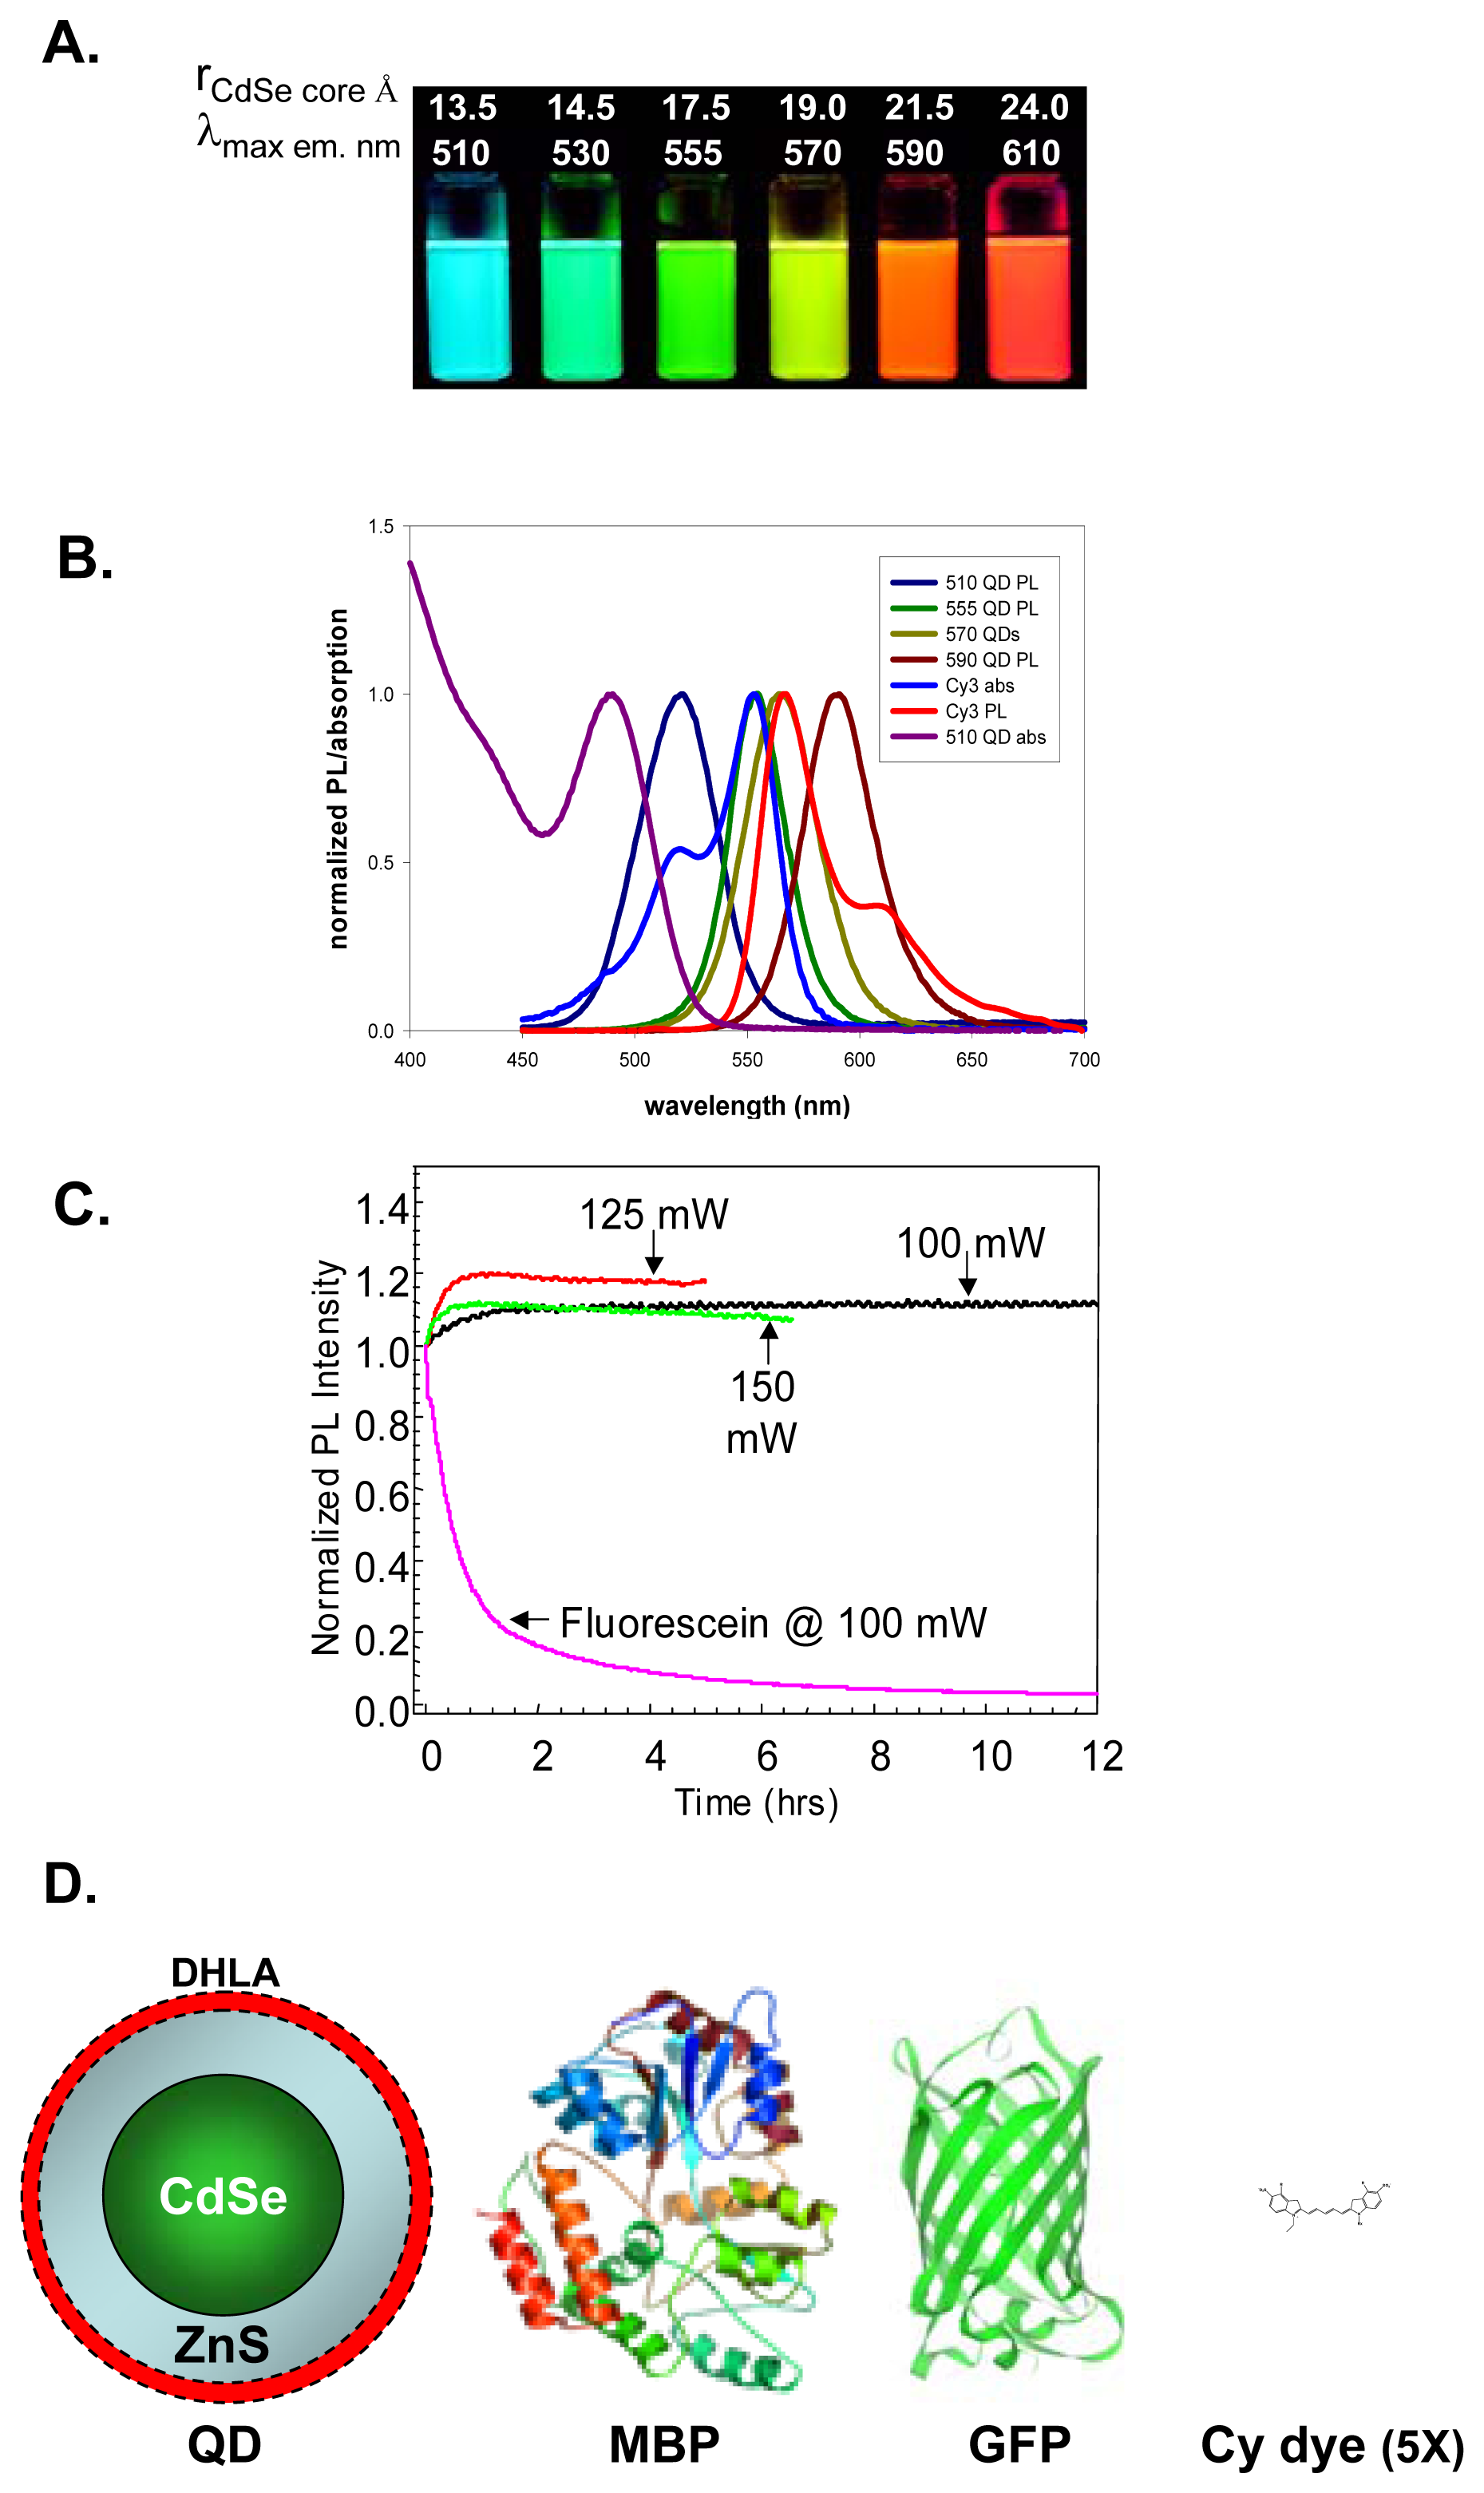
2. Synthesis and Properties of Luminescent Quantum Dots

The breakthrough in synthesizing high quality colloidal semiconductor QDs can be traced to the work of Murray, Norris and Bawendi at the Massachusetts Institute of Technology [13]. They showed that narrowly dispersed (8-11%) highly crystalline CdSe QDs could be synthesized at high temperatures using a mixture of organometallic precursors and trioctyl phosphine/trioctyl phosphine oxide (TOP/TOPO) growth solvent /ligands [13]. This same reaction can be used to further overcoat the CdSe core with a layer of wider bandgap semiconductor such as ZnS and CdS [14-16]. This secondary layer passivates surface traps and increases the photoluminescent yield [14,17,18]. Peng and coworkers made further refinements to this scheme by using less pyrophoric precursors such as CdO and Cd acetate [19]. To date, CdSe/ZnS core/shell QDs remain among the best available for almost all biological applications [8,14,20,21]. Other QDs including ZnS, CdS, CdTe and PbSe with emissions ranging from the UV to the IR have also been synthesized, however these are not as common in biological assays [8,20,21]. In a recent review, Michalet provided an excellent overview of the correlation between several constituent QD materials, their core size, and their emission maxima [8]. Various types of QDs, including those dispersed in both aqueous solutions and organic solvents, can also be obtained commercially from Invitrogen Corporation ( www.invitrogen.com) or Evident Technologies ( www.evidenttech.com).
Table I presents an overview of several QD properties as compared to those of organic and protein based fluorophores (see also Figure 1).
Several QD photophysical properties clearly stand out and are unparalleled in comparison to conventional fluorophores. The first is the ability to tune the photoluminescent emission as a function of core size and quantum confinement effects for binary combinations of semiconductors. This unique property allows one to control or ‘dial in’ the emission of the QD by controlling the core size [10,16,22,23]. The second property is the broad absorption spectra which start to the blue of the QDs' emission and increases steadily towards the UV. In fact, the molar extinction coefficients of QDs are 10-100x larger than those of conventional dyes and can reach values of several million [24,25]. This leads to large effective stokes shifts and allows one to efficiently excite a mixed population of QDs at a single wavelength far removed (> 100 nm) from their cumulative emissions, see Figure 1. This obviously suggests that QDs could also be used for multiplexing or the simultaneous detection of multiple (fluorescent) signals. This feature can be hard to achieve with conventional fluorophores due to their overlapping absorption/emission spectra [26]. QDs also have relatively high quantum yields and high resistance to both photobleaching (Figure 1C) and chemical degradation which, when combined with the aforementioned properties, have made QDs all-around attractive fluorophores for biosensing [8,20,21]. The reader will note that many of the biosensing strategies described hereafter seek to specifically exploit many of the same QD attributes to improve a particular application.
The physical size of the QD material deserves some discussion. QDs are almost an order of magnitude larger than many of the conventional organic dyes in use (Figure 1D) [1,8]. CdSe-ZnS core-shell materials can range in size from 2 nm diameter (480 nm emission) to 8 nm (660 nm emission) while the redder CdTe-CdSe nanocrystals can range from 4 nm diameter (650 nm emission) to > 9 nm (850 nm emission). Redder emitting QDs tend to be anisotropic and can have large aspect ratios [8]. However, the size need not be considered a liability for many applications as this can provide several inherent benefits with it. Multiple proteins, peptides or other chemical moieties can be attached to a single QD surface. Each of these can then impart some unique property to the resultant QD-conjugate, thus engendering multi-functionality. A putative example would be a QD conjugated with a tumor cell targeting antibody, a cell penetrating peptide and a radiolabel [8]. Alternatively, attaching multiple proteins per QD can increase the avidity and help lower the limit of detection. Cumulatively, the size can allow the QD to function effectively both as a fluorophore and as a multifunctional nanoscaffold for attachment of biomolecules or other moieties.

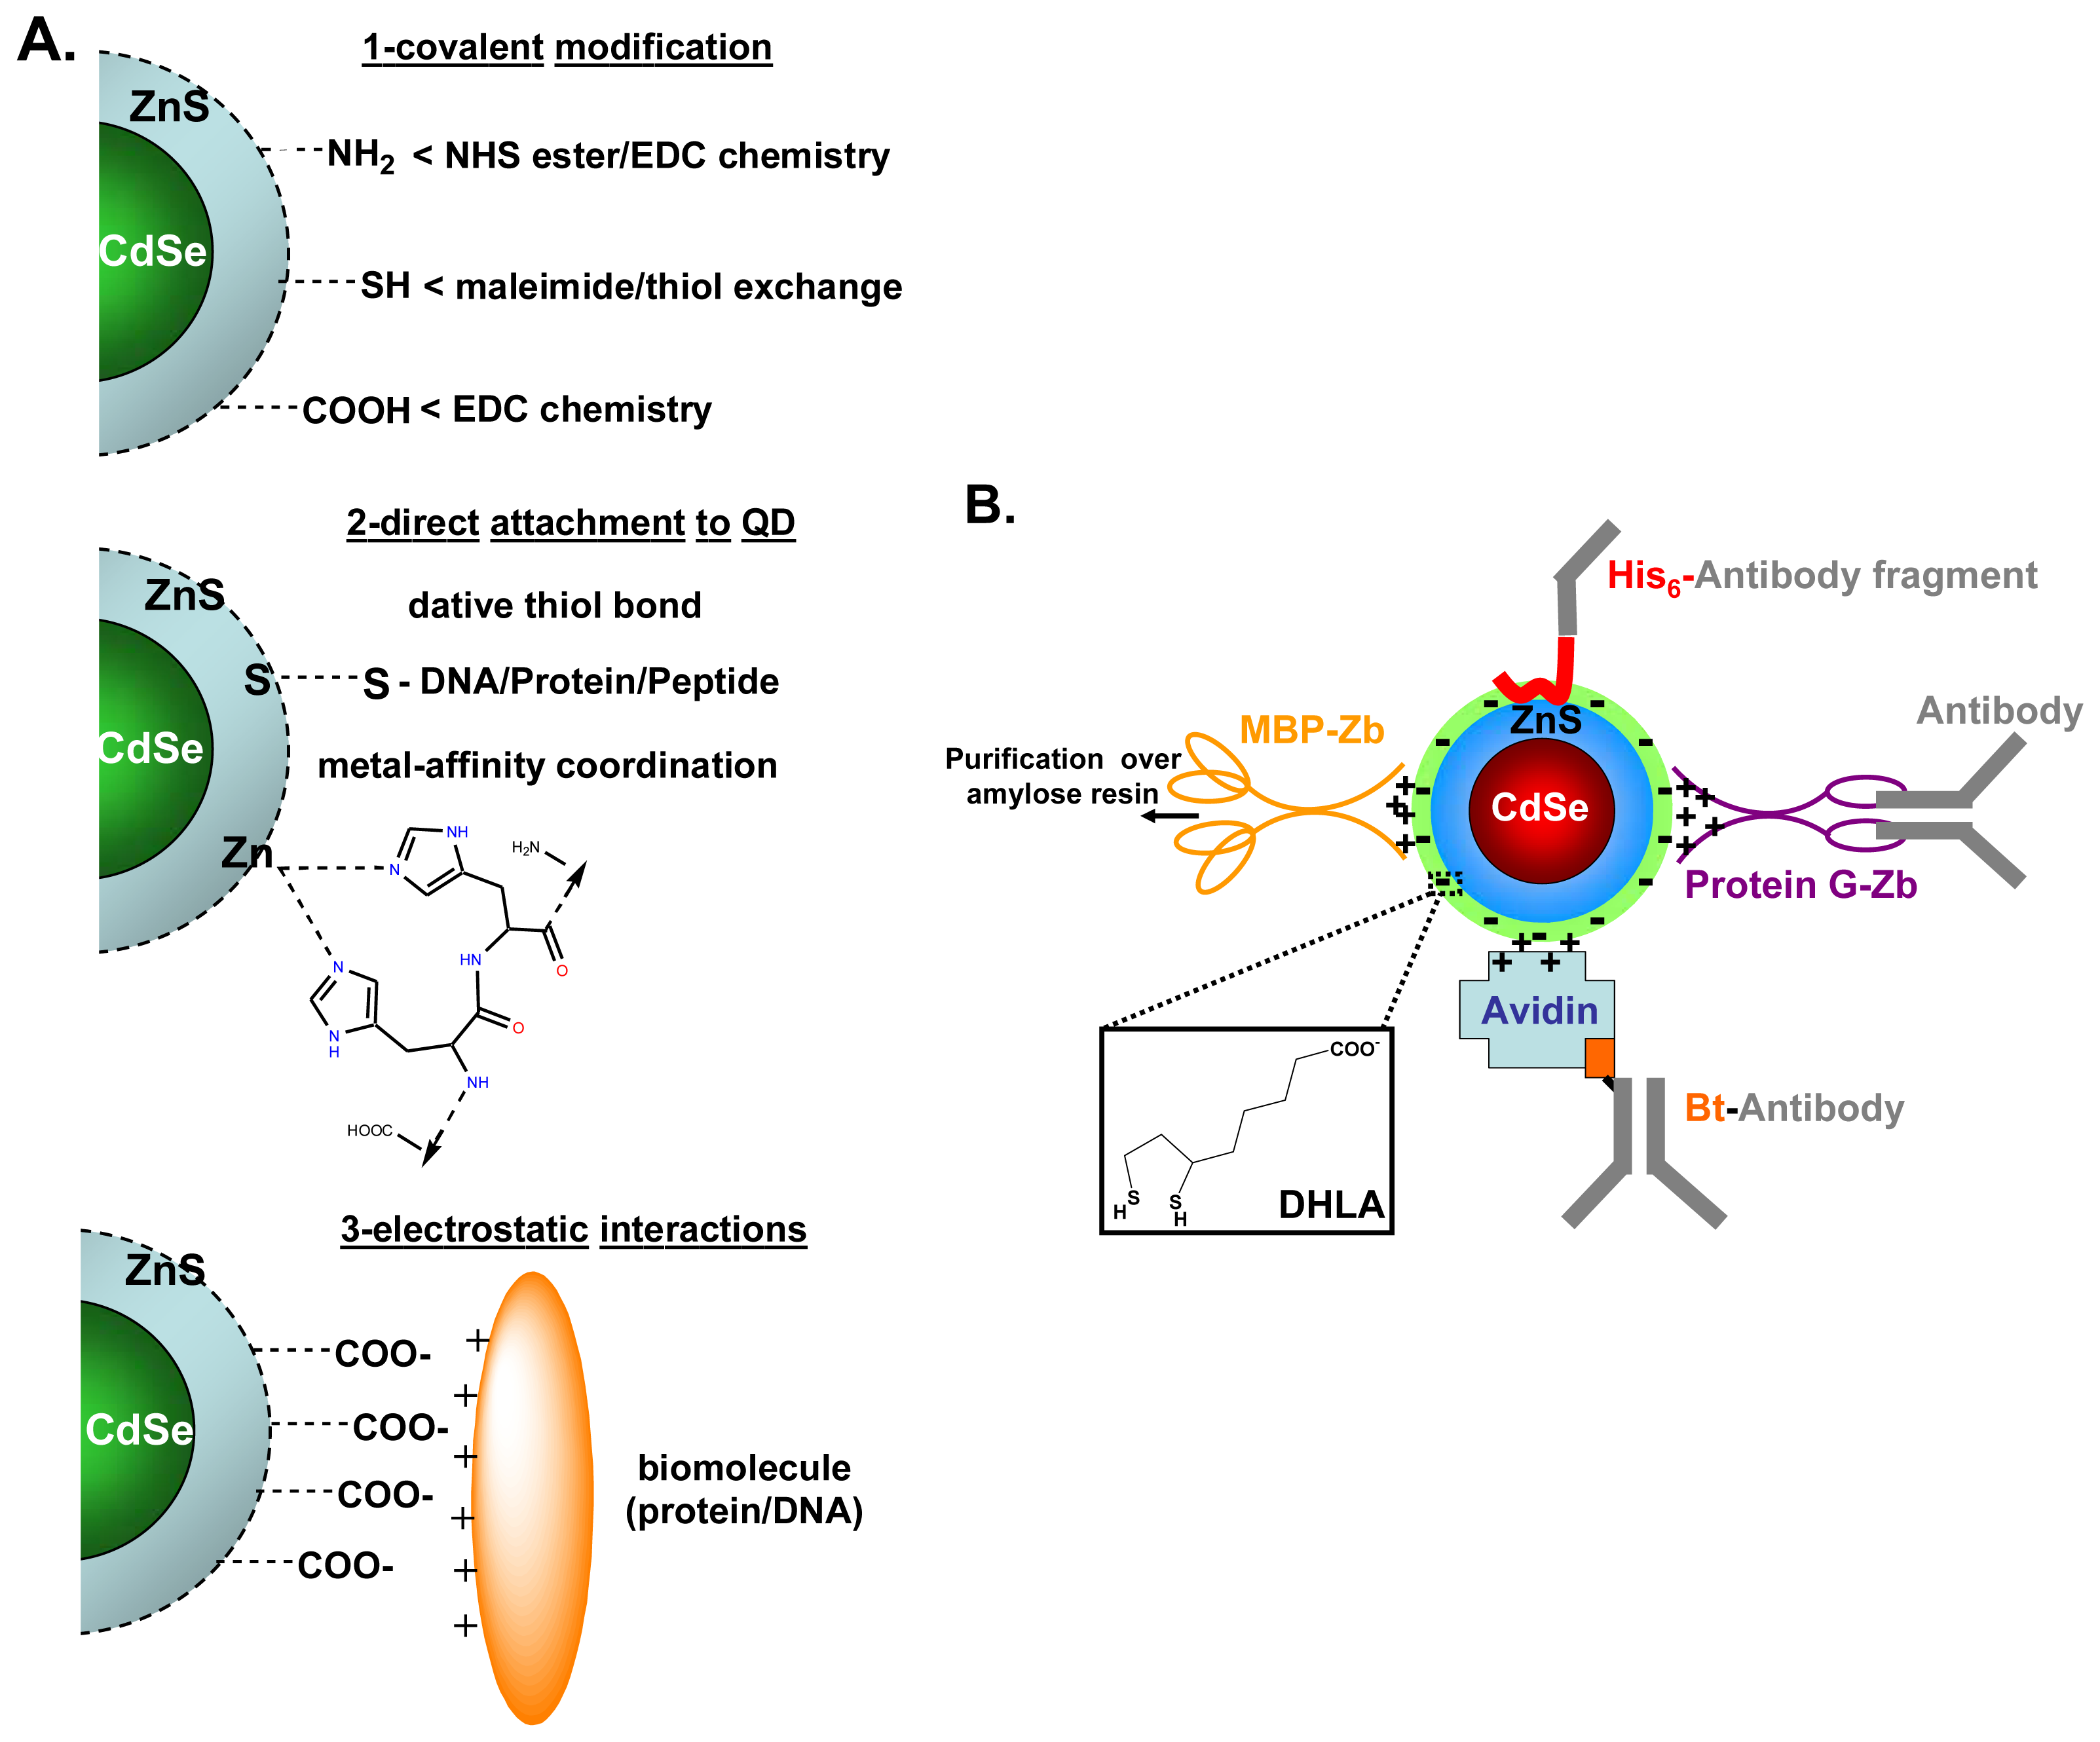
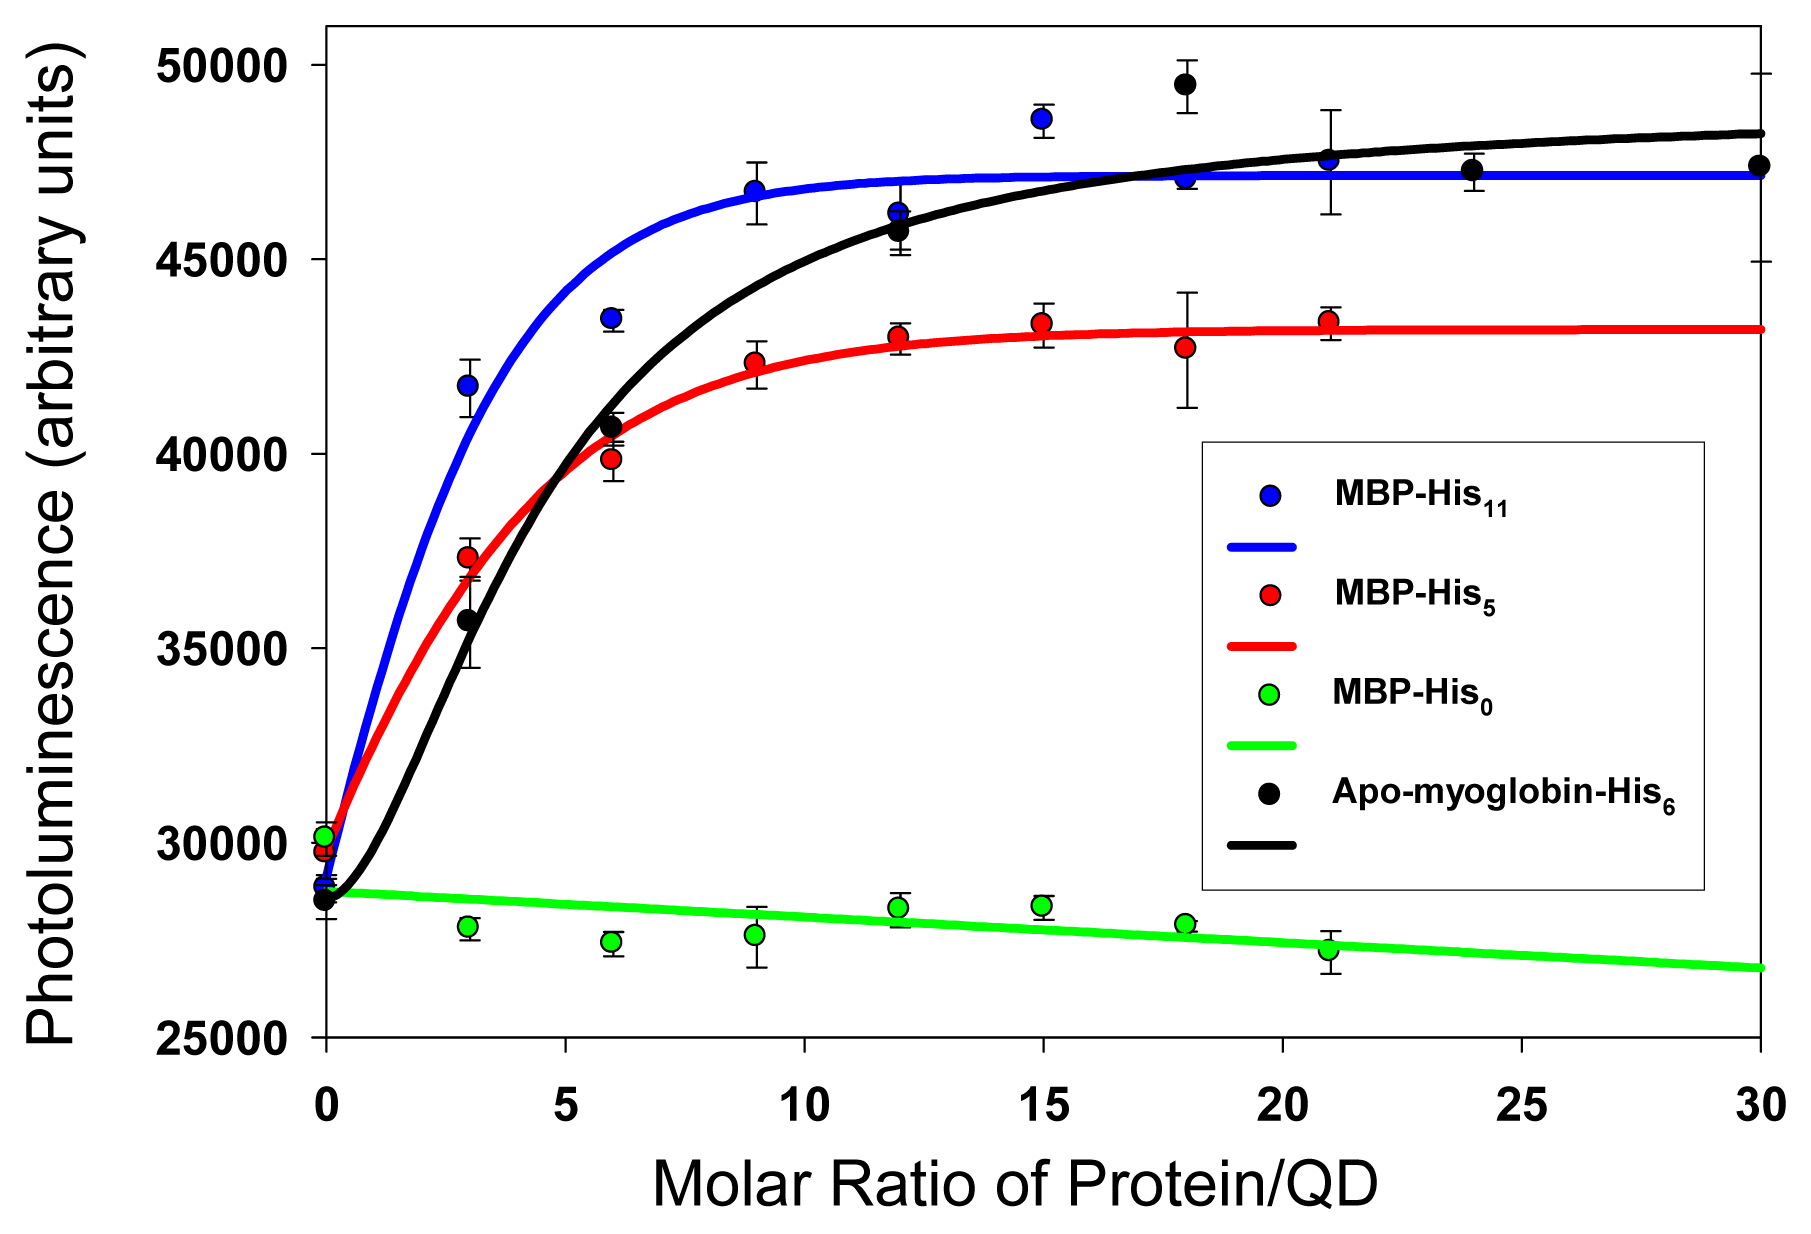
3. Bioconjugation of Quantum Dots

Since QDs with high optical properties are usually synthesized from organometallic precursors and salts they have no intrinsic aqueous solubility. The native coordinating organic ligands on the surface of the QDs must either be exchanged or functionalized with a ligand or ‘cap’ that can impart both solubility and potential bioconjugation sites if desired. A wide variety of these ligands exist, however, each comes with its own benefits/liabilities. Examples of pertinent capping issues include complicated synthetic schemes, short usable half-lives, pH dependency or a considerable increase in overall QD-ligand size [8-10,20,27-29]. Commercial QDs are prepared with multiple layers of proprietary coatings which can increase the overall probe size considerably. Regardless of the final ligand used, there are still only a few methods available for bioconjugation or attaching biomolecules, such as protein or DNA, to QDs. These can be divided into 3 primary categories, schematically depicted in Figure 2A.
The first and most common method is to attach biomolecule(s) to a functional group displayed on the QD ligand surface covalent modification chemistry. Examples of such groups include amines, thiols or carboxyls. Amines can be modified with N-hydroxysuccinimide (NHS) esters or 1-Ethyl-3-(3-dimethylaminopropyl) carbodiimide (EDC) activated molecules [30]. Thiols may also act as sites for modification by maleimide chemistry or thiol exchange with the qualification that the QD surface (especially any S) is sufficiently protected from their reactivity [30-32]. Alternatively, the carboxyls can be activated with EDC to allow attachment to an aminated biomolecule [5]. However, this last chemistry can be problematic since it requires purification of the subsequent conjugate and issues of reproducibility, solubility and aggregation driven by cross reactivity can also arise [20,33,34]. The second bioconjugation method relies on direct interaction with the QD surface. Examples include metal-affinity driven coordination of polyhistidine appended proteins to the Zn atoms of QDs [35-42] or dative thiol bonding of cysteine residues to the surface sulfur [43-45]. In an elegant demonstration of the latter approach, the Weiss group showed that phytochelatin peptides containing multiple cysteine residues could both ‘cap’ a QD and impart subsequent biological activity [43-45].
We have developed a variety of methods for attaching antibodies and other proteins to primarily dihydrolipoic acid (DHLA) capped QDs based on the above described metal-affinity coordination and self-assembly driven by electrostatic interactions (see Figure 2) [20,34,46-48]. In an early example of this electrostatic strategy, maltose binding protein (MBP) was engineered to express a positively charged leucine-zipper domain to enable electrostatic interactions with the negative surface of DHLA-functionalized QDs [34]. After self-assembly the resultant bioconjugate could be purified over amylose resin. A further modification of this strategy allowed both attachment of antibodies to the QD and purification of the bioconjugate for subsequent immunoassays [33,49-53]. Genetic engineering was again used to introduce the positively charged leucine-zipper onto protein G, which when immobilized on the QD via electrostatic interactions, could be used to bind the Fc region of antibodies [50,53]. In these studies, multi-protein QD-bioconjugates were employed where the MBP served as a purification tool while the modified protein G acted as an attachment linker for the antibodies (see Figure 2B). In a related approach, avidin, a highly positively charged protein, was adsorbed via electrostatic self-assembly to the DHLA capped QDs and used to bind biotin-labeled antibodies [52]. More recently, we have begun to rely on the ability of proteins/peptides engineered with clearly available N- or C-terminus polyhistidine sequences to self-assemble onto the QD surface via metal-affinity coordination. Since this facile process does not involve reactive chemistry or purification, it greatly simplifies the creation of QD-bioconjugates [40,54,55].
Regardless of the method chosen for bioconjugation important issues still remain [20]. The orientation of any QD-attached protein usually cannot be strictly controlled resulting in heterogeneous presentation and the associated problems of mixed avidity. For example, if an antibody binding site is oriented towards the QD surface it may not be available to bind its intended target. Similarly it can also be hard to finely control the ratio of biomolecules chemically attached to each QD. As an alternative to dealing with these issues, commercial QDs are available precoated with biotin, avidin, protein G, protein A, or other similar proteins to facilitate bioconjugation to an appropriate biomolecule or antibody.

4. Generalized Probes

There has been a concerted effort geared towards using QDs as generalized sensors based upon detecting changes in their photoluminescence as they interact with a variety of targets. It is believed that the observed increases in QD PL in this scenario are most likely the result of surface passivation by the target molecule which has a net result of reducing the electric field effects on the QD [34,40,56,57]. Alternatively, some materials may decrease the passivation resulting in a decrease in QD PL. A variety of QD materials functionalized with different types of ligands have been utilized for such sensing assays. Examples include, using mercaptoacetic acid functionalized CdS QDs as a probe for bovine serum albumin or nucleic acids where protein or DNA addition increased their PL linearly [58,59]. Similar results were noted for several proteins that interacted with thioglycolate or cysteine modified ZnS QDs [59,60]. Conversely, adding papain to mercaptopropyl acid modified CdTe QDs decreased their PL and redshifted their emission in a concentration dependent manner [61]. Different peptides were able to both increase and decrease the emission of thiovanic functionalized CdS nanoparticles [62]. The PL increases were correlated with the presence of a cysteine group on the peptide which presumably interacted with and further passivated the QD. Linear decreases in CdSe PL were also used to quantitate spironolactone concentrations in hexane [63]. Similar formats have been used to monitor Cu(II) and Ag(I) [64,65], Cr (VI) [66,67] and cyanide [68].
Although interesting, there are several aspects of this biosensing approach which are less than ideal. The exact mechanism responsible for these changes still remains speculative. As such, the interactions cannot be predicted a priori and are mostly non-specific which leads to a large potential for cross reactivity. Further, the limits of detection (LOD) are not as sensitive, or in most cases even comparable, to many other analytical methods. Although this type of assay may never find clinical or diagnostic uses, it can still be useful in certain controlled applications. For example, we and others have used these changes in QD PL to monitor, confirm, and even in some cases quantitate QD-bioconjugate formation upon interaction with a particular protein or peptide, see Figure 3 [34,35,40,54,56,57].

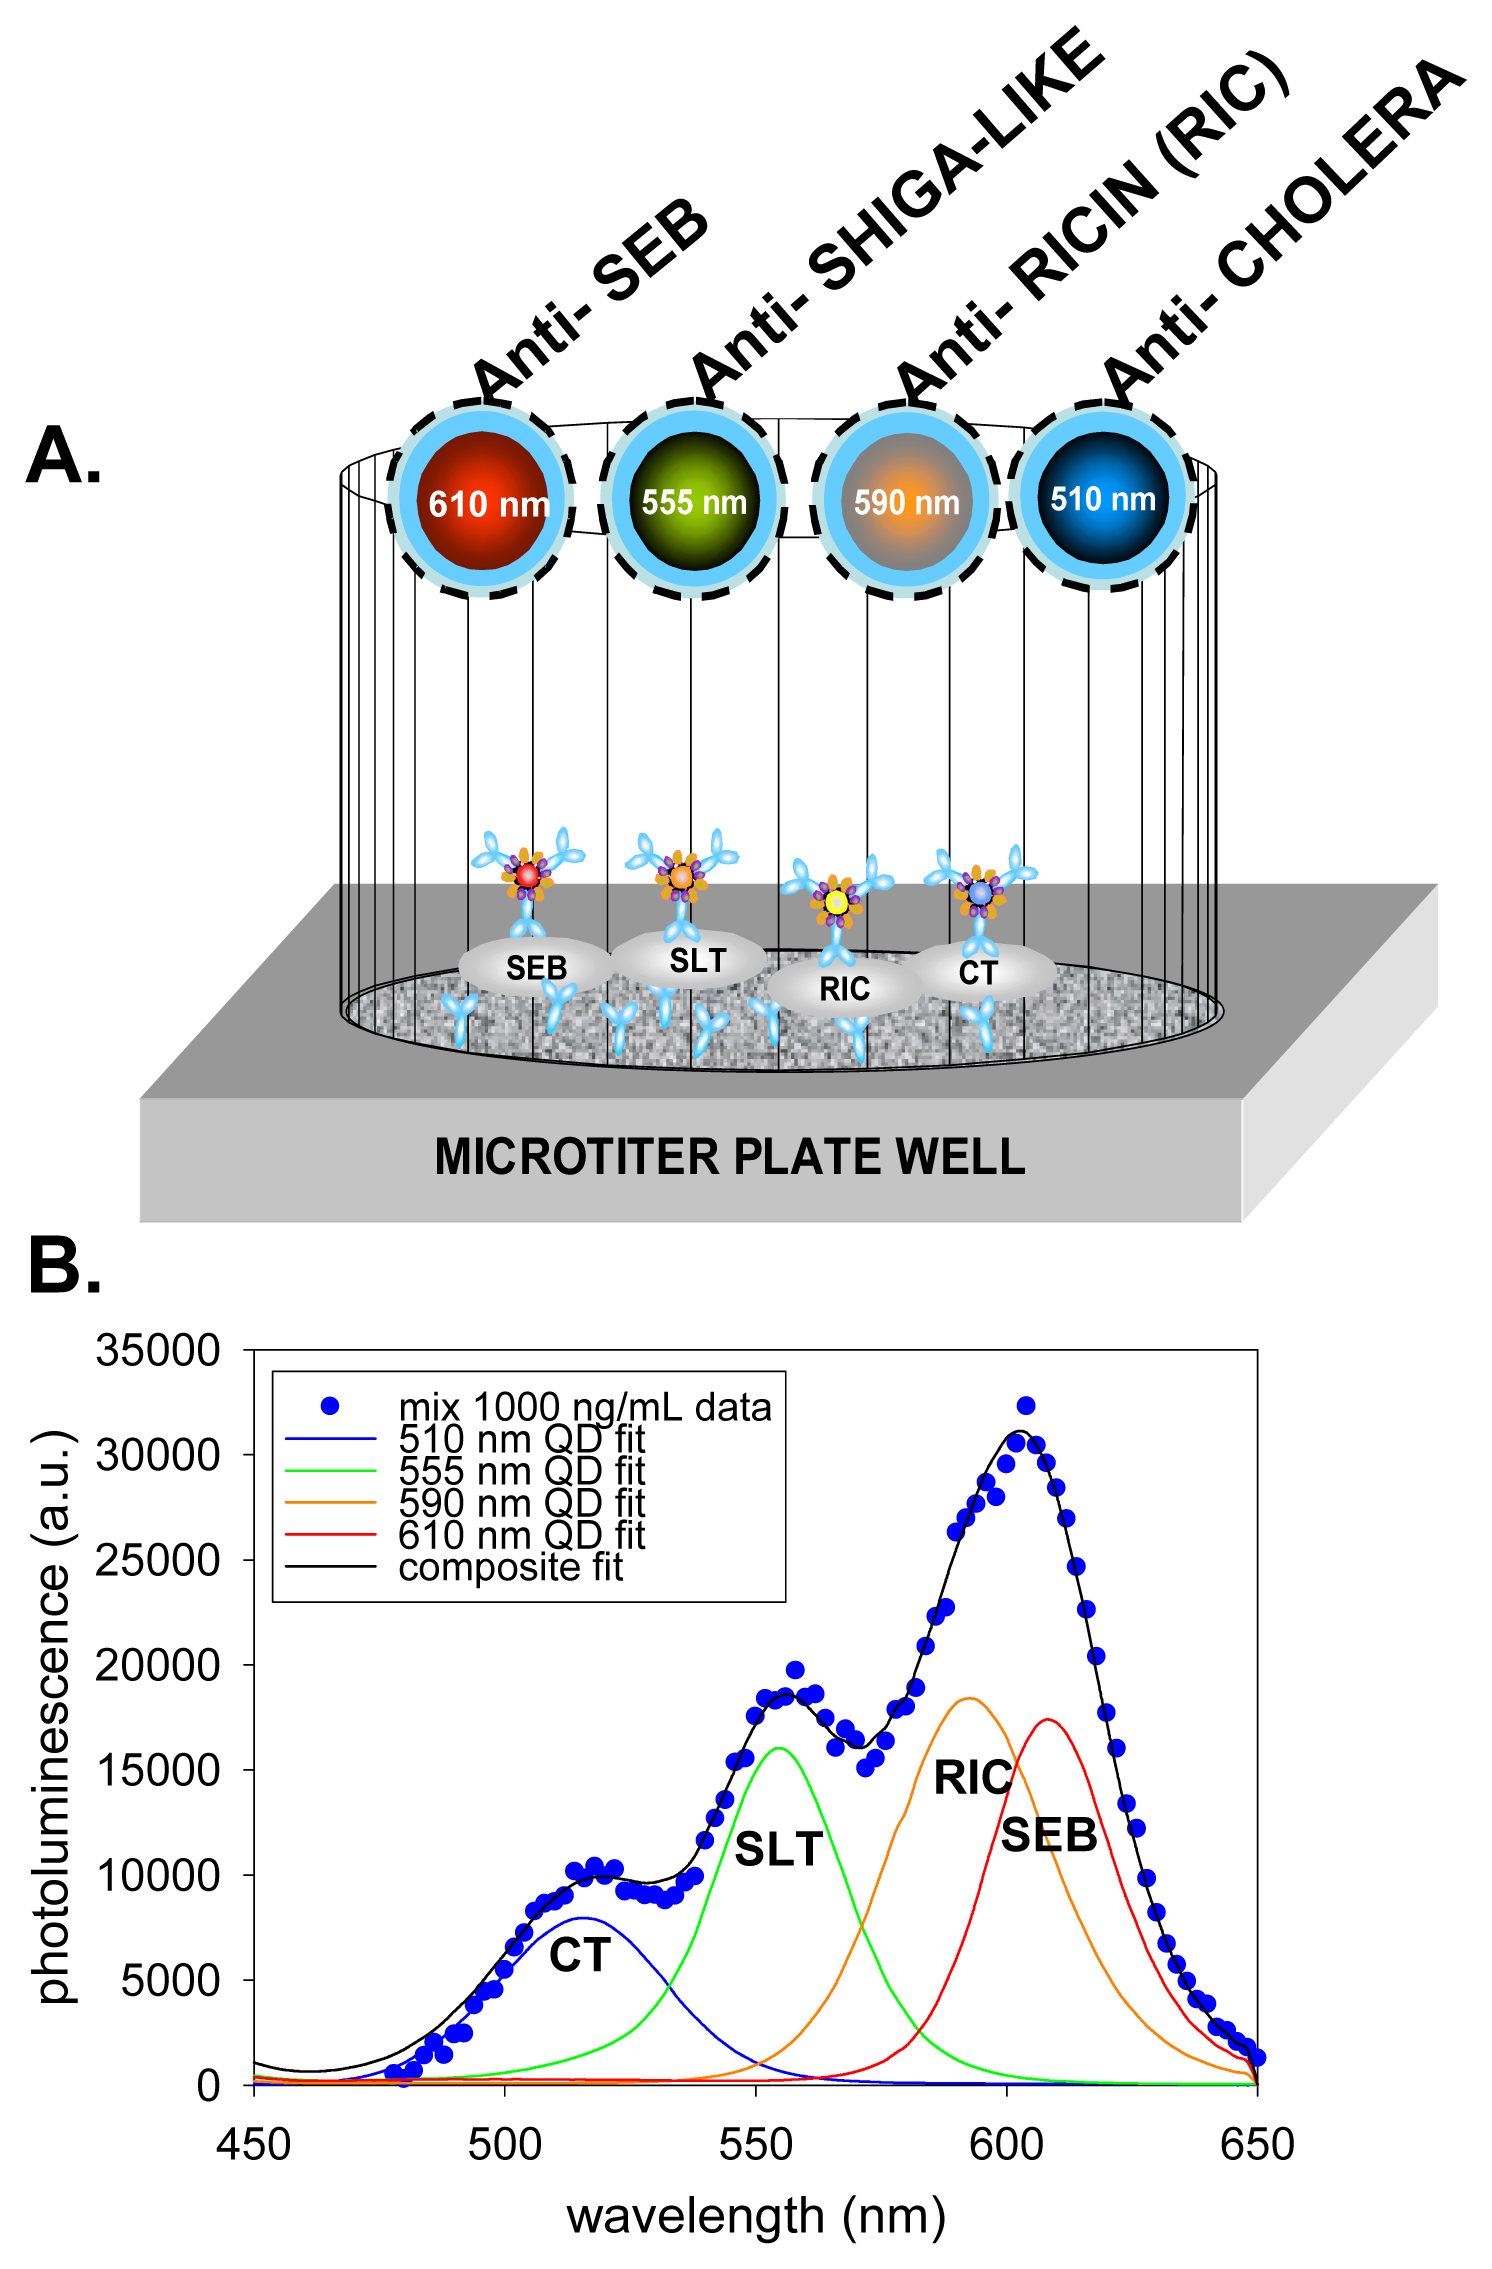
5. Immunoassays Using Quantum Dots

The unique advantages that QDs offer over conventional dyes has increasingly led to their use in immunoassay detection [33]. Due to their inherent photostability QDs have demonstrated improved sensitivity in a number of the immunoassays highlighted in this section, while their size tunable photoluminescence coupled with the broad absorption spectra have allowed multi-color or multiplexed immunoassays. In terms of coupling QDs to antibodies, the most common method reported in the literature utilizes biotin-avidin interactions [52]. The avidin/streptavidin coated QDs are usually obtained commercially, while biotin-labeling of antibodies is performed in-house using standard procedures [30]. QDs presenting available carboxylic acids from their capping agents may also be covalently attached to the epsilon amine of an antibody's lysine residues by using EDC/NHS coupling chemistry [69,70]. Alternatively, simple electrostatic interactions can be used depending on the overall protein charge at the pH of conjugation [51,71].
Goldman and coworkers have been at the forefront of small molecule detection using antibody-conjugated QDs, as exemplified by the immuno-detection of the explosive 2,4,6-trinitrotoluene (TNT). A TNT analog was immobilized onto the surface of microtiter plates and competed with dissolved TNT for binding sites on QD-anti-TNT antibody bioconjugates in the same solution [50,51,54,55]. QDs typically play a more passive role in this type of immunoassay where simply the presence of their fluorescence is measured. The most popular area of research utilizing QD-antibody bioconjugates is in protein detection and this focuses on two main areas. The first involves the development of immunoassay-systems for the rapid detection of protein toxins in clinical, environmental, and food/water security based applications. For example, Goldman et al. developed sandwich immunoassays specific for staphylococcal enterotoxin B (SEB) and cholera toxin using microtiter well plates functionalized with capture antibodies. These were used in combination with specific QD-antibody bioconjugates as fluorescence tracers and assayed in a standard 96-well plate fluorescence reader [50,52]. The second area utilizing QD-antibody bioconjugates targets clinical diagnosis and treatment. This area has focused on cancer primarily and involves both the sensitive detection of protein biomarkers characteristic of the disease as well as understanding the cellular signaling pathways involved. QDs have been used to monitor/stain such protein biomarkers in fixed cells including: measuring B- and T-cell antigens with different colored QDs in fixed lymph nodes [72], monitoring ovarian carcinoma by targeting the CA125 tumor marker [73], and monitoring the proliferation of the peroxisomal membrane protein (PMP70) in liver cells in response to treatment with hypolipidemic drugs [74]. QDs immobilized within polymer beads have been used to observe the over-expression of p-glycoprotein in breast adenocarcinoma cells [75]. QD-avidin bioconjugates have also been used to label biotinylated cholera toxin bound by GM1 gangliosides in the plasma membrane of neurons, thus indirectly staining the GM1 [76]. The majority of these studies highlight, in direct comparison to standard fluorescent dyes, the improved photostability inherent to the QDs which allow longer exposure times and observation of the sample without the risk of photobleaching.
Protein detection and especially Western blot analysis of proteins expressed in tissues or cells has also benefited from QD-based fluorescence detection [77-79]. The benefits arise from improved sensitivity, the ability to multiplex using different colored QDs and a shortening of analysis time. To highlight this, Bakalova demonstrated that procedure time could be shortened by removing some of the preliminary immunoprecipitation and concentration steps that are usual in a standard Western blot format [79]. The same group later demonstrated the flow cytometry-based application of QD-antibody bioconjugates for quantification of c-abl protein levels in K-562 leukemia cells [80]. Geho applied QD-labeling to clinical proteomics in a high throughput screening method for protein expression [81]. Cell lysates were noncovalently immobilized in patterns on the surface of a nitrocellulose slide and exposed to streptavidin-coated QDs in an immunostaining procedure developed specifically for monitoring regulated protein kinases. Red blood cell antigen expression in erythrocyte samples has also been monitored with monoclonal antibody-labeled QDs [82].
QD-immunolabeling has proven effective in identifying bacterial and protozoan cells as well as certain types of virus. For these type of assays the QDs are usually conjugated to either the primary or secondary antibodies. This labeling has been successfully used for the detection of Mycobacterium bovis Bacillus Calmette-Guerin [83], Cryptosporidium parvum [84,85], Escherichia coli O157:H7 [86,87], Salmonella Typhimurium [87] and Giardia lamblia [85,88]. Many of these species present a serious public health risk and monitoring food and water supplies for the presence of these cells remains challenging. It is hoped that QD sensitivity coupled to their chemical stability can be exploited for direct assaying in various substrates obviating the need for preliminary isolation and culturing. In preliminary support of this rationale, Hahn et al. demonstrated improved sensitivity using QDs as compared to a fluorescein dye for the E. coli O157:H7 detection [86]. A similar result was also reported by Lee and coworkers in their targeted Cryptosporidium parvum immunoassay [84]. Viral detection using QD-antibody bioconjugates has been somewhat hampered by the inherent difficultly of consistently generating effective antibodies. Nevertheless, Liu and coworkers were able to use a filter-based microfluidic device that contained antibody coated microbeads to capture a marine iridovirus (SGIV) and visualized the virus with QD-secondary antibody bioconjugates [89]. Separate experiments using QD- or fluorescein-labeled beads demonstrated improved signal-to-noise (S/N) ratios and lower standard deviations for the QDs labels. In a different approach, Bentzen et al. used QDs to identify and monitor the cellular trafficking of respiratory syncytial virus (RSV). By using a sequential labeling scheme, the RSV fusion and attachment proteins were differentially labeled which allowed the progression of RSV infection in cells to be monitored using confocal laser scanning microscopy [90].
For biosensing, the greatest potential of QD-antibody bioconjugates is in multiplexing. In a demonstration of this potential, Goldman et al. used sandwich immunoassays for the simultaneous detection of four toxins: cholera toxin, ricin, shiga-like toxin 1 and staphylococcal enterotoxin B (SEB), in a single microtiter well, see Figure 4 [53]. In this assay capture antibodies immobilized in a microtiter well plate were first exposed to the mixed toxin sample. Antibodies specific for each of the toxins coupled to a different color QD were then added to the microtiter well plate. The resulting signal from the mixed toxin samples was then deconvoluted using a simple algorithm. In another example, QD-antibody bioconjugates were used to identify and differentiate between diphtheria toxin and tetanus toxin proteins which were non-specifically immobilized onto poly-L-lysine coated cover slips [91]. Yang and coworkers also demonstrated the simultaneous detection of Escherichia coli O157:H7 and Salmonella Typhimurium bacteria using different colored QDs as immunoassay labels [87]. While these studies represent only initial proof-of-principle, and further optimization and refinement will be required to improve limits-of-detection, they clearly demonstrate the potential of QDs in multiplexed immunoassay formats. The only major obstacle to future 6-10 color QD multiplex immunoassays still remains the inherent cross-reactivity of antibodies.

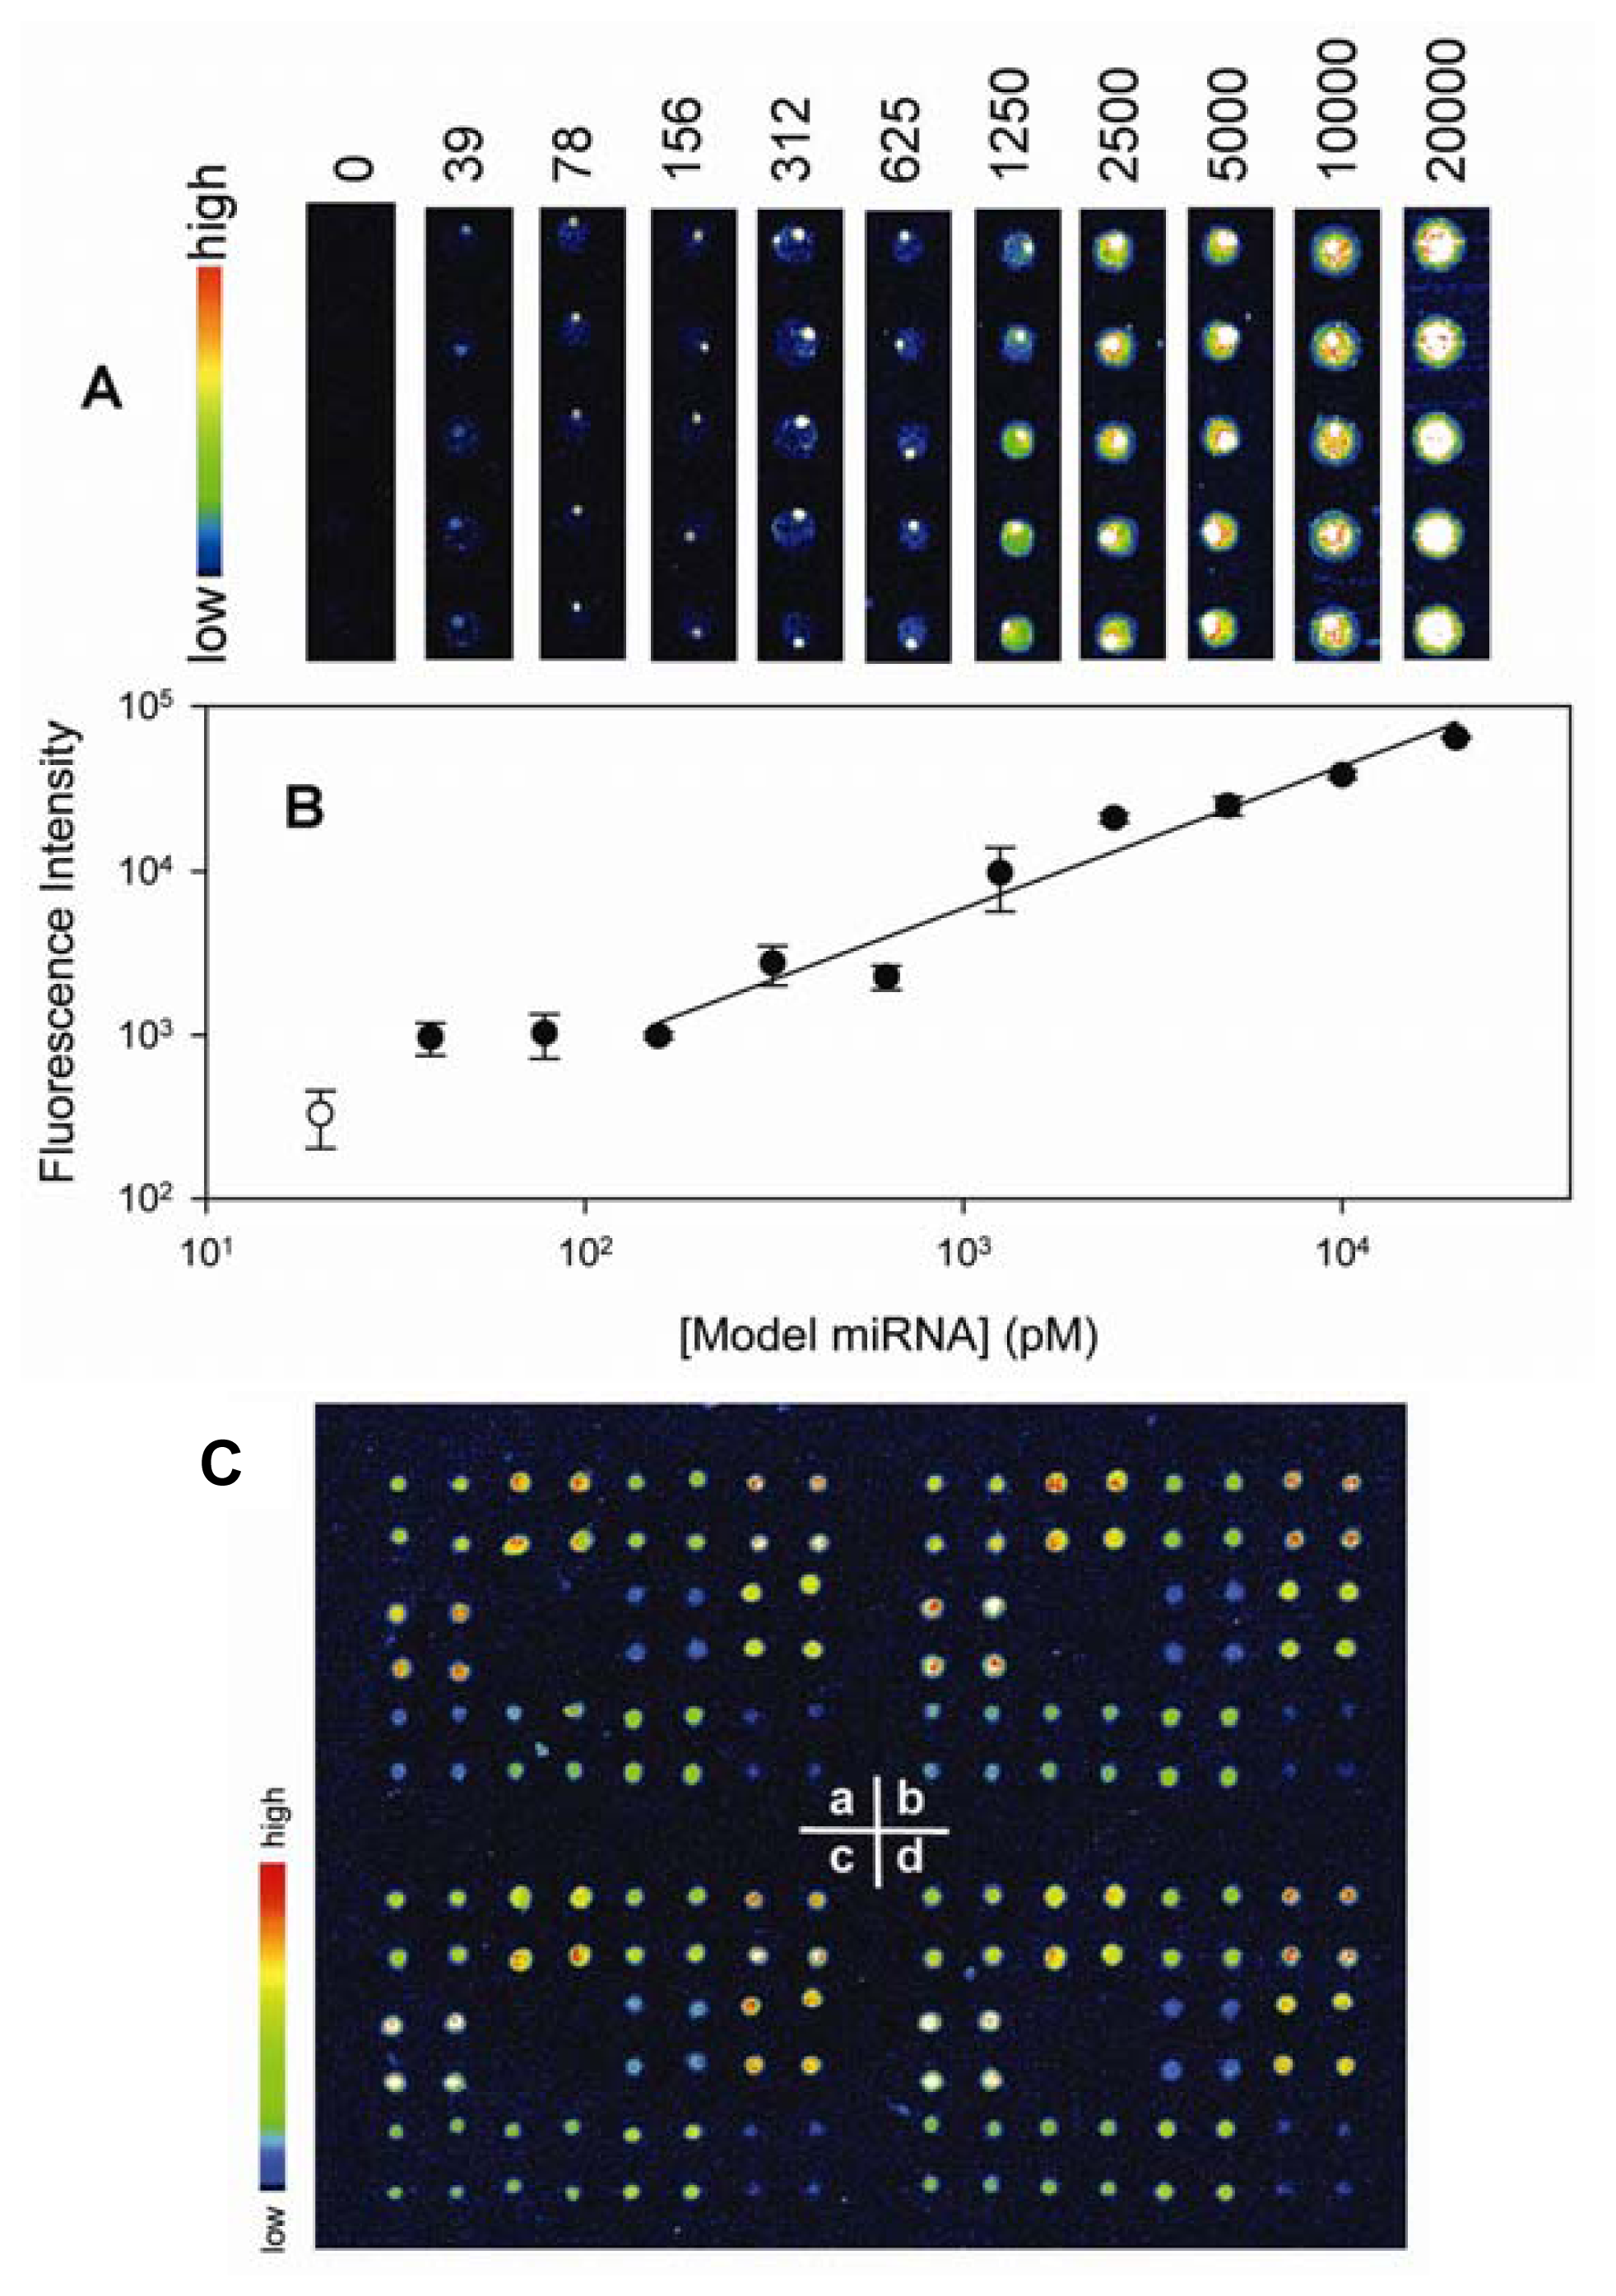
6. Nucleic Acid Detection

A number of different nucleic acid sensing modalities are expected to benefit from using QD-based detection methods. Of these, the principle technology that would benefit most from the QDs optical properties is the DNA microarray, which has consistently provided flexibility and a high-throughput capacity to a number of related DNA analyses. These include gene expression monitoring, mutation detection and single nucleotide polymorphism (SNP) typing. In particular, multiplex microarray formats can directly facilitate pathogen identification and cancer diagnosis/evaluation as they allow the simultaneous comparison of different genomes or genetic markers. Again, the photophysical limitations of the organic dyes commonly used in these assays has hampered their full implementation.
Specific hybridization of four different QD-DNA conjugates on surfaces containing complementary DNA strands was first demonstrated by Gerion et al. in 2002 [92]. This was soon followed by another report demonstrating the use of QD-DNA conjugates for the simultaneous detection of hepatitis B and C genotypes, and SNP detection (although only under stringent buffer conditions) [93]. Since then, ‘deep’ or high multiplexing demonstrations with QD detection has progressed substantially with an eight color-multiplexed DNA microarray using 3 Cy-dyes and 5 QDs recently reported [94]. For this demonstration the authors do not exclusively rely on QDs, but rather combined them with standard cyanine dyes to augment and extend their spectral windows. This format is hard to accomplish with conventional dyes since it would necessitate multiple excitation lasers coupled to multiple spectral detection windows separated by appropriate filters [26]. Liang et al. applied QDs to miRNA microarray assays by using streptavidin QDs probes to label biotinylated miRNA targets derived from rice, see Figure 5 [95]. They found that QD probes provided good sensitivity down to sub-femtomolar concentrations and dynamic range over several orders of magnitude. This was far better than other dye-based methods and further obviated the use of amplification while allowing a semi-quantitative comparison of the amount of miRNA in different samples. Here, however, the lack of orthogonal conjugation methods for attaching miRNAs to QDs did not allow the use of different QD colors. In general, a critical performance limitation has been the potential for non-specific interactions of QDs with both the conjugated DNA backbone and the microarray surface. This has required careful control over the QD surface composition to minimize these effects through the use of appropriate linker moieties (see below) [92,96]. Furthermore, the relatively large size of the QDs may reduce the maximum surface labeling density compared to smaller organic dyes.
QDs multiplexing capacity may be specifically advantageous to the use of optically encoded microspheres, which is an alternative approach for DNA analysis that benefits from higher flexibility and faster binding kinetics [97-99]. Polystyrene microspheres conjugated to specific DNA probes are loaded with mixtures of different QD populations, each corresponding to distinct intensity levels and spectral signatures, while the DNA target is labeled with a dye emitting in a separate spectral channel. Identification of the DNA target population is then performed via hybridization onto the microsphere probes, followed by single particle spectral identification and counting. After a proof-of-concept study by Han and coworkers [99], Xu et al. demonstrated the high accuracy, sensitivity and efficiency of these QD-encoded microspheres for multiplexed SNP genotyping [97]. Even though the authors used only 10 distinct optical codes, optimized instrumentation would allow the use of more colors/intensity levels and could realistically lead to the detection of several hundred different codes. Ho and coworkers demonstrated a single-particle DNA variant of this analysis method based on multicolor colocalization [100]. Hybridization of different single QD-DNA probes at different sites of the same DNA target revealed and confirmed the targets presence. Compared to the microsphere method, this approach would not require labeling of the target DNA with an organic dye and may again result in higher sensitivities. However, the use of single QDs instead of QD-loaded microspheres requires more sensitive detection schemes, may be limited by QD population heterogeneity in emission wavelength and quantum yield, and may be more sensitive to uncontrolled QD-DNA non-specific interactions.
The use of QDs probes in fluorescent in situ hybridization (FISH) has also been demonstrated for cellular DNA and mRNA detection [96,101,102]. Pathak et al. first reported Y-chromosome labeling in human sperm cells using QD-conjugated oligonucleotide probes [96]. Xiao and coworkers then successfully used QD-streptavidin conjugates to label biotinylated oligonucleotide probes specific for the HER2 loci in human metaphase chromosomes [102]. The QDs probes showed superior photostability and brightness, but exhibited unexpected differences in labeling distribution between different chromosomes, compared with organic dye probes. QD optical properties again facilitated multiplex studies, as demonstrated by Chan et al. [101]. The authors showed FISH detection of several mRNA targets using preassembled QD-streptavidin/biotinylated DNA probes, and the possibility of combined FISH and immunochemistry studies using QDs. Interestingly, they noted an improved hybridization efficiency of the QD-DNA probes when a 54 carbon spacer was used between the biotinylation site and the DNA probe, which confirms the importance of limiting QD-DNA non-specific interactions. A similar spacer rationale has also been noted by Bakalova in a QD-SiRNA screening study [103].
QDs can also bring significant benefits to single-molecule DNA imaging, as demonstrated by Crut and coworkers [104]. The authors were able to label and image the two ends of individual DNA fragments immobilized on a surface with two different colored QDs, using modified DNA carrying orthogonal functionalization groups. This method avoided the numerous problems linked to DNA intercalating dyes commonly used for DNA imaging (photo-bleaching, photo-induced cleavage and modification of the DNA properties). Cumulatively, these reports demonstrate that QDs can improve multiplex nucleic acid analysis when carefully applied and may even facilitate the study of DNA/protein interactions at the single molecule level.

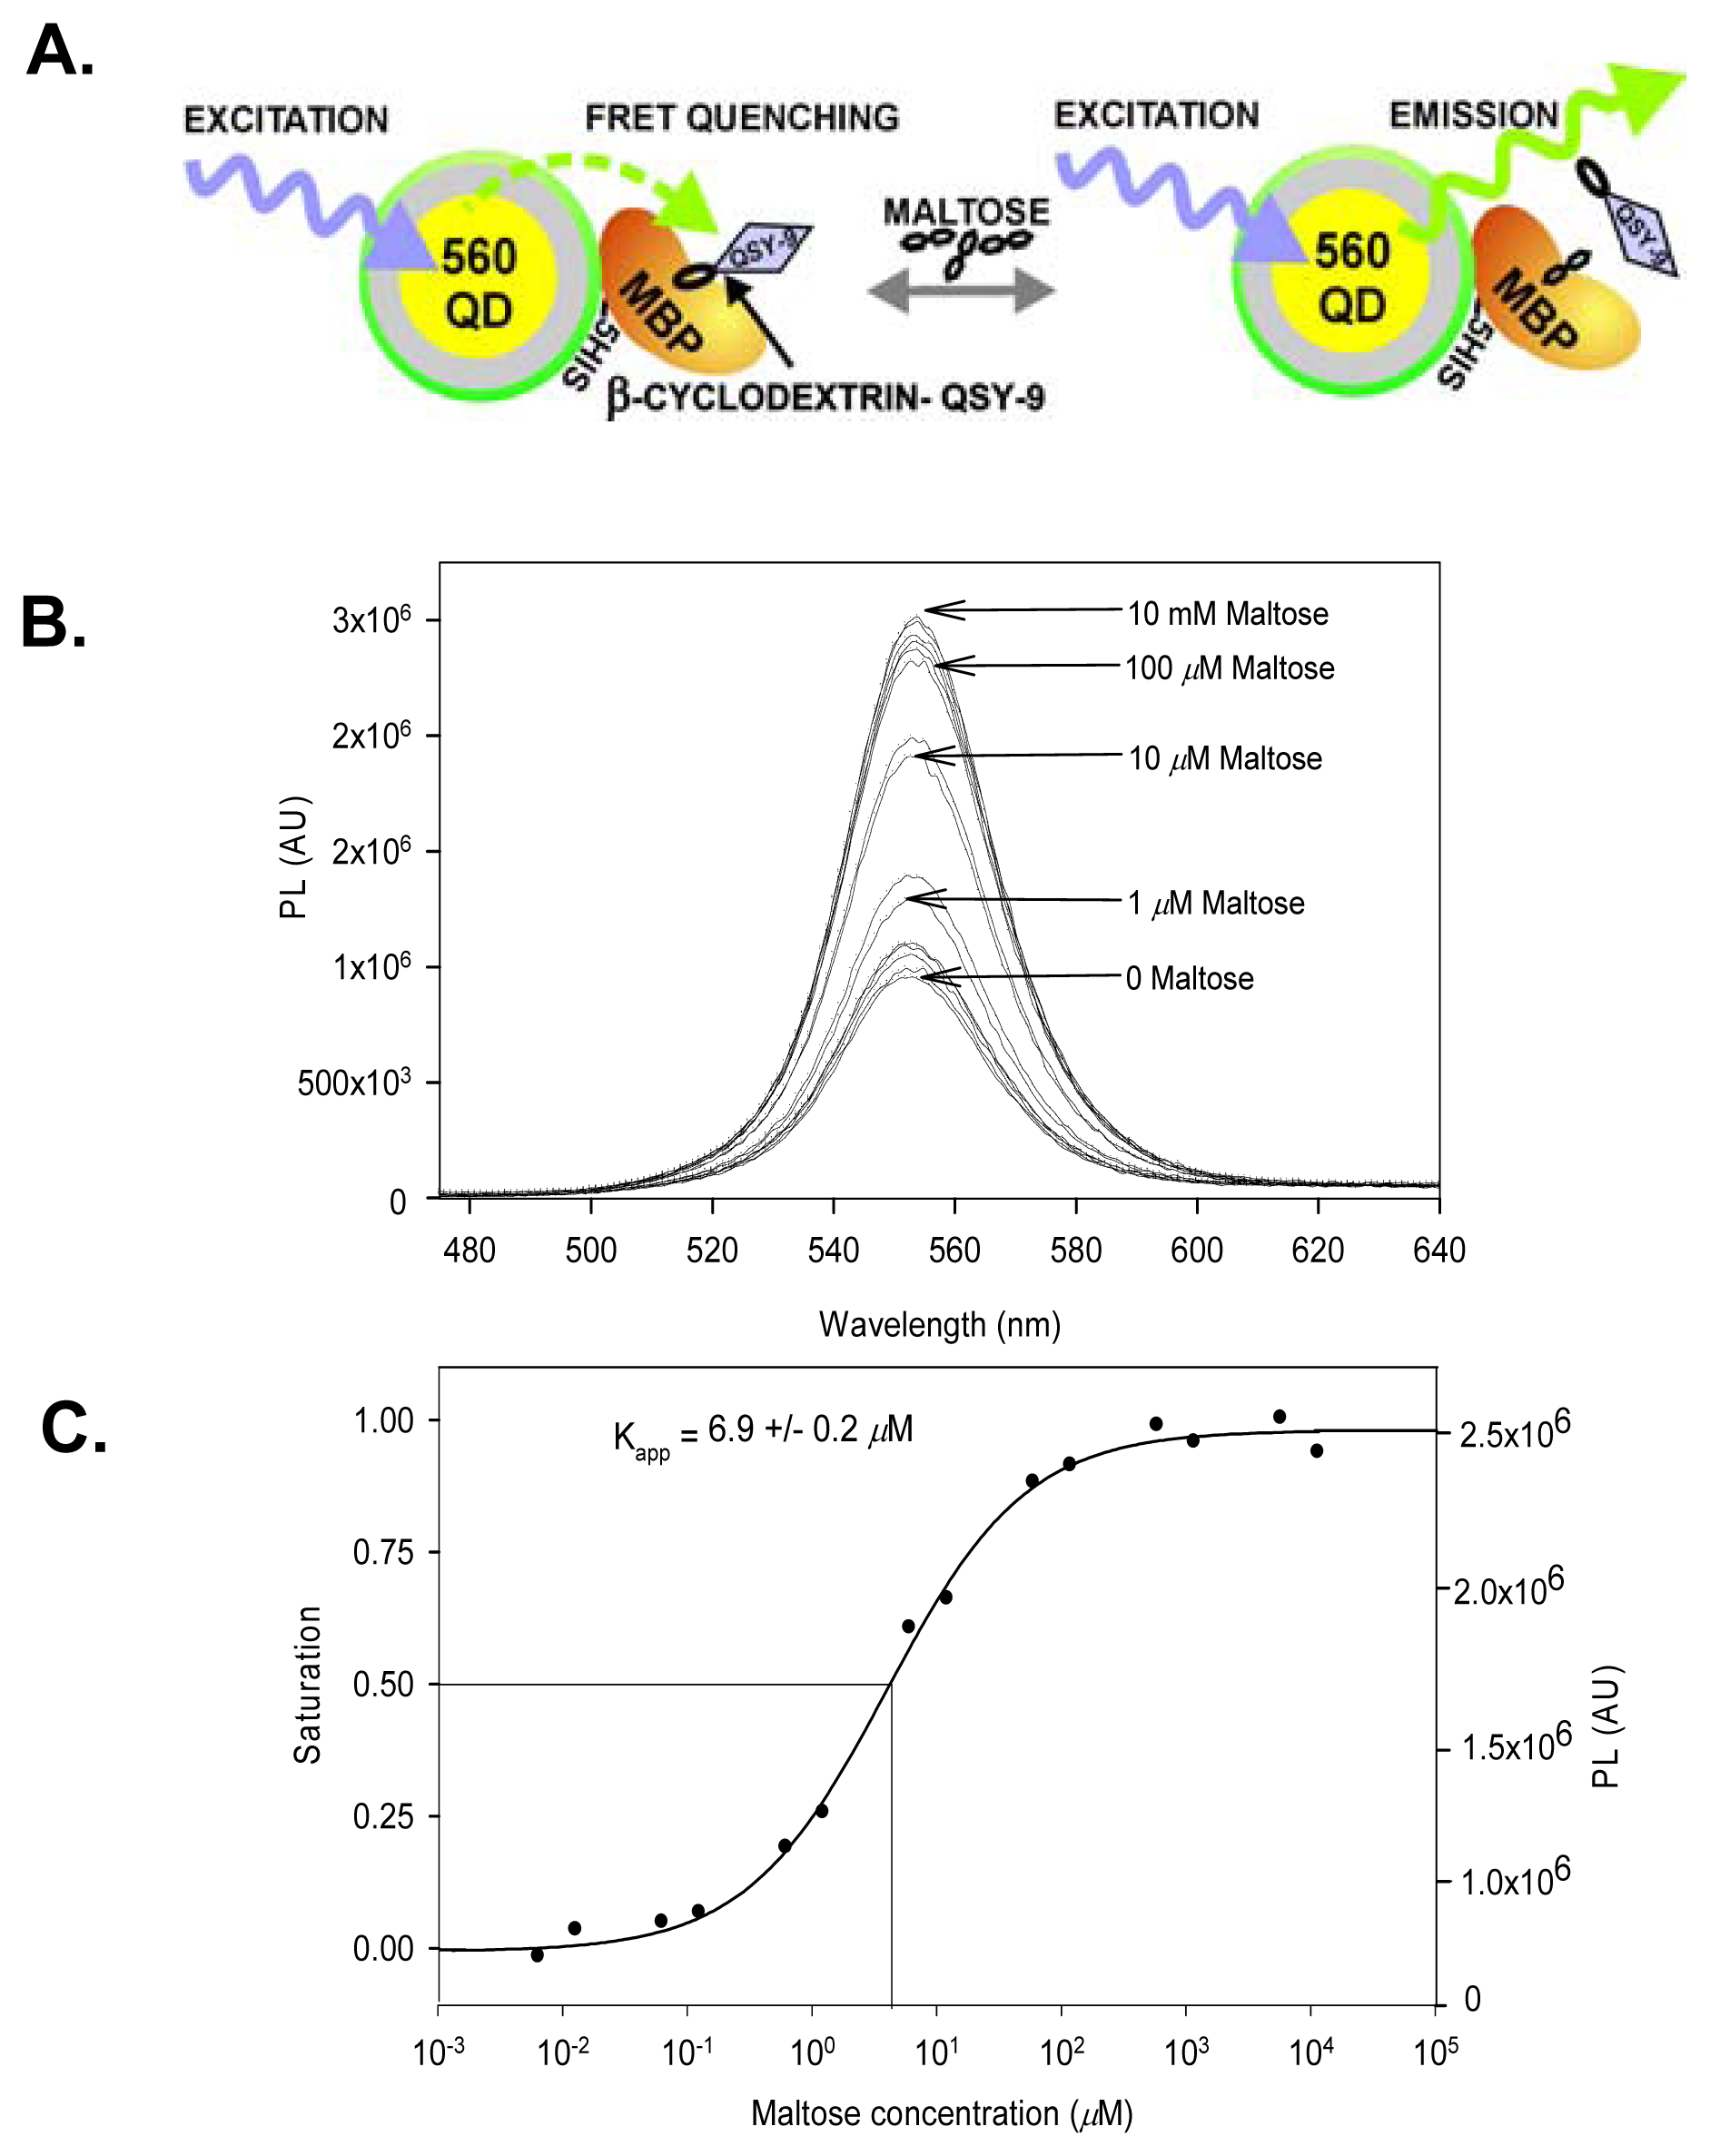
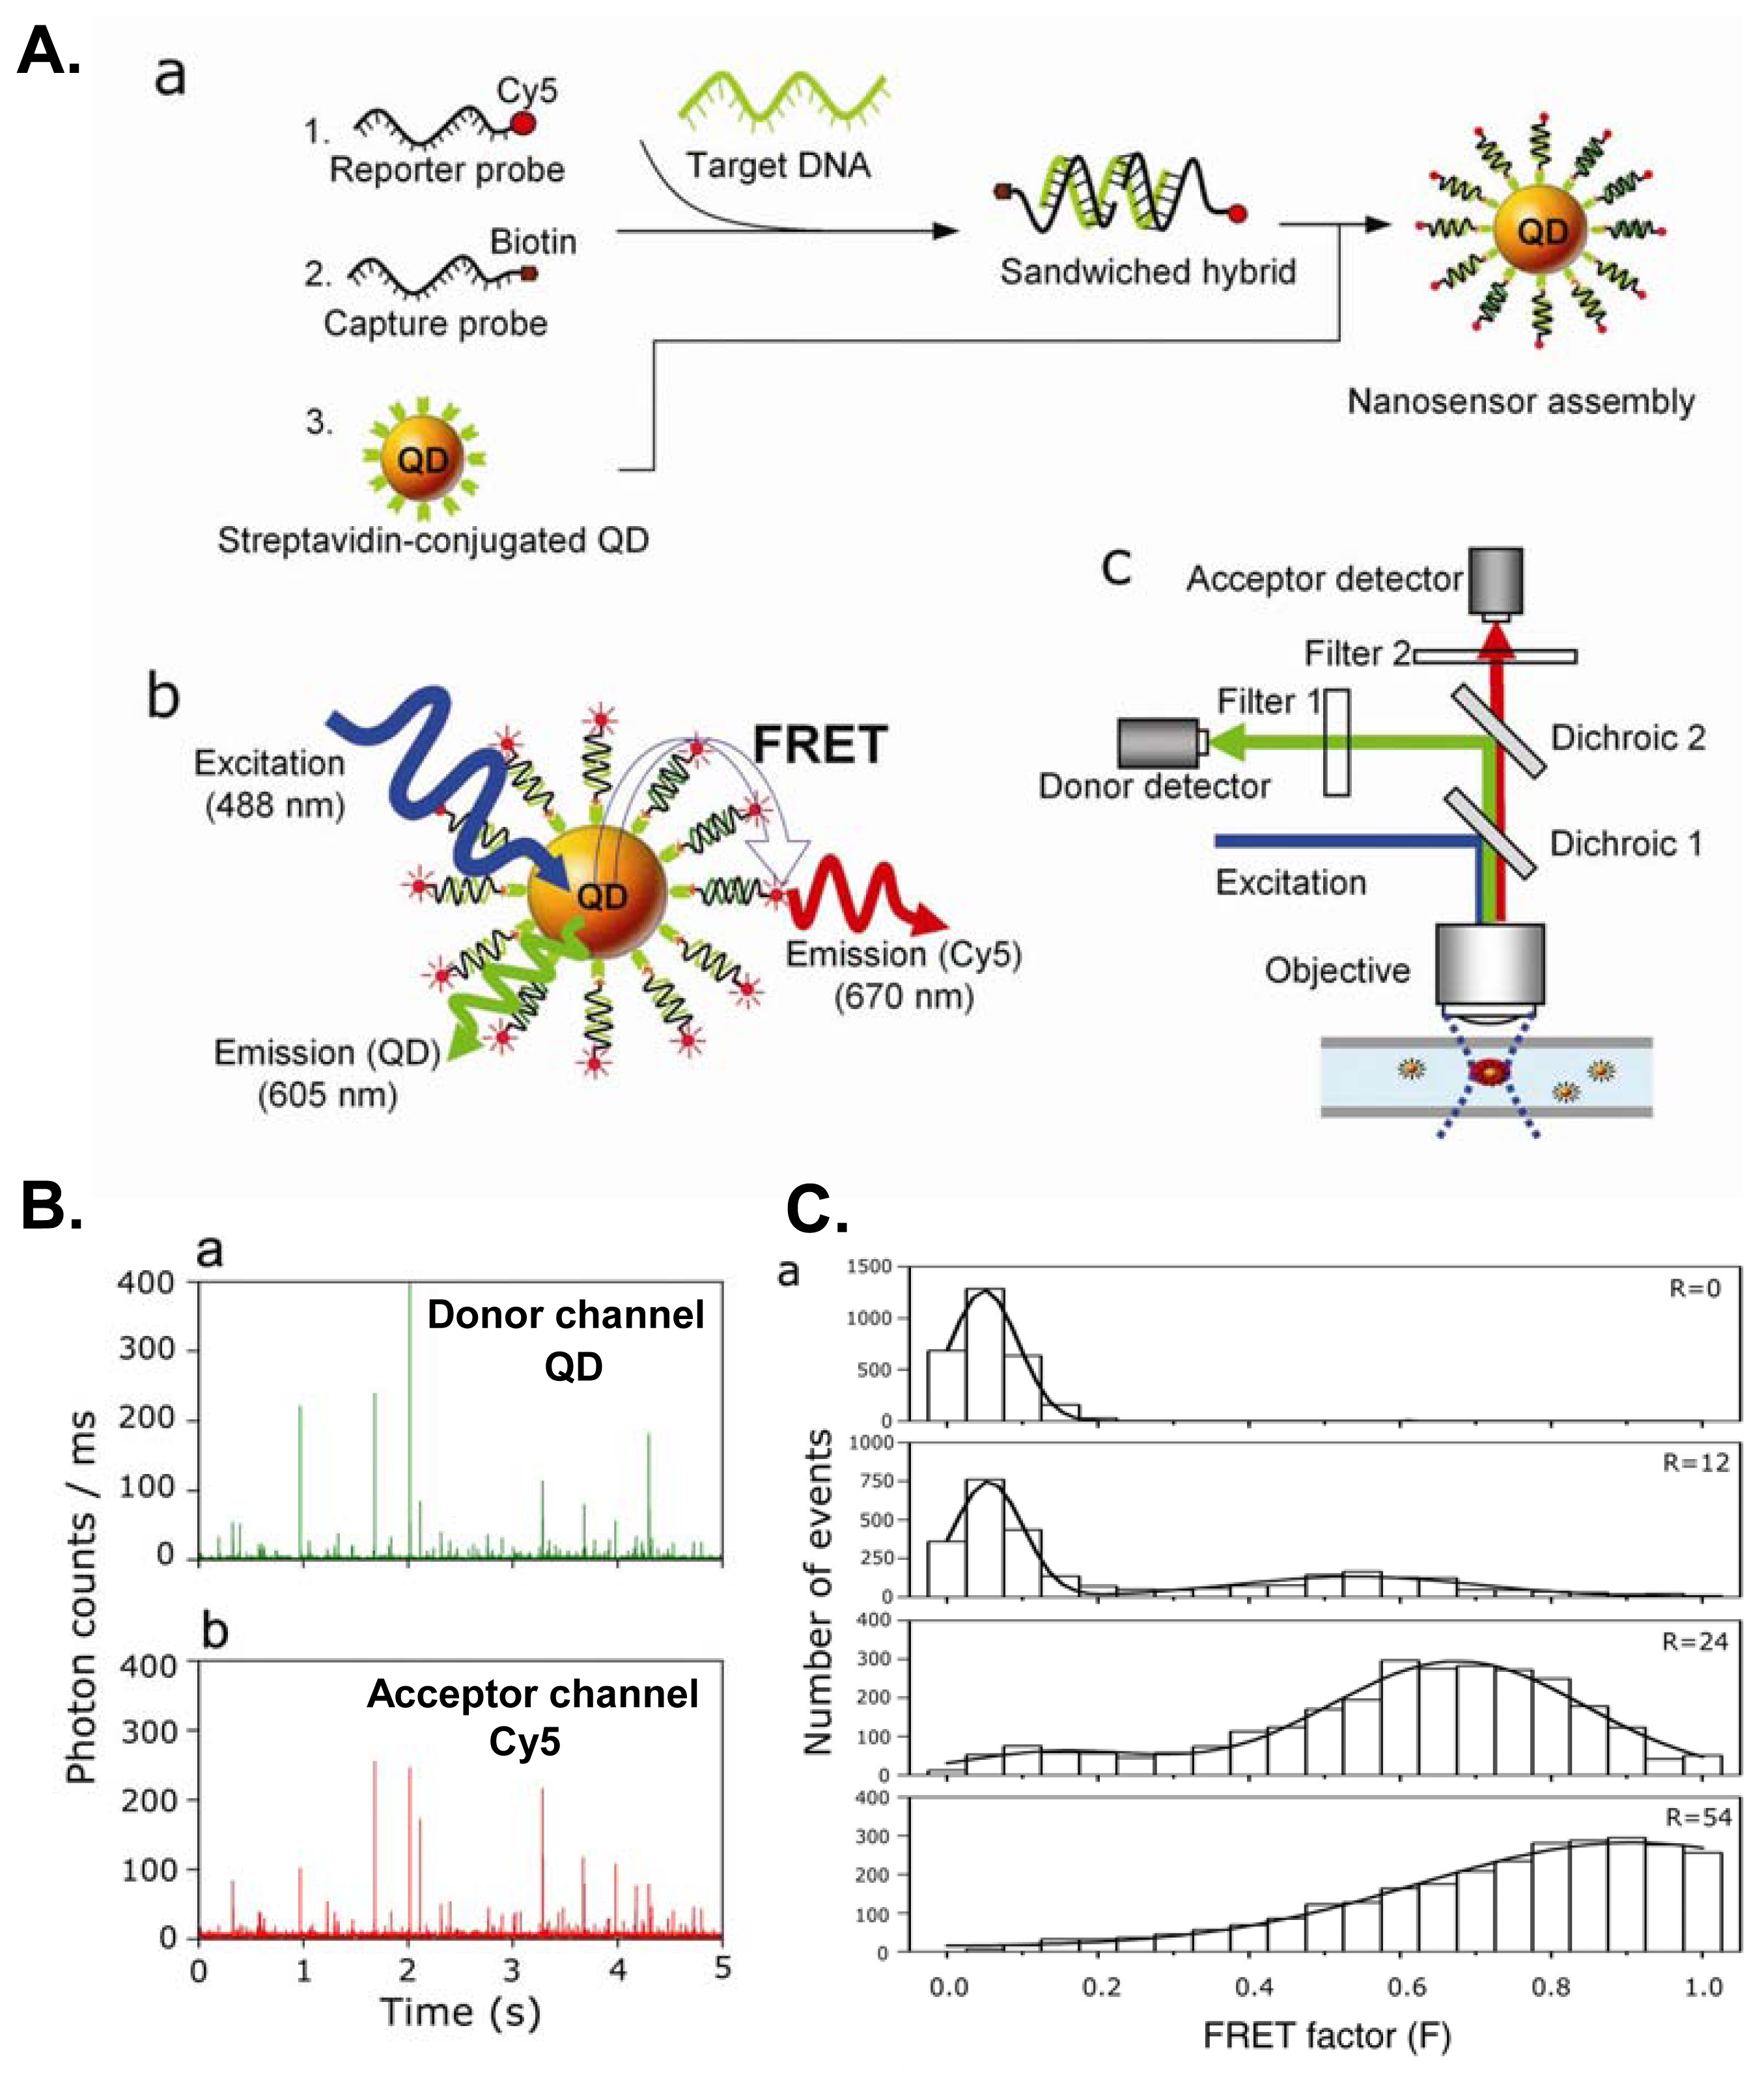
7. Sensing Based on FRET with Quantum Dot Bioconjugates

Fluorescence resonance energy transfer (FRET) between donor and acceptor molecules has been extensively used in biophysical and biochemical studies to probe ligand-receptor binding and molecular structural changes [2,105-107]. This is directly attributable to the sharp efficiency dependence of the process on the donor-acceptor separation distance at the 1-10 nanometer scale. QDs offer several advantages when used as FRET donors in place of organic dyes [108-110]. Their size-tunable and narrow emission spectra can considerably reduce donor spectral leakage into the acceptor channel. At the same time, their broad absorption spectrum at wavelengths to the blue of their emission allows choice of excitation that corresponds to the acceptor absorption minimum, substantially reducing direct excitation. While QDs are not expected to replace organic dyes in all FRET applications, recent studies suggest that they might significantly improve assay performances in a wide variety of sensing schemes.
Several studies have demonstrated the effective use of QD FRET donors to detect small analytes by utilizing a common strategy that relies on conjugating QDs to target binding receptors which can be either proteins [40,111], antibody fragments [55] or DNA aptamers [112], see Figure 6. The QDs conjugates are then exposed to appropriate acceptor-labeled target analogs which are brought in close proximity to the QDs by binding to the receptors. In this initial state, the QD-donor PL is quenched by efficient FRET to the proximal acceptor-labeled analogs. The presence of the target then displaces bound analogs from the surrounding conjugated receptors and this is detected through a reduction in FRET efficiency and the concomitant QD photoluminescence increase (Figure 6). This strategy has been utilized for detecting diverse analytes such as the nutrient maltose and the explosive TNT [40,55]. For the latter, a TNT analog labeled with a non-emissive dye-acceptor was used to quench the photoluminescence of a QD-anti-TNT antibody fragment conjugate via FRET [55]. Addition of TNT displaced the quencher-analog resulting in a disruption of FRET and a concentration-dependent recovery of the QD PL. The resulting QD sensing platform was further demonstrated for TNT detection in contaminated soil samples along with good specificity when tested against other TNT analogs. Overall, this type of detection method benefits from a wide library of receptor proteins, antibodies and aptamers which provide both flexibility and specificity. However, it requires the presence of labeled analogs in solution, and is therefore not suitable for continuous monitoring. A “reagentless” sensor approach that overcomes this issue has been demonstrated for the detection of maltose [113]. Here, QDs are conjugated to proteins that have been labeled with an environmentally-sensitive fluorescent acceptor. The acceptor location is such that the protein conformational change upon target binding modifies the acceptor quantum yield. The presence of the target does not induce any change in FRET efficiency, but is detected by a drop in the acceptor emission intensity [113]. In this case the QD donors play a dual role, allowing excitation far from the dye acceptor absorption and providing a reference signal to allow ratiometric signal detection.
QD FRET donors have also been used for DNA detection. QDs donors were used to follow telomerization, replication dynamics, hybridization and cleavage of QD-conjugated DNA through the incorporation of acceptor-labeled nucleotides [114,115]. Hybridization detection has been performed by conjugating probe oligonucleotide sequences to QDs and monitoring FRET upon hybridization with dye-labeled target DNA or RNA oligomers [103,115], or by forming molecular beacons composed of a QD donor and a dye acceptor [116]. A recent study exploited the QDs optical properties to improve the assay sensitivity of single particle DNA sensing [117]. Here, incubation of dye-labeled DNA targets with biotinylated capture DNA probes allows their conjugation to streptavidin QDs only when the two DNA sequences hybridize. This hybridization is then detected via FRET between the QD and the dye acceptor (Figure 7). This demonstration utilizes commercial QD materials and their large size (∼30 nm diameter) initially suggested that relatively poor FRET efficiency would result [118]. However, in this particular case, the high QD QY (≥ 50%), the high Cy5 acceptor molecular extinction coefficient (∼250,000 M-1 cm-1) and a large number of acceptors (12 – 54) around each donor can combine to overcome distance constraints arising from the QD size [117]. Additionally, the background due to acceptor direct excitation is virtually eliminated through the choice of an appropriate excitation wavelength. This led to a 100-fold improvement in sensitivity compared to single organic dye molecular beacon-based detection. These type of sensing schemes can also amenable to use in a multiplex format. The narrow and symmetric QD emissions allowing easy spectral deconvolution and the most straightforward configuration relies on several QD populations interacting with the same dye acceptor, rather than the opposite [110].
The main limiting factor in the performance of QDs as FRET donors lies with their size because the FRET efficiency depends on the center-to-center separation between donor and acceptor. Three variables contribute to overall QD donor size: 1-core shell radius, 2-coating and 3-bioconjugation. The CdSe-ZnS core-shell radius ranges from ∼2.5 nm for 510 nm QDs to 5 nm for 610 nm QDs, to which an additional 0.5 to 10 nm may be added for the coating or functionalization shell, depending on its structure [20]. With the exception of the example cited above, polymer coated QDs typically offer low FRET efficiencies due to QD center-dye distances larger than the Förster radius R0, which is typically between 4 and 6 nm. Successful QD FRET designs most often include very thin solubilization layers and direct attachment of bioreceptors to the QD surface [40,109,114-116,119].
An improvement in the viable sensing distance range may result from QD quenching by nanometer gold particles, which has shown very high efficiencies at large distances [120]. In preliminary demonstrations, gold nanoparticle/QD combinations have been used to detect the protease activity responsible for the cleavage of QD-conjugated gold-labeled peptides [121], and to detect gold-labeled DNA hybridization on a QD-DNA probe [122]. Even though the nature of this quenching mechanism is not clearly understood, it may present a valuable alternative to FRET with organic dye acceptors. In addition to allowing access to larger QD-quencher distances, gold nanoparticles are also less susceptible than organic dyes to photodegradation which can increase the sensors working lifespan. However, the use of gold nanoparticle quenching is limited by the additional steric problems brought by the gold particle size, and the absence of acceptor re-emission which precludes the use of ratiometric detection.
Finally, its worth noting that some of the very same optical properties that make QDs excellent FRET donors may also hinder their use as FRET acceptors [123]. While their broad absorption spectrum and high excitation cross sections result in large spectral overlaps and high FRET efficiencies, this can also result in the unavoidable direct excitation of the QD acceptor at a rate that is often greater than the FRET induced excitation. In addition, the QDs longer exciton lifetime compared to that of many organic dyes may also hinder efficient FRET from dyes to QDs [123]. That said, a recent study showed that QDs were able to be efficiently excited via bioluminescence resonance energy transfer (BRET) from conjugated Luciferase enzymes [124]. By eliminating any direct excitation of the acceptor, these ‘self-illuminating’ QDs hold great promise for the exploration of new QD-FRET sensing formats.

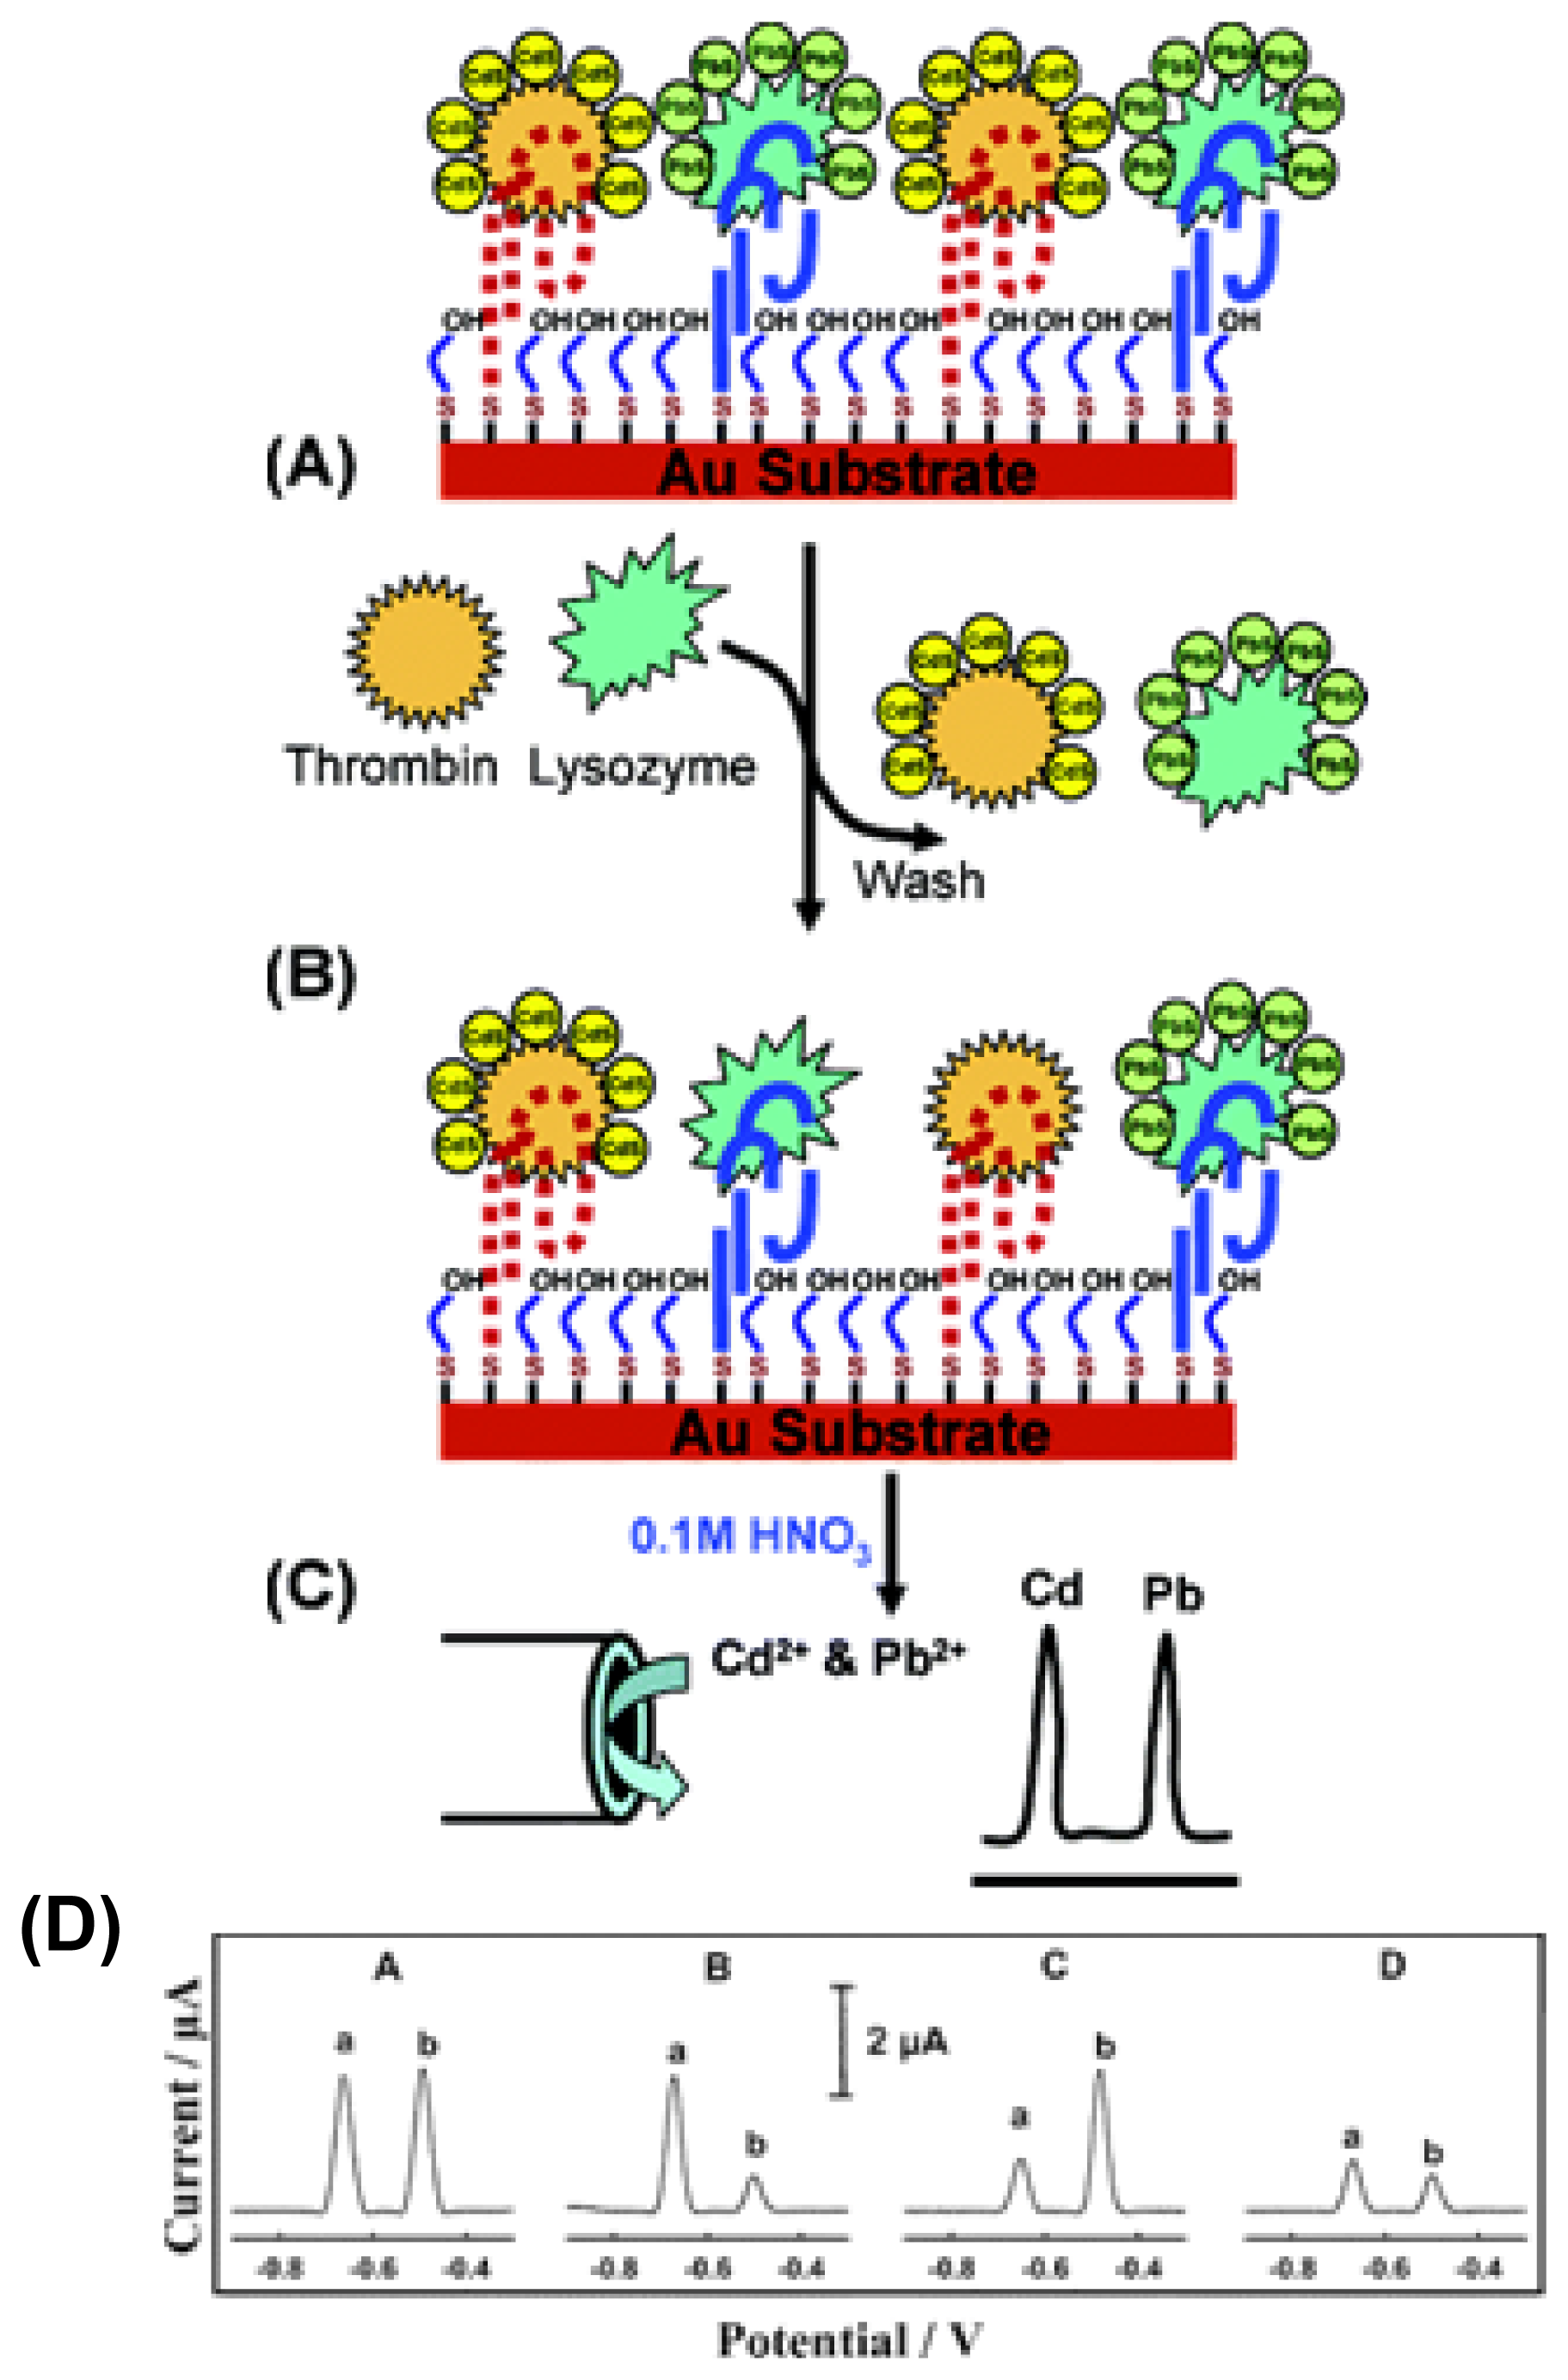
8. Other Quantum Dot Biosensing Modalities

There have been other QD biosensing demonstrations that do not fall into the above categories. The Leblanc group has reported that QD bioconjugates formed with the enzyme organophosphorus hydrolase (OPH) could detect the organophosphorus compound paraoxon in solution [46]. The OPH was electrostatically attached or self-assembled in solution to CdSe QDs capped with 2-mercaptoacetic acid. The photoluminescence of the subsequent QD-OPH bioconjugate was quenched in the presence of paraoxon and this process followed a Michaelis-Menten kinetic model. Conformational changes in QD-attached enzyme structure, as monitored by circular dichroism, were also only observed after paraoxon addition. A 10-8 M limit of detection was achieved with this system. Sensitivity could also be increased with an increasing molar ratio of OPH to QDs, but peaked at a ratio of ∼20 which corresponded to QD surface saturation. For the actual sensing mechanism, the authors surmise that OPH enzymatic activity alters its conformation which influences the degree of QD surface passivation. However, other complex mechanisms such as charge generation cannot be ruled out. As an unexpected benefit, the QD/OPH complex also detoxifies the paraoxon by catalyzing its hydrolysis.
Several groups have also tried to harness QD-electrochemical properties as a basis for biosensing. Strategies to accomplish this have focused on two different approaches: 1-monitoring of QD electrochemistry directly or 2-monitoring of QD photoelectrochemistry. In an example of the first approach, Hansen and coworkers used a mixed monolayer of thiolated aptamers attached to a gold substrate to capture either lysozyme or thrombin that had been attached to appropriate QDs via EDC-chemistry [125]. Addition of either lysozyme or thrombin displaced their cognate conjugates from the aptamers and the remaining captured nanocrystals were dissoluted from the monolayer with acid and identified by electrochemical-stripping voltametry on coated electrodes (see Figure 8). The demonstrated low attomolar detection limits represent a 3-4 order of magnitude improvement over previous aptamer based sensors and a fair trade-off for the multiple steps necessitated in this type of sensing. A similar strategy has also been used for the simultaneous detection of multiple DNA targets [126]. Benson has been investigating the second approach by utilizing RuII mediated electron transfer quenching of protein labeled QD conjugates [37,39]. Using MBP as a model protein they attached a RuII compound at several allosteric sites. The labeled protein was self-assembled to QDs through an orthogonal site engineered specifically for this attachment and the effect of maltose-induced MBP conformational changes on the QDs PL was monitored. The authors suggest that the proteins structural changes alter the RuII proximity to the QD and thus the electron-mediated quenching effects. Attachment of the RuII mediator at 4 mutant sites spread across the protein structure derived essentially the same binding constant which contrasts with previous fluorescence-based results [127]. Although not biosensing per se, complexes of QDs coated with cytochrome P450 enzyme were reported to be photoactivated and catalyzed the monooxygenation of fatty acid substrates [128]. This may represent the first attempt to couple photoactivation/catalysis to QDs which may eventually allow complex biosensors that can be controlled by light. Most recently, dopamine coated QDs have been used as an electron transfer cell-based biosensor [129]. The QD sensors responded to the more oxidizing cellular regions by increasing their PL.

9. Considerations When Using Quantum Dots for Biosensing

QDs are not meant to replace fluorescent dyes and proteins, but rather to be a specialized tool that can augment and complement them. As such, the first consideration should be whether QDs are warranted for a particular application. Does the desired sensing require something specialized that only QDs can provide such as an excitation wavelength far from the emission, a high photobleaching threshold, a long fluorescent lifetime or a complicated multiplexing scheme? Once committed to using QDs, the next issue is the choice of materials. As stated previously, in the visible region of the optical spectrum (500-620 nm), the best choice of material remains CdSe-ZnS core-shell QDs [8,14,20,21]. The redder CdTe QDs have been less common in biosensing applications and tend to have broader emission spectra (FWHM 50-100 nm). Since these QDs have emissions, ranging from 650-850 nm, one may be able to choose 2-3 of these QD dispersions for simultaneous use and still have excellent emission separation with appropriate filters. For biosensing, having the QD core overcoated and properly passivated has usually been important for both high QY and insulation from environmental sensitivity. An interesting exception to this general rule was recently reported by Zhelev who synthesized broad-emitting CdSe core only QDs capped with mercaptosuccinic acid that had a ∼50% QY and demonstrated them in several biological assays [80].
With the exception of a few specialized assays, the physical size of the QD should not be a limiting issue for most biosensing applications that are performed ex vivo. In fact size could be purposely exploited for the attachment of multiple bioprobes. Much larger fluorophores have been used quite effectively before including dye-impregnated particles [130], multi-protein phycobilisome complexes [131] and even dye-labeled virus particles [132]. The only format where size may be an important consideration is FRET. Similarly toxicity or metal leeching should not be an issue for most ex vivo applications as long as the QDs are appropriately overcoated and surface functionalized (except for appropriate disposal). Bioconjugation is probably the most important working consideration. Covalent chemical coupling of bioprobes to QDs will most probably be a multi-step process that necessitate purification. This may also require several attempts to optimize conditions. The use of EDC or other reactive chemistries can also lead to aggregate formation due the inherent instability of the QD when chemically altering its carboxyl solubilizing groups or the cross reaction of multiple QDs with multiple biomolecules [20,33]. Given these considerations, it appears that commercial QD materials with polymeric coatings that do not rely on charged carboxyl groups for solubility are more appropriate for these type of conjugation chemistries and commercial kits are available with protocols optimized for these reactions. Alternatively, commercially available avidin/streptavidin QDs may be better suited for facile attachment of biotinylated probe molecules including DNA or antibodies. Other strategies such as electrostatically driven self-assembly require an understanding of both the QD surface functionalization/charge and where the opposite charge is available on a biomolecule for optimal configuration/avidity.
Finally, it is clear from reviewing the many different strategies that multiplexing represents the largest untapped potential of QDs in biosensing and appropriate considerations are also warranted here. Care should be taken in choosing QDs whose emission spectra are well separated for easier identification/deconvolution. Additionally based upon where the sample is spectrally illuminated, some QDs in the mixture may fluoresce more than others due to excitation at an absorbance corresponding to a higher extinction coefficient. This can be easily corrected through spectral deconvolution or by the relative concentrations of QDs that are used together [110]. In summary, it appears that QDs can be a very effective complement to fluorescent dyes/proteins for many biosensing applications. Several associated areas still need to be developed; principally the surface functionalization ligands and the related methods for conjugating QDs to biomolecules (especially orthogonal conjugation). As these mature, we can expect QDs to become a more versatile tool for all aspects of fluorescent biosensing.

Acknowledgments

K.E. Sapsford and T. Pons contributed equally to this work. The authors acknowledge NRL and L. Chrisey at the Office of Naval Research (ONR grant # N001404WX20270) for support. T.P. acknowledges a post-doctoral fellowship from the Fondation pour la Recherche Medicale (France).

References and Notes

  1. Haugland, R.P. The Handbook A Guide to Fluorescent Probes and Labeling Technologies, Tenth Edition ed; Invitrogen Corporation; San Diego, 2005. [Google Scholar]
  2. Lakowicz, JR. Principles of Fluorescence Spectroscopy, Second Edition ed; Kluwer Academic/Plenum Publishers: New York, 1999. [Google Scholar]
  3. Giepmans, B.N.G.; Adams, S.R.; Ellisman, M.H.; Tsien, R.Y. The Fluorescent Toolbox for Assessing Protein Location and Function. Science 2006, 312, 217–224. [Google Scholar]
  4. Kricka, L.J. Stains, Labels and Detection Strategies for Nucleic Acids Assays. Annals of Clinical Biochemistry 2002, 39, 114–129. [Google Scholar]
  5. Chan, W.C.W.; Nie, S. Quantum Dot Bioconjugates for Ultrasensitive Nonisotopic Detection. Science 1998, 281, 2016–2018. [Google Scholar]
  6. Bruchez, M., Jr.; Moronne, M.; Gin, P.; Weiss, S.; Alivisatos, A.P. Semiconductor Nanocrystals as Fluorescent Biological Labels. Science 1998, 281, 2013–2016. [Google Scholar]
  7. Medintz, I.L.; Uyeda, H.T.; Goldman, E.R.; Mattoussi, H. Quantum Dot Bioconjugates for Imaging, Labelling and Sensing. Nature Materials 2005, 4, 435–446. [Google Scholar]
  8. Michalet, X.; Pinaud, F.F.; Bentolila, L.A.; Tsay, J.M.; Doose, S.; Li, J.J.; Sundaresan, G.; Wu, A.M.; Gambhir, S.S.; Weiss, S. Quantum Dots for Live Cells, In Vivo Imaging, and diagnostics. Science 2005, 307, 538–544. [Google Scholar]
  9. Alivisatos, A.P.; Gu, W.; Larabell, C.A. Quantum Dots as Cellular Probes. Ann. Rev. Biomed. Eng. 2005, 7, 55–76. [Google Scholar]
  10. Parak, W.J.; Pellegrino, T.; Plank, C. Labelling of Cells with Quantum Dots. Nanotech 2005, 16, R9–R25. [Google Scholar]
  11. Parak, W.J.; Boudreau, R.; Le Gros, M.; Gerion, D.; Zanchet, D.; Micheel, C.M.; Williams, S.C.; Alivisatos, A.P.; Larabell, C. Cell Motility and Metastatic Potential Studies Based on Quantum Dot Imaging of Phagokinetic Tracks. Adv. Mater. 2002, 14, 882–885. [Google Scholar]
  12. Parak, W.J.; Gerion, D.; Pellegrino, T.; Zanchet, D.; Micheel, C.; Williams, S.C.; Boudreau, R.; Le Gros, M.A.; Larabell, C.A.; Alivisatos, A.P. Biological Applications of Colloidal Nanocrystals. Nanotech. 2003, 14, R15–R27. [Google Scholar]
  13. Murray, C.B.; Norris, D.J.; Bawendi, M.G. Synthesis and Characterization of Nearly Monodisperse CdE (E = Sulfur, Selenium, Tellurium) Semiconductor Nanocrystallites. J. Am. Chem. Soc. 1993, 115, 8706–8715. [Google Scholar]
  14. Dabbousi, B.O.; Rodriguez-Viejo, J.; Mikulec, F.V.; Heine, J.R.; Mattoussi, H.; Ober, R.; Jensen, K.F.; Bawendi, M.G. (CdSe)ZnS Core-Shell Quantum Dots: Synthesis and Optical and Structural Characterization of a Size Series of Highly Luminescent Materials. J. Phys. Chem. B. 1997, 101, 9463–9475. [Google Scholar]
  15. Peng, X.; Schlamp, M.C.; Kadavanich, A.V.; Alivisatos, A.P. Epitaxial Growth of Highly Luminescent CdSe/CdS Core/Shell Nanocrystals with Photostability and Electronic Accessibility. J. Am. Chem. Soc. 1997, 119, 7019–7029. [Google Scholar]
  16. Murray, C.B.; Kagan, C.R.; Bawendi, M.G. Synthesis and Characterization of Monodisperse Nanocrystals and Close-Packed Nanocrystal Assemblies. Ann. Rev. Mater. Sci. 2000, 30, 545–610. [Google Scholar]
  17. Derfus, A.M.; Chan, W.C.W.; Bhatia, S.N. Probing the Cytotoxicity of Semiconductor Quantum Dots. NanoLett. 2004, 4, 11–18. [Google Scholar]
  18. Hines, M.A.; Guyot-Sionnest, P. Synthesis and Characterization of Strongly Luminescing ZnS-Capped CdSe Nanocrystals. J. Phys. Chem. 1996, 100, 468–471. [Google Scholar]
  19. Peng, Z.A.; Peng, X. Formation of High-Quality CdTe, CdSe, and CdS Nanocrystals Using CdO as Precursor. J. Am. Chem. Soc. 2001, 123, 183–184. [Google Scholar]
  20. Ozkan, M. Quantum Dots and Other Nanoparticles: What Can They Offer to Drug Discovery? Drug Discovery Today 2004, 9, 1065–1071. [Google Scholar]
  21. Murphy, C.J. Optical Sensing with Quantum Dots. Anal. Chem. 2002, 74, 520A–526A. [Google Scholar]
  22. Kippeny, T.; Swafford, L.A.; Rosenthal, S.J. Semiconductor Nanocrystals: A Powerful Visual Aid for Introducing the Particle in a Box. J. Chem. Ed. 2002, 79, 1094–1100. [Google Scholar]
  23. Alivisatos, A.P. The Use of Nanocrystals in Biological Detection. Nature Biotech. 2004, 22, 47–52. [Google Scholar]
  24. Striolo, A.; Ward, J.; Prausnitz, J.M.; Parak, W.J.; Zanchet, D.; Gerion, D.; Milliron, D.; Alivisatos, A.P. Molecular Weight, Osmotic Second Virial Coefficient, and Extinction Coefficient of Colloidal CdSe Nanocrystals. J. Phys. Chem. B. 2002, 106, 5500–5505. [Google Scholar]
  25. Leatherdale, C.A.; Woo, W.K.; Mikulec, F.V.; Bawendi, M.G. On the Absorption Cross Section of CdSe Nanocrystal Quantum Dots. J. Phys. Chem. B. 2002, 106, 7619–7622. [Google Scholar]
  26. Schrock, E.; duManoir, S.; Veldman, T.; Schoell, B.; Wienberg, J.; FergusonSmith, M.A.; Ning, Y.; Ledbetter, D.H.; BarAm, I.; Soenksen, D.; et al. Multicolor Spectral Karyotyping of Human Chromosomes. Science 1996, 273, 494–497. [Google Scholar]
  27. Bailey, R.E.; Smith, AM.; Nie, S.M. Quantum Dots in Biology and Medicine. Physica E-Low-Dimensional Systems & Nanostructures 2004, 25, 1–12. [Google Scholar]
  28. Pellegrino, T.; Kudera, S.; Liedl, T.; Javier, A.M.; Manna, L.; Parak, W.J. On the Development of Colloidal Nanoparticles Towards Multifunctional Structures and Their Possible Use for Biological Applications. Small 2005, 1, 48–63. [Google Scholar]
  29. Riegler, J.; Nann, T. Application of Luminescent Nanocrystals as Labels for Biological Molecules. Anal. Bioanal. Chem. 2004, 379, 913–919. [Google Scholar]
  30. Hermanson, G.T. Bioconjugate Techniques; Academic Press: San Diego, 1996. [Google Scholar]
  31. Zhang, C.Y.; Ma, H.; Nie, S.M.; Ding, Y.; Jin, L.; Chen, D.Y. Quantum Dot-Labeled Trichosanthin. Analyst 2000, 125, 1029–1031. [Google Scholar]
  32. Berti, L.; Xie, J.; Medintz, I.L.; Glazer, A.N.; Mathies, R.A. Energy Transfer Cassettes for Facile Labeling of Sequencing and PCR Primers. Anal. Biochem. 2001, 292, 188–197. [Google Scholar]
  33. Goldman, E.R.; Medintz, I.L.; Mattoussi, H. Luminescent Quantum Dots in Immunoassays. Anal. Bioanal. Chem. 2006, 384, 560–563. [Google Scholar]
  34. Mattoussi, H.; Mauro, J.M.; Goldman, E.R.; Anderson, G.P.; Sundar, V.C.; Mikulec, F.V.; Bawendi, M.G. Self-Assembly of CdSe-ZnS Quantum Dot Bioconjugates Using an Engineered Recombinant Protein. J. Am. Chem. Soc. 2000, 122, 12142–12150. [Google Scholar]
  35. Zhang, P. Investigation of Novel Quantum Dots/Proteins/Cellulose Bioconjugate using NSOM and Fluorescence. J. Fluorescence 2006, 16, 349–353. [Google Scholar]
  36. Slocik, J.M.; Moore, J.T.; Wright, D.W. Monoclonal Antibody Recognition of Histidine-Rich Peptide Encapsulated Nanoclusters. NanoLett. 2002, 2, 169–173. [Google Scholar]
  37. Sandros, M.G.; Gao, D.; Benson, D.E. A Modular Nanoparticle-Based System for Reagentless Small Molecule Biosensing. J. Am. Chem. Soc. 2005, 127, 12198–12199. [Google Scholar]
  38. Sandros, M.G.; Gao, D.; Gokdemir, C.; Benson, D.E. General, High-Affinity Approach for the Synthesis of Fluorophore Appended Protein Nanoparticle Assemblies. Chem. Comm. 2005, 22, 2832–2834. [Google Scholar]
  39. Sandros, M.G.; Shete, V.; Benson, D.E. Selective, Reversible, Reagentless Maltose Biosensing with Core-Shell Semiconducting Nanoparticles. The Analyst 2006, 131, 229–235. [Google Scholar]
  40. Medintz, I.L.; Clapp, A.R.; Mattoussi, H.; Goldman, E.R.; Fisher, B.; Mauro, J.M. Self-Assembled Nanoscale Biosensors Based on Quantum Dot FRET Donors. Nature Materials 2003, 2, 630–638. [Google Scholar]
  41. Ding, S.Y.; Rumbles, G.; Jones, M.; Tucker, M.P.; Nedeljkovic, J.; Simon, M.N.; Wall, J.S.; Himmel, M.E. Bioconjugation of (CdSe)ZnS Quantum Dots Using a Genetically Engineered Multiple Polyhistidine Tagged Cohesin/Dockerin Protein Polymer. Macromol. Mat. Eng. 2004, 289, 622–628. [Google Scholar]
  42. Ding, S.Y.; Jones, M.; Tucker, M.P.; Nedeljkovic, J.M.; Wall, J.; Simon, M.N.; Rumbles, G.; Himmel, M.E. Quantum Dot Molecules Assembled with Genetically Engineered Proteins. NanoLetters 2003, 3, 1581–1585. [Google Scholar]
  43. Pinaud, F.; King, D.; Moore, H.P.; Weiss, S. Bioactivation and Cell Targeting of Semiconductor CdSe/ZnS Nanocrystals with Phytochelatin-Related Peptides. J. Am. Chem. Soc. 2004, 126, 6115–6123. [Google Scholar]
  44. Tsay, J.M.; Doose, S.; Weiss, S. Rotational and Translational Diffusion of Peptide-Coated CdSe/CdS/ZnS Nanorods Studied by Fluorescence Correlation Spectroscopy. J. Am. Chem. Soc. 2006, 128, 1639–1647. [Google Scholar]
  45. Tsay, J.M.; Doose, S.; Pinaud, F.; Weiss, S. Enhancing the Photoluminescence of Peptide-Coated Nanocrystals with Shell Composition and UV Irradiation. J. Phys. Chem. B 2005, 109, 1669–1674. [Google Scholar]
  46. Ji, X.J.; Zheng, J.Y.; Xu, J.M.; Rastogi, V.K.; Cheng, T.C.; DeFrank, J.J.; Leblanc, R.M. (CdSe)ZnS Quantum Dots and Organophosphorus Hydrolase Bioconjugate as Biosensors for Detection of Paraoxon. J. Phys. Chem. B 2005, 109, 3793–3799. [Google Scholar]
  47. Constantine, C.A.; Gattas-Asfura, K.M.; Mello, S.V.; Crespo, G.; Rastogi, V.; Cheng, T.C.; De Frank, J.J.; Leblanc, R.M. Layer-by-Layer Films of Chitosan, Organophosphorus Hydrolase and Thioglycolic Acid-Capped CdSe Quantum Dots for the Detection of Paraoxon. J. Phys. Chem. B 2003, 107, 13762–13764. [Google Scholar]
  48. Constantine, C.A.; Gattas-Asfura, K.M.; Mello, S.V.; Crespo, G.; Rastogi, V.; Cheng, T.-C.; DeFrank, J.J.; Leblanc, R.M. Layer-by-Layer Biosensor Assembly Incorporating Functionalized Quantum Dots. Langmuir 2003, 19, 9863–9867. [Google Scholar]
  49. Goldman, E.R.; Mattoussi, H.M.; Anderson, G.P.; Medintz, I.L.; Mauro, J.M. Fluoroimmunoassays Using Antibody-Conjugated Quantum Dots. Methods Molecular Biology 2005, 303, 19–34. [Google Scholar]
  50. Goldman, E.R.; Anderson, G.P.; Tran, P.T.; Mattoussi, H.; Charles, P.T.; Mauro, J.M. Conjugation of Luminescent Quantum Dots with Antibodies Using an Engineered Adaptor Protein to Provide New Reagents for Fluoroimmunoassays. Anal. Chem. 2002, 74, 841–847. [Google Scholar]
  51. Goldman, E.R.; Balighian, E.D.; Kuno, M.K.; Labrenz, S.; Tran, P.T.; Anderson, G.P.; Mauro, J.M.; Mattoussi, H. Luminescent Quantum Dot-Adaptor Protein-Antibody Conjugates for Use in Fluoroimmunoassays. Phys. Stat. Sol. B. 2002, 229, 407–414. [Google Scholar]
  52. Goldman, E.R.; Balighian, E.D.; Mattoussi, H.; Kuno, M.K.; Mauro, J.M.; Tran, P.T.; Anderson, G.P. Avidin: A Natural Bridge for Quantum Dot-Antibody Conjugates. J. Am. Chem. Soc. 2002, 124, 6378–6382. [Google Scholar]
  53. Goldman, E.R.; Clapp, A.R.; Anderson, G.P.; Uyeda, H.T.; Mauro, J.M.; Medintz, I.L.; Mattoussi, H. Multiplexed Toxin Analysis Using Four Colors of Quantum Dot Fluororeagents. Anal. Chem. 2004, 76, 684–688. [Google Scholar]
  54. Goldman, E.R.; Medintz, I.L.; Hayhurst, A.; Anderson, G.P.; Mauro, J.M.; Iverson, B.L.; Georgiou, G.; Mattoussi, H. Self-Assembled Luminescent CdSe-ZnS Quantum Dot Bioconjugates Prepared Using Engineered Poly-Histidine Terminated Proteins. Analytica Chimica Acta 2005, 534, 63–67. [Google Scholar]
  55. Goldman, E.; Medintz, I.; Whitley, J.; Hayhurst, A.; Clapp, A.; Uyeda, H.; Deschamps, J.; Lassman, M.; Mattoussi, H. A Hybrid Quantum Dot-Antibody Fragment Fluorescence Resonance Energy Transfer-Based TNT Sensor. J. Am. Chem. Soc. 2005, 127, 6744–6751. [Google Scholar]
  56. Mamedova, N.N.; Kotov, N.A.; Rogach, A.L.; Studer, J. Albumin-CdTe Nanoparticle Bioconjugates: Preparation, Structure, and Interunit Energy Transfer with Antenna Effect. NanoLett. 2001, 1, 281–286. [Google Scholar]
  57. Hanaki, K.; Momo, A.; Oku, T.; Komoto, A.; Maenosono, S.; Yamaguchi, Y.; Yamamoto, K. Semiconductor Quantum Dot/Albumin Complex is a Long-Life and Highly Photostable Endosome Marker. Biochem. Biophys. Res. Comm. 2003, 302, 496–501. [Google Scholar]
  58. Wang, L.Y.; Wang, L.; Gao, F.; Yu, Z.Y.; Wu, Z.M. Application of Functionalized CdS Nanoparticles as Fluorescence Probe in the Determination of Nucleic Acids. Analyst 2002, 127, 977–980. [Google Scholar]
  59. Wang, L.Y.; Kan, X.W.; Zhang, M.C.; Zhu, C.Q.; Wang, L. Fluorescence for the Determination of Protein with Functionalized Nano-ZnS. Analyst 2002, 127, 1531–1534. [Google Scholar]
  60. Zhu, C.Q.; Zhao, D.H.; Chen, J.L.; Li, Y.X.; Wang, L.Y.; Wang, L.; Zhou, Y.Y.; Zhuo, S.J.; Wu, Y.Q. Application of L-Cysteine-Capped Nano-ZnS as a Fluorescence Probe for the Determination of Proteins. Anal. Bioanal. Chem. 2004, 378, 811–815. [Google Scholar]
  61. Lin, Z.; Cui, S.; Zhang, H.; Chen, Q.; Yang, B.; Su, X.; Zhang, J.; Jin, Q. Studies on Quantum Dots Synthesized in Aqueous Solution for Biological Labeling Via Electrostatic Interaction. Analytical Biochemistry 2003, 319, 239–243. [Google Scholar]
  62. Chen, X.D.; Wang, X.B.; Liu, L.; Yang, D.C.; Fan, L. Functionalized Semiconductor Nanocrystals for Ultrasensitive Detection of Peptides. Analytica Chimica Acta 2005, 542, 144–150. [Google Scholar]
  63. Liang, J.; Huang, S.; Zeng, D.; He, Z.; Ji, X.J.; Ai, X.; Yang, H. CdSe Quantum Dots as Luminescent Probes for Spironolactone Determination. Talanta 2006, 69, 126–130. [Google Scholar]
  64. Gattas-Asfura, K.A.; Leblanc, R.M. Peptide-Coated CdS Quantum Dots for the Optical Detection of Copper(II) and Silver(I). Chemical Comm. 2003, 21, 2684–2685. [Google Scholar]
  65. Bo, C.; Ping, Z. A New Determining Method of Copper(III) Ions at ng ml(-1) Levels Based on Quenching of the Water-Soluble Nanocrystals Fluorescence. Anal. Bioanal. Chem. 2005, 381, 986–992. [Google Scholar]
  66. Wang, L.; Xia, T.T.; Liu, J.S.; Wang, L.Y.; Chen, H.Q.; Dong, L.; Bian, G.R. Preparation and Application of a Novel Core/Shell Organic Nanoparticle as a Fluorescence Probe in the Selective Determination of Cr(VI). Spectrochimica Acta Part a-Molecular and Biomolecular Spectroscopy 2005, 62, 565–569. [Google Scholar]
  67. She, S.K.; Zhou, Y.Y.; Zhang, L.; Wang, L.Y.; Wang, L. Preparation of Fluorescent Polyvinyl Alcohol Keto-Derivatives Nanoparticles and Selective Determination of Chromium(VI). Spectrochimica Acta Part a-Molecular and Biomolecular Spectroscopy 2005, 62, 711–715. [Google Scholar]
  68. Jin, W.J.; Fernandez-Arguelles, M.T.; Costa-Fernandez, J.M.; Pereiro, R.; Sanz-Medel, A. Photoactivated Luminescent CdSe Quantum Dots as Sensitive Cyanide Probes in Aqueous Solutions. Chem. Comm. 2005, 7, 883–885. [Google Scholar]
  69. Wang, S.P.; Mamedova, N.; Kotov, N.A.; Chen, W.; Studer, J. Antigen/Antibody Immunocomplex from CdTe Nanoparticle Bioconjugates. NanoLetters 2002, 2, 817–822. [Google Scholar]
  70. Sun, B.Q.; Xie, W.Z.; Yi, G.S.; Chen, D.P.; Zhou, Y.X.; Cheng, J. Microminiaturized Immunoassays Using Quantum Dots as Fluorescent Label by Laser Confocal Scanning Fluorescence Detection. J. Immunological Methods 2001, 249, 85–89. [Google Scholar]
  71. Li, J.; Zhao, K.; Hong, X.; Yuan, H.; Ma, L.; Li, J.H.; Bai, Y.B.; Li, T.J. Prototype of Immunochromatographic Assay Strips Using Colloidal CdTe Nanocrystals as Biological Luminescent Label. Colloids and Surfaces B-Biointerfaces 2005, 40, 179–182. [Google Scholar]
  72. Zahavy, E.; Freeman, E.; Lustig, S.; Keysary, A.; Yitzhaki, S. Double Labeling and Simultaneous Detection of B- and T- Cells Using Fluorescent Nanocrystal (Q-Dots) in Paraffin-Embedded Tissues. J.Fluorescence 2005, 15, 661–665. [Google Scholar]
  73. Wang, H.Z.; Wang, H.Y.; Liang, R.Q.; Ruan, K.C. Detection of Tumor Marker CA125 in Ovarian Carcinoma Using Quantum Dots. Acta Biochimica Et Biophysica Sinica 2004, 36, 681–686. [Google Scholar]
  74. Colton, H.M.; Falls, J.G.; Ni, H.; Kwanyuen, P.; Creech, D.; McNeil, E.; Casey, W.M.; Hamilton, G.; Cariello, N.F. Visualization and Quantitation of Peroxisomes using Fluorescent Nanocrystals: Treatment of Rats and Monkeys with Fibrates and Detection in the Liver. Toxicological Sciences 2004, 80, 183–192. [Google Scholar]
  75. Stsiapura, V.; Sukhanova, A.; Artemyev, M.; Pluot, M.; Cohen, J.H.M.; Baranov, A.V.; Oleinikov, V.; Nabiev, I. Functionalized Nanocrystal-Tagged Fluorescent Polymer Beads: Synthesis, Physicochemical Characterization, and Immunolabeling Application. Analytical Biochemistry 2004, 334, 257–265. [Google Scholar]
  76. Jaiswal, J.K.; Goldman, E.R.; Mattoussi, H.; Simon, S.M. Use of Quantum Dots for Live Cell Imaging. Nature Methods 2004, 1, 73–78. [Google Scholar]
  77. Ornberg, R.L.; Harper, T.F.; Hongjian, L. Western Blot Analysis with Quantum Dot Fluorescence Technology: a Sensitive and Quantitative Method for Multiplexed Proteomics. Nature Methods 2005, 2, 79–81. [Google Scholar]
  78. Makrides, S.C.; Gasbarro, C.; Bello, J.M. Bioconjugation of Quantum Dot Luminescent Probes for Western Blot Analysis. Biotechniques 2005, 39, 501–506. [Google Scholar]
  79. Bakalova, R.; Zhelev, Z.; Ohba, H.; Baba, Y. Quantum Dot-Based Western Blot Technology for Ultrasensitive Detection of Tracer Proteins. J. Am. Chem. Soc. 2005, 127, 3928–9329. [Google Scholar]
  80. Zhelev, Z; Bakalova, R.; Ohba, H.; Jose, R.; Imai, Y.; Baba, Y. Uncoated, Broad Fluorescent, and Size-Homogeneous CdSe Quantum Dots for Bioanalyses. Anal. Chem. 2006, 78, 321–330. [Google Scholar]
  81. Geho, D.; Lahar, N.; Gurnani, P.; Huebschman, M.; Herrmann, P.; Espina, V.; Shi, A.; Wulfkuhle, J.; Garner, H.; Petricoin, E.; et al. Pegylated, Streptavidin-Conjugated Quantum dots are effective Detection Elements for Reverse-Phase Protein Microarrays. Bioconj. Chem. 2005, 16, 559–566. [Google Scholar]
  82. de Farias, P.M.A.; Santos, B.S.; de Menezes, F.D.; Ferreira, R.D.; Barias-Castro, M.L.; Castro, V.; Lima, P.R.M.; Fontes, A.; Cesar, C.L. Investigation of Red Blood Cell Antigens with Highly Fluorescent and Stable Semiconductor Quantum Dots. J. Biomedical Optics 2005, 10, 44023. [Google Scholar]
  83. Otsuka, Y.; Hanaki, K.; Zhao, J.Z.; Ohtsuki, R.; Toyooka, K.; Yoshikura, H.; Kuratsuji, T.; Yamamoto, K.; Kirikae, T. Detection of Mycobacterium bovis bacillus Calmette-Guerin Using Quantum Dot Immuno-Conjugates. Japanese J. Infect. Diseases 2004, 57, 183–184. [Google Scholar]
  84. Lee, L.Y.; Ong, S.L.; Hu, J.Y.; Ng, W.J.; Feng, Y.Y.; Tan, X.L.; Wong, S.W. Use of Semiconductor Quantum Dots for Photostable Immunofluorescence Labeling of Cryptosporidium parvum. App. Environ. Microbiol 2004, 70, 5732–5736. [Google Scholar]
  85. Zhu, L.; Ang, S.; Liu, W.T. Quantum Dots as a Novel Immunofluorescent Detection System for Cryptosporidium parvum and Giardia lamblia. App. Environ. Microbiol. 2004, 70, 597–598. [Google Scholar]
  86. Hahn, M.A.; Tabb, J.S.; Krauss, T.D. Detection of Single Bacterial Pathogens with Semiconductor Quantum Dots. Analyical Chemistry 2005, 77, 4861–4869. [Google Scholar]
  87. Yang, L.; Li, Y. Simultaneous Detection of Escherichia coli O157:H7 and Salmonella Typhimurium Using Quantum Dots as Fluorescence Labels. Analyst 2006, 131, 394–401. [Google Scholar]
  88. Zhang, Q.; Zhu, L.; Feng, H.H.; Ang, S.; Chau, F.S.; Liu, W.T. Microbial Detection in Microfluidic Devices Through Dual Staining of Quantum Dots-Labeled Immunoassay and RNA Hybridization. Analytica Chimica Acta 2006, 556, 171–177. [Google Scholar]
  89. Liu, W.T.; Zhu, L.; Qin, Q.W.; Zhang, Q.; Feng, H.H.; Ang, S. Microfluidic Device as a New Platform for Immunofluorescent Detection of Viruses. Lab on a Chip 2005, 5, 1327–1330. [Google Scholar]
  90. Bentzen, E.L.; House, F.; Utley, T.J.; Crowe, J.E.; Wright, D.W. Progression of Respiratory Syncytial Virus Infection Monitored by Fluorescent Quantum Dot Probes. NanoLett. 2005, 5, 591–595. [Google Scholar]
  91. Hoshino, A.; Fujioka, K.; Manabe, N.; Yamaya, S.; Goto, Y.; Yasuhara, M.; Yamamoto, K. Simultaneous Multicolor Detection System of the Single-Molecular Microbial Antigen with Total Internal Reflection Fluorescence Microscopy. Microbiology & Immunology 2005, 49, 461–470. [Google Scholar]
  92. Gerion, D.; Parak, W.J.; Williams, S.C.; Zanchet., D.; Micheel, C.M.; Alivisatos, A.P. Sorting Fluorescent Nanocrystals with DNA. J. Am. Chem. Soc. 2002, 124, 7070–7074. [Google Scholar]
  93. Gerion, D.; Chen, F.; Kannan, B.; Fu, A.; Parak, W.J.; Chen, D.J.; Majumdar, A.; Alivisatos, A.P. Room-Temperature Single-Nucleotide Polymorphism and Multiallele DNA Detection Using Fluorescent Nanocrystals and Microarrays. Anal. Chem. 2003, 75, 4766–4772. [Google Scholar]
  94. Shepard, J.R.E. Polychromatic Microarrays: Simultaneous Multicolor Array Hybridization of Eight Samples. Anal. Chem. 2006, 78, 2478–2486. [Google Scholar]
  95. Liang, R.Q.; Li, W.; Li, Y.; Tan, C.Y.; Li, J.X.; Jin, Y.X.; Ruan, K.C. An Oligonucleotide Microarray for microRNA Expression Analysis Based on Labeling RNA with Quantum Dot and NanogoldPprobe. Nucleic Acids Research 2005, 33, e17. [Google Scholar]
  96. Pathak, S.; Choi, S.K.; Arnheim, N.; Thompson, M.E. Hydroxylated Quantum Dots as Luminescent Probes for In Situ Hybridization. J. Am. Chem. Soc. 2001, 123, 4103–4104. [Google Scholar]
  97. Xu, H.X.; Sha, M.Y.; Wong, E.Y.; Uphoff, J.; Xu, Y.H.; Treadway, J.A.; Truong, A.; O'Brien, E.; Asquith, S.; Stubbins, M.; et al. Multiplexed SNP Genotyping Using the Qbead (TM) System: a Quantum Dot-Encoded Microsphere-Based Assay. Nucleic Acids Research 2003, 31, e43. [Google Scholar]
  98. Meissner, K.E.; Spillman, W.B., Jr. Quantum-Dot Tagged Microspheres for Fluid-Based Microarrays. Physica Status Solidi (c) 2003, 4, 1355–1359. [Google Scholar]
  99. Han, M.Y.; Gao, X.H.; Su, J.Z.; Nie, S. Quantum-Dot-Tagged Microbeads for Multiplexed Optical Coding of Biomolecules. Nature Biotech. 2001, 19, 631–635. [Google Scholar]
  100. Ho, Y.P.; Kung, M.C.; Yang, S.; Wang, T.H. Multiplexed Hybridization Detection with Multicolor Colocalization of Quantum Dot Nanoprobes. NanoLett. 2005, 5, 1693–1697. [Google Scholar]
  101. Chan, P.M.; Yuen, T.; Ruf, F.; Gonzalez-Maeso, J.; Sealfon, S.C. Method for Multiplex Cellular Detection of mRNAs Using Quantum Dot Fluorescent In Situ Hybridization. Nucleic Acids Research 2005, 33, e161. [Google Scholar]
  102. Xiao, Y.; Barker, P.E. Semiconductor Nanocrystal Probes for Human Metaphase Chromosomes. Nucleic Acids Research. 2004, 32, e161. [Google Scholar]
  103. Bakalova, R.; Zhelev, Z.; Ohba, H.; Baba, Y. Quantum Dot-Conjugated Hybridization Probes for Preliminary Screening of siRNA Sequences. J. Am. Chem. Soc. 2005, 127, 11328–11335. [Google Scholar]
  104. Crut, A.; Geron-Landre, B.; Bonnet, I.; Bonneau, S.; Desbiolles, P.; Escude, C. Detection of Single DNA Molecules by Multicolor Quantum-Dot End-Labeling. Nucleic Acids Research 2005, 33, e98. [Google Scholar]
  105. Sapsford, K.E.; Berti, L.; Medintz, I.L. Fluorescence Resonance Energy Transfer Concepts, Applications and Advances. Minerva Biotech 2005, 16, 253–279. [Google Scholar]
  106. Jares-Erijman, E.; Jovin, T. FRET Imaging. Nature Biotech. 2003, 21, 1387–1395. [Google Scholar]
  107. Miyawaki, A. Visualization of the Spatial and Temporal Dynamics of Intracellular Signaling. Dev. Cell 2003, 4, 295–305. [Google Scholar]
  108. Clapp, A.R.; Medintz, I.L.; Mattoussi, H. Forster Resonance Energy Transfer Investigations Using Quantum-Dot Fluorophores. ChemPhysChem 2006, 7, 47–57. [Google Scholar]
  109. Clapp, A.R.; Medintz, I.L.; Mauro, J.M.; Fisher, B.R.; Bawendi, M.G.; Mattoussi, H. Fluorescence Resonance Energy Transfer Between Quantum Dot Donors and Dye-Labeled Protein Acceptors. J. Am. Chem. Soc. 2004, 126, 301–310. [Google Scholar]
  110. Clapp, A.R.; Medintz, I.L.; Uyeda, H.T.; Fisher, B.R.; Goldman, E.R.; Bawendi, M.G.; Mattoussi, H. Quantum Dot-Based Multiplexed Fluorescence Resonance Energy Transfer. J. Am. Chem. Soc. 2005, 127, 18212–18221. [Google Scholar]
  111. Medintz, I.L.; Goldman, E.R.; Lassman, M.E.; Mauro, J.M. A Fluorescence Resonance Energy Transfer Sensor Based on Maltose Binding Protein. Bioconj. Chem. 2003, 14, 909–918. [Google Scholar]
  112. Levy, M.; Cater, S.F.; Ellington, A.D. Quantum-Dot Aptamer Beacons for the Detection of Proteins. Chembiochem 2005, 6, 2163–6. [Google Scholar]
  113. Medintz, I.L.; Clapp, A.R.; Melinger, J.S.; Deschamps, J.R.; Mattoussi, H. A Reagentless Biosensing Assembly Based on Quantum Dot-Donor Forster Resonance Energy Transfer. Adv. Mat. 2005, 17, 2450–2455. [Google Scholar]
  114. Patolsky, F.; Gill, R.; Weizmann, Y.; Mokari, T.; Banin, U; Willner, I. Lighting-Up the Dynamics of Telomerization and DNA Replication by CdSe-ZnS Quantum Dots. J. Am. Chem. Soc. 2003, 125, 13918–13919. [Google Scholar]
  115. Gill, R.; Willner, I.; Shweky, I.; Banin, U. Fluorescence Resonance Energy Transfer in CdSe/ZnS-DNA Conjugates: Probing hybridization and DNA cleavage. J. Phys. Chem. B 2005, 109, 23715–23719. [Google Scholar]
  116. Kim, J.H.; Morikis, D.; Ozkan, M. Adaptation of Inorganic Quantum Dots for Stable Molecular Beacons. Sensors Actuators B-Chemical 2004, 102, 315–319. [Google Scholar]
  117. Zhang, C.Y.; Yeh, H.C.; Kuroki, M.T.; Wang, T.H. Single-Quantum-Dot-Based DNA Nanosensor. Nature Materials 2005, 4, 826–831. [Google Scholar]
  118. Dubertret, B. Quantum Dots - DNA Detectives. Nature Materials 2005, 4, 797–798. [Google Scholar]
  119. Goldman, E.R.; Medintz, I.L.; Whitley, J.L.; Hayhurst, A.; Clapp, A.R.; Uyeda, H.T.; Deschamps, J.R.; Lassman, M.E.; Mattoussi, H. A Hybrid Quantum Dot-Antibody Fragment Fluorescence Resonance Energy Transfer-Based TNT Sensor. J. Am. Chem. Soc. 2005, 127, 6744–6751. [Google Scholar]
  120. Gueroui, Z.; Libchaber, A. Single-Molecule Measurements of Gold-Quenched Quantum Dots. Physical Review Letters 2004, 93, 166108. [Google Scholar]
  121. Chang, E.; Miller, J.S.; Sun, J.T.; Yu, W.W.; Colvin, V.L.; Drezek, R.; West, J.L. Protease-Activated Quantum Dot Probes. Biochem. Biophys. Res. Comm. 2005, 334, 1317–1321. [Google Scholar]
  122. Dyadyusha, L.; Yin, H.; Jaiswal, S.; Brown, T.; Baumberg, J.J.; Booy, F.P.; Melvin, T. Quenching of CdSe Quantum Dot Emission, a New Approach for Biosensing. Chem. Comm. 2005, 25, 3201–3203. [Google Scholar]
  123. Clapp, A.R.; Medintz, I.L.; Fisher, B.R.; Anderson, G.P.; Mattoussi, H. Can Luminescent Quantum Dots be Efficient Energy Acceptors with Organic Dye Donors? J. Am. Chem. Soc. 2005, 127, 1242–1250. [Google Scholar]
  124. So, M-K.; Xu, C.; Loening, A.M.; Gambir, S.S.; Rao., J. Self-Illuminating Quantum Dot Conjugates for In Vivo Imaging. Nature Biotech. 2006, 24, 339–343. [Google Scholar]
  125. Hansen, J.A.; Wang, J.; Kawde, A-N.; Xiang, Y.; Gothelf, K.V.; Collins, G. Quantum-Dot/Aptamer-Based Ultrasensitive Multi-Analyte Electrochemical Biosensor. J. Am. Chem. Soc. 2006, 128, 2228–2229. [Google Scholar]
  126. Wang, J.; Liu, G.; Merkoci, A. Electrochemical Coding Technology for Simultaneous Detection of Multiple DNA Targets. J. Am. Chem. Soc. 2003, 125, 3214–3215. [Google Scholar]
  127. De Lorimier, R.M.; Smith, J.J.; Dwyer, M.A.; Looger, L.L.; Sali, K.M.; Paavola, C.D.; Rizk, S.S.; Sadigov, S.; Conrad, D.W.; Loew, L.; et al. Construction of a Fluorescent Biosensor Family. Protein Science 2002, 11, 2655–2675. [Google Scholar]
  128. Ipe, B.I.; Lehnig, M.; Niemeyer, C.M. On the Generation of Free Radical Species From Quantum Dots. Small 2005, 1, 706–709. [Google Scholar]
  129. Clarke, S.J.; Hollmann, C.A.; Zhang, Z.H.; Suffern, D.; Bradforth, S.E.; Dimitrijevic, N.M.; Minarik, W.G.; Nadeau, J.L. Photophysics of Dopamine-Modified Quantum Dots and Effects on Biological Systems. Nat. Materials 2006, 5, 409–417. [Google Scholar]
  130. Niehren, S.; Kinzelbach, W.; Seeger, S.; Wolfrum, J. An All-Solid-State Flow Cytometer for Counting Fluorescent Microspheres. Anal. Chem. 1995, 67, 2666–2671. [Google Scholar]
  131. Morseman, J.P.; Moss, M.W.; Zoha, S.J.; Allnutt, F.C.T. PBXL-1: A New Fluorochrome Applied to Detection of Proteins on Membranes. Biotechniques 1999, 26, 559–563. [Google Scholar]
  132. Sapsford, K.E.; Soto, C.M.; Blum, A.S.; Chatterji, A.; Lin, T.; Johnson, J.E.; Ligler, F.S.; Ratna, B.R. A Cowpea Mosaic Virus Nanoscaffold for Multiplexed Antibody Conjugation: Application As An Immunoassay Tracer. Biosensors & Bioelectronics 2006, 21, 1668–1673. [Google Scholar]
  133. Medintz, IL.; Konnert, J.H.; Clapp, A.R.; Stanish, I.; Twigg, M.E.; Mattoussi, H.; Mauro, J.M.; Deschamps, J.R. A Fluorescence Resonance Energy Transfer Derived Structure of a Quantum Dot-Protein Bioconjugate Nanoassembly. P. N. A. S. U. S. A. 2004, 101, 9612–9617. [Google Scholar]
  134. Tsien, R.Y. The Green Fluorescent Protein. Ann. Rev. Bioch. 1998, 67, 509–544. [Google Scholar]
  135. Wu, X.; Liu, H.; Liu, J.; Haley, K.N.; Treadway, J.A.; Larson, J.P.; Ge, N.; Peale, F.; Bruchez, M.P. Immunofluorescent Labeling of Cancer Marker Her2 and Other Cellular Targets with Semiconductor Quantum Dots. Nature Biotech. 2003, 21, 41–46. [Google Scholar]
  136. Jaiswal, J.K.; Simon, S.M. Potentials and Pitfalls of Fluorescent Quantum Dots for Biological Imaging. Trends in Cell Biology 2004, 14, 497–504. [Google Scholar]
  137. Larson, D.R.; Zipfel, W.R.; Williams, R.M.; Clark, S.W.; Bruchez, M.P.; Wise, F.W.; Webb, W.W. Water-Soluble Quantum Dots for Multiphoton Fluorescence Imaging In Vivo. Science 2003, 300, 1434–1437. [Google Scholar]
  138. Lidke, D.S.; Arndt-Jovin, D.J. Imaging Takes a Quantum Leap. Physiology 2004, 19, 322–325. [Google Scholar]
  139. Kuno, M.; Fromm, D.P.; Hamann, H.F.; Gallagher, A.; Nesbitt, D.J. ‘On’/‘Off’ Fluorescence Intermittency of Single Semiconductor Quantum Dots. J. Chem. Phys. 2001, 115, 1028–1040. [Google Scholar]
  140. Wang, C.J.; Shim, M.; Guyot-Sionnest, P. Electrochromic Nanocrystal Quantum Dots. Science 2001, 291, 2390–2392. [Google Scholar]
Figure 1. Quantum Dot Properties. A. Color photo demonstrating the size-tunable fluorescence properties and spectral range of 6 CdSe/ZnS core/shell QD dispersions. All samples were excited at 365 nm with a UV source. For the 610 nm emitting QDs, this translates into an effective Stokes shift of ∼250 nm. Figure reprinted with permission of the Nature Publishing Group from ref [20]. B. Absorption of 510 nm QDs and emission of 510 nm, 555 nm, 570 nm, 590 nm QDs superimposed over the absorbance and emission spectra of Cy3 dye. C. Results from continuously monitoring the emission of a solution of QDs at the indicated laser powers as compared to a reference fluorescein dye standard demonstrating QD photostability. D. Comparison of the size of a representative dihydrolipoic acid (DHLA) capped CdSe/ZnS QD with ca. 550 nm emission, diameter ∼ 6 nm, to a maltose binding protein (MBP) molecule (mw∼ 44,000), green fluorescent protein (GFP, mw∼30,000) and a cyanine dye (Cy, mw∼700) adapted from [8].
Sensors 06 00925f1
Figure 2. Methods of Conjugating Biomolecules to QDs. A. Method 1 schematically shows covalent modification of either the amine, thiol or carboxyl groups displayed on the QD surface. Method 2 schematically shows direct attachment of biomolecules to atoms on the QD surface. This includes either dative thiol bonding or metal affinity driven coordination. Method 3 uses electrostatic interactions between QD surfaces and oppositely charged proteins or other biomolecules [20]. B. Schematic of methods for attaching antibodies and other proteins to DHLA-capped QDs. Positively charged avidin is used as a bridge to bind biotin-labeled antibodies. A protein G dimer expressing a positively charged leucine zipper domain (Zb) is used to bind the Fc domain of IgG. Antibody fragments appended with a poly-histidine (His6) sequence bind to the QD surface via metal-affinity coordination. Maltose binding protein (MBP) expressing a Zb domain is used for purification over amylose media. Adapted from [33,53]
Sensors 06 00925f2
Figure 3. Quantum Dot – Protein Interactions. Comparison of the ability of several proteins to increase QD photoluminescence upon interacting with the QD surface. In this case, polyhistidine (Hisn) expressing proteins self-assemble onto the QDs via metal affinity coordination [40,54]. Three maltose binding protein (MBP) variants expressing either 0, 5 or 11 C-terminal histidines and apo-myoglobin expressing a C-terminal 6-histidine tract were allowed to coordinate to the QDs at the indicated molar ratios. Changes in QD PL were then assayed fluorometrically and compared to the 0-ratio control. Note the MBP lacking a histidine-tract does not produce a PL increase.
Sensors 06 00925f3
Figure 4. Multiplex Immunoassays with Quantum Dots. A. Schematic of the 4-color multiplex assay. The indicated colors of QDs were prepared with antibodies against the 4-indicated toxins and simultaneously incubated in microtiter-well plates containing the 4-toxins immobilized by capture antibodies on the surface. B. Multi-toxin assay examining mixes of all four indicated toxins at 1000 ng/mL each probed with a mix of QD-detection antibody conjugates. Measured values are shown as circles. Both the composite fit and the fit from each of the four individual QD components are displayed. Reproduced with permission of the American Chemical Society [53].
Sensors 06 00925f4
Figure 5. QD-Detection in miRNA Microrrays. A. Images of microarrays hybridized with various concentrations of miRNAs ranging from 20 nM to 39 pM. A 50 mM concentration of oligonucleotide probes was printed on slides in five replicate spots. Hybridization of the microarrays was carried out in a 10 ml volume. B. Correlation between fluorescence intensity of spots and the concentrations of model miRNA. The values were calculated from the image in A. Open circle represents the background. C. Image of 11 model rice miRNAs profiled on the microarray and detected with QDs. The microarray was hybridized with biotinylated miRNAs from rice seedling leaves. The center areas in each quadrant are the negative controls. Figures kindly provided by K-C Ruan (S.I.B.S.) and reproduced from [95] with permission of the Oxford University Press.
Sensors 06 00925f5
Figure 6. Function of a QD-Maltose Binding Protein FRET Nanosensor. A. Each 560-nm-emitting QD is surrounded by an average of ∼10 MBP moieties; a single MBP is shown for simplicity. Formation of QD-MBP-β-CD-QSY9 (maximum absorption ∼565 nm) results in quenching of QD emission. Added maltose displaces β-CD-QSY9 from the sensor assembly, resulting in increase in direct QD emission. B. Titration of a 560QD-MBP conjugate with an increasing concentration of maltose. C. Transformation of titration data into a binding curve. The right axis shows PL at 560 nm and fractional saturation is shown on the left axis. The point corresponding to 50% saturation was used to derive the maltose apparent dissociation constant (Kapp) value. Assuming a range of useful measurement to be between 10 and 90% saturation translates into a sensing range of ∼500 nM to 100 μM maltose. Reproduced with permission of the Nature Publishing Group [133].
Sensors 06 00925f6
Figure 7. Single QD-Based DNA Nanosensor. A. Schematic of single-QD-based DNA nanosensors. a-Conceptual scheme showing the formation of a nanosensor assembly in the presence of targets. b-Fluorescence emission from Cy5 on illumination of the QD caused by FRET between Cy5 acceptors and a QD donor in a nanosensor assembly. c-Experimental setup. B. Representative traces of fluorescent bursts detected with the nanosensor. In the presence of targets, the fluorescent bursts are detected by both the QD donor (a) and Cy5 acceptor (b) detectors. C. FRET histograms from nanosensor assemblies with the different acceptor/donor R ratios. Figures kindly provided by T-H. Wang (J.H.U.) and reproduced from [117] with permission of the Nature Publishing Group.
Sensors 06 00925f7
Figure 8. Electrochemical Detection with Quantum Dots. A. Mixed monolayer of thiolated aptamers on the gold substrate with the bound protein-QD conjugates. B. Sample addition and displacement of the QD-tagged proteins. C. Dissolution of the remaining captured nanocrystals followed by their electrochemical-stripping detection at a coated glassy carbon electrode. D. Simultaneous bioelectronic detection of lysozyme and thrombin. Square-wave stripping voltammograms obtained after additions of A - 0 μg L-1 protein, B - 1 μg L-1 lysozyme, C - 0.5 μg L-1 thrombin, and D - a mixture of 1 μg L-1 lysozyme and 0.5 μg L-1 thrombin. Figures kindly provided by G. Collins (U.S. N.R.L.) and reprinted with permission of the American Chemical Society [125].
Sensors 06 00925f8
Table I. Comparison of organic/protein fluorophore and quantum dot properties.
PropertyFluorophoresQuantum DotsRef.
Photophysical
Absorption spectraVariable/narrow generally a mirror of the emission spectraBroad spectra, steadily increases towards the UV from the first absorption band edge[1,14,24,25]
Molar extinction coefficientsVariable, Generally < 200,000 M-1 cm-1High, 10-100X that of fluorophores[1,14,24,25]
Emission spectraBroad, asymmetric red-tailed emissionNarrow-full width at half-maximum 25-40 nm for CdSe core materials[14]
Maturation timeNeeded for fluorescent proteinsNA[134]
Effective Stokes shiftsGenerally < 100 nm> 200 nm possible[8,20]
Tunable emissionNAUnique to QDs / can be size-tuned from the UV to IR[8]
Quantum yieldVariable, low to highGenerally high, 0.2 to 0.7 in buffer depending upon surface coating[1,8,20]
Fluorescent lifetimeShort < 5 nsLong ∼ 10-20 ns or greater[8,20]
Spectral rangeNecessitates a different dye every 40-60 nmUV-IR depending upon binary/ternary material Vis - CdSe[1,8,14,20]
PhotostabilityVariable to poorExcellent, strong resistance to photobleaching several orders of magnitude that of dyes[135,136]
Multiphoton cross sectionVariable to poorExcellent >2-3 orders of magnitude that of dyes[137]
Single-molecule capabilitiesVariableExcellent[138]
FRET capabilitiesVariable, mostly single donor- single acceptor configurationsExcellent donors, size tune emission to improve the overlap with an acceptor dye, single donor-multiple acceptor configurations possible[109,110]
Multiplexing capabilitiesRareExcellent, largely unexplored[8,20]
Intermittency (blinking)NegligibleMaybe problematic in isolated circumstances (single molecule tracking)[8,20,139]
Chemical
Chemical resistanceVariableExcellent
ReactivityMultiple reactivities commercially availableLimited conjugation chemistries available[20]
Mono-valent attachmentEasyDifficult
Multi-valent attachmentRare – mostly bis-functionalGood possibilities, can attach several molecules to QDs depending upon size[20]
Other
Physical size< 0.5 nm4 – 7 nm diameter for CdSe core material[8]
ElectrochromicityRareLargely untapped[140]
Cost effectivenessVery good / multiple suppliersPoor / 2 commercial suppliers[1]

