Article

Influence of Different Genotypes on Trypsin Inhibitor Levels and Activity in Soybeans

Institute of Food Technology and Biochemistry, Faculty of Agriculture, University of Belgrade, 11081 Belgrade-Zemun, Serbia
*
Author to whom correspondence should be addressed.
Sensors 2007, 7(1), 67-74; https://doi.org/10.3390/s7010067
Submission received: 30 November 2006 / Accepted: 10 January 2007 / Published: 24 January 2007

Abstract

:
This study describes the relationship between the two major trypsin inhibitors (TI) in soybean, i.e., the Kunitz (KTI) and Bowman-Birk (BBI) trypsin inhibitors, as well as between them and the corresponding trypsin inhibitor activity (TIA). Twelve investigated soybean genotypes showed significant differences in TI levels and TIA. A very strong positive correlation was found between the levels of KTI and total BBI (r = 0.94, P < 0.05). No relationship was found between KTI, BBI or total TI and TIA. Based on this data, it appears that the levels of major TI in soybean are related. Understanding the relationship between trypsin inhibitors and their activities could be useful for further improvement of the health impacts of soy proteins.

1. Introduction

Soybeans present a good source of high quality protein and other nutrients. For a long time, many phytochemicals in soybeans have been considered as antinutrients and irrelevant to nutrition, since they neither yield energy nor function as vitamins [1]. Consequently, to reduce their activity, different treatments on biologically active components, especially trypsin inhibitors, were extensively studied [2-7]. Recently, there have been many important discoveries, which have demonstrated that various physiologically active phytochemicals may play critical roles in the prevention of diseases such as heart diseases and cancers. It has been suggested that the Kunitz (KTI) and Bowman-Birk (BBI) trypsin inhibitors suppress both initiation and promotion stages of carcinogenesis [8]In particular the Bowman-Birk inhibitor appears to be highly promising as a cancer chemopreventive agent. Consequently, several methods for making Bowman-Birk inhibitor concentrates were suggested [9-11]. Microencapsulation of BBI for better oral delivery was also proposed [12].
Enzyme assays were used in many studies to investigate the level of trypsin inhibitors in cultivars [13-15]. Nevertheless, the standard methods of measuring protease inhibitors in food by enzyme assays often gave inaccurate results with processed samples having low residual activity [3, 16]. Moreover, these low activities must be assessed in the presence of other proteases [17] and compounds, which inactivate trypsin inhibitors. In the past two decades, immunochemical methods such as ELISAs specific for KTI and BBI were developed to analyze inhibitors in different soybean lines, in processed foods and in non-soy foods fortified with soy proteins [18]. Polyacrilamide gel electrophoresis is also used to determine trypsin inhibitors content in raw, treated soybean extracts and traditional soy protein concentrate [7, 19].
It is know that protein composition varies among genotypes [20], as well as the levels of trypsin inhibitors [17]. Trypsin inhibitor activity (TIA) is also affected by the genotype [21]. However, little information is available about the relationship between the two major classes of trypsin inhibitors, i.e., KTI and BBI, and between TI content and correlated TIA. Further evaluation of trypsin inhibitors, TIA and the possible correlations among them is needed, especially in light of increasing interest in their beneficial health effects.
In this study, we analyzed the protease inhibitors in normal and KTI-lacking cultivars using native PAGE and scanning densitometry. We also investigated the varietal effect on trypsin inhibitor composition and correlated activity. In order to avoid changes in protease inhibitors concentrations and their activity caused by isolation and subsequent purification, the analysis were performed on protein extracts. Understanding the relationship between the levels of trypsin inhibitors and corresponding TIA could be useful to facilitate the selection of genotypes for certain types of processing and specific applications.

2. Experimental Section

Materials

Twelve soybean genotypes grown in 2001 under field conditions were evaluated. Six genotypes (Nena, ZPS-015, Lana, L91-31022, L94-1171, SG1-1) were selected by the Maize Research Institute Zemun Polje (Belgrade, Serbia) and the others (Krajina, Novosadjanka, Vojvodjanka, Proteinka, Balkan and Ravnica) by the Institute of Field and Vegetable Crops (Novi Sad, Serbia). Proteinka and Novosadjanka are high seed protein cultivars, and the Lana genotype lacks the Kunitz type of trypsin inhibitor. Reagents and chemicals used in this work were of analytical grade and were obtained from standard commercial sources.

Protein extracts

To obtain protein extracts for further investigation, protein was extracted for 1 h at room temperature from defatted meal with 0.03 M Tris-HCl buffer, pH 8 (containing 0.01M β-mercaptoethanol) in a 1:20 ratio. The mixture was centrifuged at 17,000g for 15 min at room temperature. The protein content in the supernatant was determined by the procedure of Lowry [22] at 750 nm.

PAGE

Polyacrylamide gel electrophoresis and scanning densitometry of the obtained gels were used to estimate the trypsin inhibitor concentration. PAGE was performed according to the method of Davis [23]. The separating gels were 7% (wt/vol), pH 8.9 and stacking gels were 5% (wt/vol), pH 6.7. A 25 µl sample of the extract (2 mg protein/mL) diluted with sample buffer [0.03 M Tris-HCl buffer with 0.01 M 2-mercaptoethanol, pH 8, 10% (vol/vol) glycerol, 0.0025% (wt/vol) bromophenol blue] was loaded per well. The gels were run in a buffer solution [0.05 M tris(hydroximethyl)aminomethane, 0.19 M glycine, 0.1% (wt/vol) SDS, pH 8.3] for 2.30 h to completion. Gels were fixed, stained with 0.23% (wt/vol) Coomassie®brilliant blue R250 (dissolved in 3.9% (wt/vol) trichloroacetic acid, 6% (vol/vol) acetic acid and 17% (vol/vol) methanol) for 1.5 h and destained with 18% (vol/vol) ethanol and 8% (vol/vol) acetic acid. The destained gels were scanned and then were analyzed by SigmaGel software version 1.1 (Jandal Scientific, San Rafael, CA). The determination of trypsin inhibitors was made using the standards of Kunitz and Bowman-Birk inhibitors (Sigma, USA). Their concentration was calculated from sum of the total area of extractable proteins [20]. To investigate varietal effect, electrophoresis of the storage proteins in 12 soybeans varieties was performed in duplicate. Namely, two aliquots of the same sample were analyzed at the same time. Two gels were run simultaneously in the same electrophoretic cell.

Trypsin inhibitor activity (TIA)

Trypsin inhibitor activity was estimated according to the method of Liu and Markakis [24] using α-N-benzoyl-DL-arginine-p-nitroanilide hydrochloride (BAPA) as substrate. The samples were extracted with distilled water (1:100 flour/water, wt/vol) for 30 min on a mechanical shaker. The extract was filtered through No 4 Whatman paper. An aliquot of the filtrate (10 mL) was diluted with 0.05 M Tris/HCl buffer pH 8.2 (1:1, extract/buffer) and filtered. The filtrate was then further diluted with distilled water (1:5, filtrate/water). A 1 mL sample of the diluted filtrate was incubated with 0.92 mM BAPA (1 mL) and enzyme solution (16 µg/mL in 0.001 M HCl) at 37 °C for 10 min. The reaction was stopped by the addition of 30% (vol/vol) acetic acid. The reaction was also run in the absence of inhibitors by replacing the sample with distilled water (1 mL). The absorbance was measured at 410 nm. Distilled water was used as a blank. Defining a trypsin unit as an A410 increase of 0.01 under the conditions of the assay, the inhibitor activity was expressed in trypsin units inhibited (TUI) per milligram of the dry sample.

Statistical analysis

All experiments were repeated three times except for elecrophoretic analysis, which were duplicated. The data were analyzed using Statistica software ver 6.0 (StatSoft Co., Tulsa, OK). The significance of differences between means was determined by t-test procedure for independent samples at P < 0.05. The results are given as the mean values. Regression analyses were also carried out.

3. Discussion

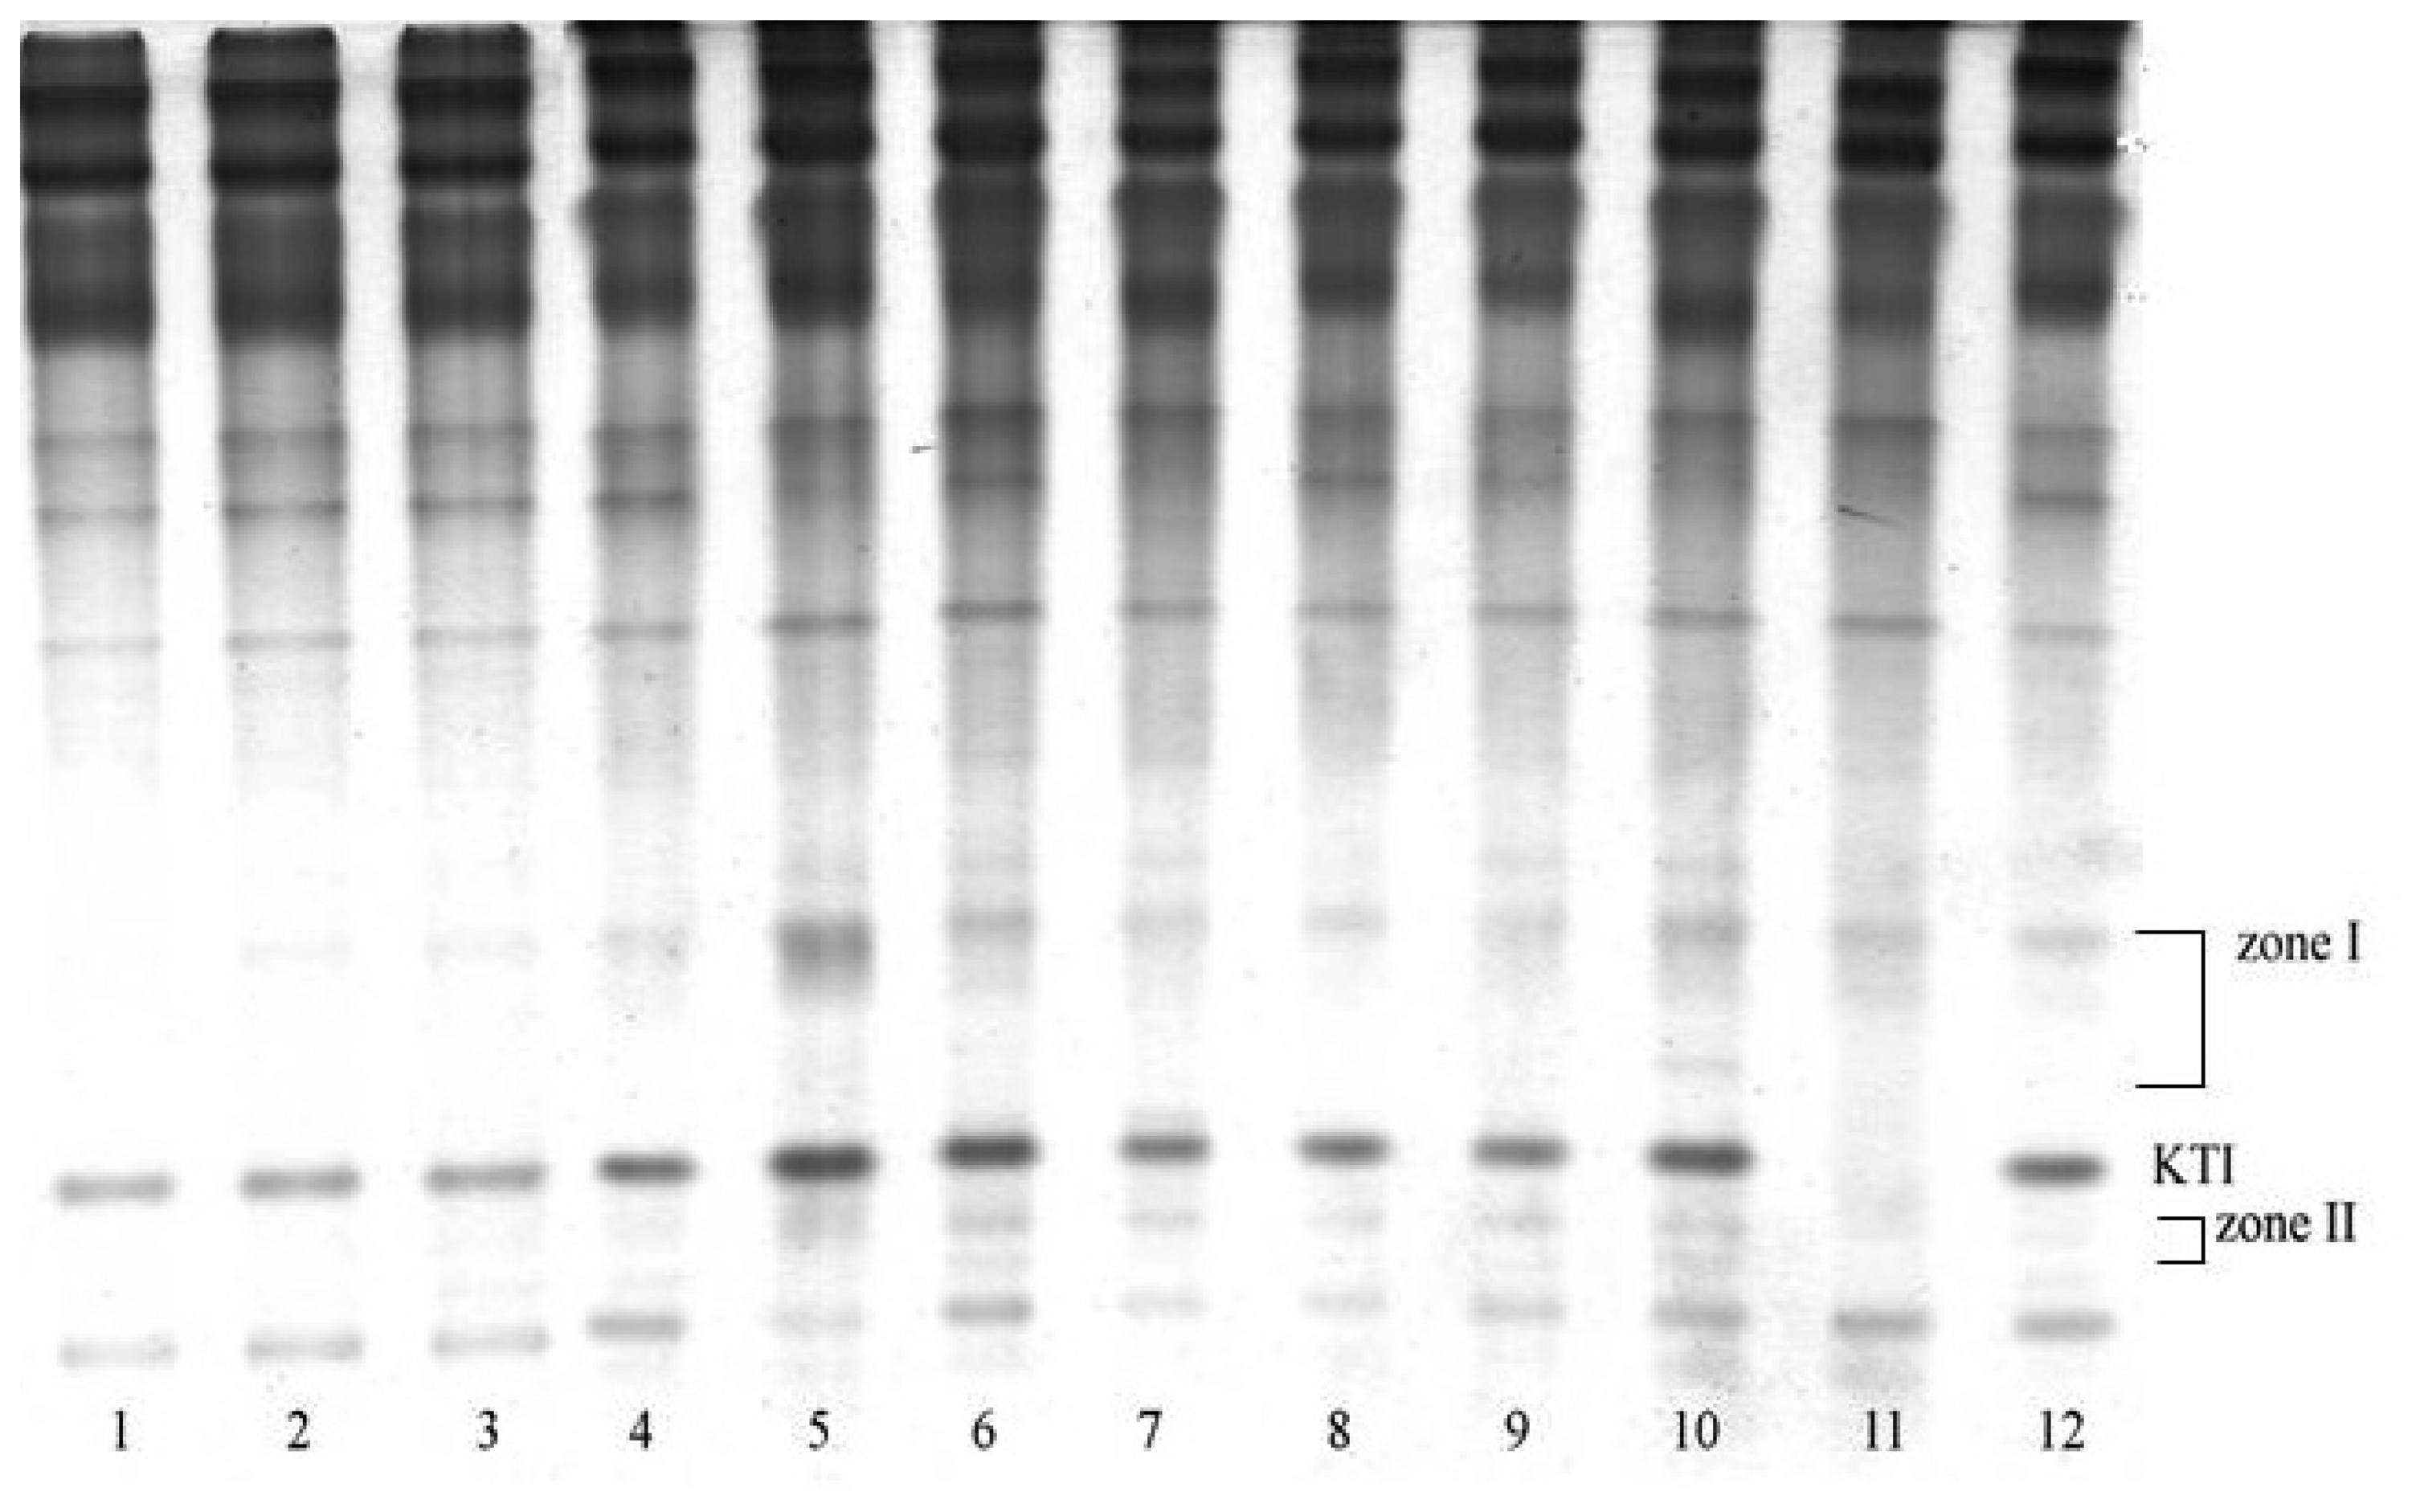
3.1. Electrophoretic analysis

PAGE separated total soybean proteins into several bands (Figure 1). According to our results, the Bowman-Birk type of trypsin inhibitors was detected in two zones, I and II, whereas the KTI was detected as one band. The zone with lower electrophoretic mobility represents the polymeric forms of BBI, whereas the other represents monomeric forms of BBI [7]. The presence of polymeric forms of BBI is result of their self-aggregation under non-dissociating conditions. [11, 25].
The trypsin inhibitor concentrations of the twelve soybean genotypes studied are shown in Table 1. As one can see, the investigated soybean varieties displayed different TI levels. The concentration of KTI ranged from 4.28 to 6.85% of total extractable protein. The majority of genotypes had KTI concentrations of around 4.5% of total extractable proteins. Significantly higher KTI concentrations were observed in ZPS-015, Sg1-1 and Krajina. The extent of variation in BBI concentrations was considerably higher than that of KTI, especially for polymeric forms of BBI. Furthermore, the results indicate that the BBI molecules mainly exist, under the applied experimental conditions, in polymeric forms. This is might be expectable because the self-association of BBI was observed even in the presence of SDS, mercaptoethanol and urea [11, 26].
The concentration of total BBI varied from 0.6 to 6.32 % of total extractable proteins. The highest level of BBI was found in Krajina, the genotype with highest level of KTI, whereas the lowest was found in Vojvodjanka, the genotype with one of the lower levels of KTI. The ratio of KTI to total BBI also varied to a wide extent, from 1.71 to 18.21. These wide-ranging levels of trypsin inhibitors and the variations of their proportions were also observed by other authors [13, 17]. The wide range of lunasin, the major component of BBI, was also reported recently [27]. The results obtained in this work suggest that genotypes with high percentages of trypsin inhibitors, especially BBI, could have a significant role from the nutritional and nutraceutical point of view. These cultivars could have possible use for production of BBI concentrates, which might be used in cancer prevention and therapy.

3.2 Correlation analysis

To investigate the relationship between Kunitz and Bowman-Birk types of trypsin inhibitors, regression analyses were carried out. Lana, a cultivar lacking the Kunitz type of trypsin inhibitor was not included in statistical analysis. The results are shown in Table 2.
A very strong positive correlation was found between the concentrations of KTI and total BBI (r = 0.94, P < 0.05). The concentration of KTI also showed a very strong positive correlation with the polymeric forms of BBI and a moderate positive correlation with the monomeric forms of BBI. These results strongly suggest that levels of these two types of trypsin inhibitors are related. To our knowledge, this is the first piece of evidence suggesting the existence of a relationship between the levels of the two classes of trypsin inhibitors present in soybean seeds. It has been reported that the lipoxygenases affect protease inhibitor levels in soybean seeds [14]. Information of this type might help growers to develop more efficient feeds and healthful foods.

3.3 Trypsin inhibitor activity

The trypsin inhibitor activity varies among genotypes from 60.36 to 100.95 TUI/mg. (Table 1). As expected, the lowest TIA was detected in Lana, a KTI-lacking cultivar with the lowest concentration of TI. The highest TIA was detected in Krajina, a genotype with the highest level of trypsin inhibitors. However, this value was not statistically different from the TIA found in Proteinka, Novosadjanka and Sg1-1 cultivars with considerably lower levels of TI than Krajina (P < 0.05). It was also found that no association was evident either for total TI concentration or for levels of KTI and BBI with TIA (Table 2). These results suggest that levels of trypsin inhibitors in defatted soybean meal could not be determined by the enzymatic method used in this study. A possible explanation of these results is that the investigated genotypes have various BBI isoinhibitor forms, which have been shown to differ in the extent of their interaction with trypsin [17]. Furthermore, some of the BBI and KTI are not fully active as trypsin inhibitors perhaps due to processing-induced changes in there structure or its interaction with other soybean constituents. Using two methods, the ELISAs and enzymatic assay, for measuring the level of BBI in defatted soybean meal, Friedman et al. [13] remarked that ELISA gave a higher estimate of BBI than the enzymatic assay. The higher value of BBI is result of detection the BBI that had formed a complex with and was inhibited by another component of the soybean meal. On the other hand, anionic polysaccharides are known to inactivate the activity of soy Kunitz trypsin inhibitor [28]. These results indicate that evaluation of TI levels and TIA are needed when the potential health impacts of soybean TI are investigated.

Acknowledgments

This investigation was supported by the Ministry of science and environmental protection of Serbia. The authors are indebted to M. Hrustic, Institute of Field and Vegetable Crops, Novi Sad, Serbia, and Lj. Prijic, Maize Research Institute, Zemun Polje, Serbia, for providing soybean genotypes.

References

  1. Wang, C.; Wikson, R. Phytochemicals in Soybeans-Their Potential Health Benefits. Inform 1999, 10, 315–320. [Google Scholar]
  2. Sessa, D.J.; Ghantous, P.E. Chemical Inactivation of Soybean Trypsin Inhibitors. J. Am. Oil Chem. Soc. 1987, 64, 1682–1687. [Google Scholar]
  3. DiPietro, C.M.; Liener, I.E. Heat inactivation of the Kunitz and Bowman-Birk soybean protease inhibitors. J. Agric. Food Chem. 1989, 37, 39–44. [Google Scholar]
  4. Stanojević, S.; Barać, M.; Vucelić -Radović, B.; Pešić, M. The effect of autoclaving on soluble protein composition and trypsin inhibitor activity of cracked soybeans. Acta Period. Technol (APTEFF) 2004, 35, 49–58. [Google Scholar]
  5. Huang, H.; Liang, H.; Kwok, K-C. Effects of Ultrasound Fields on the Activity and Secondary Structures of Soybean Trypsin Inhibitors. Abstracts of Papers, 226th ACS National Meeting, New York, NY, September 7-11; 2003. [Google Scholar]
  6. Van der Ven, C.; Matser, A.M.; van den Berg, C. Inactivation of Soybean Trypsin Inhibitors and Lipoxygenase by High-Pressure Processing. J. Agric. Food Chem. 2005, 53, 1087–1092. [Google Scholar]
  7. Barac, M.; Stanojevic, S. The Effect of Microwave Roasting on Soybean Protein Composition and Components with Trypsin Inhibitor Activity. Acta Aliment. 2005, 34, 23–31. [Google Scholar]
  8. Kennedy, A.R. Cancer Prevention by Protease Inhibitors. Prevent. Med. 1993, 22, 796–811. [Google Scholar]
  9. Kennedy, A.R.; Szuhaja, B.F. Method of Making Soybean Bowman-Birk Inhibitor Concentrate and Use of Same as a Human Cancer Preventative and Therapy. US Patent No. 5,217,717, 1993. [Google Scholar]
  10. Kennedy, A.R.; Szuhaja, B.F. Bowman-Birk Inhibitor Product for Use as an Anticancerogenesis Agent. US Patent No. 5,338,547, 1994. [Google Scholar]
  11. Sessa, D.J.; Wolf, W.J. Bowman-Birk inhibitors in soybean seed coats. Ind. Crop. Prod. 2001, 14, 73–83. [Google Scholar]
  12. Esposito, E.; Cortesi, R.; Bortolotti, F.; Menegatti, E.; Nastruzzi, C. Production and Characterization of Biodegradable Microparticles for the controlled delivery of Proteinase Inhibitors. Int. J. Pharmaceut. 1996, 129, 263–273. [Google Scholar]
  13. Friedman, M.; Brandon, D.L.; Bates, A.H.; Hymowitz, T. Comparison of a Commercial Soybean Cultivar and an Isoline Lacking the Kunitz Trypsin Inhibitors: Composition, Nutritional Value, and Effects of Heating. J. Agric. Food Chem. 1991, 39, 327–335. [Google Scholar]
  14. Carvalho, W.L.; Almeida Oliveira, M.G.; Barros, E.G.; Moreira, M.A. Lipoxygenases affect protease inhibitor levels in soybean seeds. Plant Phisiol. Biochem. 1999, 37, 497–501. [Google Scholar]
  15. Mejia, E.G.; Guzman-Maldonado, S.H.; Acosta-Gallegos, J.A.; Reynoso-Camacho, R.; Ramirez-Rodriguez, E.; Pons-Hernandez, J.L.; Gonzalez-Chavira, M.M.; Castellanos, J.Z.; Kelly, J.D. Effect of cultivar and Growing Location on the Trypsin Inhibitors, Tannins, and Lectins of Common Beans (Phaseolus vulgaris L.) Grown in the Semiarid Highlands of Mexico. J. Agric. Food Chem. 2003, 51, 5962–5966. [Google Scholar]
  16. Rackis, J.J.; Wolf, W.J.; Backer, E.C. Protease Inhibitors on Plant Foods: Content and Inactivation. Adv. Exp. Med. Biol. 1986, 199, 299–347. [Google Scholar]
  17. Tan-Wilson, A.L.; Wilson, K.A. Relevance of Multiple Soybean Trypsin Inhibitor Forms to Nutritional Quality. Adv. Exp. Med. Biol. 1986, 199, 391–411. [Google Scholar]
  18. Brandon, D.L.; Friedman, M. Immunoassays of Soy Proteins. J. Agric. Food Chem. 2002, 50, 6635–6642. [Google Scholar]
  19. Barac, M.B.; Jovanovic, S.T.; Stanojevic, S.P.; Pesic, M.B. Effect of Limited Hydrolysis on Traditional Soy Protein Concentrate. Sensors 2006, 6, 1087–1101. [Google Scholar]
  20. Pesic, M.B.; Vucelic-Radovic, B.V.; Barac, M.B.; Stanojevic, S.P. The Influence of Genotypic Variation in Protein Composition on Emulsifying Properties of Soy Proteins. J. Am. Oil Chem. Soc. 2005, 82, 667–672. [Google Scholar]
  21. Vollmann, J.; Grausgruber, H.; Wagentristl, H.; Wohleser, H.; Michele, P. Trypsin inhibitor activity of soybean as affected by genotype and fertilisation. J. Sci. Food Agric. 2003, 83, 1581–1586. [Google Scholar]
  22. Lowry, O.H.; Rosenbrough, N.J.; Farr, A.L.; Randall, R.J. Protein Measurement with the Folin Phenol Reagent. J. Biol. Chem. 1951, 193, 265–275. [Google Scholar]
  23. Davis, J. Disc Electrophoresis-II Method and Application to Human Serum Proteins. Ann. N. Y. Acad. Sci 1964, 121, 404–427. [Google Scholar]
  24. Liu, F.; Markakis, P. An Improved Colorimetric Method for Determining Antitryptic Activity in Soybean Products. Cereal Chem. 1989, 66, 415–422. [Google Scholar]
  25. Sessa, D.J.; Bietz, J.A. Toasted soybean flour components with trypsin inhibitor activity. J. Am. Oil Chem. Soc. 1986, 63, 784–788. [Google Scholar]
  26. Foard, D.E.; Gutay, P.A.; Ladin, B.; Beachy, R.N.; Larkins, B.A. In Vitro Synthesis of the Bowman-Birk and Related Soybean Protease Inhibitors. Plant. Mol. Biol. 1982, 1, 227–243. [Google Scholar]
  27. Mejia, E.G.; Vasconez, M.; Lumen, B.O.; Nelson, R. Lunasin Concentration in Different Genotypes, Commercial Soy Protein and Isoflavone Products. J. Agric. Food Chem. 2004, 52, 5882–5887. [Google Scholar]
  28. Tolstoguzov, V.B. Functional Properties of Food Proteins. Role of Interactions in Protein Systems. In Food Protein Structure and Functionality; Schwenke, K.D., Mothes, R., Eds.; VHC: Weinheim, 1993; pp. 203–209. [Google Scholar]
Figure 1. PAGE analysis of the protein extracts. Lanes 1-12 represent the electrophoretic patterns of the Proteinka, Balkan, Ravnica, Vojvodjanka, Krajina, SG1-1, L94-117, L91-31022, Nena, ZPS-015, Lana and Novosadjanaka genotypes, respectively.
Sensors 07 00067f1
Table 1. Trypsin Inhibitors Composition of the Investigated Soybean Genotypes1.
GenotypeKTI2BBI2TotalKTI/BB ITIA2
polymeric formsmonomeri c formsBBITI2
(%EP3)(TUI/mg)
Lana/2.02 a0.30 a2.32 a2.32 a060.36 a
ZPS-0155.63 a2.84 b0.46 b3.30 b8.93 b1.7173.65 b
Nena4.48 b.c0.89 c0.51 c,d0.60 c5.88 c7.4787.12 c,d,e,h
L91-310224.61d0.52 d0.08 e1.40 d5.21 d3.2989.38 c
L94-11714.28 e0.72 e0.19 f0.91 e5.19 d,e4.785.18 c,d,g
Sg1-16.03 f2.0 a,b0.47 b,c2.47 f8.50 f2.4498.99 f
Krajina6.85 g5.78 f0.54 d6.32 g13.17g1.08100.95 f
Vojvodjanka4.37 b,e0.23 g0.01 g0.24 h4.61 h18.2185.78 d,g
Novosadjank a4.62 c,d0.91 c0.06 h0.97 e,i5.59 i4.7695.53 e,f
Proteinka4.37 b,e0.95 c0.05 h1.00 i5.37 e,i4.3797.32 f
Balkan4.35 e0.47 d0.30 a0.77 j5.12 d5.6580.22 g,b,i
Ravnica4.80 h0.84 c0.31 a1.15 k5.95 c4.1779.55 h,i
1Means in the same column with different superscript roman letters are significantly different (P < 0.05).
2KTI, Kunitz trypsin inhibitor; BBI, Bowman-Birk trypsin inhibitor; TI, trypsin inhibitors; TIA, trypsin inhibitor activity
3EP, extractable protein
Table 2. Correlation Coefficients between Investigated Factors in Soybean Genotypes 1.
FactorsKTIBBITotal

polymeric formsmonomeric formsBBITI
KTI0.93 20.69 20.94 20.97 2
BBIp0.93 20.65 20.99 20.99 2
BBIm0.69 20.65 20.62 20.72 2
total BBI20.940.99 20.62 20.98 2
TIA0.370.35-0.050.330.34
1KTI, Kunitz trypsin inhibitor; BBI, Bowman-Birk trypsin inhibitor; BBIp, polymeric forms of BBI; BBIm, monomeric forms of BBI,; TI, trypsin inhibitors; TIA, trypsin inhibitor activity.
2These numbers correspond to correlations which are significant at P < 0.05.

