Quantitative Boundary Support Characterization for Cantilever MEMS


Abstract
:1. Introduction
2. Results and Discussion
3. Conclusions
4. Experimental Section
References and Notes
- Thundat, T.; Oden, P.I.; Warmack, R.J. Chemical, Physical, and Biological Detection using Microcantilevers. Proceedings of the Third International Symposium on Microstructures and Microfabricated Systems; 1997; pp. 179–187. [Google Scholar]
- Raiteri, R.; Grattarola, M.; Butt, H.J.; Skladal, P. Micromechanical Cantilever-Based Biosensors. Sensors and Actuators B 2001, 79, 115–126. [Google Scholar]
- Brown, K.B.; Allegretto, W.; Vermeulen, F.E.; Robinson, A.M. Simple Resonating Microstructures for Gas Pressure Measurement. Journal of Micromechanics and Microengineering 2002, 12, 204–210. [Google Scholar]
- Su, M.; Li, S.; Dravid, V.P. Microcantilever Resonance-Based DNA Detection with Nanoparticle Probes. Biochemical and Biophysical Research Communications 2003, 304, 98–100. [Google Scholar]
- Fadel, L.; Dufour, I.; Lochon, F.; Français, O. Signal-to-Noise Ratio of Resonant Microcantilever Type Chemical Sensors as a Function of Resonant Frequency and Quality Factor. Sensors and Actuators 2004, 102, 73–77. [Google Scholar]
- McFarland, A.W.; Colton, J.S. Chemical Sensing with Micromolded Plastic Microcantilevers. Journal of Microelectromechanical Systems 2005, 14, 1375–1385. [Google Scholar]
- Huang, R.S.; Abbaspour-Sani, E.; Kwok, C.Y. A Novel Accelerometer Using Silicon Micromachined Cantilever Supported Optical Grid and PIN Photodetector. Proceedings of the 8th International Conference on Solid-State Sensors and Actuators; 1995; pp. 663–666. [Google Scholar]
- Burchman, K.E.; Boyd, J.T. Freestanding, Micromachined, Multimode Silicon Optical Waveguides at λ = 1.3 μm for Microelectromechanical Systems Technology. Applied Optic. 1998, 37, 8397–8399. [Google Scholar]
- Wang, W.-C.; Fauver, M.; Nhut Ho, J.; Seibel, E.J.; Reinhall, P.G. Development of an Optical Waveguide Cantilever Scanner. Proceedings of SPIE, Opto-Ireland: Optics and Photonics Technologies and Applications; 2002; pp. 72–83. [Google Scholar]
- Dragoman, D.; Dragoman, M. Biased Micromechanical Cantilever Arrays as Optical Image Memory. Applied Optics 2003, 8, 1515–1519. [Google Scholar]
- Manalis, S.R.; Minne, S.C.; Atalar, A.; Quate, C.F. Interdigital Cantilevers for Atomic Force Microscopy. Applied Physics Letters 1996, 69, 3944–3946. [Google Scholar]
- Pedersen, N.L. Design of Cantilever Probes for Atomic Force Microscopy (AFM). Engineering Optimization 2000, 32, 373–392. [Google Scholar]
- Kawakatsu, H.; Saya, D.; Kato, A.; Fukushima, K.; Toshiyoshi, H.; Fujita, H. Millions of Cantilevers for Atomic Force Microscopy. Review of Scientific Instruments 2002, 73, 1188–1192. [Google Scholar]
- Brook, A.J.; Bending, S.J.; Pinto, J.; Oral, A.; Ritchie, D.; Beere, H.; Springthorpe, A.; Henini, M. Micromachined III-V Cantilevers for AFM Tracking Scanning Hall Microscopy. Journal of Micromechanics and Microengineering 2003, 13, 124–128. [Google Scholar]
- Lee, D.-W.; Wetzel, A.; Bennewitz, R.; Meyer, E.; Despont, M.; Vettiger, P.; Gerber, C. Switchable Cantilever for a Time-of-Flight Scanning Force Microscope. Applied Physics Letters 2004, 84, 1558–1560. [Google Scholar]
- Mullen, R.; Mehregany, M.; Omar, M.; Ko, W. Theoretical Modeling of Boundary Conditions in Microfabricated Beams. Proceedings of IEEE Micro Electro Mechanical Systems, Conference on Micro Structures, Sensors, Actuators, Machines and Robots; 1991; pp. 154–159. [Google Scholar]
- Rinaldi, G.; Packirisamy, M.; Stiharu, I. An Improved Method for Predicting Microfabrication Influence in Atomic Force Microscopy Performances. International Journal of Nanotechnology 2004, 1, 292–306. [Google Scholar]
- Packirisamy, M.; Stiharu, I.; Bhat, R.B. Influence of Micromachining on Dynamic Behavior of MEMS Structures. Canadian Journal of Electrical and Computer Engineering 2005, 30, 157–162. [Google Scholar]
- Rinaldi, G.; Packirisamy, M.; Stiharu, I. Multiparameter Synthesis of Microsystems. Proceedings of SPIE, International Conference on Photonic Devices; 2005; 5970, pp. 333–344. [Google Scholar]
- Howe, R. Surface Micromachining for Microsensors and Microactuators. Journal of Vacuum Science and Technology 1988, 6, 1809–1813. [Google Scholar]
- Delapierre, G. Micromachining: A Survey of the Most Commonly used Processes. Sensors and Actuators B 1989, 17, 123–138. [Google Scholar]
- Benitez, M.A.; Plaza, J.A.; Sheng, S.Q.; Esteve, J. A New Process for Releasing Micromechanical Structures in Surface Micromachining. Journal of Micromechanics and Microengineering 1996, 6, 36–39. [Google Scholar]
- Madou, M. Fundamentals of Microfabrication.; CRC Press LLC: Boca Raton, 1997; p. 56. [Google Scholar]
- Kovacs, G.T.A.; Maluf, N.I.; Petersen, K.E. Bulk Micromachining of Silicon. Proceedings of the IEEE 1998, 86, 1536–1551. [Google Scholar]
- Judy, J.W. MicroElectroMechanical Systems (MEMS): Fabrication, Design and Applications. Smart Materials and Structures 2001, 10, 1115–1134. [Google Scholar]
- Packirisamy, M.; Stiharu, I.; Bhat, R.B. Application of Boundary Conditioning to the Synthesis of Microsystems. Proceedings of the Micro Electro Mechanical Systems Conference; 2001; pp. 83–86. [Google Scholar]
- Packirisamy, M.; Bhat, R.B.; Stiharu, I. Boundary Conditioning Technique for Structural Tuning. Journal of Sound and Vibration 1999, 220, 847–859. [Google Scholar]
- Rinaldi, G.; Packirisamy, M.; Stiharu, I. Experimental Investigation on the Dynamics of MEMS Structures. Proceedings of SPIE, International Conference on MEMS, MOEMS and Micromachining; 2004; 5455, pp. 66–73. [Google Scholar]
- Rinaldi, G.; Packirisamy, M.; Stiharu, I. Boundary Characterization of Microstructures through Thermo-Mechanical Testing. Journal of Micromechanics and Microengineering 2006, 16, 549–556. [Google Scholar]
- Ollier, E. Optical MEMS Devices based on Moving Waveguides. IEEE Journal on Selected Topics in Quantum Electronics 2002, 8, 155–162. [Google Scholar]
- MikroMasch Technical Data Sheet. 2002. CSC38/AlBS/15. www.spmtips.com.
- Bhat, R.B. Natural Frequencies of Rectangular Plates using Characteristic Orthogonal Polynomials in Rayleigh-Ritz Method. Journal of Sound and Vibration 1985, 102, 493–499. [Google Scholar]
- Rinaldi, G.; Packirisamy, M.; Stiharu, I. Electrostatic Boundary Conditioning of MEMS Devices. Proceedings of the 8th International Cairo University MDP, Conference on Current Advances in Mechanical Design and Production VIII 2004, 269–276. [Google Scholar]
- Roberts, R.B. Thermal Expansion Reference Data: Silicon 300-850 K. Journal of Physics D: Applied Physics 1981, 14, 163–166. [Google Scholar]
- Okaji, M.; Imai, H. A Practical Measurement System for the Accurate Determination of Linear Thermal Expansion Coefficients. Journal of Physics E: Scientific Instrument 1984, 17, 669–673. [Google Scholar]
- Ono, N.; Kitamura, K.; Nakajima, K.; Shimanuki, Y. Measurement of Young's Modulus of Silicon Single Crystal at High Temperature and Its Dependency on Boron Concentration Using the Flexural Vibration Method. Japanese Journal of Applied Physics 2000, 39, 368–371. [Google Scholar]
- Glazov, V.M.; Pashinkin, A.S. The Thermal Properties (Heat Capacity and Thermal Expansion) of Single-Crystal Silicon. High Temperature 2001, 39, 413–419. [Google Scholar]
- Han, J.; Zhu, C.; Liu, J.; He, Y. Dependence of the Resonance Frequency of Thermally Excited Microcantilever Resonators on Temperature. Sensors and Actuators 2002, 101, 37–41. [Google Scholar]
- Watanabe, H.; Yamada, N.; Okaji, M. Linear Thermal Expansion Coefficient of Silicon from 293 to 1000 K. International Journal of Thermophysics 2004, 25, 221–236. [Google Scholar]
- Rinaldi, G.; Packirisamy, M.; Stiharu, I. Dynamic Testing of Micromechanical Structures under Thermo-Electro-Mechanical Influences. Measurement 2006. Accepted Manuscript. [Google Scholar]
- Rinaldi, G.; Packirisamy, M.; Stiharu, I. Optical MEMS Based Bimorph for Thermal Sensing. Proceedings of SPIE, Symposium on Canadian and International Business and Technology Innovations in Optics and Photonics; 2004; 5577, pp. 628–635. [Google Scholar]
- Bulletin: TS-103(A); July 2004; MINCO Products Inc.: Minneapolis, MN, USA.
- Bhat, R.B. Nature of Stationarity of the Natural Frequencies at the Natural Modes in the Rayleigh-Ritz Method. Journal of Sound and Vibration 1997, 203, 251–263. [Google Scholar]


| G | 1 | 2 | 3 | 4 | 5 | 6 | 7 | 8 | 9 | 10 | 11 | 12 |
|---|---|---|---|---|---|---|---|---|---|---|---|---|
| L | 351 | 299 | 254 | 251 | 251 | 300 | 302 | 353 | 250 | 302 | 304 | 355 |
| w | 35 | 35 | 36 | 35 | 35 | 36 | 35 | 36 | 36 | 35 | 36 | 36 |
| h | 0.95 | 0.96 | 0.93 | 0.92 | 1.00 | 1.05 | 1.10 | 0.94 | 0.90 | 0.94 | 1.93 | 1.89 |
| T (°C) | NCB (Hz) 0V | Exp (Hz) 0V | NCB (Hz) 25V | Exp (Hz) 25V | NCB (Hz) 175V | Exp (Hz) 175V | NCB (Hz) 213.5V | Exp (Hz) 213.5V |
|---|---|---|---|---|---|---|---|---|
| 21 | 10440 | 10440 | 10413 | 10424 | 8598 | 8608 | 5583 | 5615 |
| 30 | 10437 | 10434 | 10409 | 10420 | 8592 | 8601 | 5565 | 5605 |
| 40 | 10432 | 10430 | 10404 | 10415 | 8584 | 8593 | 5545 | 5581 |
| 50 | 10427 | 10424 | 10399 | 10410 | 8577 | 8585 | 5524 | 5558 |
| 60 | 10422 | 10421 | 10394 | 10406 | 8570 | 8577 | 5504 | 5534 |
| 70 | 10418 | 10418 | 10390 | 10400 | 8562 | 8569 | 5483 | 5511 |
| 80 | 10413 | 10414 | 10385 | 10396 | 8555 | 8561 | 5463 | 5487 |
| 87.5 | 10409 | 10410 | 10381 | 10393 | 8550 | 8555 | 5447 | 5469 |
| 105 | 10401 | 10401 | 10373 | 10384 | 8537 | 8541 | 5410 | 5426 |
| 150 | 10380 | 10382 | 10351 | 10363 | 8504 | 8504 | 5313 | 5313 |
| 170 | 10370 | 10373 | 10342 | 10354 | 8489 | 8488 | 5269 | 5262 |
| 175 | 10368 | 10370 | 10340 | 10351 | 8485 | 8484 | 5257 | 5249 |
| G | 1 | 2 | 3 | 4 | 5 | 6 | 7 | 8 | 9 | 10 | 11 | 12 |
|---|---|---|---|---|---|---|---|---|---|---|---|---|
| Exp | 10.4 | 14.5 | 19.4 | 19.6 | 21.2 | 15.6 | 16.0 | 10.2 | 19.4 | 13.9 | 24.5 | 18.1 |
| KR* | 108 | 90 | 83 | 84 | 65.5 | 68 | 60 | 109 | 87 | 96 | 10.85 | 13.5 |
| AFM Probe | KR* | KRE (N·m 10-9) |
|---|---|---|
| 1 | 108 | 130.42 |
| 2 | 90 | 131.66 |
| 3# | 83 | 133.65 |
| 4# | 84 | 128.83 |
| 5# | 65.5 | 129.01 |
| 6# | 68 | 133.43 |
| 7# | 60 | 130.73 |
| 8# | 109 | 130.41 |
| 9# | 87 | 129.00 |
| 10# | 96 | 130.93 |
| 11# | 10.85 | 130.47 |
| 12# | 13.5 | 130.55 |
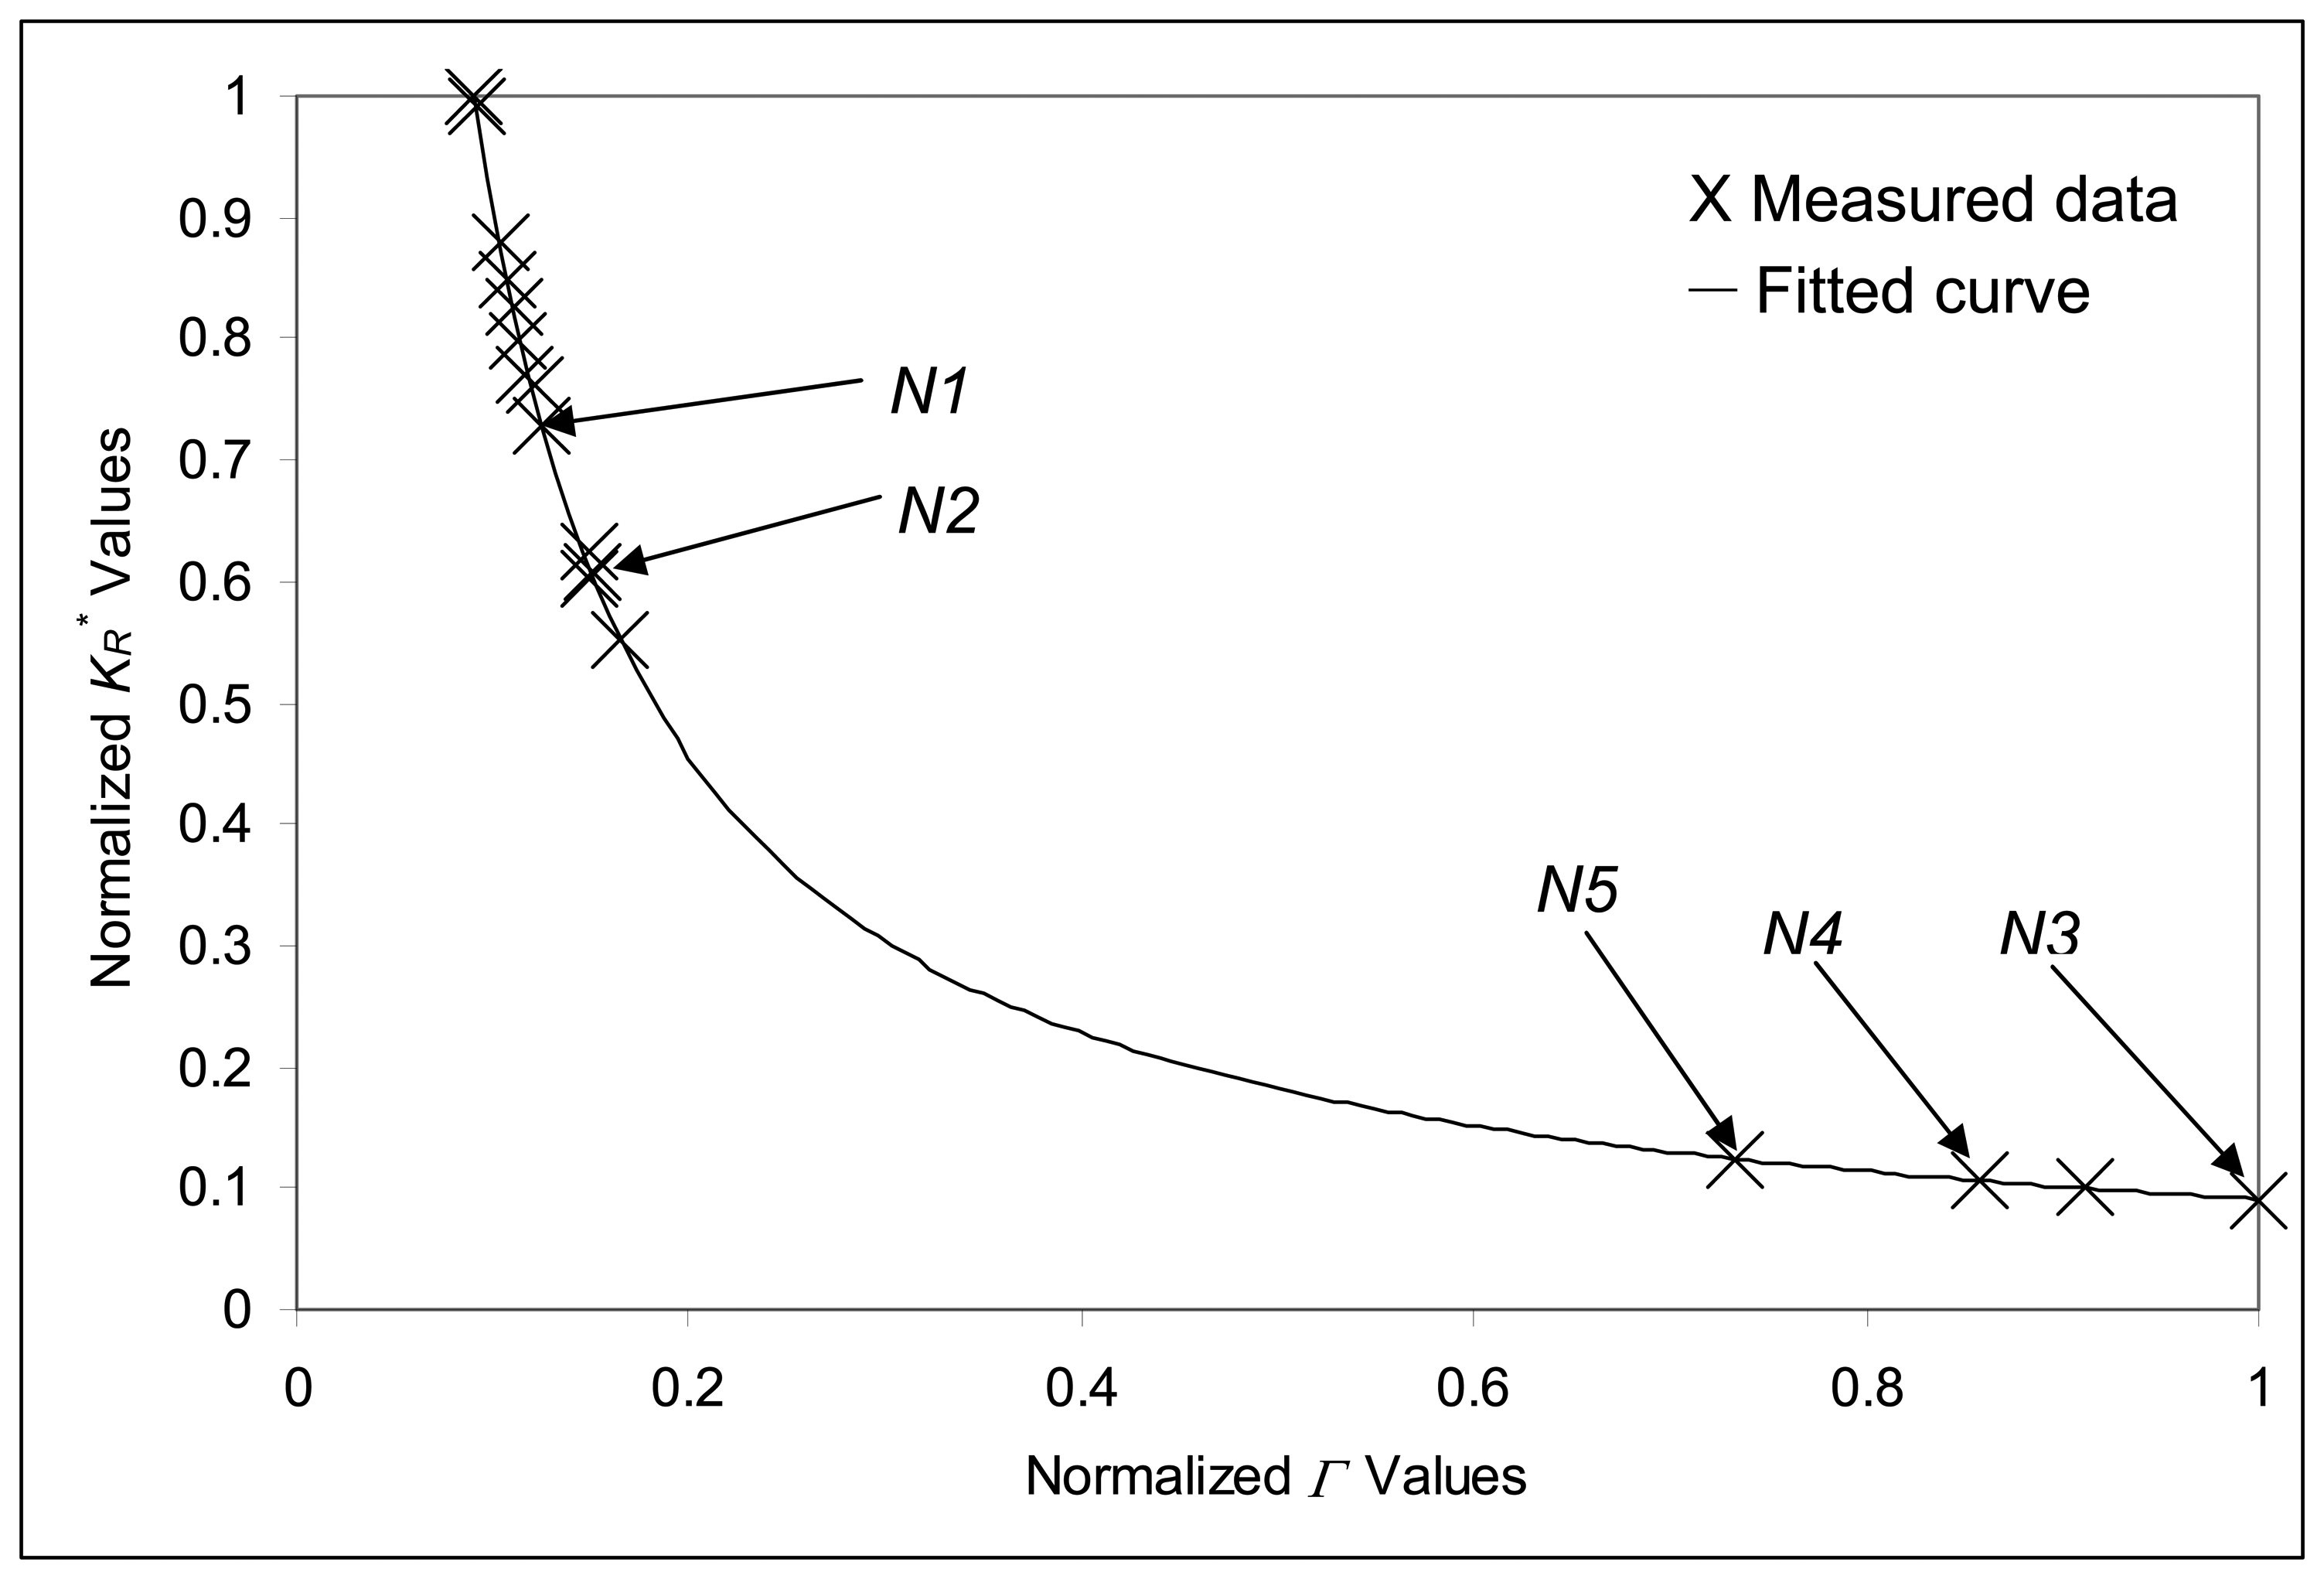
| Nominal Cantilever | L(μm) | w (μm) | h (μm) | KR* | KRE (N·m 10-9) | Frequency (Hz) |
|---|---|---|---|---|---|---|
| N1(G2, G6, G7, G10) | 300 | 35 | 1 | 79.35 | 130.76 | 14940 |
| N2(G3,G4,G5,G9) | 250 | 35 | 1 | 66.13 | 130.76 | 21410 |
| N3(G11) | 300 | 35 | 2 | 9.92 | 130.76 | 25820 |
| N4 (G12) | 350 | 35 | 2 | 11.57 | 130.76 | 19375 |
| N5 (G1, G8) | 350 | 35 | 1 | 92.58 | 130.76 | 11014 |
© 2007 by MDPI ( http://www.mdpi.org). Reproduction is permitted for noncommercial purposes.
Share and Cite
Rinaldi, G.; Packirisamy, M.; Stiharu, I. Quantitative Boundary Support Characterization for Cantilever MEMS. Sensors 2007, 7, 2062-2079. https://doi.org/10.3390/s7102062
Rinaldi G, Packirisamy M, Stiharu I. Quantitative Boundary Support Characterization for Cantilever MEMS. Sensors. 2007; 7(10):2062-2079. https://doi.org/10.3390/s7102062
Chicago/Turabian StyleRinaldi, Gino, Muthukumaran Packirisamy, and Ion Stiharu. 2007. "Quantitative Boundary Support Characterization for Cantilever MEMS" Sensors 7, no. 10: 2062-2079. https://doi.org/10.3390/s7102062