Article

A Fluorimetric Sensor for Detection of One Living Cell

1
Department of Plant Biology, Faculty of Agronomy, Mendel University of Agriculture and Forestry in Brno, Zemedelska 1, CZ-613 00 Brno, Czech Republic
2
Department of Chemistry and Biochemistry, Faculty of Agronomy, Mendel University of Agriculture and Forestry in Brno, Zemedelska 1, CZ-613 00 Brno, Czech Republic
3
Grain Marketing and Production Research Center, Agricultural Research Service, US Department of Agriculture, Manhattan, KS 66502, USA
4
Department of Natural Drugs, University of Veterinary and Pharmaceutical Sciences, Palackeho 1-3, CZ-612 42 Brno, Czech Republic
*
Author to whom correspondence should be addressed.
Sensors 2007, 7(3), 222-238; https://doi.org/10.3390/s7030222
Submission received: 13 December 2006 / Accepted: 27 February 2007 / Published: 5 March 2007

Abstract

:
Nowadays, studies of metabolic pathways and processes in living organisms cannot be easily done at the cellular level. That is why the development of a new analytical methods and approaches is needed, to allow detection of different biologically important species at very low concentrations levels and sample volumes, especially in individual cells. In the present work, we suggested a sensor to detect units of living cells by means determination of plant esterases (PE) based on fluorimetric detection of the products of the enzymatic hydrolysis of fluorescein diacetate in plant cell cultures (BY-2 tobacco cells and early somatic embryos of Norway spruce, clone 2/32). We standardized the sensor using a readily available esterase from pig liver. The detection limits were approximately 17 to 50 amol in 2 ml (8.5 to 25 femtomolar concentrations of esterases) of the enzyme contained in BY-2 tobacco cells and spruce early somatic embryos, respectively, after re-computation on the amounts of pig liver esterases. We assumed that the optimised sensor for the determination of PE in cell extracts accomplishes all requirements for a sensitive analysis which could be usable for single cell analysis. The detection limit was 1.5 in case of analysing BY-2 tobacco cells and 0.5 in early somatic embryos. Moreover, we were able to detect single protoplasts.

1. Introduction

Biotechnologies involving bioengineering, development of biosensors, genetic manipulation, single cell analysis and others has already become the pioneering focus in many scientific fields such as chemistry and molecular biology due to its potential for understanding the most important biochemical pathways and cycles occurring in living cells [1]. Single-cell analysis gives also great assistance to diagnosis and therapy of diseases. The state of diseases and the effects of treatments can be ascertained through analysing the change of components and contents, even DNA fragments in single-cells [2-7]. In recent years, single-cell analysis has been developed from analysis of cell contents to membrane analysis, individual vesicles in cells, and even single molecule analysis in single-cells, and its application is also continuously increasing [8-10]. The amounts of components of the living cells such as peptides, proteins, enzymes, nucleic acids and others can be measured in a single living cell [11-15].
In recent years, the use of sensitive and effective luminescent techniques in single cell analysis has increased [8,11,16-19]. Fluorimetry is one of the most commonly used luminescent techniques because the other methods utilized a more rare kind of radiationless transition [20]. A detection of fluorescence is possible to use for i) a direct determination of labelled compounds (labelled peptides, proteins etc.) [21-24] and/or ii) an indirect determination of compounds which is based on detection of the fluorescent product of the specific reaction proceeding between an analyte and a substrate [14,15,21,25].
Recently, it has been published that abundant proteins in plant cells, esterases, could be utilized as a marker of growth and viability [26-29]. When a cell were dying or has been damaging, the activity of these enzymes were decreasing. Based on this phenomenon, we concluded that a suggesting of a sensor to determine plant esterases could be used to detect living cells. Thus we focused on the development of an effective and sensitive analytical sensor to determine one living plant cell. Based on our previously published papers, fluoresceine diacetate (FDA) has been selected as a suitable substrate to determine plant esterases. The basic scheme of FDA hydrolysis catalysed by plant esterases is shown in Fig. 1.

2. Materials and methods

2.1 Chemicals

Fluorescein diacetate (FDA), propidium iodide (PI), pig liver esterase (suspension in 3.2M ammonium sulphate) and all other used reagents of ACS purity were purchased from Sigma Aldrich Chemical Corp. (USA) unless noted otherwise. Celulysin was purchased from Calbiochem (USA). All solutions were prepared using deionized water (18.2 MΩ, Iwa 20, Watek, Czech Republic). If not otherwise indicated, culture media were prepared using plant cell culture tested chemicals purchased from Duchefa Biochemie BV (Haarlem, The Netherlands).

2.2 Plant cultures

Tobacco suspension

The suspension culture of Nicotiana tabacum BY-2 line [30] was grown in liquid Murashige and Skoog medium [31] supplemented with sucrose (30 g.l-1), KH2PO4 (0.2 g.l-1), thiamine (1 mg. l-1) and 2,4-dichlorophenoxyaetic acid (0.2 mg.l-1) according to Nagata [30]. The suspension cultures (20 ml) were grown in 50 ml Erlenmeyer flasks at 27°C with shaking at 135 rpm (Kuhner Shaker, type: LT-W, Adolf Kuhner AG, Switzerland). Subcultivation was performed after 3 or 4 days by transferring 2 or 1 ml, respectively, of suspension culture into a fresh medium (total volume 20 ml).

Spruce embryos

The culture of early somatic embryos (ESEs) of Norway spruce (Picea abies /L./ Karst.) clone 2/32 was used in our experiments. The clone was originally established at the Department of Plant Biology of Mendel University of Agriculture and Forestry in Brno, Czech Republic, according to a procedure described by Jokinen and Durzan [32,33]. The ESEs were maintained on a semisolid (Gelrite Gellan Gum, Merck, Germany) half-strength LP medium [34] modified by Havel [35,36]. The concentration of 2,4-dichlorofenoxyacetic acid and N6-benzyladenine was 4.4 and 9 μM, respectively. The pH was adjusted to 5.7-5.8 before autoclaving (121°C, 100 kPa, 20 min). The organic part of the medium, except saccharose, was sterilized by filtration through a 0.2 μm polyethylensulfone membrane (Whatman, Puradisc 25 AS). Ten ESEs clusters were cultivated in one plastic Petri dish (100 mm in diameter) containing 30 ml of the medium. Sub-cultivation of stock cultures was carried out at 2-week intervals. The stock and experimental cultures were maintained in a cultivation box in the dark at a temperature of 23±2°C.

2.3 Cell counting

Counting of BY-2 suspension cells was carried out using a Fuchs-Rosenthal haemocytometer (Germany). Aliquots of suspension were diluted with distilled water and loaded into the heamocytometer according to the instructions of the manufacturer. The counting of cells was performed manually using a microscope (Olympus, Japan).

2.4 Cell viability microscope assay

A modified double staining method with fluorescein diacetate (FDA) and propidium iodide (PI) was used for the determination of the viability of ESEs [37,38]. The FDA causes green fluorescence in viable cells because the non-fluorescent FDA easily penetrates into viable cells where it is hydrolysed to a brightly fluorescent fluorescein (λexcitation 490 nm and λemission 514 nm) that does not diffuse readily through the cytoplasmatic membrane. The red fluorescence of PI (λexcitation 536 nm and λemission 620 nm) in cells shows that these cells are dead because this compound cannot pass through the functional cytoplasmatic membrane. In our experiments ESEs and/or BY-2 cells (∼1 mg) were harvested and diluted with water to a final volume of 50 μl. The stock solutions of PI and FDA were added to a final concentration of 20 μg.ml-1 and 1 μg.ml-1 respectively [39]. After 5 min of incubation at room temperature, the percentage of dead (red-stained cells) and viable cells (green-stained cells) was evaluated using an Olympus AX 70 fluorescence microscope with an Olympus cube U-MWU in connection with the digital camera Olympus (4040 Zoom, Japan). In addition, areas of dead cells (red staining) and viable cells (green staining) were marked using the Image-Pro program and the size of the stained areas was determined. The percentage quantification of red (dead cells) and green areas (viable cells), respectively, in a digital image of ESEs was determined.

2.5 Localization of esterases in one cell

Localization of esterases in one tobacco BY-2 cell was performed by confocal microscope Olympus BX50 (Japan). Harvested cells were incubated in a 1 μg.ml-1 solution of FDA in fresh MS medium at room temperature for 5 minutes and placed onto a microscope slide. Images were taken by confocal laser scanning microscope model BX 50 (Olympus, Japan) which used an Ar-laser (488 nm). An emission image was scanned utilizing filter BA 510 IF.

2.6 Esterase assay

Cell extract

Cultivation medium of tobacco BY-2 cells was removed by centrifugation (360 g; 5 min; 20°C; centrifuge MR 22, Jouan, USA). The cells were washed twice in 50 mM potassium phosphate buffer (pH 8.7). The washed BY-2 cells and harvested ESEs (100 – 200 mg, respectively) were mixed with extraction buffer (250 mM potassium phosphate, pH 8.7) to a final volume of 1 ml and homogenised using a Potter-Elvehjem homogenizator (Kavalier, Czech Republic) placed in an ice bath for 10 min. The redox state of the obtained solution was maintained by addition of dithiothreitol (DTT) at a concentration suitable for sensitive detection of esterases, for other details see the Results and Discussion section. The homogenised samples were sonicated for 1 min in an ice bath using a Transsonic T310 sonicator (Czech Republic). The homogenate was centrifuged at 10 000 g; 15 min; 4°C (centrifuge MR 22, Jouan, USA). An aliquot (5 – 20 μl) of the supernatant was mixed with potassium phosphate buffer. Molar concentrations and pH values of the used potassium phosphate buffer were tested. The reaction was started by the addition of FDA to final concentration of 5 μM. The final volume of the reaction mixture was 1 ml. As a blank sample an equal volume of extraction buffer was used. After incubation (15 min, temperature was tested, dry block, Major Science, Taiwan), an aliquot (5 – 20 μl) of the reaction mixture was added to 5 mM potassium phosphate buffer (pH 8.7, 1980 – 1995 μl). The fluorescence (λexcitation 490 nm and λemission 514 nm) was read immediately using a spectrofluorimetric detector RF-551 (Shimadzu, USA). A stock solution of FDA was prepared in acetone dried by anhydrous calcium chloride. The amount of acetone did not exceed 1% (v/v) in the reaction mixture. For other experimental conditions see the Results and Discussion section. Esterase activity in international units (IU, one unit liberates one μmol of fluorescein per minute under specified conditions) was recalculated to relative units (100 % represents the highest activity measured in an experiment).

BY-2 Protoplasts

Protoplasts were prepared according to Mlejnek [39]. BY-2 cells were washed in protoplast buffer (0.5 M manitol, 20 mM KCl, 3 mM KH2PO4, 5 mM CaCl2, 10 g/l sucrose, pH 5.2) and incubated in the protoplast buffer also containing 15 g/l celulysin and 0.2% (v/v) pectinase at 25°C for 3 hours. Protoplasts transferred into above-mentioned extraction potassium phosphate buffer were harvested by glass capillary (effective volume 280±40 nl). Homogenization was carried out by three freeze-thaw cycles. Thereafter, the samples were exposed to 1 min of sonication in an ice bath (Transsonic T310, Czech Republic). The homogenates were diluted to a final volume 20 μl using 1 M potassium phosphate buffer (pH 8.7). The mixture was maintained at 45°C. The reaction was started by addition of FDA to the final concentration of 5 μM. The rest of the procedure was the same as mentioned above.

2.7 Native PAGE

Samples (BY-2 tobacco cells) of defined fresh weight (500 – 1000 mg) were ground with liquid nitrogen in a mortar to fine powder. After melting, samples were ground for another two minutes with extraction buffer (250 mM potassium phosphate, 1 mM DTT, pH 8.7) on ice. The volume of extraction buffer in milliliters was equal to the fresh weight in grams. The homogenised sample was sonicated in an ice bath for 1 minute (Transsonic T310, Czech Republic) and centrifuged at 10 000 g, 15 min, 4°C centrifuge MR 22, Jouan (USA). The obtained extracts were mixed with loading buffer (50% (v/v) glycerine, 0.4 % (w/w) bromphenol blue) in the ratio 10:1, respectively. Native PAGE on discontinuous Tris-glycine gels (5% focusing gel pH 6.8, 10% separation gel pH 8.8, acrylamide:bisacrylamide 37.5:1) was carried out according to [40] using the aparature SV10-CDC (Sigma, USA).
A modified FDA staining method for esterase activity [41] was carried out. Gels were buffered in 0.1 M potassium phosphate buffer pH=7.4 for 30 minutes and then immersed into a solution of FDA (2 mg per 100 ml of the 0.1 M potassium phosphate buffer pH=7.4). After incubation at room temperature in the dark, the esterase activity was visualised in UV light. Subsequent naphtylacetate/fast blue staining was carried out according to [42]. Images were captured by UVP–GDS 8 000 (UVP, USA) and digitalised by program Grab–IT (version 2.04.7, UVP, USA). Images of gels were analysed by the GelWorks 1D Intermediate software (version 2.51, UVP, USA). Peaks were detected automatically.

2.8 Data analysis

The data acquired were processed in MS Excel and STATGRAPHICS (Statistical Graphics Corp, USA) was used for statistical analyses. Results are expressed as the mean values ± SE unless noted otherwise. A value of P < 0.05 was considered significant.

3. Results and discussion

3.1 Direct detection of fluorescein

The product of hydrolysis of FDA is fluorescein. Thus, we aimed primarily on optimizing of determination of this product. We assumed that it would be necessary to perform the analysis directly in a biological sample. That is why the detection of fluorescein was accomplished in the presence of phosphate buffer, which is commonly used for the mentioned purposes. It was found that higher pH values (more than 8) would ensure a complete dissociation of fluorescein (pKa ≈ 6.4). The dissociation is necessary for the analysis because only the dissociated fluorescein form is fluorescent [21]. Concentration changes of the phosphate buffer in the range of 5 – 1000 mM did not influence the detected fluorescence of fluorescein (R.S.D. ∼ 3 %, data not shown). That is why we performed our fluorescein measurements in the presence of 250 mM phosphate buffer at pH 8.75. The detection limit (3 S/N) of the fluorescein was approximately 300 pM. The published detection limits in case of laser induced fluorescence are about 700 pM – 1 nM of fluorescein [1,43]. When this optimizing step has been done, the determination of plant esterases in the biological test models i) the suspension cell culture of Nicotiana tabacum BY-2 line and ii) the culture of early somatic embryos (ESEs) of Norway spruce (Picea abies /L./ Karst.) clone 2/32 has followed.

3.2 Fluorimetric detection of plant esterase activity

Electrophoretical and/or spectrophotometrical techniques are the most commonly used methods for the determination of the esterase activity [41,44]. Those methods, however, are not suitable for the detection of very low concentrations of esterase in low sample volumes e.g. individual cells. Thus we suggested fluorimetric sensor based on the determination of fluorescein released from FDA catalyzing by plant esterases (PE) and optimised of this sensor to determine the plant esterase in the biological sample (suspension culture of Nicotiana tabacum BY-2 line cells) with respect to be able to detect a single living cells.

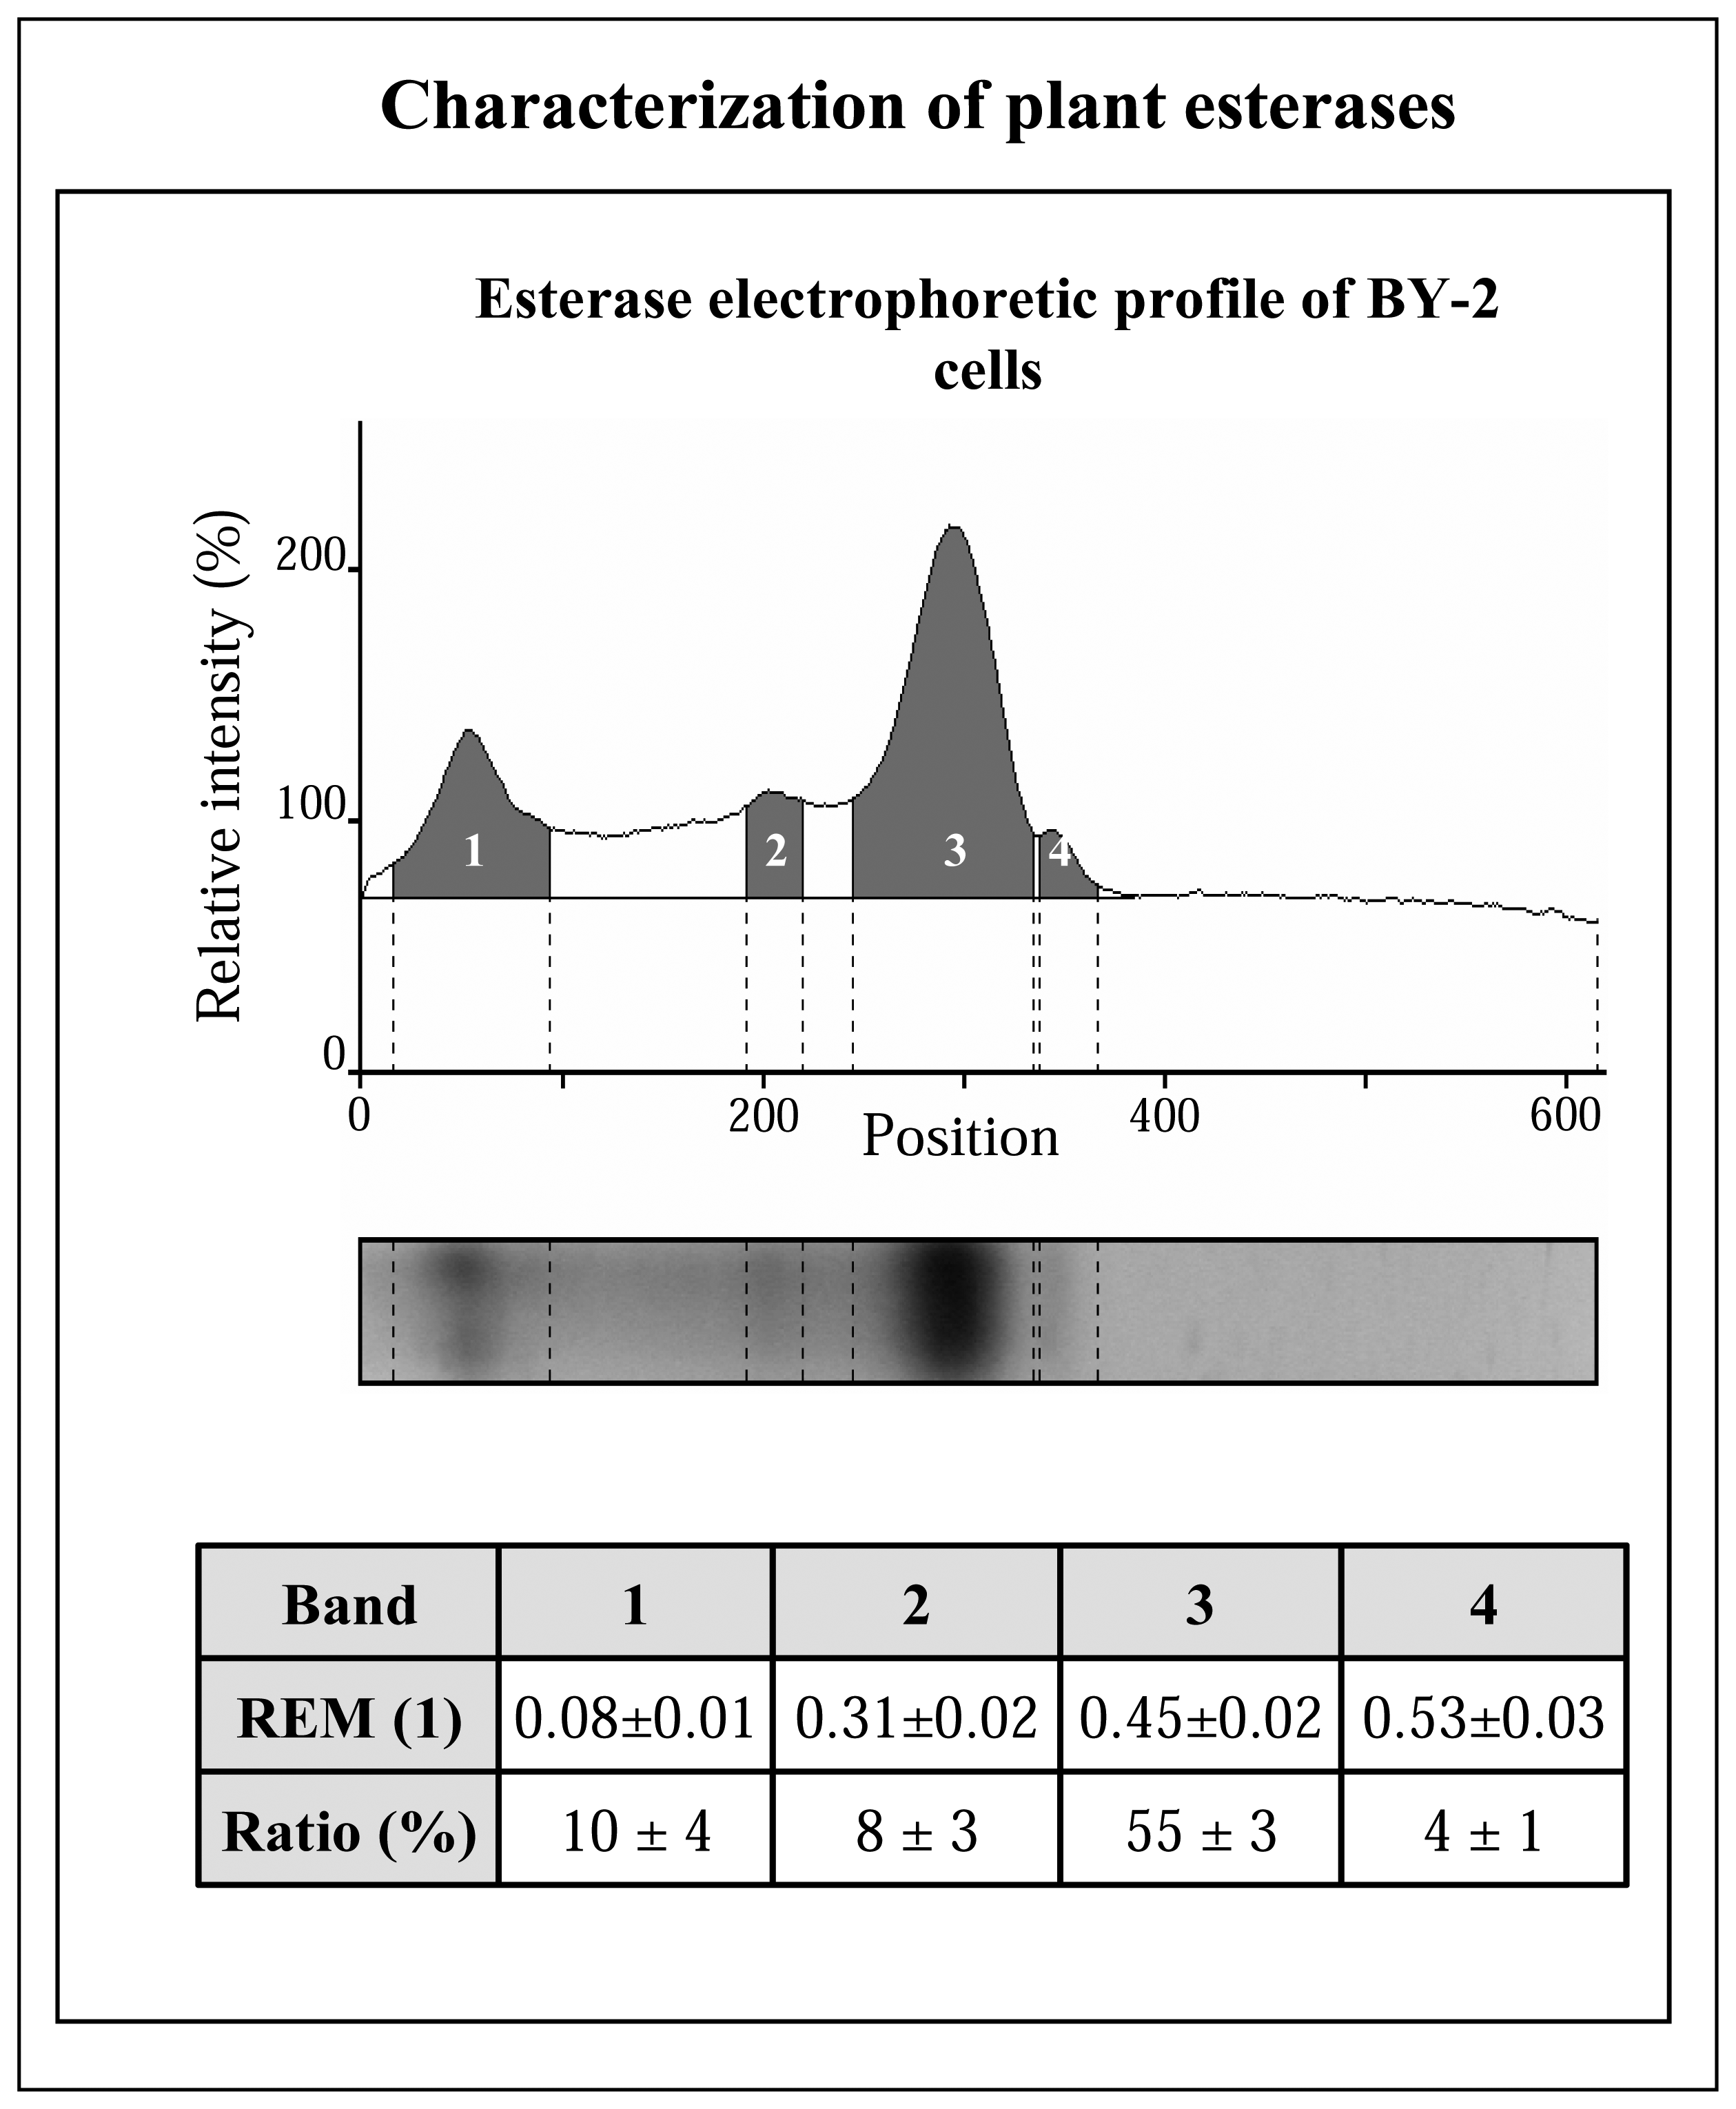
3.2.1 Native electrophoresis of esterases

We wanted to know the profile of enzymes contained in the plant cells of interest, which could hydrolyze the FDA. Thus, we tested the esterase activity of proteins separated by PolyAcrylamide Gel Electrophoresis (PAGE). The protein bands that were able to hydrolyse fluorescein diacetate to fluorescein were assumed to be esterases. The fluorescein was detected after a 30 min incubation using UV light (λ = 254 nm, for other details see Experimental section). Four groups of enzymes that hydrolysed FDA were identified in the BY-2 tobacco cells extracts (Fig. 2). The enzymes (E1-E4) exhibited the relative ratio of the whole esterase activity as follows: E1: 13 ± 6%, E2: 10 ± 4%, E3: 72 ± 4%, and E4: 6 ± 1%. The relative electrophoretic mobilities (REM) of the separated enzymes were E1: 0.08±0.01, E2: 0.31±0.02, E3: 0.45±0.02 and E4: 0.53±0.03. The most intense esterase band (E3 - REM 0.45±0.02) accounted for 72 ± 4 % from the whole esterase activity. It clearly follows from the results obtained that multiple esterases are present in plant cells and that the E3 group of enzymes exhibit the highest relative esterase activity (72%).

3.2.2 Optimisation of the plant esterase determination

After that we characterized the cells of interest with respect to ability to hydrolyze FDA, the optimization of the PE determination followed. As we mentioned above, the most suitable medium for the direct determination of the fluorescein was 250 mM phosphate buffer (pH 8.7). Unfortunately, the selected substrate fluorescein diacetate (FDA) spontaneously hydrolyses in a pH dependent manner. Deviations caused by spontaneous hydrolysis of FDA were eliminated at all fluorimetric measurements by substracting measurements taken on a blank sample prepared according to the suggested procedure but without addition of PE. For practical reasons, we divided the optimisation of the plant esterases determination in plant extract of BY-2 tobacco cells into three steps i) disintegration of cells, ii) hydrolysis of FDA by plant esterases, iii) measurement of the product of FDA hydrolysis – fluorescein.

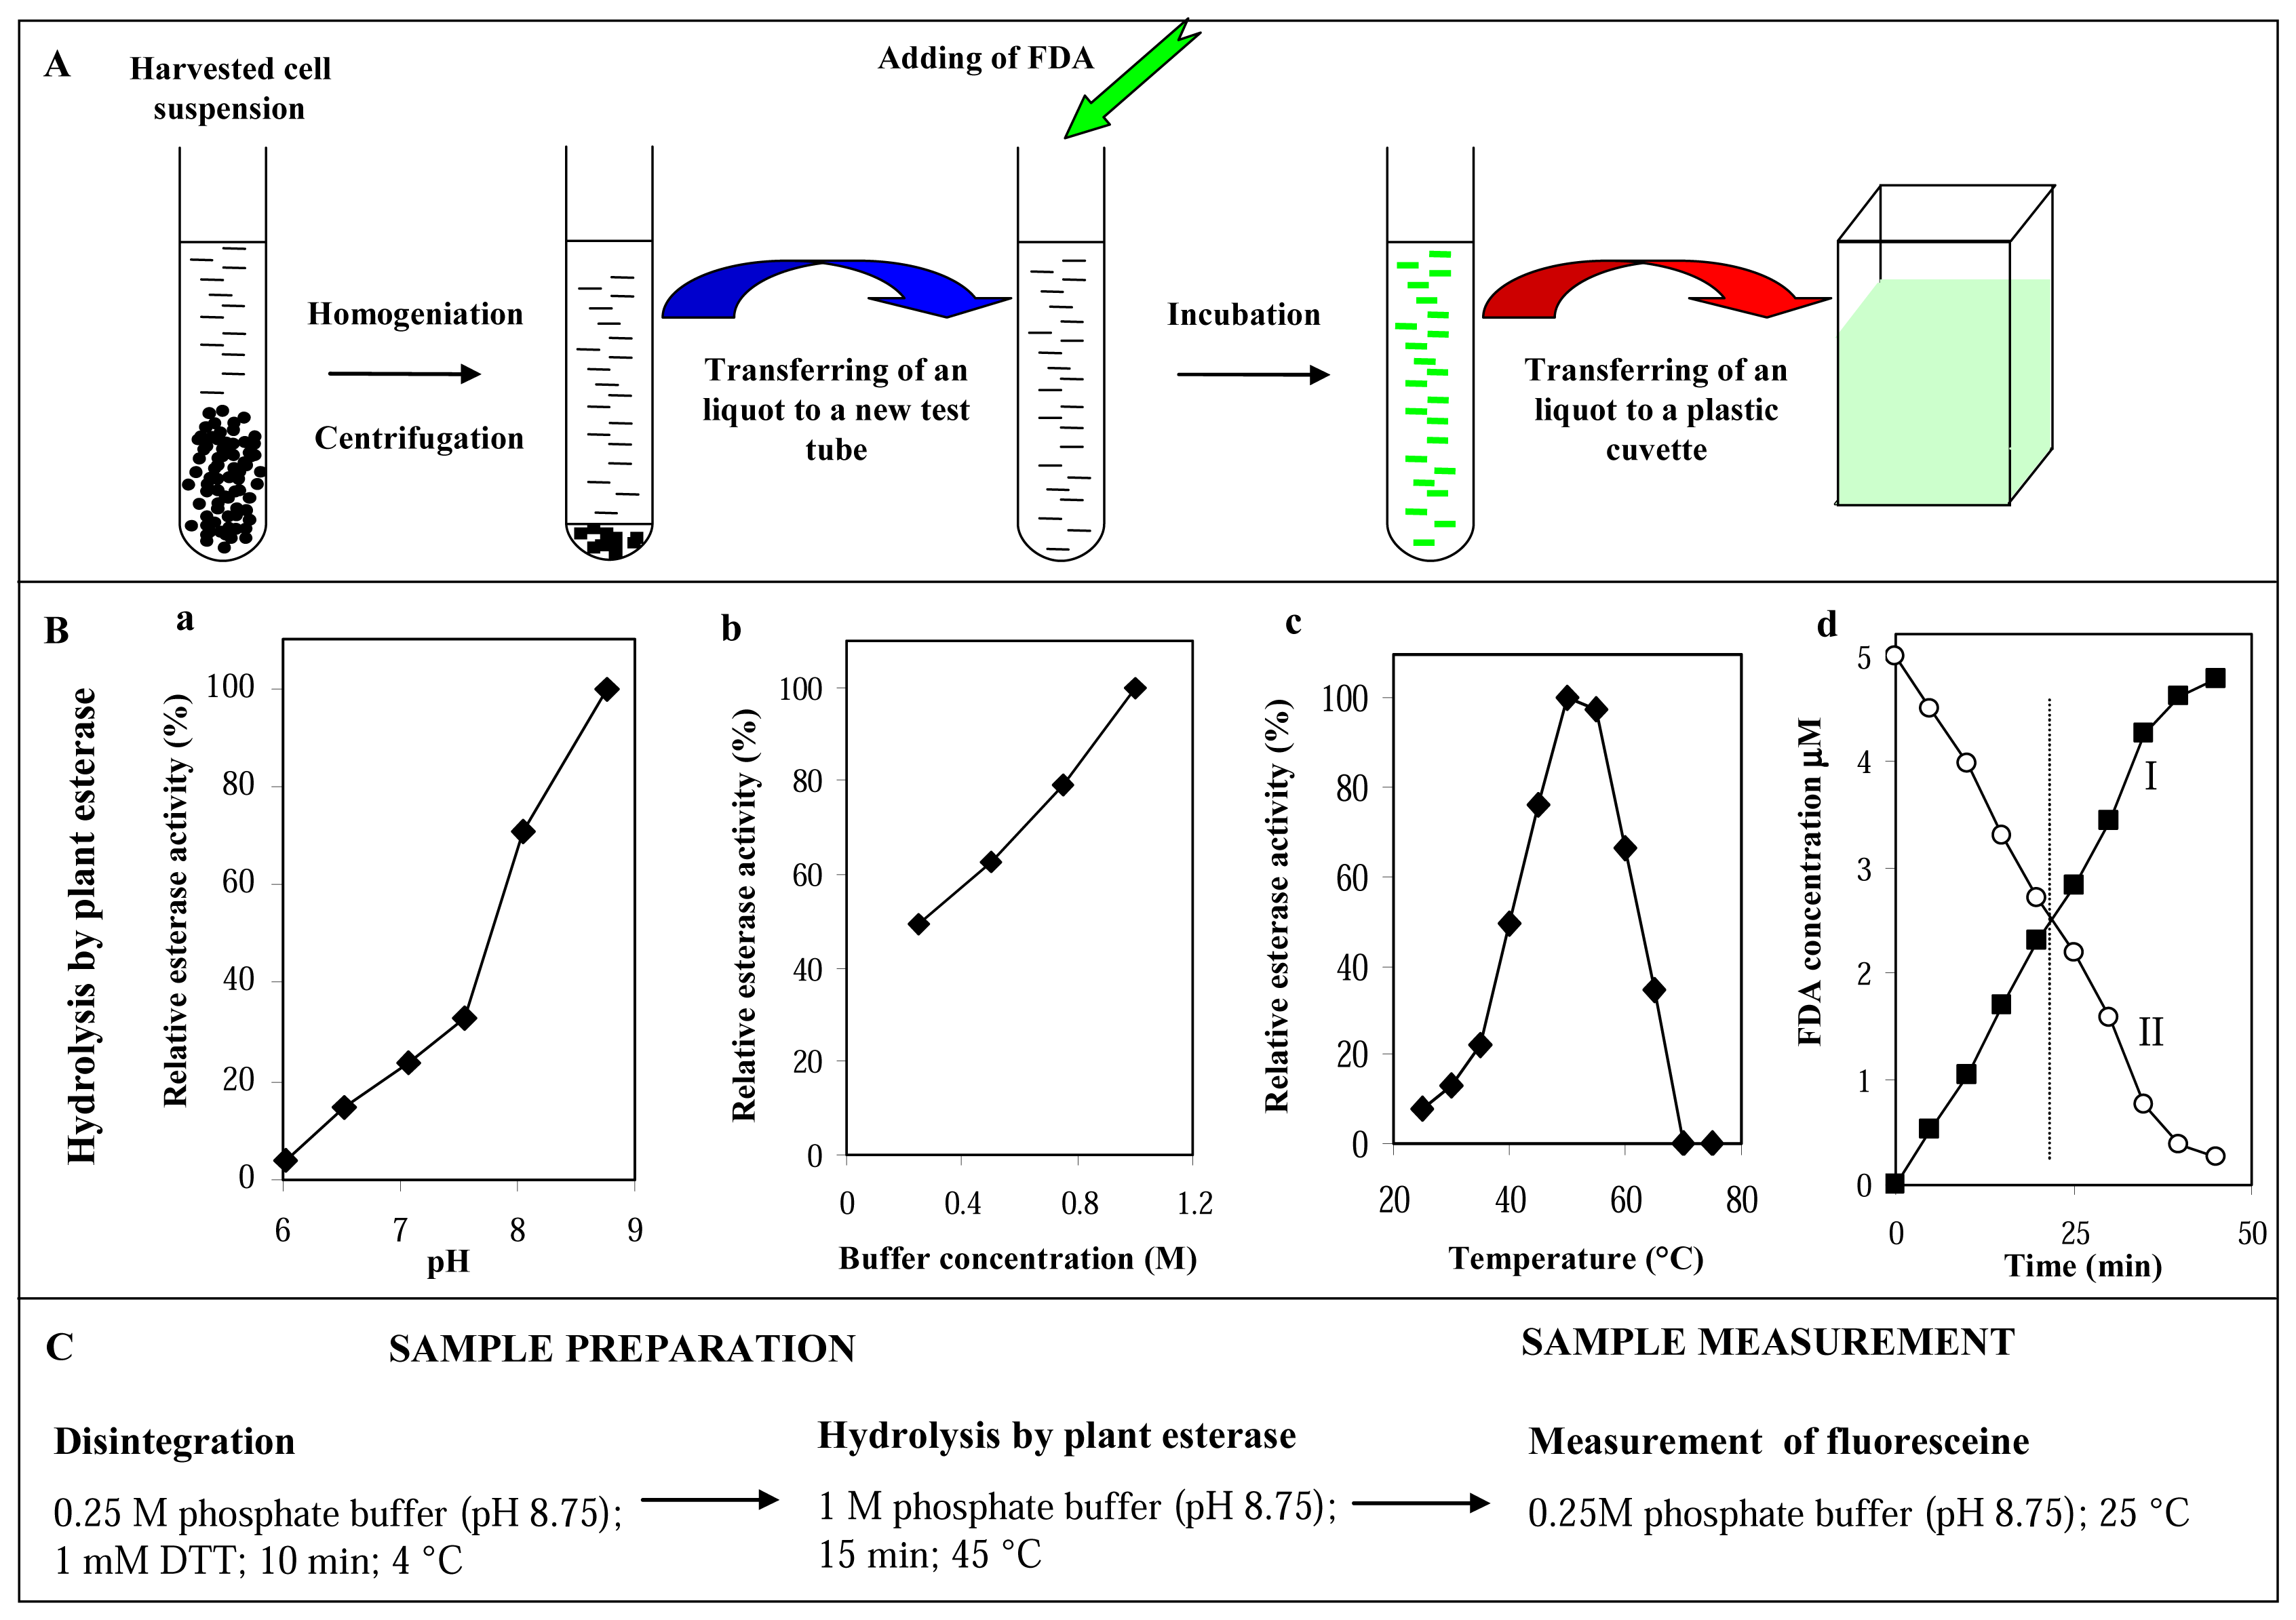
Step 1: disintegration of cells

Preparation of a sample is a very important factor for accurate and precise analysis. That is why our aim was to develop a simple and applicable procedure of esterases isolation from tobacco cells. The cells were disintegrated during 10 min using a Potter-Elvehjem homogenizator, which was placed in ice-bath, in the presence of 250 mM phosphate buffer (pH 8.75) [45]. The disintegration of cells was evaluated by microscopic observation (data not shown). The homogenate was centrifuged at 10 000 g for 15 min, 4°C. In addition, we were looking for how we could optimize the enzyme's activity. An enzyme's activity is markedly influenced by their redox state and the presence of proteases. That is why we tested the influence of dithiothreitol (DTT, reductive species [46]) and phenylmethylsulfonyl fluoride (PMSF, inhibitor of serine proteases) on the activity levels. We added the reductive specie DTT to the extraction buffer to protect sulfhydryl groups in esterases against oxidation. We found out that addition of 1 mM DTT to the extraction buffer increased the esterase activity by about 100 %. The higher concentrations of DTT (more than 1 mM) did not influence of esterase activity (data not shown). In addition, proteases present in the cell extract can negatively influence esterase activity because they are able to hydrolyze the esterases. That is why we added the PMSF, which is commonly used as an inhibitor of serine proteases, to the extraction buffer and observed its influence on esterase activity. However, PMSF (1 mM) decreased the esterase activity about 40 %. Apparently, PMSF covalently modifies the active site serine hydroxyl groups in proteases and esterases. That is why it probably eliminated the esterasolytic activity of the plant enzymes, which apparently have a serine in the catalytic site.

Step 2: hydrolysis of fluorescein diacetate by plant esterases

For our purposes, we used the three days old cell suspension of BY-2 tobacco cells (exponential phase of growth). We harvested 1 ml of cell suspension of BY-2 tobacco cells (number of cells was about 1,500,000) and homogenized by the above mentioned procedure. The supernatant was used as the source of plant esterases. The scheme for sample preparation and consequent detection of its esterase activity is shown in Fig. 3A.

Influence of pH and concentration of phosphate buffer

The supernatant containing plant esterases was pipetted (10 μl) to test tubes filled 980 μl of phosphate buffer. After addition of 10 μl of 0.5 mM FDA, we studied its hydrolysis as a function of different values of phosphate buffer pH. It is already known that pH markedly influences the enzymatic activity. That is why we looked for the optimal pH value where we would obtain the highest amounts of fluorescein during the hydrolytic reaction (15 min). We studied the influence of different pH values from pH 6.00 to 8.75. We observed that the esterase activity of PE increased with increasing pH in the pH range tested (Fig. 3Ba). This phenomenon can be explained by the fact that hydrolysis of FDA is probably nucleophilicly catalysed [25]. From these results it clearly follows that phosphate buffer (pH 8.75) was a most suitable buffer for the determination of PE (R.S.D about 5 %).
In addition, we were interested in whether the concentration of the phosphate buffer influences the PE esterase activity. We found out that amounts of fluorescein created by FDA hydrolysis increased linearly in the concentration range 250 mM – 1 M (Fig. 3Bb). The observed phenomenon was surprising to us. The results can be explained by the fact that the higher ionic strength of the solution probably accelerates the hydrolysis of FDA. From these results it follows that plant esterases probably exhibit higher activity in the presence of higher concentrations of phosphate buffer (about 1 M) in comparison with the lower values. That is why we selected 1 M phosphate buffer (pH 8.75) for use in the most sensitive detection method for esterases.

Influence of temperature

The temperature-rate profile of esterases catalyzing hydrolysis of FDA was studied in the range of 25°C – 75°C. Activity markedly increased with increasing temperature up to 50°C (Fig. 3Bc). That temperature (50°C) represents the temperature optimum of the reaction and was similar to values observed in the case of bacterial esterases [47]. The activity of the plant esterases decreased at temperatures higher then 55°C very quickly. At a temperature of 70°C, the esterases were in-active. This effect may be attributed to heat denaturation. On the other hand, the experimental deviation increased with increasing temperature and at the 50°C exceeded 10 %. That is why we selected 45°C (R.S.D. was about 5 %) as the most suitable temperature used for the determination of the plant esterases.

Influence of reaction time on detection of plant esterases and spontaneous hydrolysis of FDA

During the PE enzymatic reaction the substrate concentration decreases according to Michaelis-Menten kinetics (vi = (Vmax.[S])/(Km+ [S]); vi – momentary rate of enzymatic reaction; Vmax – maximal rate of the reaction; [S] – substrate concentration; Km – Michealis-Menten constant) [48]. If the concentration of substrate decreases to a critical value, the zero-order reaction (enzyme is saturated by substrate and enzymatic reaction rate is independent on substrate concentration) transition to a first-order reaction (enzyme is not saturated by substrate and enzymatic reaction rate is dependent on substrate concentration). The course of analytical determination of fluorescein is influenced by i) spontaneous hydrolysis of FDA. FDA is hydrolysed by esterases (catalysed) and medium (spontaneous). Deviations caused by spontaneously hydrolysis of FDA were eliminated at all fluorimetric measurements by subtracting the rate obtained from a blank sample prepared according to suggested procedure without addition of plant esterases. ii) Degradation of PE. Esterase activity decreases with time after extraction at a rate of about 0.3 % per minute. That is why the extracts were analyzed within 30 minutes after the disintegration step when the activity decreases maximally by about 9 % in comparison with fresh extract. iii) Consumption of FDA substrate during its spontaneous and PE catalysed hydrolysis. It was necessary to ensure the excess of the substrate in case of the detection of samples with unknown esterase activity. The time course of total FDA hydrolysis (spontaneous and catalysed hydrolysis; curve I) is shown in Fig. 3Bd. The total hydrolysis of FDA linearly decreased up to 30 min and then changed gradually finally reaching more than 85 % FDA. In addition, a decrease of FDA with reaction time (curve II) is shown in Fig. 3Bd. The demand for sufficient amounts of FDA, which were necessary for the hydrolytic reaction, was obtained after a 15 min long reaction (consumption of FDA was less then 50 % in the case of analysis of 3 days cultivated tobacco cell suspension); see Fig. 3Bd.

Step 3: measurement of fluorescein after PE hydrolysis of FDA

After a 15 min long reaction time, we collected 10 μl of the sample and added to 1990 μl of 250 mM phosphate buffer (pH 8.75) at room temperature. The solution was carefully mixed and immediately analysed for fluorescence.

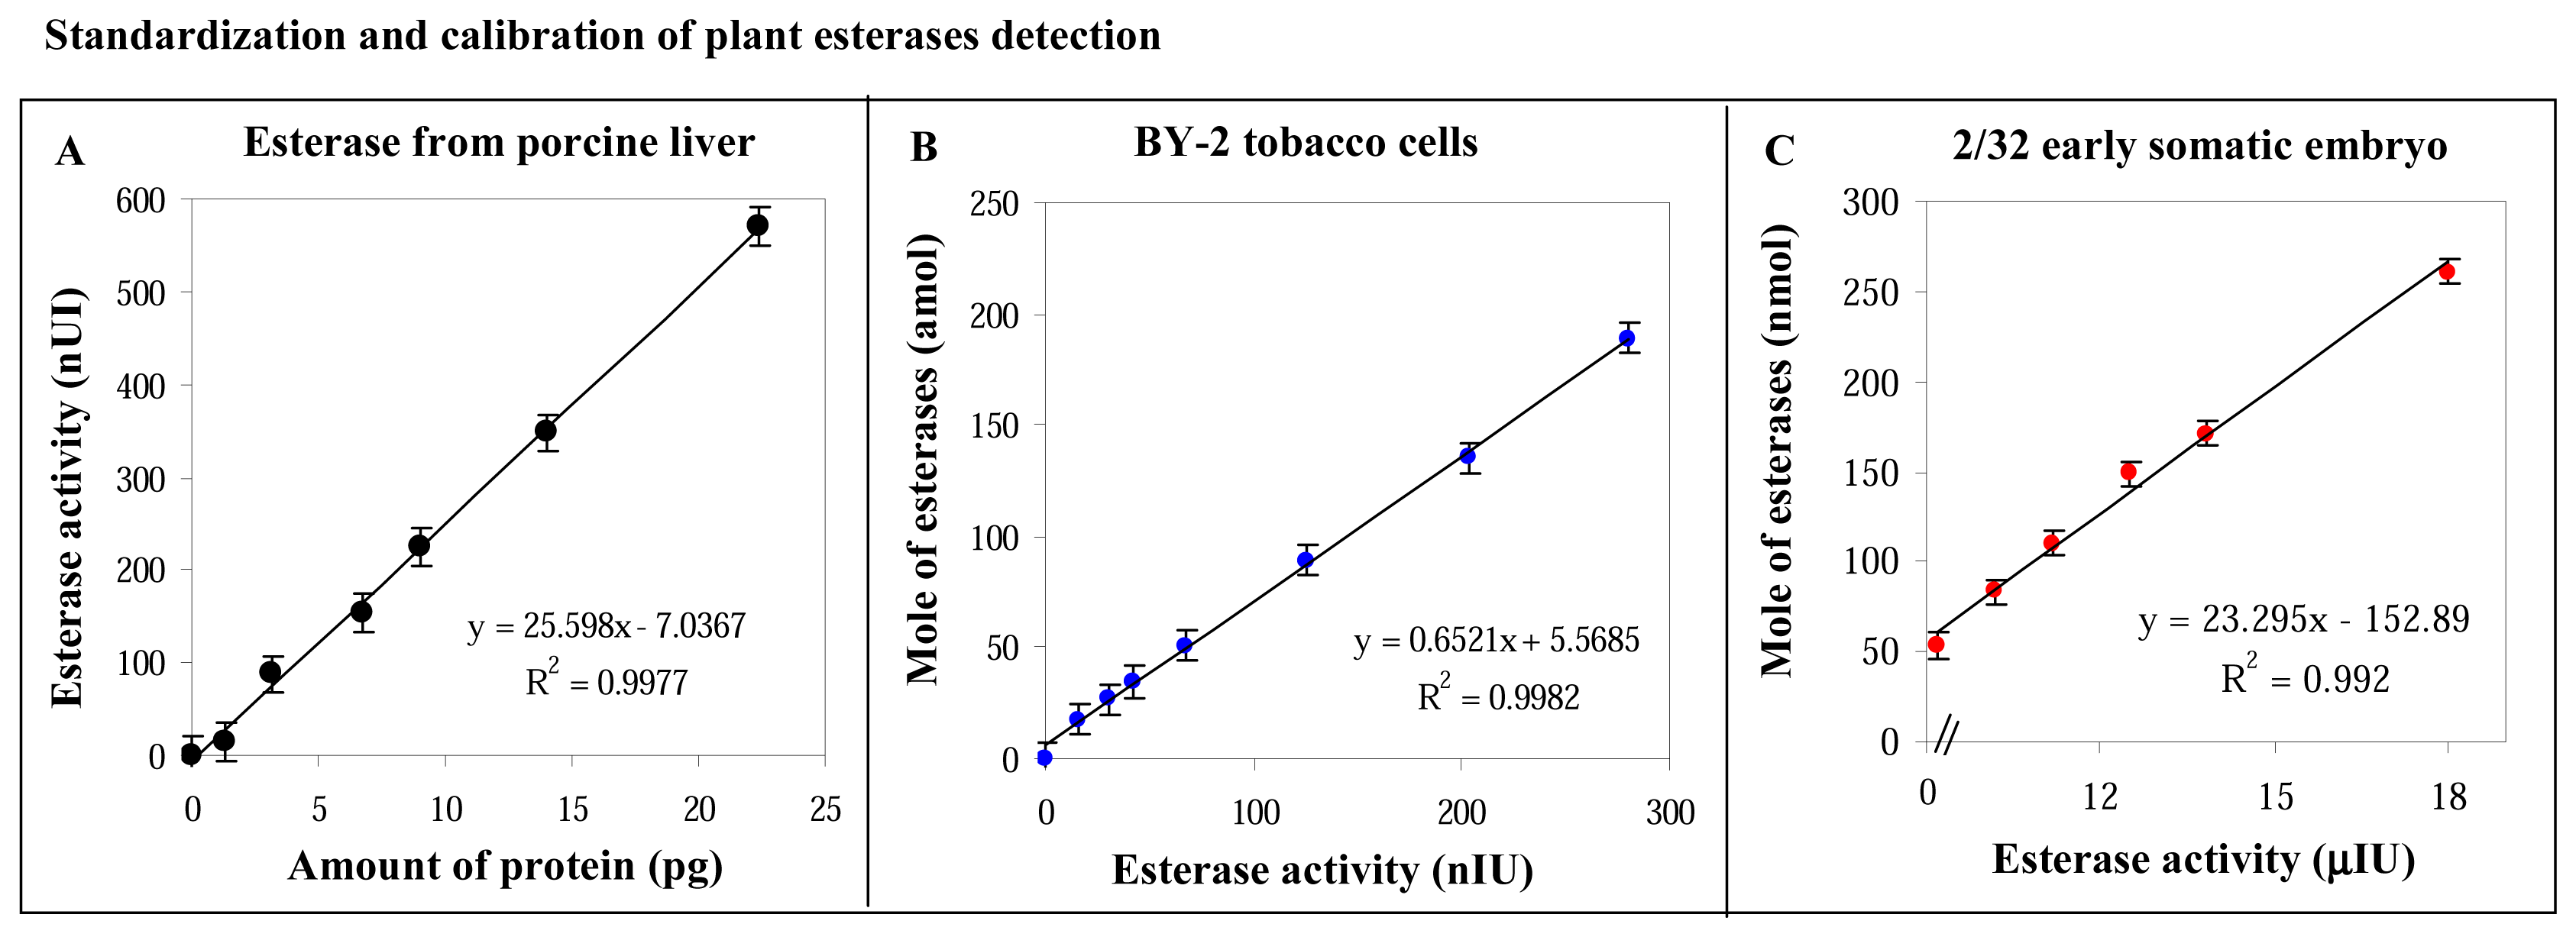
3.3 Standardization and calibration of the fluorimetry detection of plant esterases

From the obtained results it followed that the analytical approach developed was possible to use for very sensitive detection of plant esterases. That is why we standardized the plant esterase detection method using a readily available esterase, pig liver esterase.
We studied dependence of pig liver esterase activity on its concentration. The curve obtained was linear (y = 25.598x – 7.0367, R2 = 0.9977, n = 7, see Fig. 4A). The detection limit was evaluated by sample dilution until we did not detect any enzymatic activity. Using the optimised conditions of fluorimetric analysis of PE, the detection limit was 0.2 pg of the pig liver esterase (5 amol of enzyme).
It was possible to use the pig liver esterases as a standard enzyme for quantification of PE detected in cell extracts (tobacco cells and early somatic embryos of spruce). Dependence of BY-2 tobacco cells esterase activity on amounts of the esterase presented in analysed sample is shown in Fig. 4B. The obtained curve is linear (y = 0.6521x + 5.5685, R2 = 0.9982, n = 7). The detection limit was about 17 amol. If we studied the correlation between esterase activity and amounts of esterases in 2/32 early somatic embryo cells, we obtained linear dependence too (y = 23.295x – 152.89, R2 = 0.992, n = 7). The detection limit was about 50 amol (Fig. 4C).

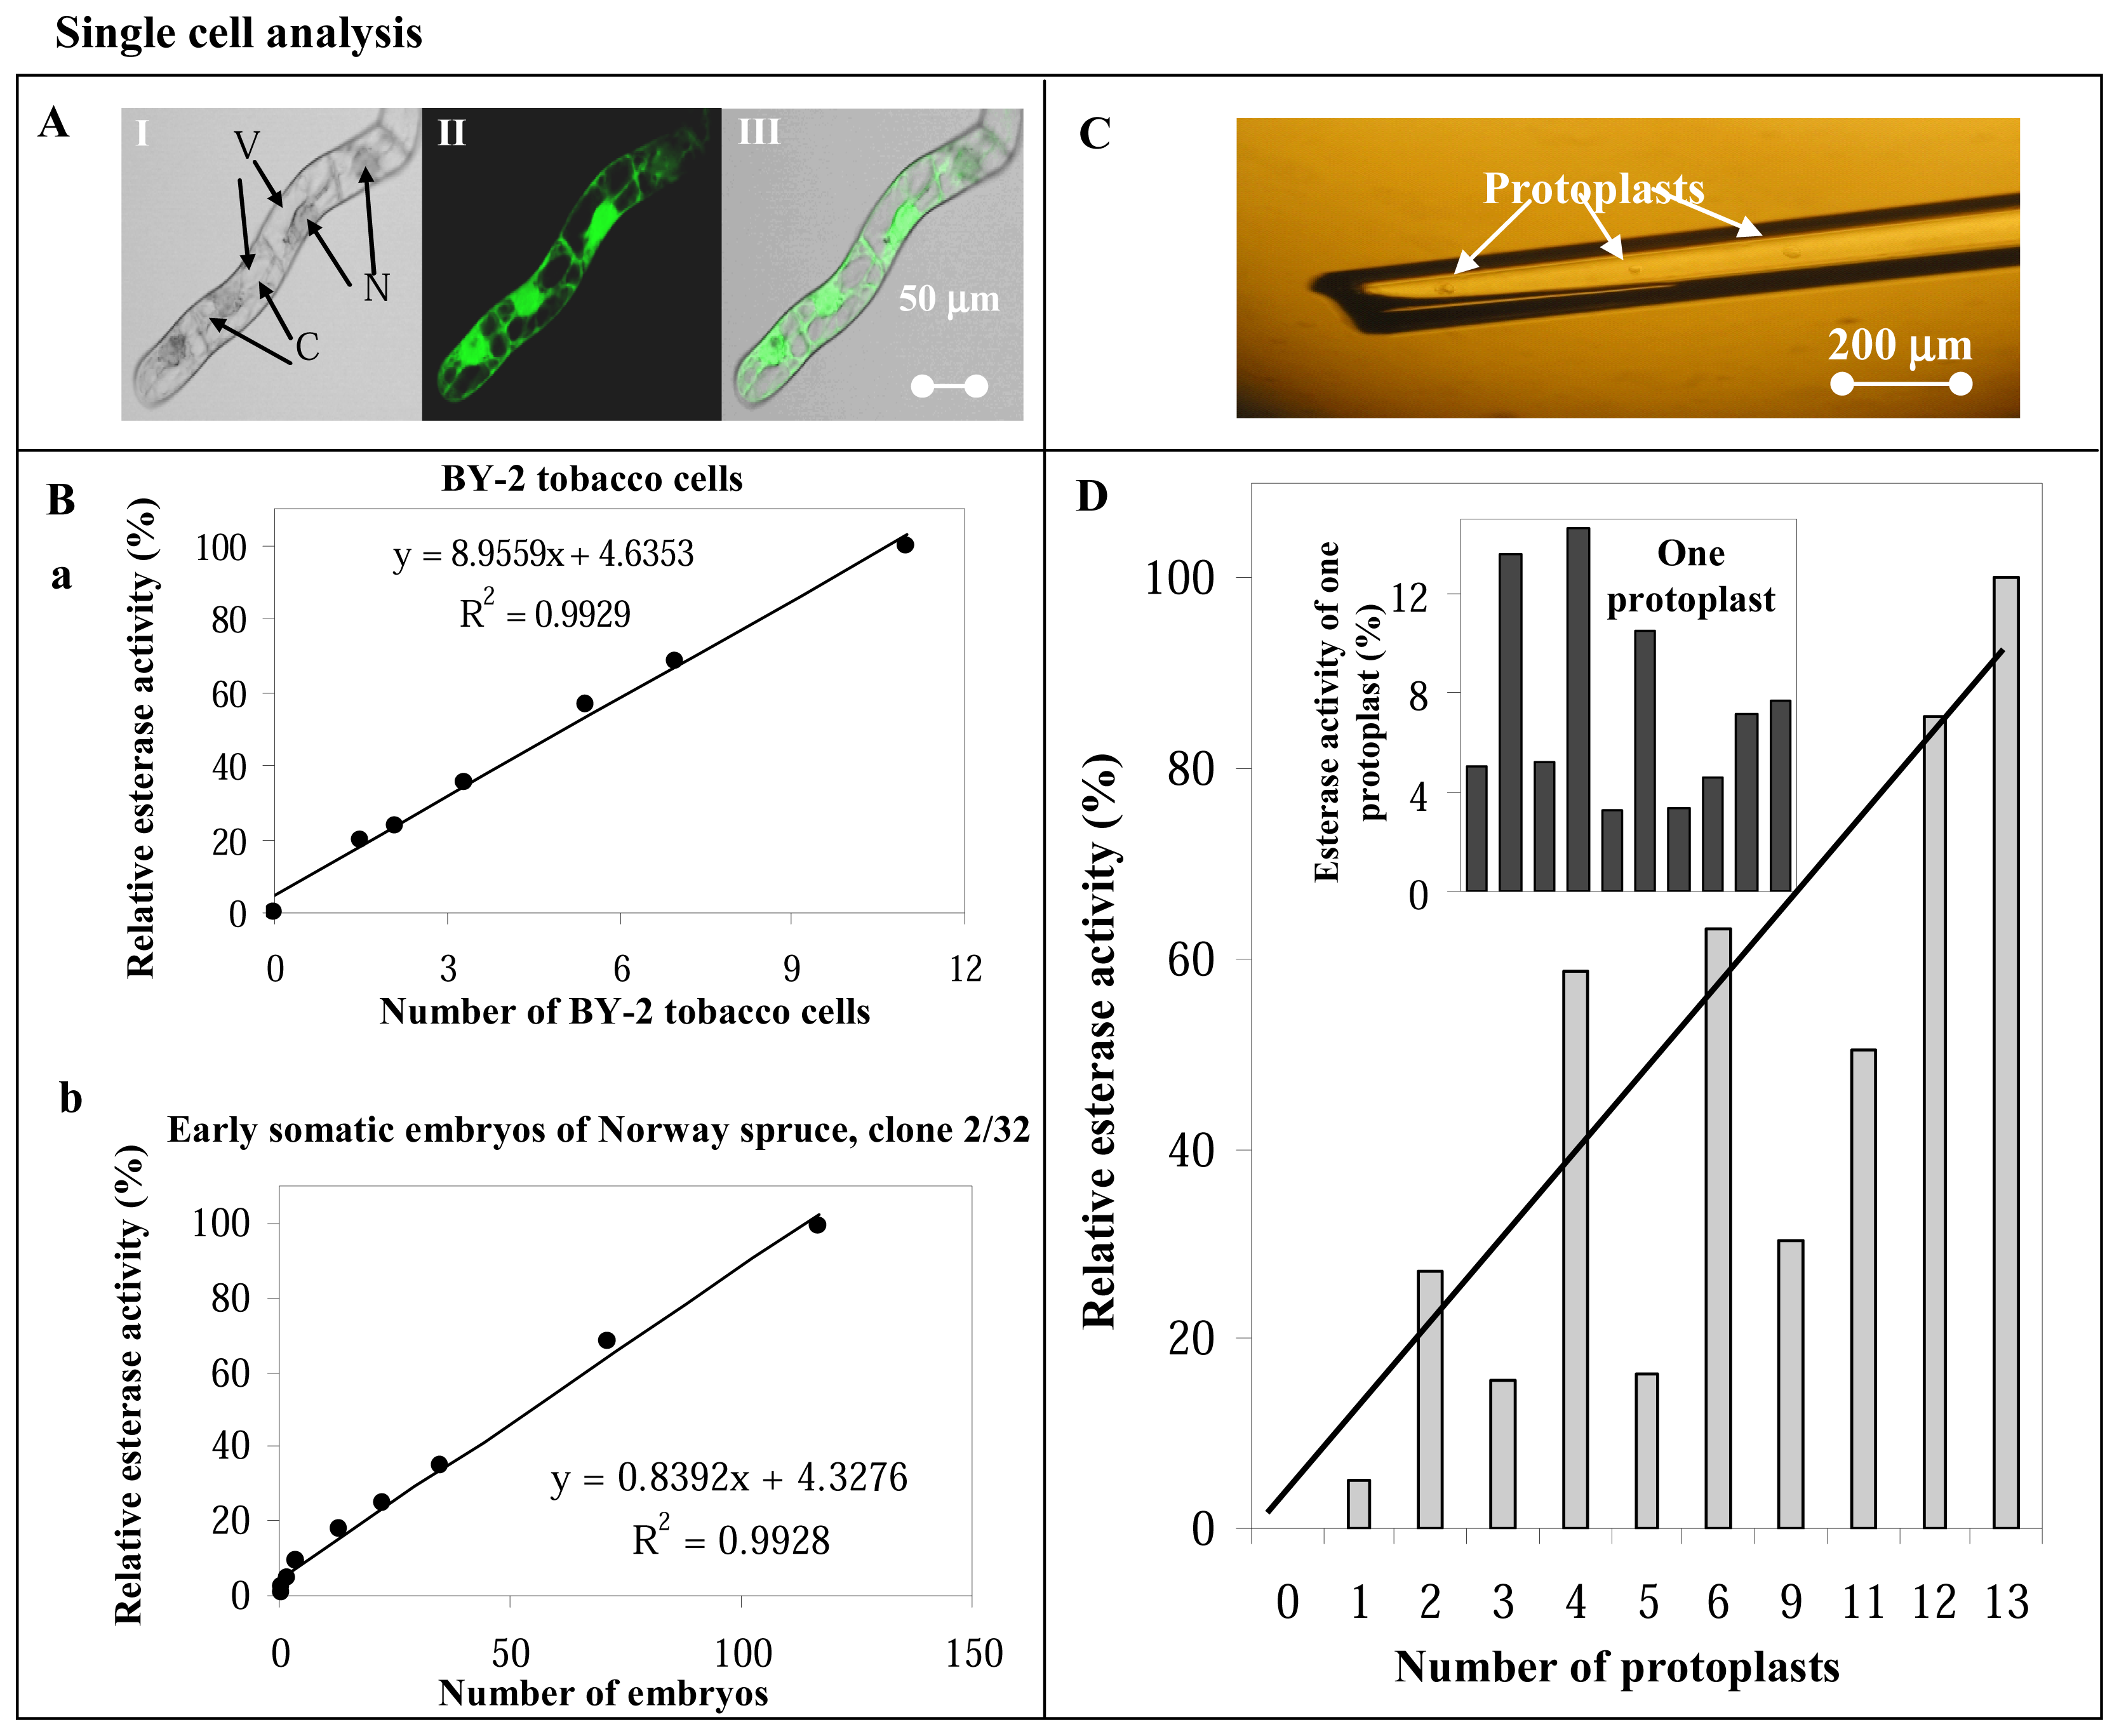
3.4 Single cell analysis

Nowadays, studies of metabolic pathways and processes in living organisms cannot be easily done at the cellular level. The development of a new analytical methods and approaches is needed, which would be able to detect number of different biological important species at very low concentrations levels and sample volumes, especially in individual cells. We assumed that the optimised sensor for the determination of PE in cell extracts accomplishes all requirements for a sensitive analysis usable for single cell analysis. Thus we applied the detection method to the determination of esterases in one BY-2 tobacco cell. Primarily, we focused on localization of esterases inside the cell.

Localization of esterase activity in BY-2 tobacco cell

We used confocal microscopy to perform the cell optical sections. We added FDA, which is able to diffuse through the cytoplasmatic membrane to the cell cytoplasm in BY-2 tobacco cells. The FDA is consequently hydrolysed by plant esterases inside the cell. The fluorescein obtained can be excited by an Ar-laser (488 nm). Microscopic recording of BY-2 tobacco cells in the transmitted light shows the locations of vacuoles, cytoplasm and nuclei inside the BY-2 cell (Fig. 5A I). Accumulation of fluorescein inside the cell leads to intensive green fluorescence after excitation by the laser (Fig. 5A II). The figure was created by merging of Figs. 5A I and II, which is shown in Fig. 5A III. The figure shows that esterases were mainly localized in the cytoplasm and nuclei (Fig. 5A III). The analysis of confocal recordings surprisingly proved that nuclei contain 37±6 % and cytoplasm 63±6 % of the whole esterase activity. The presence of relatively high amounts of esterases in nuclei probably is associated with homeostatic controlling of the nuclei's environment.

Fluorimetric detection of esterase activity in cell extracts of BY-2 tobacco cells and spruce embryos (clone 2/32)

As was mentioned above, we were able to determine attomole levels of esterase in real samples. When we studied the localization of esterases in one cell, we applied the fluorimetric technique for single cell analysis. Samples with defined numbers of cells (103 and 104, established by cell counting) were prepared and homogenized according to above mentioned procedure (for other details see Materials and Methods). The samples were consequently diluted until we did not detect any fluorescence. The dependence of BY-2 tobacco cells number on relative esterase activity is shown in Fig. 5Ba and exhibited a linear relationship (y = 8.9559x + 4.6353; R2 = 0.9929, n = 7). The detection limit (3 S/N) was 1.5 cells in case of analysing BY-2 tobacco cells. In addition, we obtained linear dependence of number of early somatic embryos (clone 2/32) on relative esterase activity (y = 0.839x + 4.3276; R2 = 0.9928, n = 7). The detection limit was 0.5 of an embryo.
The results obtained lead us to attempt the separation of the individual cells. Unfortunately we were unable to separate one BY-2 tobacco cell from the cell suspension. In addition, dilution of BY-2 tobacco cells with defined number of the cells is very difficult at low numbers of cells (tens of cells) because the cells form chains making separation very difficult. Moreover, we observed that the detection of esterases in diluted cell samples (tens of cells) is difficult with an experimental deviation (more than 30 %), which was probably caused by non-uniform proportioning of the cells in the solution and/or difficulty in disrupting plant cell walls in low volumes. That is why, for our purposes we decided to use the protoplasts prepared from BY-2 tobacco cells (preparation see Experimental section).

Fluorimetric detection of esterase activity in one protoplast

Protoplasts (BY-2 tobacco cells without cell wall) were collected by glassy capillary in about 300 nl volume and microscopically counted at 100 × magnification (see Fig. 5C). Their homogenisation was performed by freezing/thawing cycle in triplicates (all protoplasts were disrupted that was evaluated by microscopy). The PE esterase activities measured according to the number of protoplasts are shown Fig. 5D. The PE activity was found to vary, but the correlation between esterase activity and the number protoplasts exhibited an upward trend (R2 = 0.7). That is why we repeatedly collected individual protoplasts and consequently detected its esterase activity (see inset of Fig. 5D). The esterase activity of individual protoplasts markedly varied with the deviation of repeated determinations (n = 5) of one protoplast sample being about 5 %. The ability to detect the variability of PE activity in the single protoplast proves that the optimised fluorimetric detection of esterases is not only suitable for single cell enzyme detection but also for studying of metabolic changes at the one cell level.

4. Conclusions

The analytical method developed for the quantification of esterases, based on the fluorimetric detection of the products of enzymatic fluorescein diacetate hydrolysis, represents a new and very sensitive tool for the analysis of single cells and for the study of growth and metabolic changes of cell cultures at single cell level in a commonly used plastic cuvette. In addition, the method enables researchers to study the growth characteristic of cultures that form solid clusters of cells. The method can be used for environmental analysis of the influence of stress factors on living systems. The whole process of esterase determination is possible to be automated for an inexpensive and rapid routine method in connection with flow injection analysis [49].

Acknowledgments

This work was supported by grants as follows: 1M06030 and IGA MZ 1A/8666-3.

References

  1. Lu, X.; Huang, W. -H.; Wang, Z.-L.; Cheng, J.-K. Recent developments in single-cell analysis. Anal. Chim. Acta 2004, 510, 127–138. [Google Scholar]
  2. Kuo, H.C.; Cheng, C.F.; Clark, R.B.; Lin, J.J.C.; Lin, J.L.C.; Hoshijima, M.; Nguyen-Tran, V.T.B.; Gu, Y.S.; Ikeda, Y.; Chu, P.H.; Ross, J.; Giles, W.R.; Chien, K.R. A defect in the Kv channel-interacting protein 2 (KChIP2) gene leads to a complete loss of I-to and confers susceptibility to ventricular tachycardia. Cell 2001, 107, 801–813. [Google Scholar]
  3. Roper, S.N.; Yachnis, A.T. Cortical dysgenesis and epilepsy. Neuroscientist 2002, 8, 356–371. [Google Scholar]
  4. Oguri, S. Electromigration methods for amino acids, biogenic amines and aromatic amines. J. Chrom. B 2000, 747, 1–19. [Google Scholar]
  5. Ginsberg, S.D.; Che, S.L. RNA amplification in brain tissues. Neurochem. Res. 2002, 27, 981–992. [Google Scholar]
  6. Mawrin, C.; Kirches, E.; Dietzmann, K. Single-cell analysis of mtDNA in amyotrophic lateral sclerosis: Towards the characterization of individual neurons in neurodegenerative disorders. Pathol. Res. Pract. 2003, 199, 415–418. [Google Scholar]
  7. Trushina, E.; Heldebrant, M.P.; Perez-Terzic, C.M.; Bortolon, R.; Kovtun, I.V.; Badger, J.D.; Terzic, A.; Estevez, A.; Windebank, A.J.; Dyer, R.B.; Yao, J.; McMurray, C.T. Microtubule destabilization and nuclear entry are sequential steps leading to toxicity in Huntington's disease. Proc. Natl. Acad. Sci. USA 2003, 100, 12171–12176. [Google Scholar]
  8. Lin, Y.W.; Chiu, T.C.; Chang, H.T. Laser-induced fluorescence technique for DNA and proteins separated by capillary electrophoresis. J. Chrom. B 2003, 793, 37–78. [Google Scholar]
  9. Vilkner, T.; Janasek, D.; Manz, A. Micro total analysis systems. Recent developments. Anal. Chem. 2004, 76, 3373–3385. [Google Scholar]
  10. Andersson, H.; van den Berg, A. Microtechnologies and nanotechnologies for single-cell analysis. Curr. Opin. Biotech. 2004, 15, 44–49. [Google Scholar]
  11. Zhang, H.; Jin, W.R. Analysis of amino acids in individual human erythrocytes by capillary electrophoresis with electroporation for intracellular derivatization and laser-induced fluorescence detection. Electrophoresis 2004, 25, 480–486. [Google Scholar]
  12. Tamaki, E.; Sato, K.; Tokeshi, M.; Sato, K.; Aihara, M.; Kitamori, T. Single-cell analysis by a scanning thermal lens microscope with a microchip: Direct monitoring of cytochrome c distribution during apoptosis process. Anal. Chem. 2002, 74, 1560–1564. [Google Scholar]
  13. Yavuz, A.S.; Lipsky, P.E.; Yavuz, S.; Metcalfe, D.D.; Akin, C. Evidence for the involvement of a hematopoietic progenitor cell in systemic mastocytosis from single-cell analysis of mutations in the c-kit gene. Blood 2002, 100, 661–665. [Google Scholar]
  14. Sun, X.M.; Jin, W.R.; Li, D.; Bai, Z.L. Measurement of alkaline phosphatase isoenzymes in individual mouse bone marrow fibroblast cells based on capillary electrophoresis with on-capillary enzyme-catalyzed reaction and electrochemical detection. Electrophoresis 2004, 25, 1860–1866. [Google Scholar]
  15. Sun, X.M.; Jin, W.R. Catalysis-electrochemical determination of zeptomole enzyme and its application for single-cell analysis. Anal. Chem. 2003, 75, 6050–6055. [Google Scholar]
  16. Lynch, M.; Mosher, C.; Huff, J.; Nettikadan, S.; Johnson, J.; Henderson, E. Functional protein nanoarrays for biomarker profiling. Proteomics 2004, 4, 1695–1702. [Google Scholar]
  17. Kleparnik, K.; Horky, M. Detection of DNA fragmentation in a single apoptotic cardiomyocyte by electrophoresis on a microfluidic device. Electrophoresis 2003, 24, 3778–3783. [Google Scholar]
  18. Woods, L.A.; Roddy, T.P.; Ewing, A.G. Capillary electrophoresis of single mammalian cells. Electrophoresis 2004, 25, 1181–1187. [Google Scholar]
  19. Hu, K.; Zarrine-Afsar, A.; Ahmadzadeh, H.; Krylov, S.N. Single-cell analysis by chemical cytometry combined with fluorescence microscopy. Instrum. Sci. Technol. 2004, 32, 31–41. [Google Scholar]
  20. Harris, D.C. Quantitative chemical analysis; W. H. Freeman and Company, 2003. [Google Scholar]
  21. Goddard, J.P.; Reymond, J.L. Recent advances in enzyme assays. Trends Biotech. 2004, 22, 363–370. [Google Scholar]
  22. Durdux, M.; Grunwald, D.; Gautier, T.; Ronot, X.; Boutonnat, J. Fluorescence-based assessment of LRP activity: A comparative study. Anticancer Res. 2004, 24, 725–732. [Google Scholar]
  23. Bornemann, C.; Burggraef, T.; Heimbuchel, G.; Hanisch, F.G.; Winkels, S. Fluorescence-labelled antigen-binding fragments (Fab) from monoclonal antibody 5F12 detect human erythropoietin in immunoaffinity capillary electrophoresis. Anal. Bioanal. Chem. 2003, 376, 1074–1080. [Google Scholar]
  24. Stiborova, M.; Rupertova, M.; Hodek, P.; Frei, E.; Schmeiser, H.H. Monitoring of DNA adducts in humans and P-32-postlabelling methods. A review. Collect. Czech. Chem. C. 2004, 69, 476–498. [Google Scholar]
  25. Svensson, R.; Greno, C.; Johansson, A.S.; Mannervik, B.; Morgenstern, R. Synthesis and characterization of 6-chloroacetyl-2-dimethylaminonaphthalene as a fluorogenic substrate and a mechanistic probe for glutathione transferases. Anal. Biochem. 2002, 311, 171–178. [Google Scholar]
  26. Vitecek, J.; Adam, V.; Petrek, J.; Babula, P.; Novotna, P.; Kizek, R.; Havel, J. Application of fluorimetric determination of esterases in plant material. Chem. Listy 2005, 99, 496–501. [Google Scholar]
  27. Vitecek, J.; Adam, V.; Petrek, J.; Vacek, J.; Kizek, R.; Havel, L. Esterases as a marker for growth of BY-2 tobacco cells and early somatic embryos of the Norway spruce. Plant Cell Tiss. Org. 2004, 79, 195–201. [Google Scholar]
  28. Vitecek, J.; Petrlova, J.; Adam, V.; Petrek, J.; Havel, L.; Kramer, K.J.; Kizek, R. Application of fluorimetric analysis of plant esterases to study of programmed cell death and effects of cadmium(II) ions. Biol. Plant. 2007, in press. [Google Scholar]
  29. Aldridge, W.N. The esterases: pespectives and problems. Chem.-Biol. Interact. 1993, 87, 5–13. [Google Scholar]
  30. Nagata, T.; Nemoto, Y.; Hasezawa, S. Tobacco BY-2 cell line as the “HeLa” cell line in the cell biology of higher plants. Int Rev Cytol 1992, 132, 1–30. [Google Scholar]
  31. Murashige, T.; Skoog, F. A revised medium for rapid growth and bioassays with tobacco tissue cultures. Physiol. Plant 1962, 15, 473. [Google Scholar]
  32. Jokinen, K.J.; Durzan, D.J. Properties of rescued embryonal suspensor mass of Norway spruce (Picea abies L. Karst.) determined by the genotype and environment in vitro. Silva. Fenn. 1994, 28, 95–106. [Google Scholar]
  33. Durzan, D.J.; Jokinen, K.; Guerra, M.P.; Santerre, A.; Chalupa, V.; Havel, L. Latent diploid parthenogenesis and parthenote cleavage in egg-equivalents of norway spruce. Int. J. Plant Sci. 1994, 155, 677–688. [Google Scholar]
  34. von Arnold, S.J. Improved efficiency of somatic embryogenesis in mature embryos of Picea abies (L.). Plant Physiol. 1987, 127, 233–244. [Google Scholar]
  35. Havel, L.; Durzan, D.J. Apoptosis during diploid parthenogenesis and early somatic embryogenesis of Norway spruce. Int. J. Plant Sci. 1996, 157, 8–16. [Google Scholar]
  36. Havel, L.; Durzan, D.J. Apoptosis in plants. Bot. Acta 1996, 109, 268–277. [Google Scholar]
  37. Jones, K.H.; Senft, J.A. An improved method to determine cell viability by simultaneous staining with fluorescein diacetate propidium iodide. J. Histochem. Cytochem. 1985, 33, 77–79. [Google Scholar]
  38. Petrek, J.; Vitecek, J.; Vlasinova, H.; Kizek, R.; Kramer, K.J.; Adam, V.; Klejdus, B.; Havel, L. Application of computer imaging, stripping voltammetry and mass spectrometry for study of the effect of lead (Pb-EDTA) on growth and viability of early somatic embryos of Norway spruce (Picea abies /L./ Karst.). Anal. Bioanal. Chem. 2005, 383, 576–586. [Google Scholar]
  39. Mlejnek, P.; Prochazka, S. Activation of caspase-like proteases and induction of apoptosis by isopentenyladenosine in tobacco BY-2 cells. Planta 2002, 215, 158–166. [Google Scholar]
  40. Pinard, C.L.; Weiss, M.L.; Brightman, A.H.; Fenwick, B.W.; Davidson, H.J. Evaluation of lysozyme and lactoferrin in lacrimal and other ocular glands of bison and cattle and in tears of bison. Am. J. Vet. Res. 2003, 64, 104–108. [Google Scholar]
  41. Lomolino, G.; Lante, A.; Crapisi, A.; Spettoli, P.; Curioni, A. Detection of Saccharomyces cerevisiae cerbosylesterase activity after native and sodium dodecyl sulfate electrophoresis by using fluorescein diacetate as substrate. Electrophoresis 2001, 22, 1021–1023. [Google Scholar]
  42. Vallejos, E. Enzyme activity staining; Elsevier Science Publishers B.V., 1983; pp. 513–516. [Google Scholar]
  43. Leach, A.M.; Wheeler, A.R.; Zare, R.N. Flow injection analysis in a microfluidic format. Anal. Chem. 2003, 75, 967–972. [Google Scholar]
  44. Shimazaki, Y.; Hiraka, Y.; Uesugi, M.; Manabe, T. Simultaneous analysis of esterase and transferase activities in cytosol proteins from the bovine retina by using microscale non-denaturing two-dimensional electrophoresis. BBA - Proteins Proteom. 2004, 1696, 51–57. [Google Scholar]
  45. Steward, N.; Martin, R.; Engasser, J.M.; Goergen, J.L. A new methodology for plant cell viability assessment using intracellular esterase activity. Plant Cell Rep. 1999, 19, 171–176. [Google Scholar]
  46. Kizek, R.; Vacek, J.; Trnkova, L.; Jelen, F. Cyclic voltammetric study of the redox system of glutathione using the disulfide bond reductant tris(2-carboxyethyl)phosphine. Bioelectrochemistry 2004, 63, 19–24. [Google Scholar]
  47. Bornscheuer, U.T. Microbial carboyl esterases: clasification, properties and application in biocatalysis. FEMS Microbiol. Rev. 2002, 26, 73–81. [Google Scholar]
  48. Voet, D.; Voet, J.G. Biochemistry; John Wiley & Sons, Inc., 1995. [Google Scholar]
  49. Joga, M.A.; Font, X.; Gordillo, M.A.; Valero, F. Esterase activity assay by flow injection analysis (FIA). Biotechnol. Lett. 2001, 23, 943–948. [Google Scholar]
Figure 1. Reaction scheme of fluorescein diacetate hydrolysis catalyzed by plant esterases (PE).
Sensors 07 00222f1
Figure 2. The electrophoretic profile of esterases detected. The typical profile of tobaco BY-2 intracellular esterases obtained by native electrophoresis on 10% polyacrylamide after FDA staining procedure. Inset shows the image of gel in inverted greyscale. Table shows relative electrophoretic mobility (REM) and ratio relative to total activity of particular protein band. Data are expressed as mean value ± SD (n=9). For other details, see Materials and methods section.
Sensors 07 00222f2
Figure 3. Optimization of the plant esterase determination. Scheme of a plant cells sample prior to analysis (A). FDA hydrolysis by plant esterases (B). The dependence of esterase activity of PE on pH (a), concentration (b) of phosphate buffer; and temperature (c). Relative esterase activity of 1.3 × 10⁻⁵ IU (a), 8.9 × 10⁻⁵ IU (b) and 4.8 ×10⁻⁵ IU (c) corresponds to the 100 %. Influence of reaction time on FDA enzymatic and spontaneous hydrolyses (d). Time course of total (enzymatic and spontaneous together) hydrolysis (I). Curve (II) shows the time course of concentration of FDA in the reaction mixture. Vertical line indicates substrate depletion for the enzymatic reaction. Scheme of sample preparation and its measurements using the most effective experimental conditions (C). For other details, see Results and Discussion section.
Sensors 07 00222f3
Figure 4. Standardization and calibration of plant esterase detection. Calibration dependence of amount of pig liver esterases on esterase activity (A). Dependence of plant esterase activity on mole of esterases contained in BY-2 tobacco cells (B) and 2/32 early somatic embryos (C). Amount of PE was recalculated according to esterase activity of a known amount of pig liver esterase. The most effective experimental conditions for esterase determination are listed in Fig. 3. For other details, see Results and Discussion section.
Sensors 07 00222f4
Figure 5. Single cell analysis. Confocal images of BY-2 tobacco cells in bright field (A). Arrows indicate cytoplasmic strands (C), vacuoles (V), and nuclei (N) (I). Confocal image in the fluorescein channel reveals esterase activity (II). Merged confocal image shows colocalisation of esterase activity with nuclei and cytoplasmic strands (III). Dependence of number of BY-2 tobacco cells (a) and number of early somatic embryos (b) on their esterase activity (B). Photography of glass capillary containing harvested protoplasts (C). Relative esterase activity of different number of protoplasts (D). Inset in (D): diversity of esterase activity per one protoplast. Relative esterase activity of 5.7 × 10⁻⁷ IU (Ba) and 1.8 × 10⁻⁷ IU (Bb) and 8.2 × 10⁻⁷ IU (D) corresponds to the 100 %. Except for the esterase assay in protoplasts (D), data are expressed as mean value ± SD (n=3). For other details, see Materials and Methods and Results and Discussion sections.
Sensors 07 00222f5

