Article

Electroanalysis of Plant Thiols

by
Veronika Supalkova
1,
Dalibor Huska
1,
Vaclav Diopan
1,
Pavel Hanustiak
3,
Ondrej Zitka
2,
Karel Stejskal
2,
Jiri Baloun
1,
Jiri Pikula
3,
Ladislav Havel
1,
Josef Zehnalek
2,
Vojtech Adam
2,
Libuse Trnkova
6,
Miroslava Beklova
3 and
Rene Kizek
2,*
1
Department of Plant Biology, Mendel University of Agriculture and Forestry, Zemedelska 1, CZ-613 00 Brno, Czech Republic
2
Department of Chemistry and Biochemistry, Mendel University of Agriculture and Forestry, Zemedelska 1, CZ-613 00 Brno, Czech Republic
3
Department of Veterinary Ecology and Environmental Protection, University of Veterinary and Pharmaceutical Sciences, Palackeho 1-3, CZ-612 42 Brno, Czech Republic
4
Department of Animal Nutrition and Forage Production, Mendel University of Agriculture and Forestry, Zemedelska 1, CZ-613 00 Brno, Czech Republic
5
Department of Biochemistry, Faculty of Science, Masaryk University, Kotlarska 2, CZ-611 37 Brno, Czech Republic
6
Department of Chemistry, Faculty of Science, Masaryk University, Kotlarska 2, CZ-611 37 Brno, Czech Republic
*
Author to whom correspondence should be addressed.
Sensors 2007, 7(6), 932-959; https://doi.org/10.3390/s7060932
Submission received: 18 May 2007 / Accepted: 12 June 2007 / Published: 13 June 2007

Abstract

:
Due to unique physico-chemical properties of –SH moiety thiols comprise wide group of biologically important compounds. A review devoted to biological functions of glutathione and phytochelatins with literature survey of methods used to analysis of these compounds and their interactions with cadmium(II) ions and Murashige-Skoog medium is presented. For these purposes electrochemical techniques are used. Moreover, we revealed the effect of three different cadmium concentrations (0, 10 and 100 μM) on cadmium uptake and thiols content in maize plants during 192 hours long experiments using differential pulse anodic stripping voltammetry to detect cadmium(II) ions and high performance liquid chromatography with electrochemical detection to determine glutathione. Cadmium concentration determined in tissues of the plants cultivated in nutrient solution containing 10 μM Cd was very low up to 96 hours long exposition and then the concentration of Cd markedly increased. On the contrary, the addition of 100 μM Cd caused an immediate sharp increase in all maize plant parts to 96 hours Cd exposition but subsequently the Cd concentration increased more slowly. A high performance liquid chromatography with electrochemical detection was used for glutathione determination in treated maize plants after 96 and 192 hours of treatment. The highest total content of glutathione per one plant was 6 μg (96 h, 10 μM Cd) in comparison with non-treated plant (control) where glutathione content was 1.5 μg. It can be concluded that electrochemical techniques have proved to be useful to analyse plant thiols.

1. Introduction

An anthropogenic activity influences directly or indirectly not only an organism but also the whole populations and/or communities [1-3]. A technological development improving our living conditions also brought a plenty of negative effects on ecosystems. One of these effects is pollution of air, soil and water by various types of wastes and undesirable substances such as ash, dust, soot, SO2, CO, CO2, NO, NO2, heavy metals and organic compounds (e.g. phenols, dioxines, polycyclic aromatic hydrocarbons, pesticides). These compounds could be dispersed by air circulation, where they can react with various atmosphere components and fall on the ground, pollute the environment and affect the number of organisms [4]. They can be also transformed to metabolites more dangerous than primary pollutant in biosphere. In addition the polluted environment can influence negatively not only the physiological processes (nutrition uptake, growth, reproduction etc.) of an organism but also chemical properties of soil and that way also rate of decomposition processes.
Heavy metals (ρ > 5 g.cm–3) are one of the most toxic and undesirable compounds polluting agricultural products [5-9]. They are natural components of the Earth's crust. To a small extent they enter our bodies via food, drinking water and air. As trace elements, some heavy metals (e.g. copper, selenium, zinc) are essential to maintain the metabolism of the human body. However, other ones such as cadmium, lead, and mercury are toxic at all. At higher concentrations both groups of heavy metals (toxic and essential) lead to poisoning. Heavy metals are also dangerous because they tend to bioaccumulate [10]. That is why the soil with high in heavy metals pose a threat to living organisms [9,11-15].

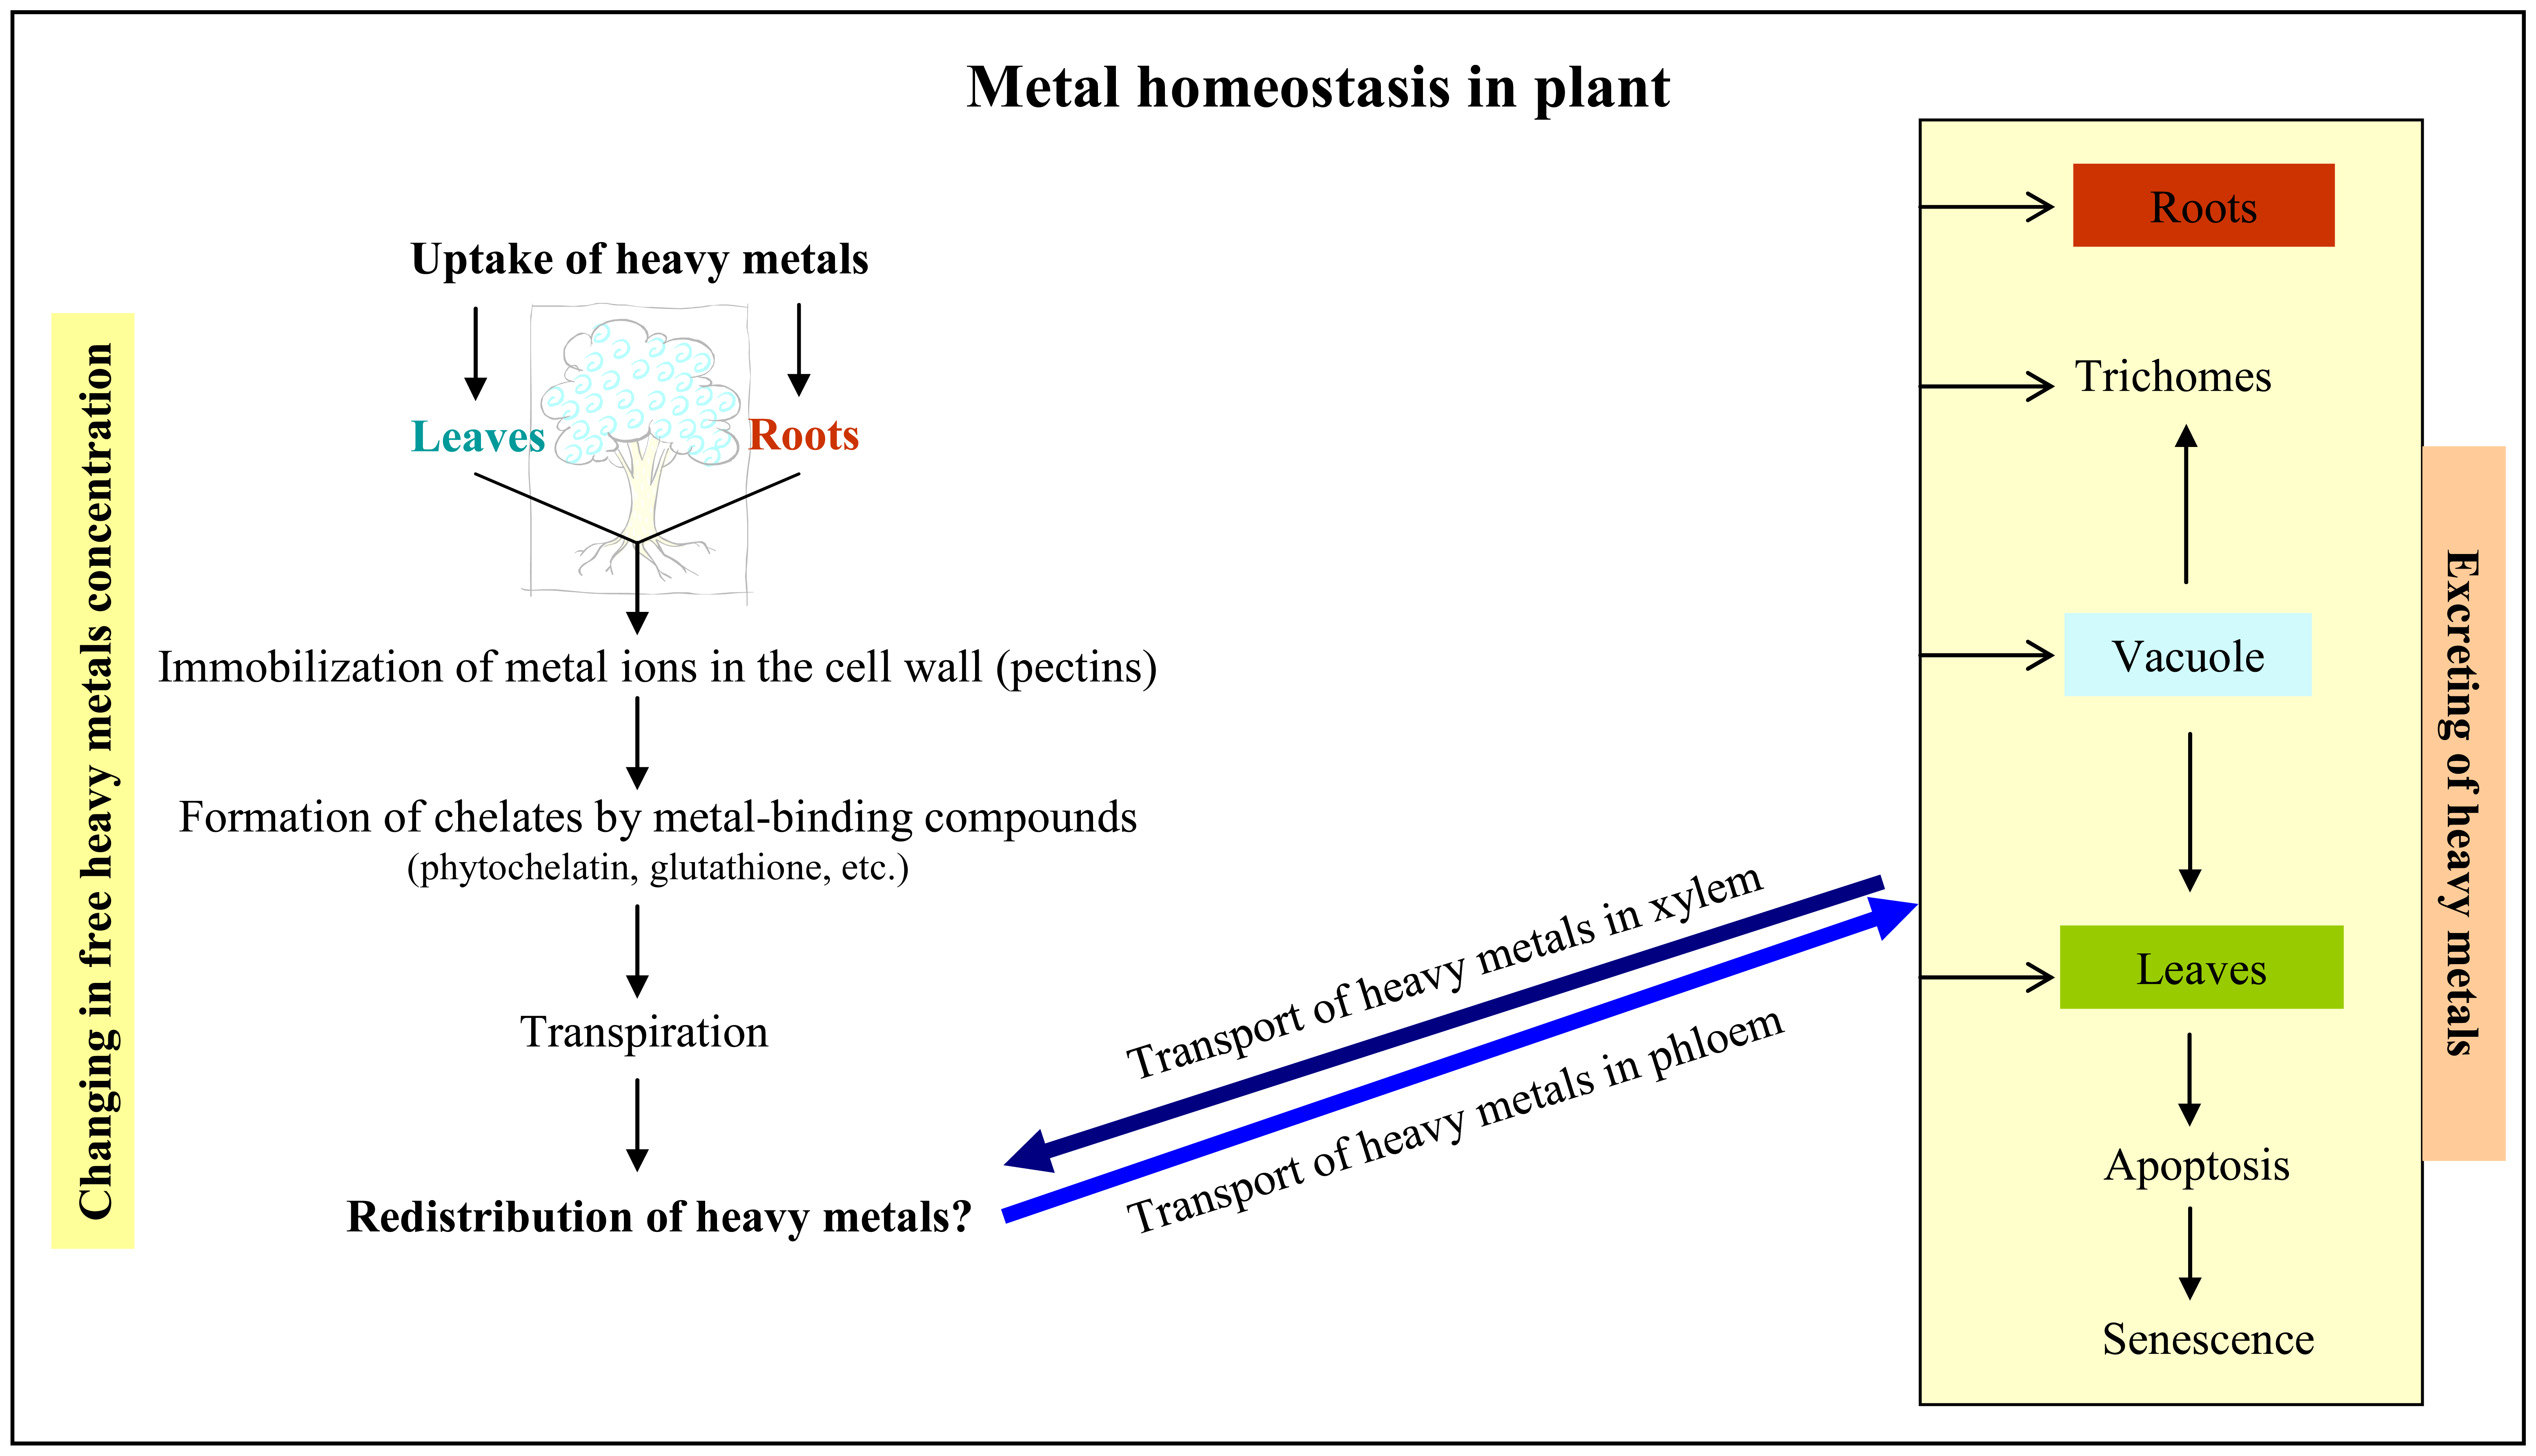
1.1 Uptake of heavy metals by plants

Besides microorganisms and certain animal species, plants are the main group of organism affected by heavy metals in the soil. Plants have different strategies for uptake, distribution or redistribution of elements, which allow them to maintain stability of the inner environment (homeostasis). It is known that plants increase solubility and mobility of elements such as iron due to easier and better uptake of them, which could proceed via roots and/or leaves (Fig. 1).
The transport of heavy metals inside a plant is affected by number of various mechanisms (Fig. 1). A cell wall is the first barrier against heavy metals entering to plant cell. There heavy metals can be bound by various types of chemicals, first of all, by polysaccharide substances (pectin etc.). Based on the current accepted opinion these interactions are not directly regulated [16]. As for transport of heavy metals into a cell, the changes of H+ concentration could be responsible for passing of a heavy metal through cytoplasmic membrane. This mechanism is strictly controlled by transferring channels, which consume energy and/or use ions gradient. The passing of the metal ions through the membranes can also depend on a presence of carboxylic acids (citric or malic acids) and others substances able to chelate the ions. Besides passing of heavy metals through cytoplasmic membrane into a cell, movement of heavy metals in whole plant is not clear yet. Likely, redistribution of heavy metals occurs via xylem or phloem (Fig. 1). Further, plant has a very few possibilities to excrete heavy metals as follows: a) exudation of heavy metals via roots, b) deposition of them to trichomes and c) to “the oldest” leaves. It clearly follows from these facts that a plant attempts to transport heavy metals on places where they do not menace yet (Fig. 1). The ways of maintaining of heavy metal homeostasis in plants have been reviewed by Clemens [17], Clemens and Simm [18], di Toppi [19] and Cobbett [20].

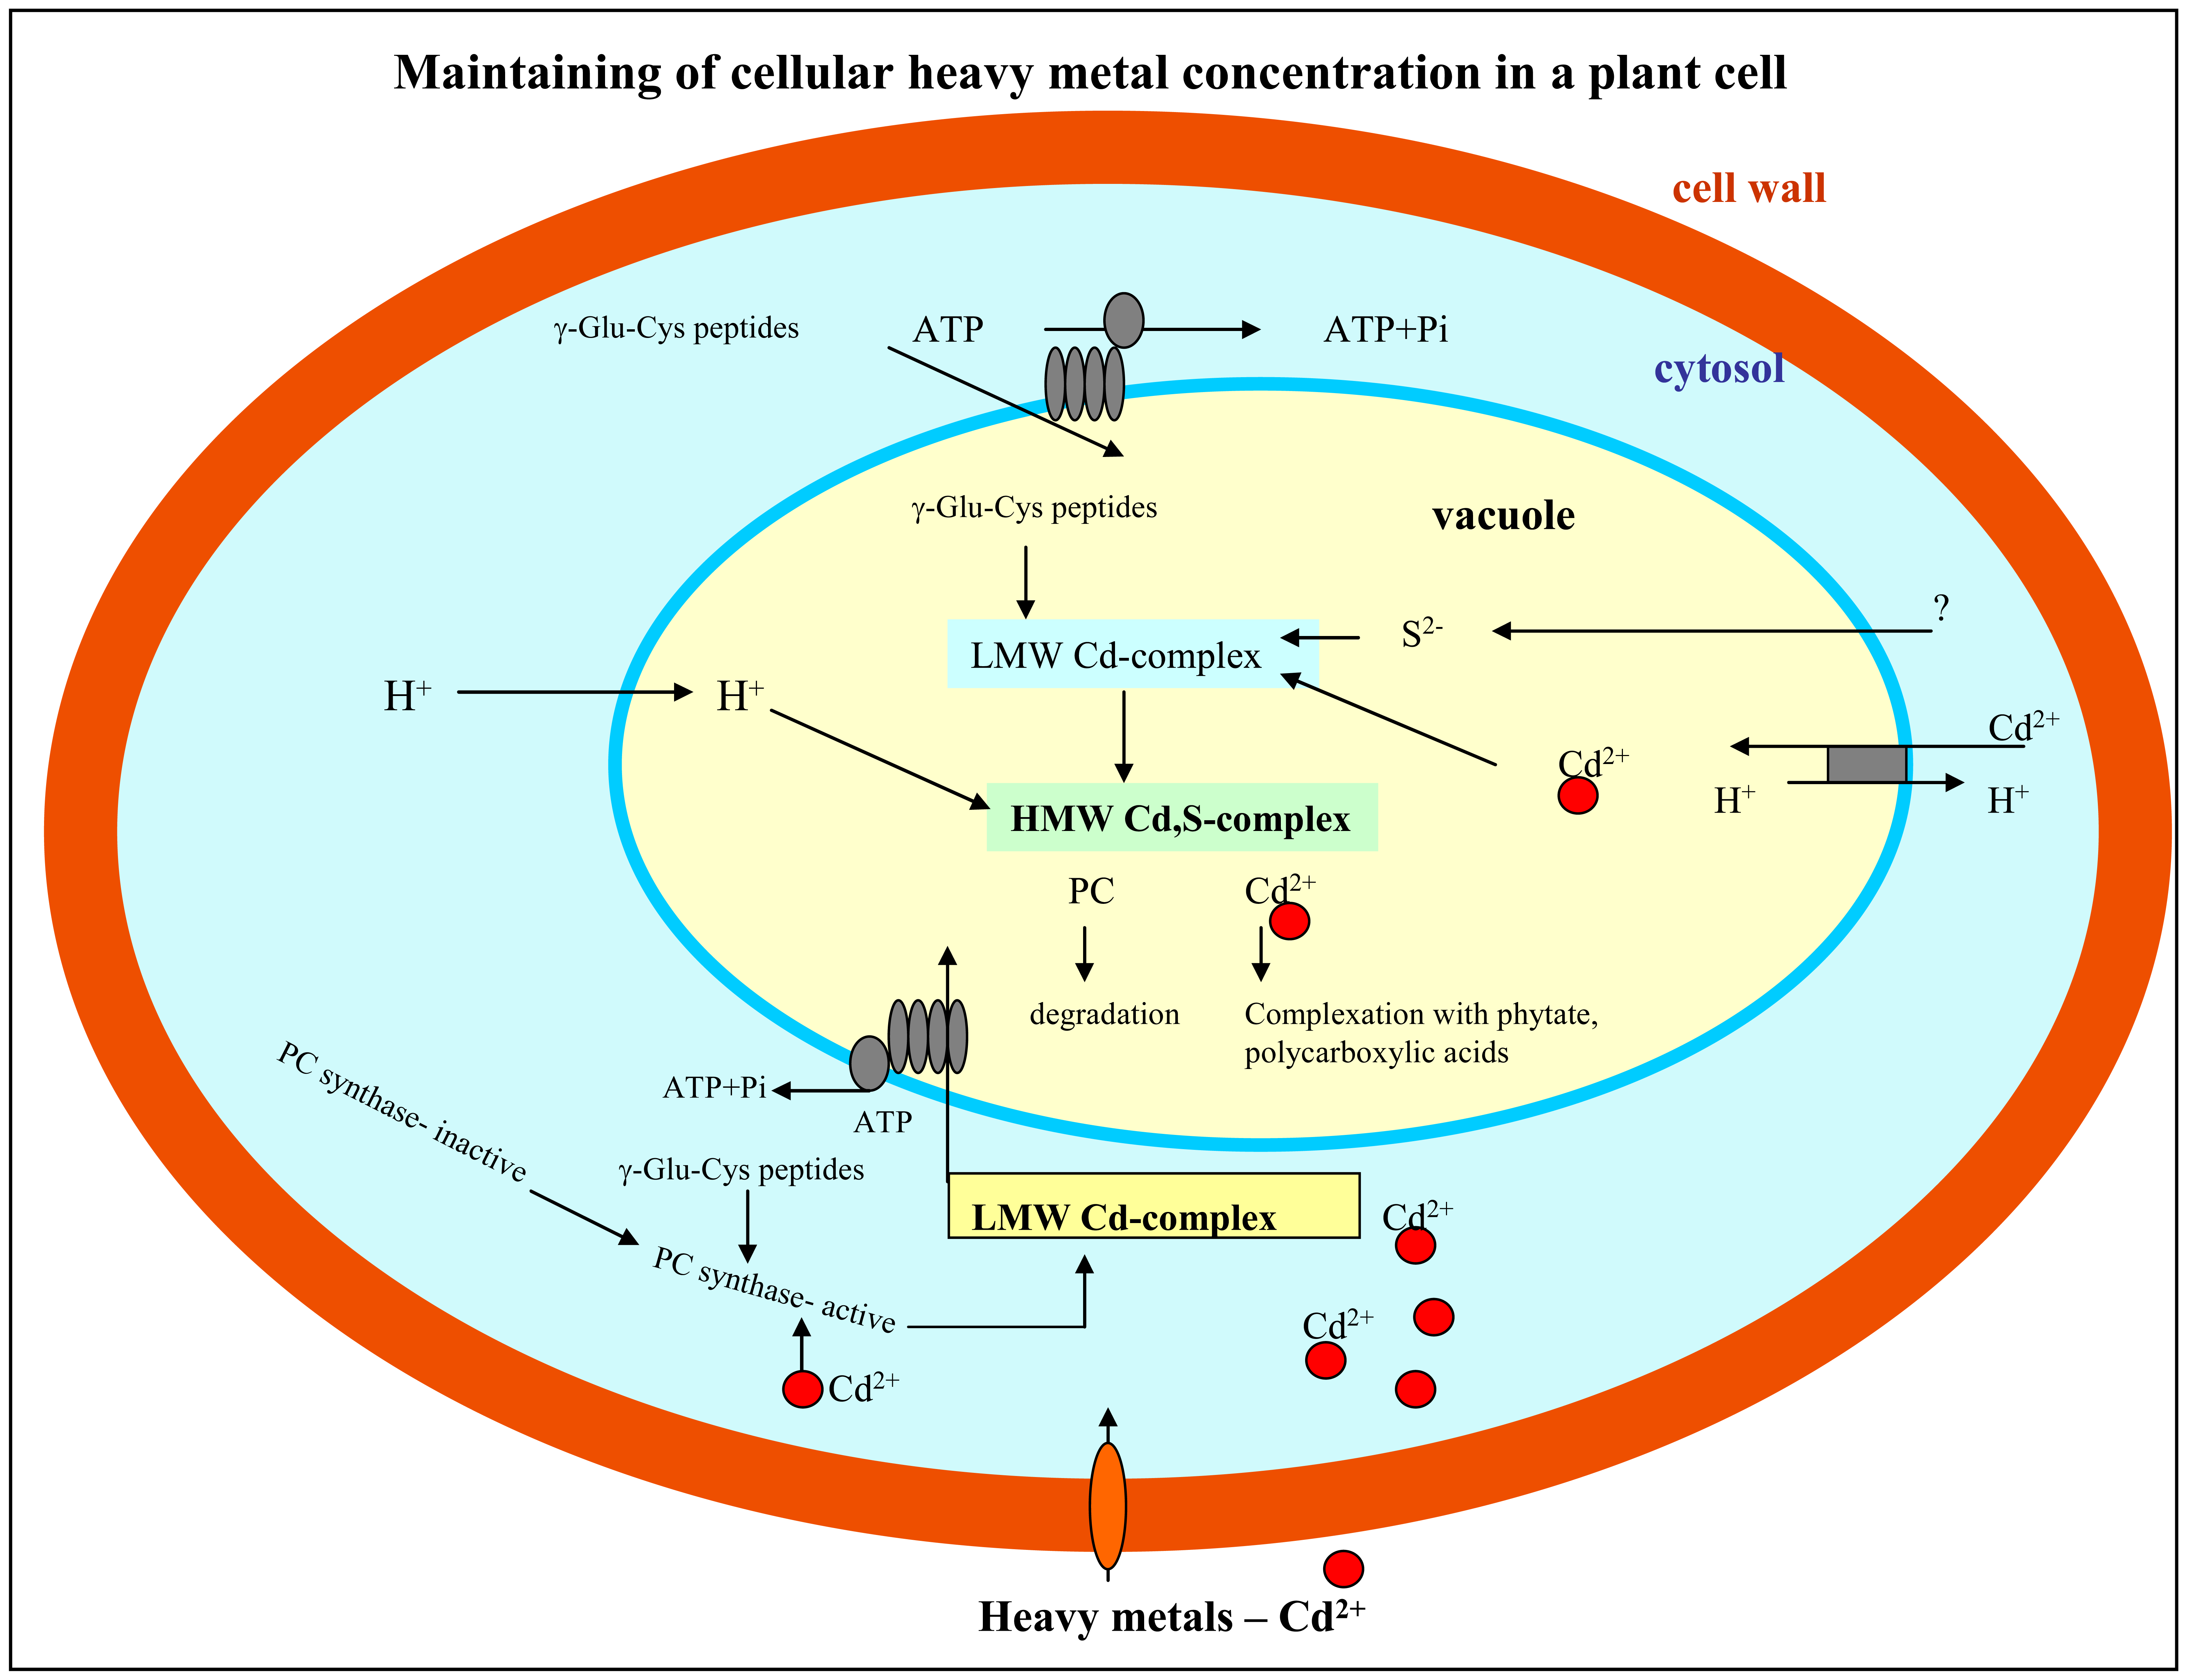
1.2 Response of plant cells on the presence of heavy metals

When heavy metals pass through the cytoplasmic membrane, they can be bound by sulphur rich compounds – metallothionein like proteins, reduced glutathione and phytochelatins (PC), which are present in a cytoplasm. GSH belongs to the most abundant intracellular thiol-peptides, reaching up to 10-3 molar concentrations in certain tissues and organelles [21,22]. As an important antioxidant, GSH plays a role in the detoxification of a variety of electrophilic compounds and peroxides via catalysis by glutathione S-transferases and glutathione peroxidases [23-25]. In addition, GSH is highly reactive and is often found conjugated to other molecules via its sulfhydryl moiety such as NO (S-nitrosoglutathione) [26-28]. The synthesis of GSH from its constituent amino acids, L-glutamate, L-cysteine, and L-glycine, involves two ATP-requiring enzymatic steps [29]. GSH serves several vital functions, including 1) detoxifying electrophiles; 2) maintaining the essential thiol status of proteins by preventing oxidation of -SH groups or by reducing disulfide bonds induced by oxidative stress; 3) scavenging free radicals; 4) providing a reservoir for cysteine; and 5) modulating critical cellular processes such as DNA synthesis, microtubular-related processes, and immune function [29,30]. Moreover GSH can be used for synthesis of phytochelatins (a basic formula (γ-Glu-Cys)n-Gly (n = 2 to 11)) participating in the detoxification of heavy metals at plants, because they have the ability to bind heavy metal ions via SH groups of cysteine units and consequently transport them to vacuole, where an immediate toxicity does not menace yet [31-35]. Complex of PC and a metal ion is called as low molecular weight metal-phytochelatin complex (LMW M-PC). After transporting of this complex through tonoplast to vacuole low molecular complex is transformed to high molecular weight M-PC complex (HMW M-PC) via –S–S– groups. The scheme of detoxification of cadmium in a plant cell is shown in Fig. 2.
The synthesis PC itself involves the transpeptidation of the γ-Glu-Cys moiety of GSH onto initially a second GSH molecule to form PC2 or, in later stages of the incubation, onto a PC molecule to produce an n + 1 oligomer (Fig. 2). The reaction is catalyzed by γ-Glu-Cys dipeptidyl transpeptidase (EC 2.3.2.15), which has been called as phytochelatin synthase [20,31,36]. In vitro the purified enzyme was active only in the presence of metal ions. Cadmium was the best activator of phytochelatin synthase followed by Ag, Bi, Pb, Zn, Cu, Hg, and Au cations (Fig. 2).

1.3 Analytical instruments used to study of thiols

Several high-performance liquid chromatographic (HPLC) methods applying different detection systems, UV-Vis or fluorescent detector [37-41], electrochemical (ECD) [42-54] and mass spectrometric (MS) [43,55-59] detectors, have been developed for the determination of thiols. Nuclear magnetic resonance, mass spectrometry and other robust analytical techniques can be used for study of interactions of the thiols with metals, however, the high concentrations required for most of the standard techniques of structural determination hinder a more exhaustive study of the geometry of metal–PC complexes [60]. Among of these robust analytical techniques, electrochemical detection (ED) is an attractive alternative method for heavy metal detection, because of its inherent advantages of simplicity, ease of miniaturization, high sensitivity and relatively low cost. Polarographic and voltammetric techniques, especially in pulse mode, have proved to be useful tools not only for the qualitative study of the heavy metal complexes with PC or GSH [61-68], since they provide different signals for the free peptide, the free metal ion and the metal bound in different chemical environments, but also for direct detection of thiols [69-82].

1.4 The aims

In the present work, we aimed on utilizing of various electroanalytical techniques to analyse plant thiols. Primarily, we investigated interactions of GSH and PC2 with cadmium(II) ions using both stationary and flow electrochemical techniques. Further, we revealed the effect of three different cadmium concentrations (0, 10 and 100 μM) on growth of maize plants during 192 hours long experiments. Particularly, we determined changes in cadmium concentration in treated maize plants by differential pulse anodic stripping voltammetry and thiol content by high performance liquid chromatography with electrochemical detection.

2. Experimental

2.1 Chemicals

All analytical reagents of ACS purity were purchased from Sigma Aldrich Chemical Corp. (St. Louis, USA). Murashige-Skoog medium was purchased from Duchefa BV (Netherlands) and its pH was adjusted on 9.2. Phytochelatin (γ-Glu-Cys)2-Gly (PC2) was synthesized in Clonestar Biotech; purity over 90 % (Brno, Czech Republic). Solutions were prepared using deionised ACS water (Sigma). The stock standard solutions of reduced and oxidized glutathione, phytochelatins and thiosalicylic acid (TSA) at 1 mg.ml-1 were prepared with ACS water and stored in the dark at -20 °C. The working standard solutions were prepared daily by dilution of the stock solutions with ACS water and stored in the dark at the temperature of -4 °C. The pH value was measured using WTW inoLab (MultiLab Pilot; Weilheim, Germany), controlled by the personal computer program (MultiLab Pilot; Weilheim, Germany). The pH-electrode (SenTix-H, pH 0–14/3M KCl) was regularly calibrated by set of WTW buffers (Weilheim, Germany). All solutions were filtered through a 0.45 μm Teflon membrane filters (MetaChem, Torrance, USA) prior to HPLC separations.

2.2 Electrochemical measurement

Electrochemical measurements were performed with AUTOLAB Analyser (EcoChemie, Netherlands) connected to VA-Stand 663 (Metrohm, Switzerland), using a standard cell with three electrodes. A hanging mercury drop electrode (HMDE) with a drop area of 0.4 mm2 was used as working electrode, an Ag/AgCl/3M KCl electrode as referent ones and a graphite electrode as the auxiliary electrode. For smoothing and baseline correction the software GPES 4.4 supplied by EcoChemie was employed.

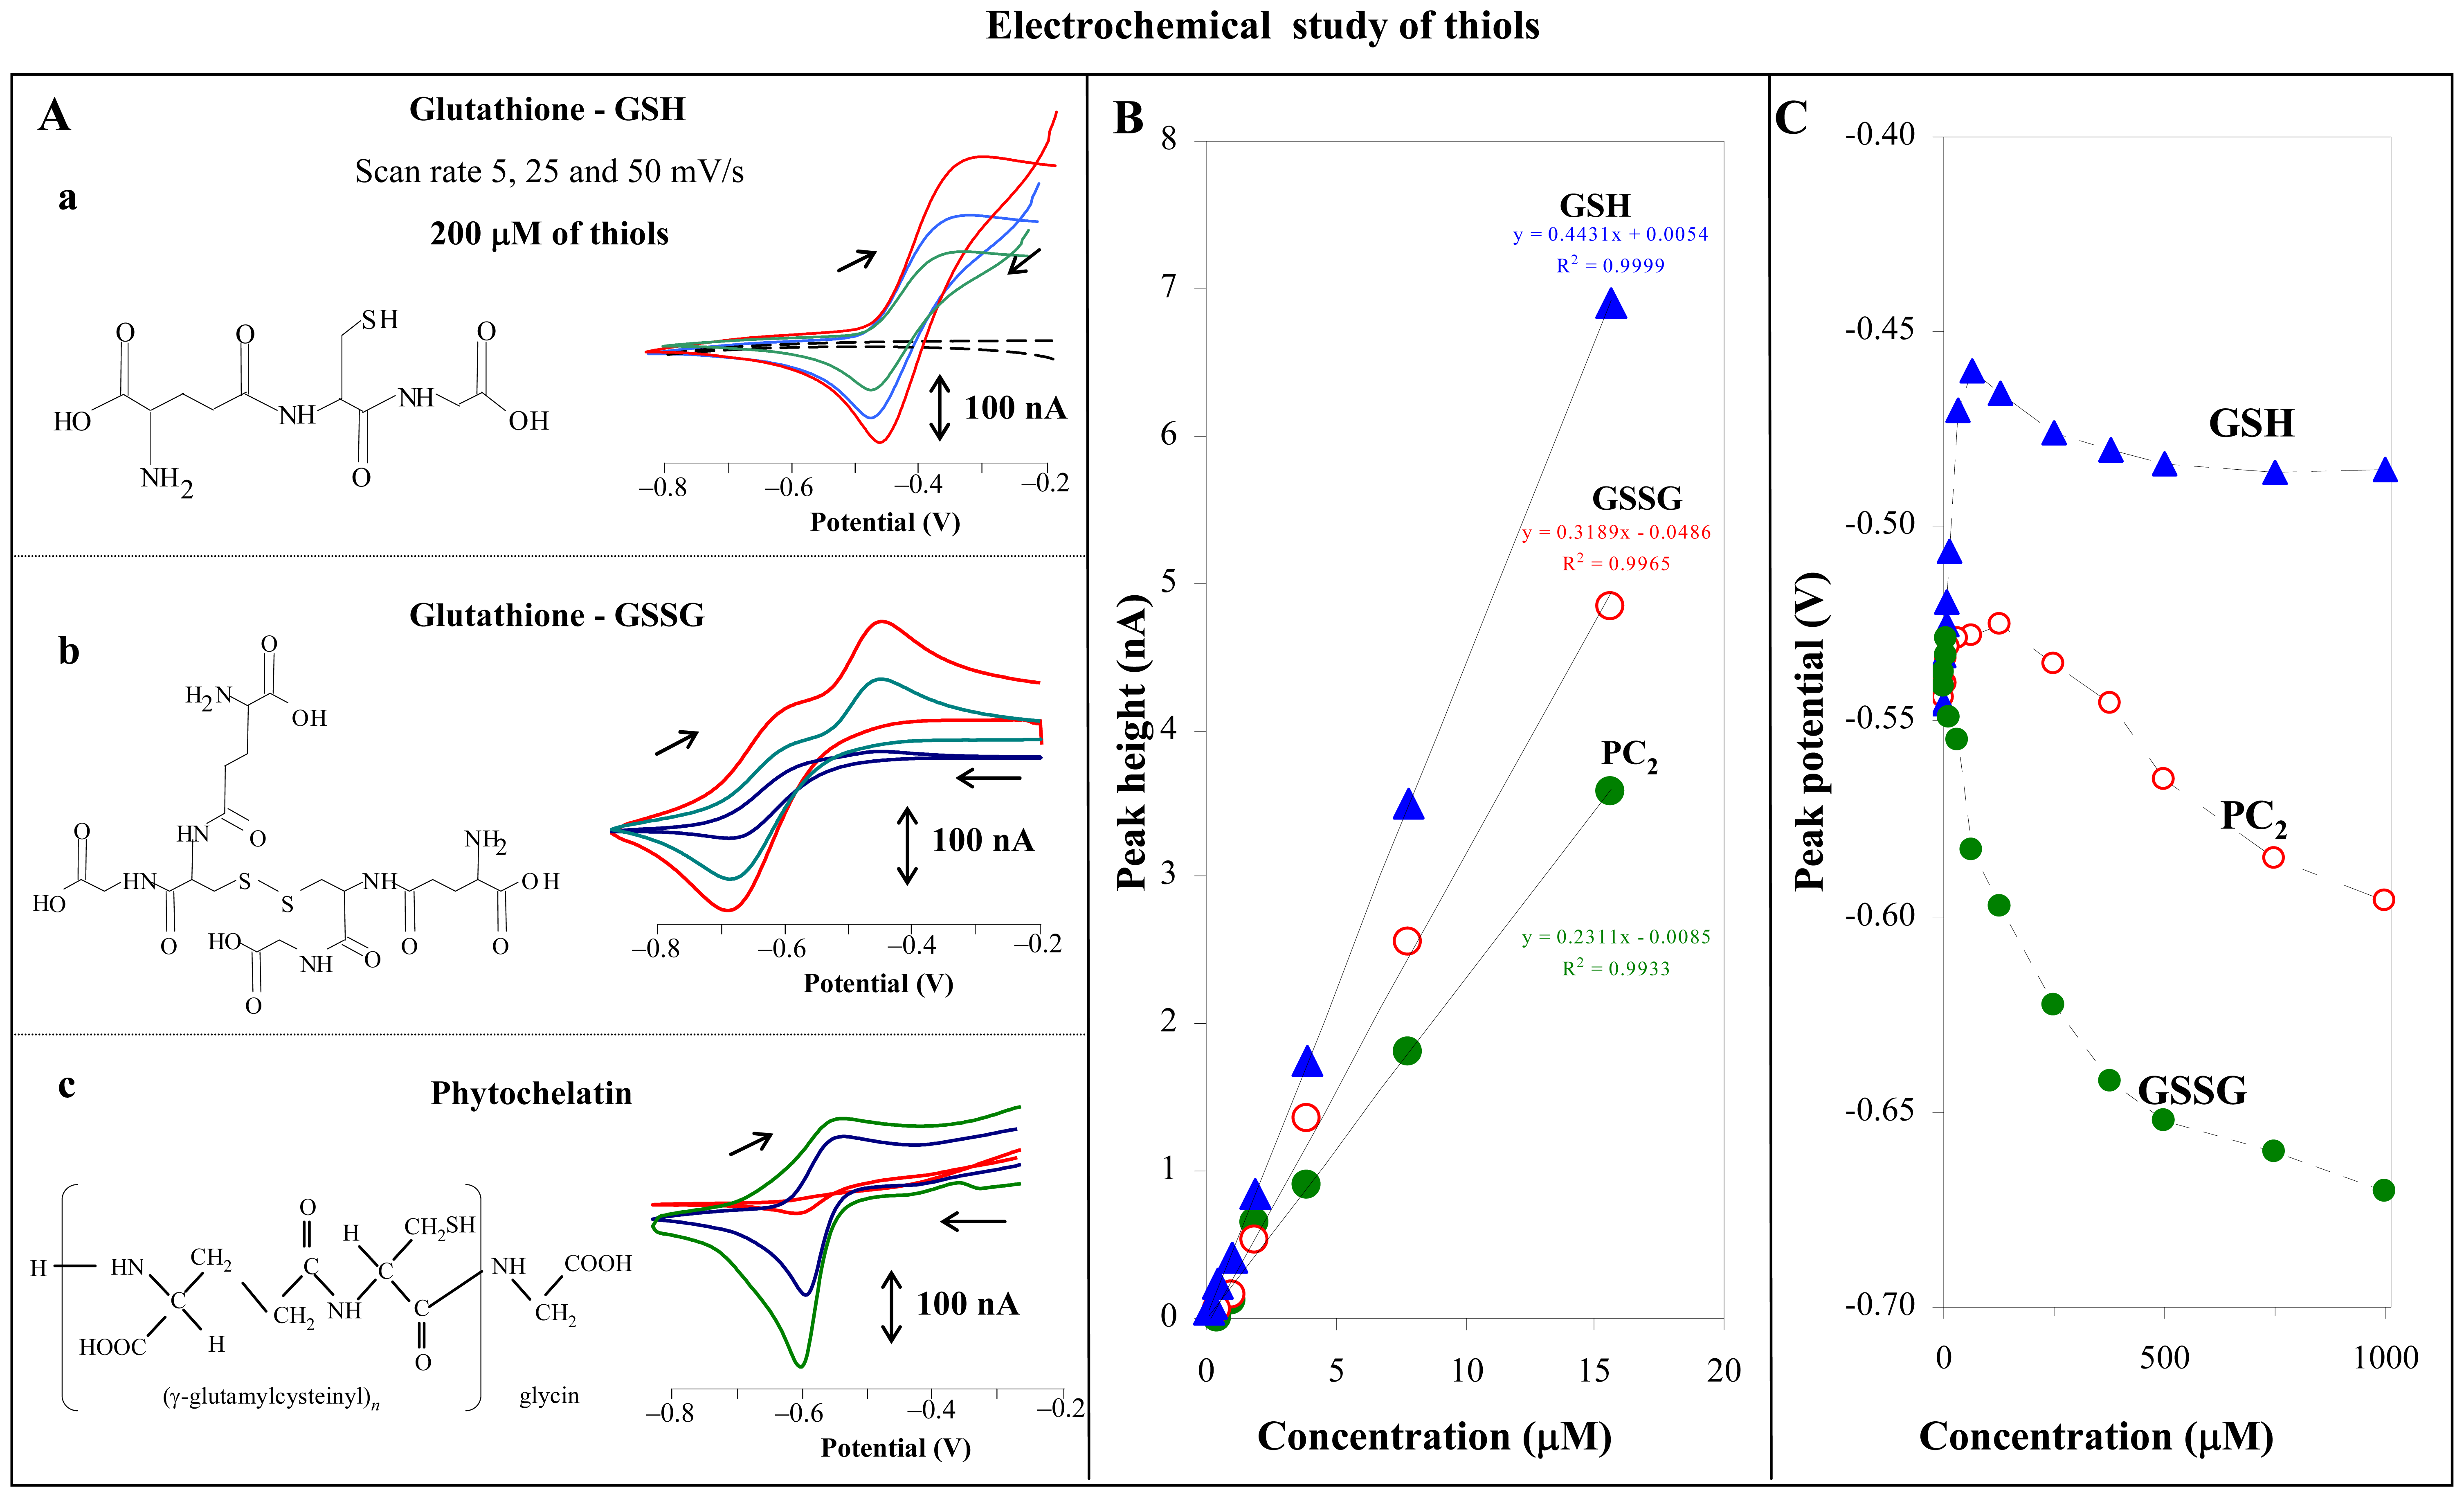
2.3 Cyclic voltammetry of thiols

The GSH, GSSG and PC2 were measured using cyclic voltammetry. The supporting electrolyte (0.05 M sodium tetraborate, pH 9.2) was used. CV parameters were as follows: the initial potential of –0.2 V, the end potential –0.8 V and step potential 5 mV. The samples of the GSH were reduced before each measurement by 1 mM tris(2-carboxyethyl)phosphine addition according to [45].

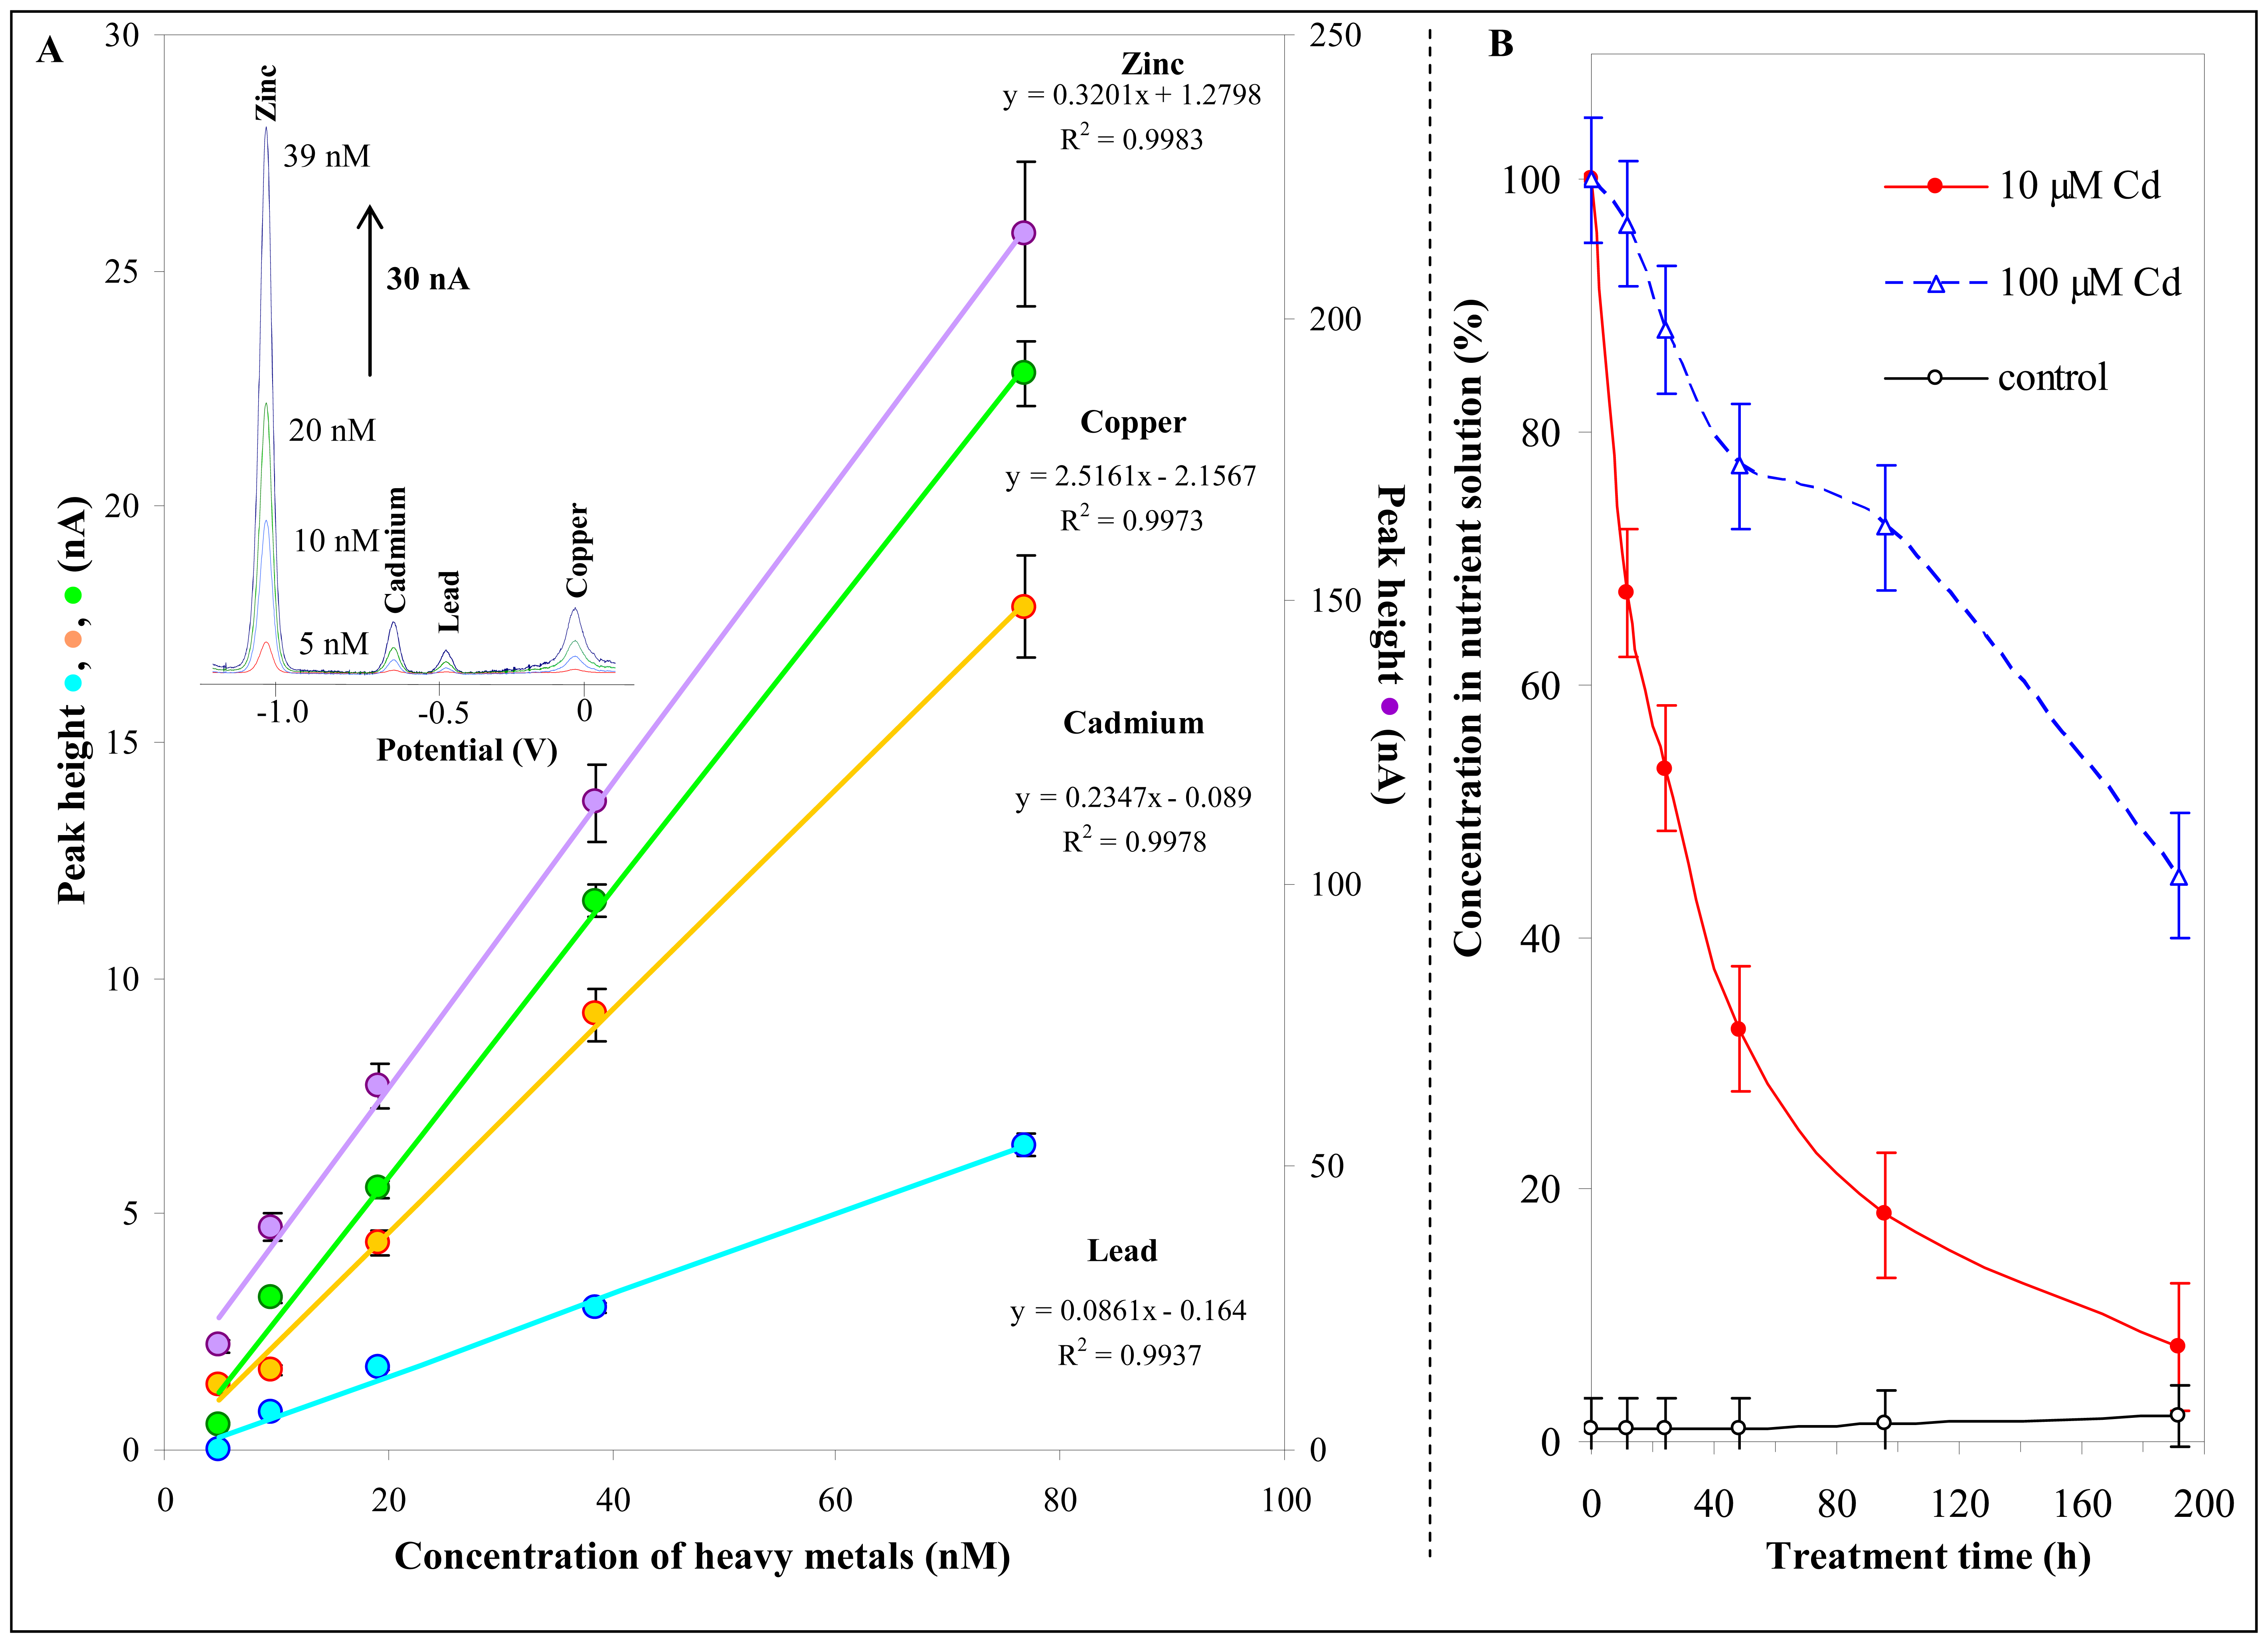
2.4 Differential pulse anodic stripping voltammetry of cadmium(II) ions

Acetate buffer pH 5.6 (0.2 M CH3COOH + 0.2 M CH3COONa) was used as a supporting electrolyte. The homogenized samples of maize plants and diluted samples of nutrient solution were deoxygenated prior to measurements by purging with argon (99.999%) saturated with water for 10 min. In addition, samples of nutrient solution were diluted in ratio of 1:100 (v/v) by acetate buffer (pH 5.6). Cadmium concentration was measured by differential pulse anodic stripping voltammetry (DPASV). The cadmium was deposited on HMDE at potential –0.7 V. During the deposition process (accumulation time 60 s) the solution was stirred at 1450 rpm at room temperature. The scan was initialised at –0.7 V and stopped at 0.0 V. The step potential 5 mV, modulation amplitude 0.05 mV and time interval 0.26 s were used.

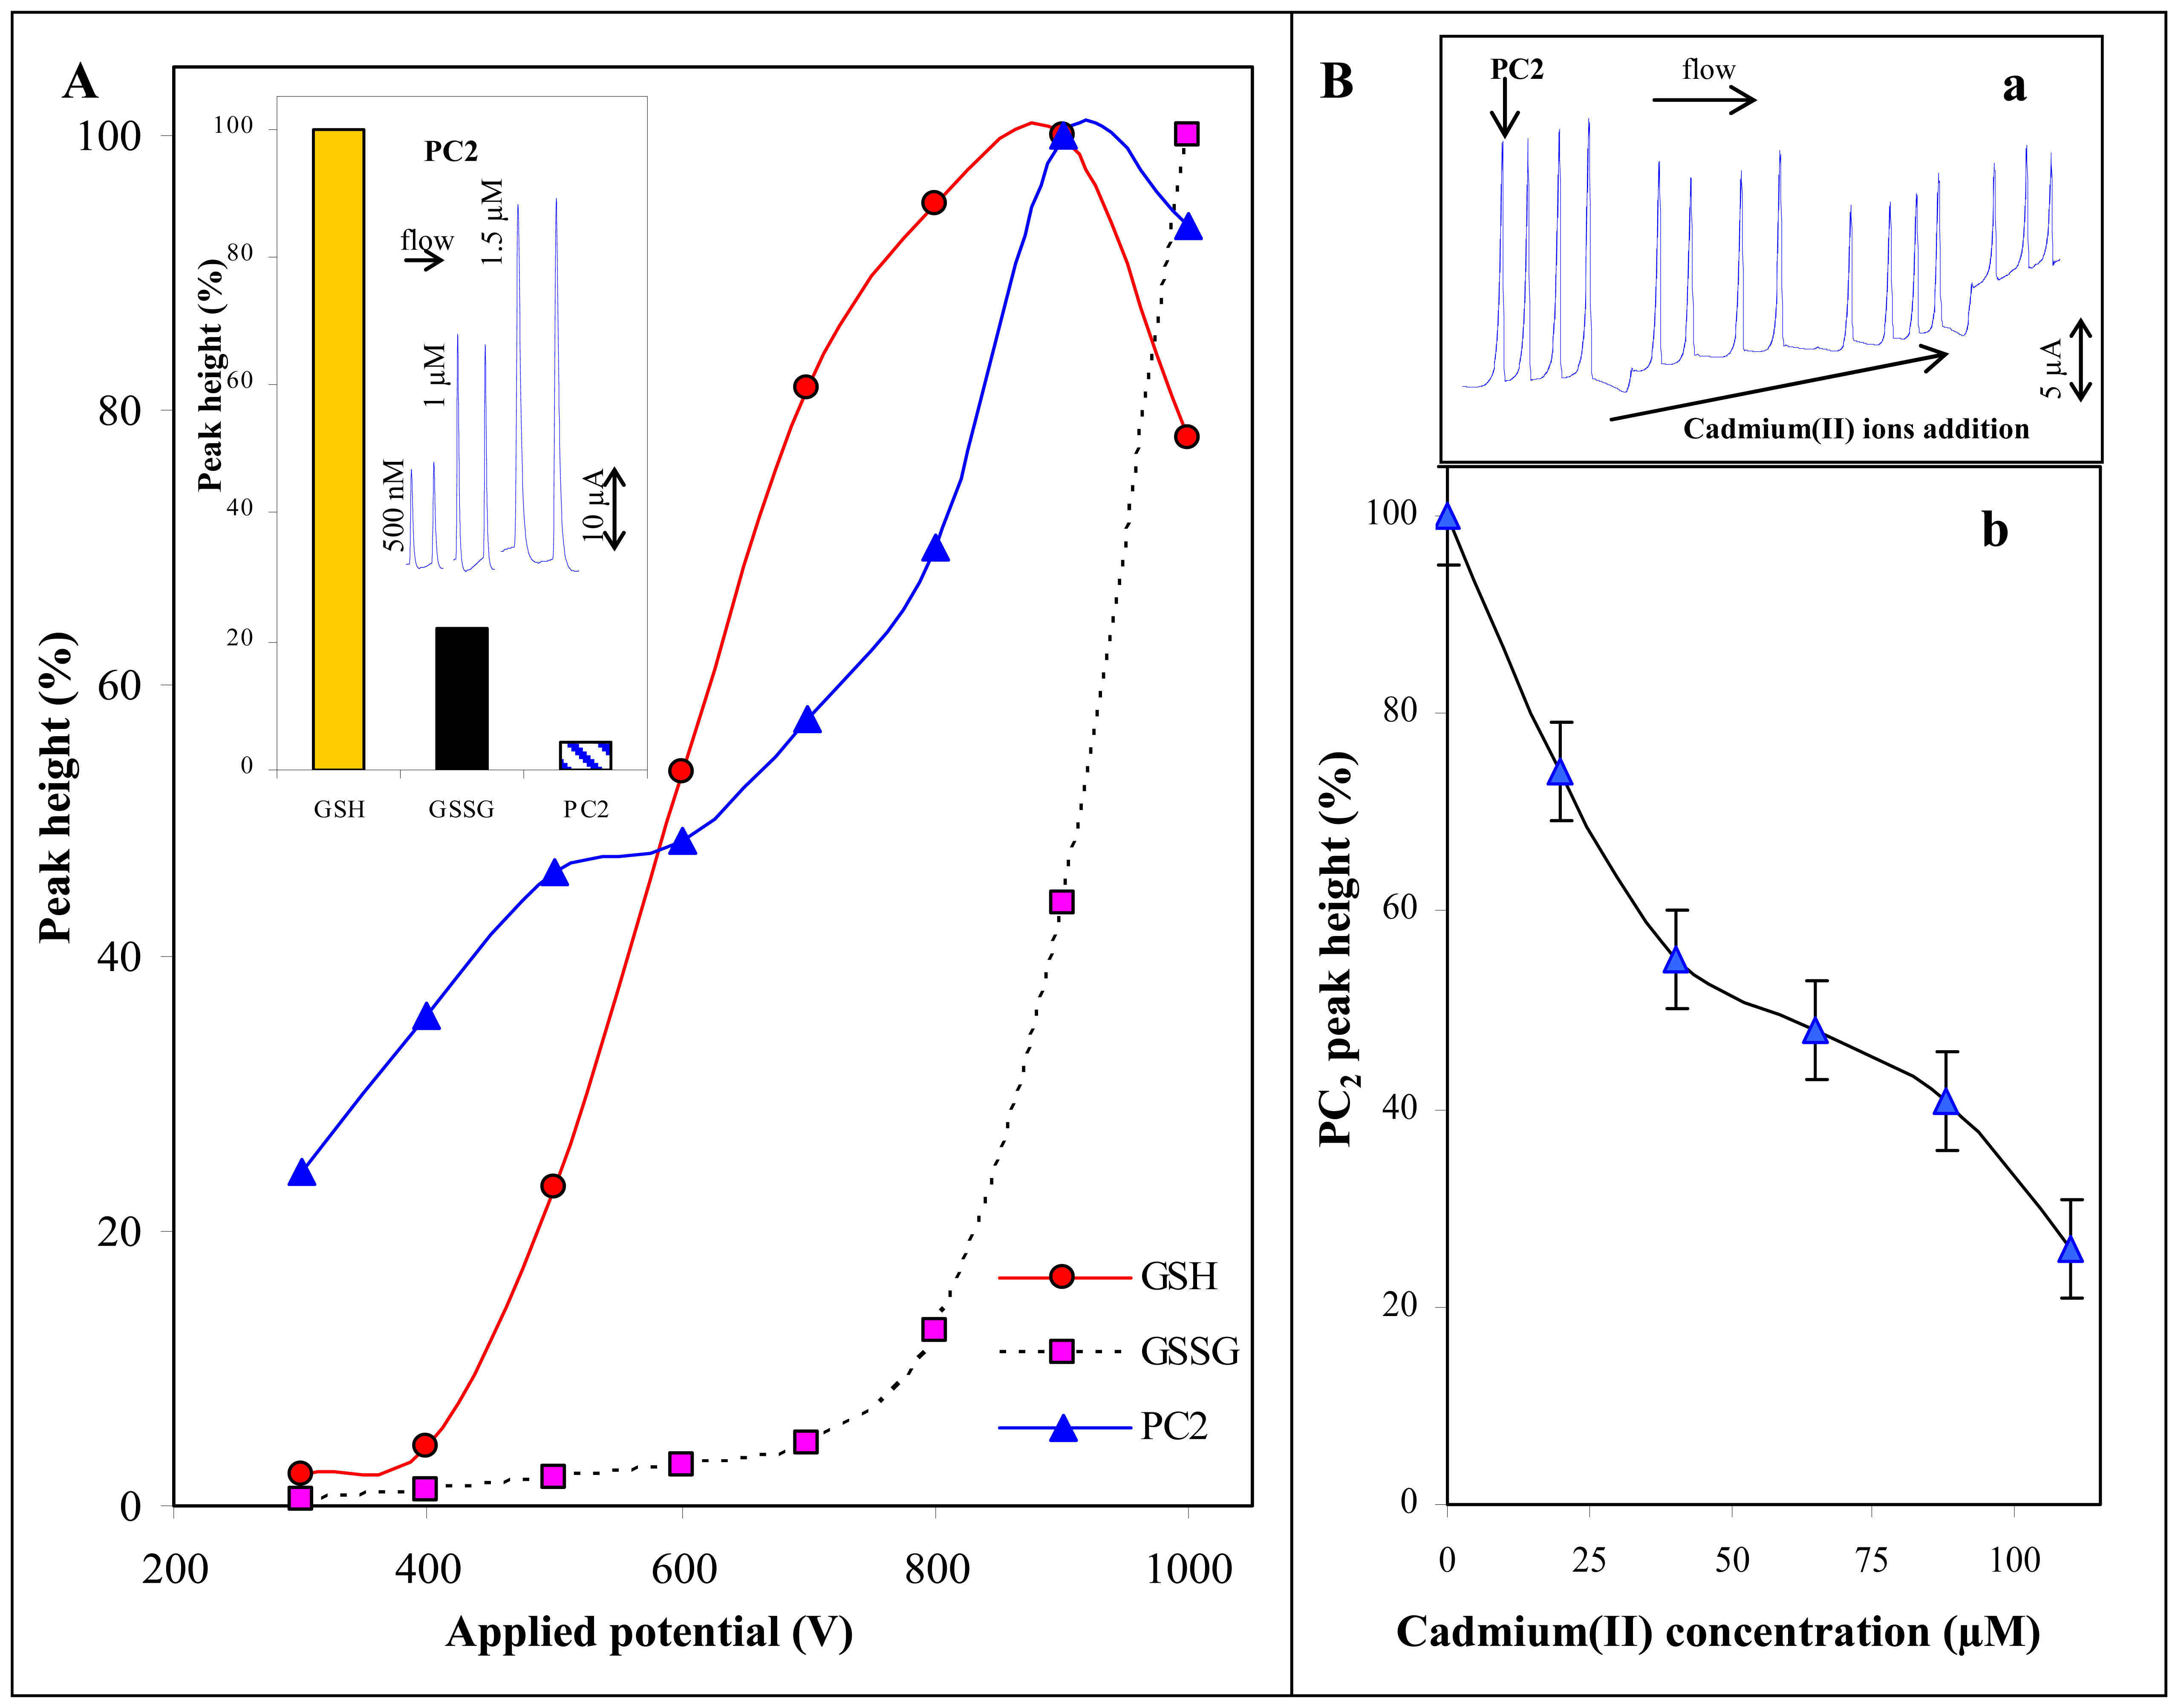
2.5 Flow injection analysis coupled with CouloChem III electrochemical detector

A flow injection analysis with electrochemical detection (FIA-ED) system consisted of solvent delivery pump operating in range of 0.001-9.999 ml/min (Model 583 ESA Inc., Chelmsford, MA, USA), a guard cell (Model 5020 ESA, USA), a reaction coil (1 m) and an electrochemical detector. The electrochemical detector (ED) includes one low volume flow-through analytical cell (Model 5040, ESA, USA), which consists of a glassy carbon working electrode, a reference palladium electrode and an auxiliary carbon electrode, and CouloChem III as a control module. The obtained data were treated by CSW 32 software (Version 1.2.4, Data Apex, Czech Republic). The experiments were carried out at room temperature. Guard cell potential was 0 V. Britton-Robinson buffer (pH = 2.0) was used as the mobile phase. The sample (5 μl) was injected manually.
A glassy carbon electrode was polished mechanically by 0.1 μm of alumina (ESA Inc., USA) and sonicated at the laboratory temperature for 5 min using a Sonorex Digital 10 P Sonicator (Bandelin, Berlin, Germany) at 40 W.

2.6 High performance liquid chromatography coupled with CoulArray electrochemical detector

A high performance liquid chromatography with electrochemical detection (HPLC-ED) system consisted from two solvent delivery pumps operating in the range of 0.001-9.999 ml.min-1 (Model 582 ESA Inc., Chelmsford, MA), a Metachem Polaris C18A reversed-phase column (150.0 × 2.1 mm, 5 μm particle size; Varian Inc., CA, USA) and a CoulArray electrochemical detector (Model 5600A, ESA, USA). The electrochemical detector includes two flow cells (Model 6210, ESA, USA). Each cell consists of four analytical cells containing working carbon porous electrode, two auxiliary and two reference electrodes. Both the detector and the reaction column were thermostated. The sample (5 μl) was injected manually. Thiosalicylic acid (TSA) was used as internal standard for determination the thiol compounds. HPLC-ED conditions as follows – mobile phase: 80 mM trifluoroacetic acid and methanol with a gradient profile starting at 97:3 (TFA:methanol) kept constant for first 8 min, then decreasing to 85:15 during one minute and kept constant for 8 min, and finally increasing linearly up to 97:3 from 17 to 18 min. Flow rate 0.8 ml.min-1, column and detector temperature 25 °C and electrode potential 900 mV were set [44,47].

2.7 Plant material

Maize (Zea mays L.) F1 hybrid Gila was used in our experiments. Maize kernels germinated on wet filter paper in the vessels at 23 ± 2 °C in the dark. When the roots reached approximately 2 cm, the twenty five seedlings were placed into vessels contained 8 l modified aerated Richter′s nutrient solution [83]. The concentrations of macroelements per 1 l were 0.5 g Ca(NO3)2, 0.2 g KNO3, 0.2 g KH2PO4, 0.25 g MgSO4.7 H2O [83]. Iron in the form of Fe-EDTA was added to the nutrient solution (10 mg Fe per 1 l). Microelements were added to the nutrient solution in the form of Hoagland′s AZ solution [84]. Plants were cultivated in a greenhouse in April 2006, in daylight (maximal light intensity was about 200 μEm-2s-1), at a temperature 23.5–25 °C and humidity 71–78 % (Fig. 3A). After 14 days, when the plants had developed five leaves, CdCl2 was added to the nutrient solution at a final concentration of 10 or 100 μM, respectively. Plants cultivated without the presence of CdCl2 served as a control. The maize plants placed in the vessels that contained modified aerated Richter′s nutrient solution with addition of CdCl2 (0, 10 and 100μM) were cultivated during the time of 192 hours. Ten plants were harvested at certain time intervals (0, 24, 48, 96 and 192 h) during the experiment and its roots were rinsed (three times) in distilled water and 0.5 M EDTA. In addition, each harvested plant was divided into leaves, shoot and root (Fig. 3B). Five plants were used for the determination of GSH content and fresh weight and another five plants were used for the determination of dry weight and cadmium concentration.

2.8 Sample preparation for cadmium determination

Plant parts (0.4 g of fresh plant material) were digested by an ETHOS SEL microwave digestion furnace (Milestone S.r.l, Italy) using a MDR 300/10 module. A three step procedure (i. 120 s, 250 W; ii. 120 s, 0 W (120 °C); iii. 10 min 250 W (180 °C) with addition of 5 ml 65% HNO3 and 3 ml H2O was used. The clear digest was quantitatively transferred into a volumetric flask and diluted up to 25 ml with water.

2.9 Preparation of plant tissues for determination of thiols
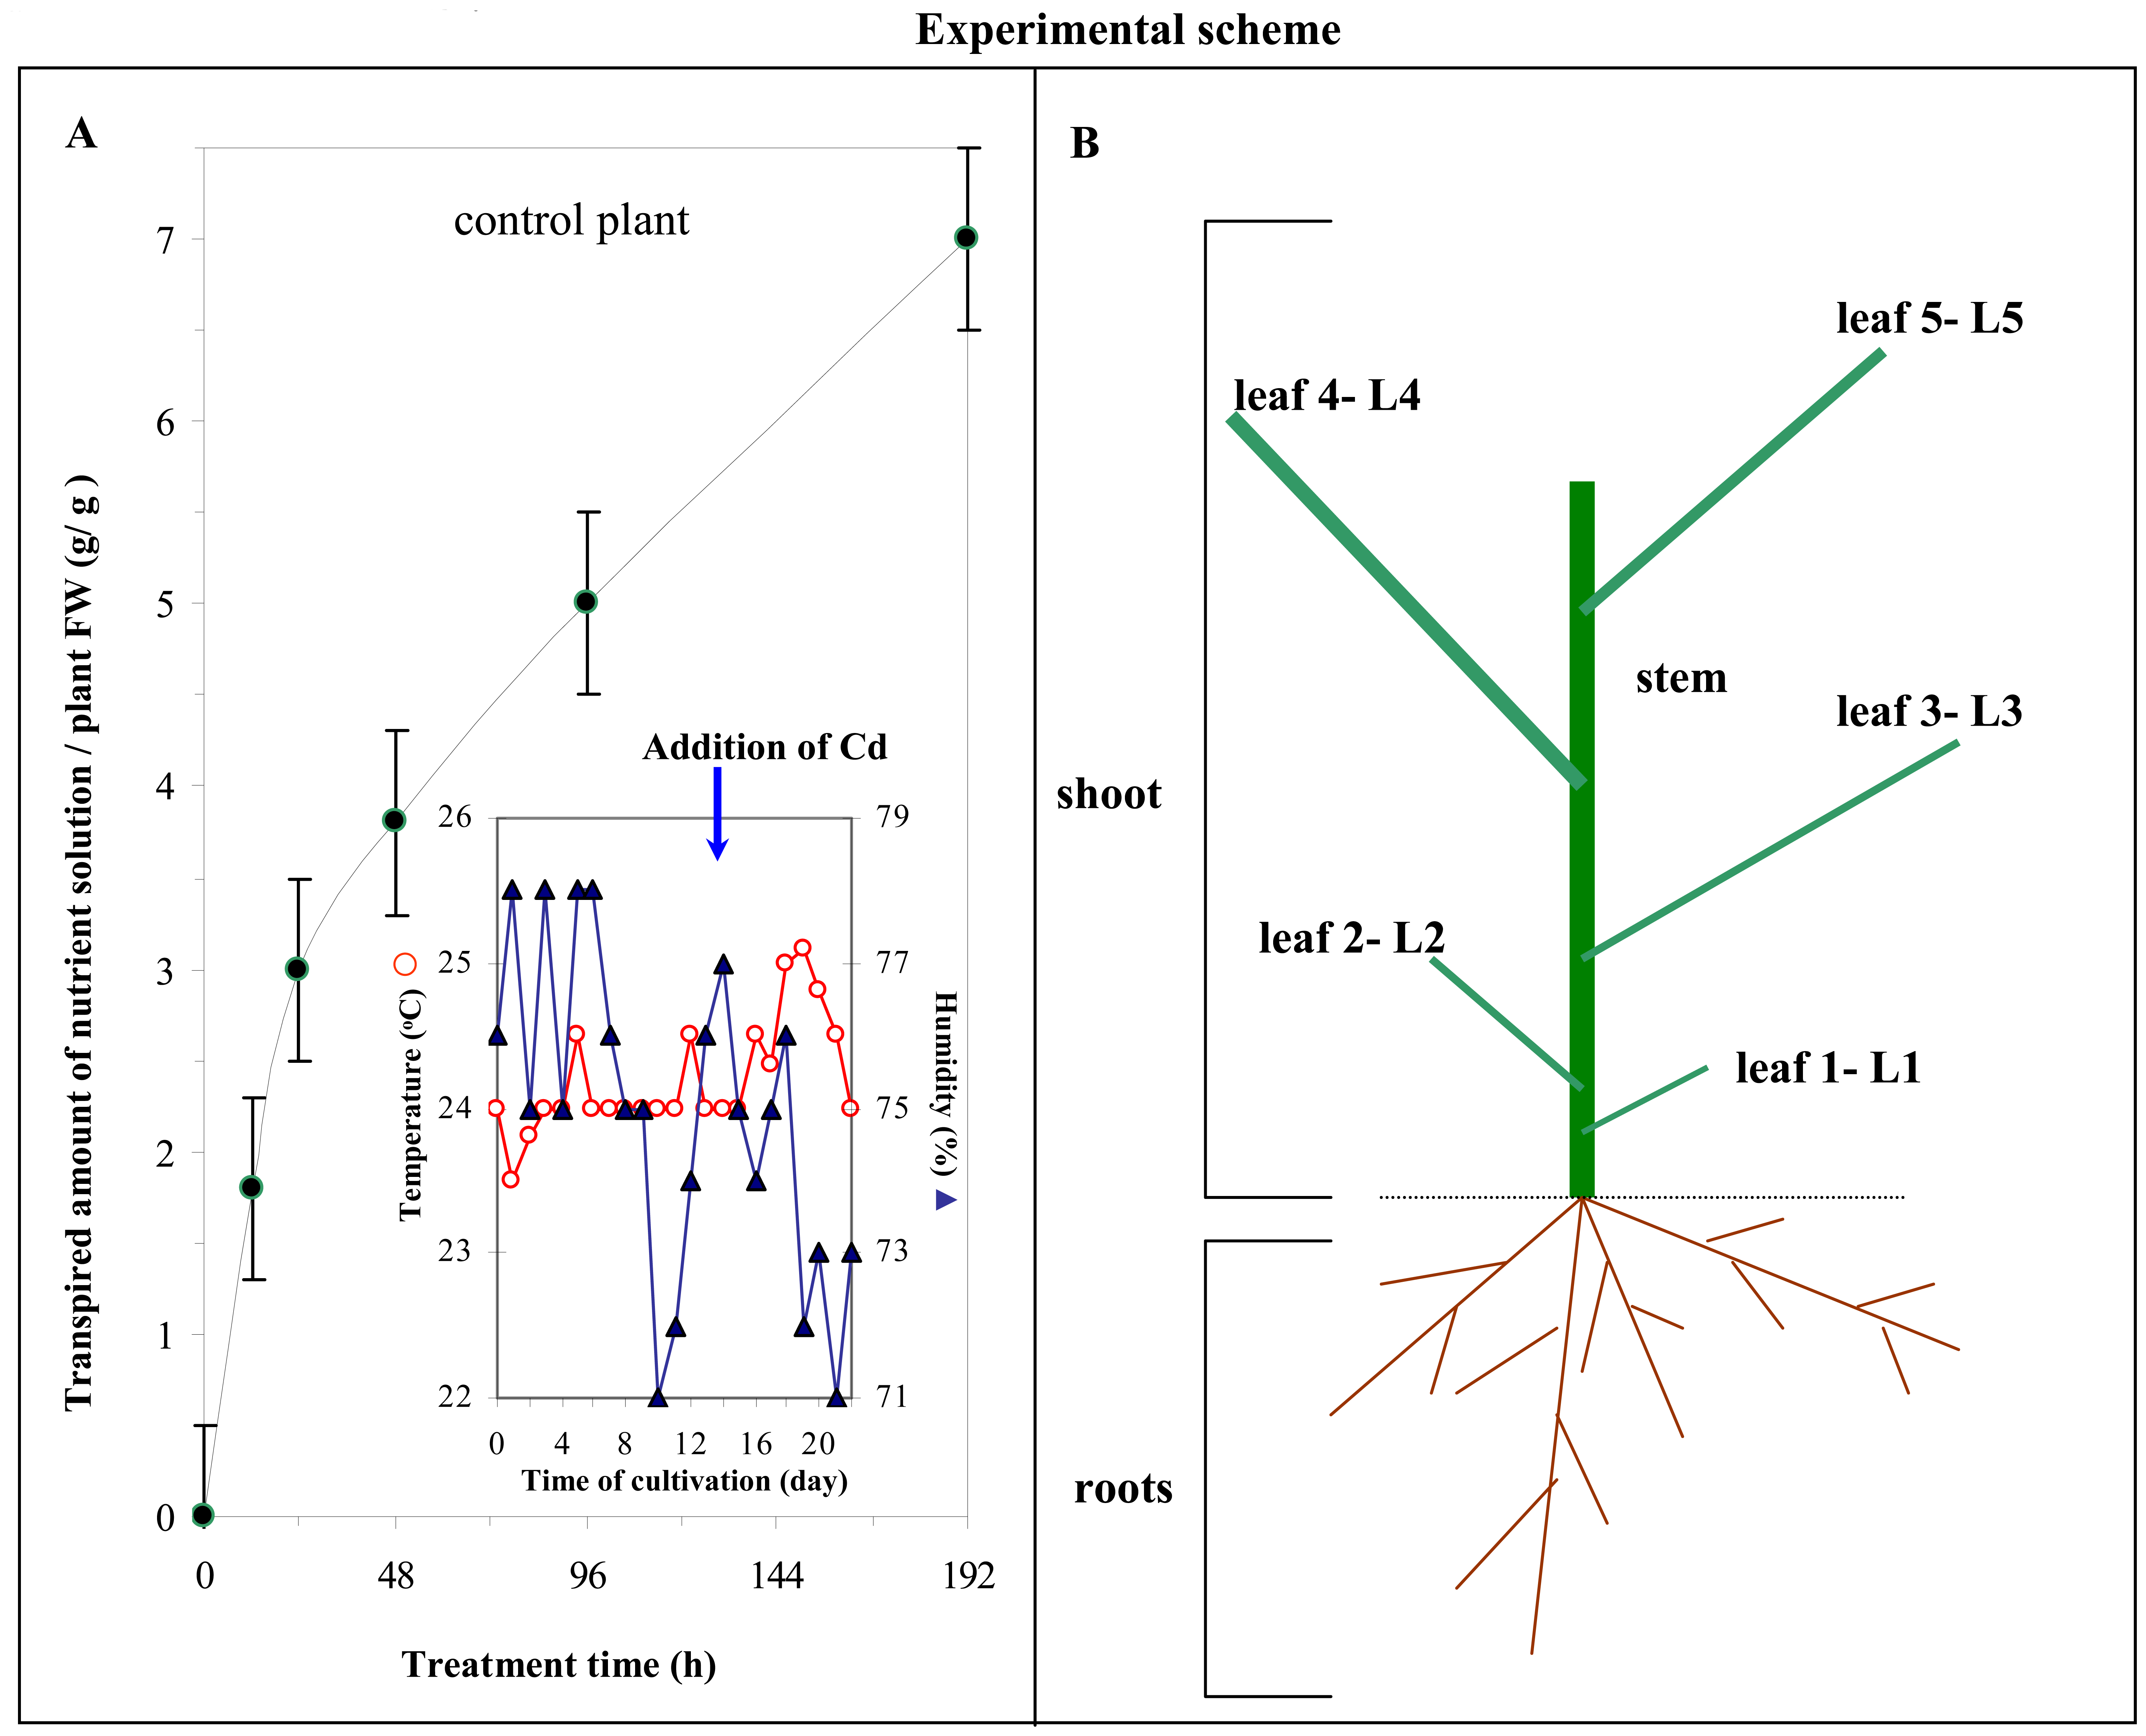
Weighed plant tissues (approximately 0.2 g) were transferred to a test-tube. Then, liquid nitrogen was added to the test-tube, and the samples were frozen. The frozen sample was transferred to mortar and spread for 1 min. Then exactly 1 000 μl of 0.2 M phosphate buffer (pH 7.2) was added to mortar, and the sample was spread for following 5 min. The homogenate was transferred to a new test-tube. The mixture was homogenised by shaking on a Vortex–2 Genie (Scientific Industries, New York, USA) at 4 °C for 30 min. The homogenate was centrifuged (14 000 g) for 30 min at 4 °C using a Universal 32 R centrifuge (Hettich-Zentrifugen GmbH, Tuttlingen, Germany). Before the analysis the supernatant was filtered through a membrane filter (0.45 μm Nylon filter disk, Millipore, Billerica, Mass., USA).

2.10 Transpiration

Transpired amounts of water were determined on the basis of nutrient solution mass decrease and according to the increase of fresh weight of three plants. Sartorius scale was used for measurement of fresh weight. For other details see in Ref. No. [85].

2.11 Statistical analysis

STATGRAPHICS® (Statistical Graphics Corp®, USA) was used for statistical analyses. Results are expressed as mean ± S.D. unless noted otherwise. Differences with p < 0.05 were considered significant.

3. Results and Discussion

Due to increasing production and consumption of plant food it is necessary to control amounts of undesirable chemical compounds. The chemicals come into agro-ecosystem especially from fertilizers, pesticides and industrial toxic products containing heavy metals and toxic organic substances. In addition it is well known that heavy metals markedly influence growth of plants. That is why the study of plant response to heavy metals stress is especially important for the understanding of many biological processes [77,86-88]. Cadmium (Cd) is a toxic nonessential heavy metal that can be taken up by organisms [89]. It has been designated as a human carcinogen and in some cases a potent multitissue animal carcinogen [89]. In plants Cd is also recognized to be one of the most phytotoxic metal pollutants. An excess of Cd typically causes a number of hallmarks of heavy metal poisoning, such as growth retardation, leaf chlorosis, changes of enzyme activities, altered stomatal function etc. [90]. Moreover, Cd itself can affect photosynthesis, transpiration and nutrient accumulation. Its presence in plant cell could also trigger programmed cell death [87,91,92]. Transport of Cd through plant organism may be influenced by different factors, such as transpiration [85], plant chelators [31,93] and Cd uptake by the roots [86,94]. The molecular mechanisms of Cd toxicity are not precisely known but SH-groups of proteins and competition with Ca2+ ions are two possible targets of Cd2+ ions in cells [95].

3.1 Investigation of interaction between heavy metals and thiols

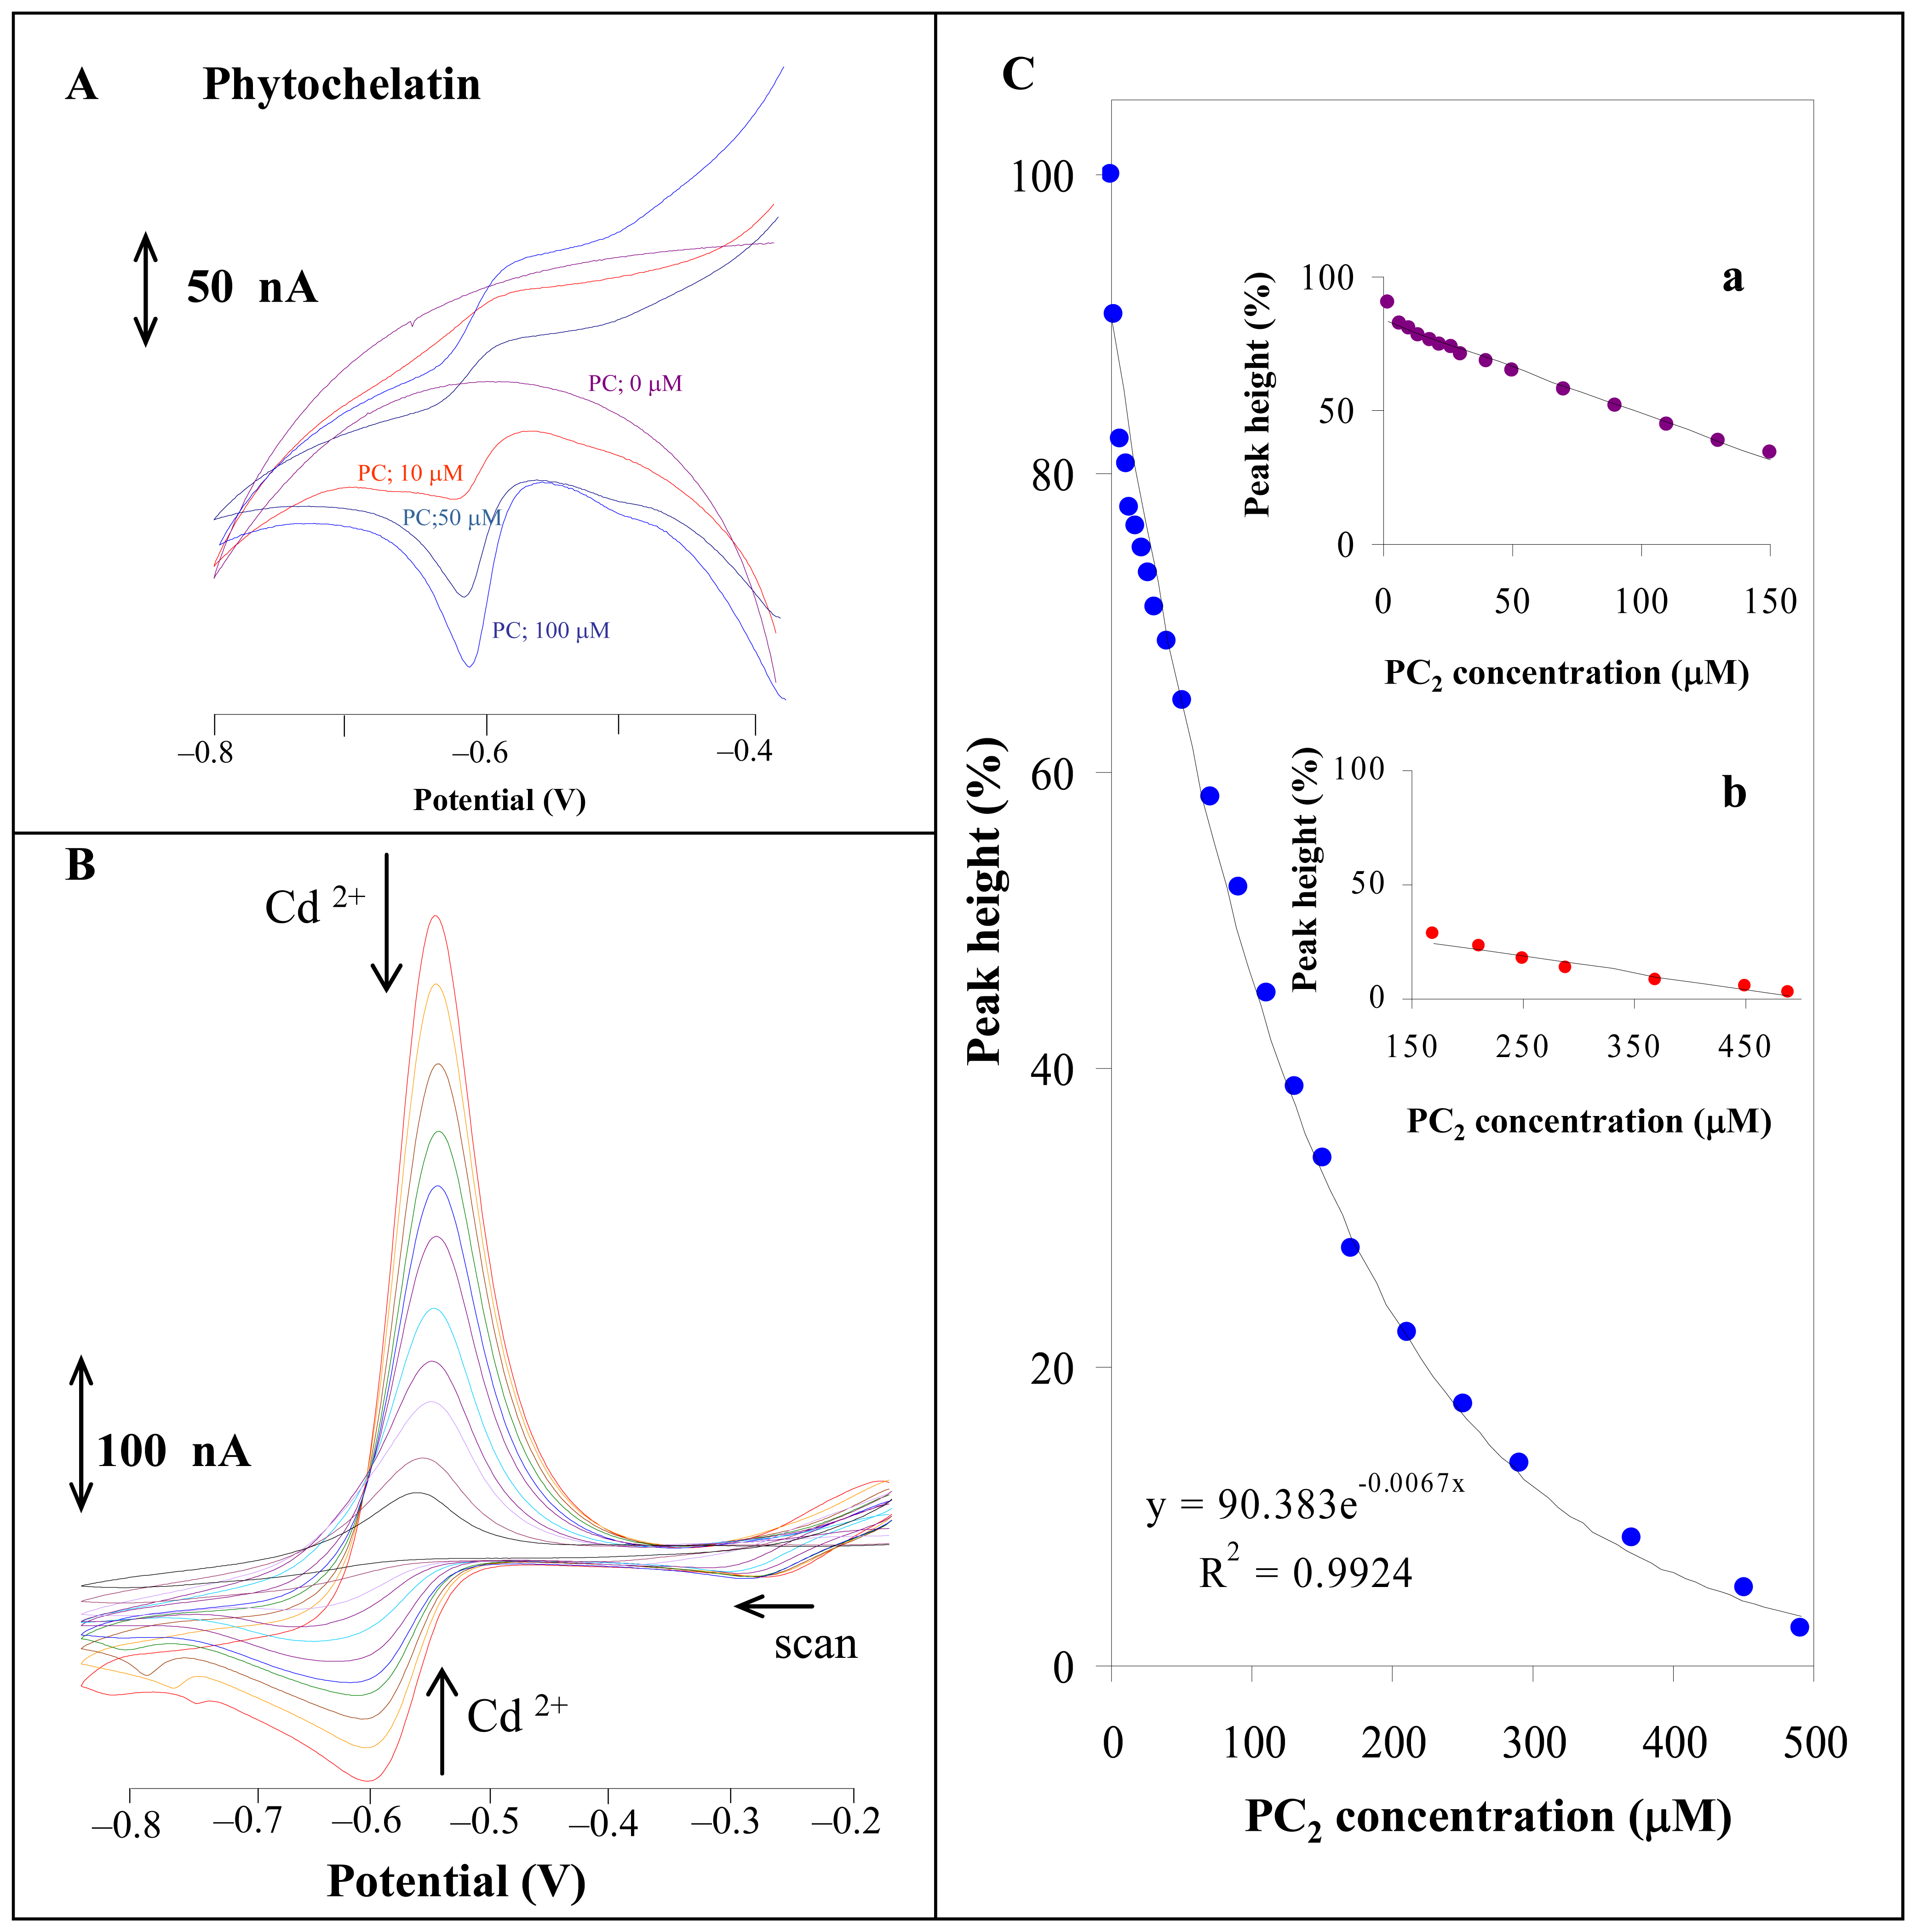
3.1.1 Phytochelatin and cadmium(II) ions

To analyse thiols a battery of analytical instruments can be used as mentioned in “Introduction” section. Electrochemical techniques measuring redox or catalytic signals are suitable not only for detection of thiols but also for study of their interactions with various substances. It is a common knowledge that PC is able to bind heavy metals [20,96]. Thus, we were interested in the issue if we would be able to observe the interaction of PC2 with cadmium(II) ions by cyclic voltammetry. We added cadmium(II) ions to PC2 solution, then, the mixture was vortexed on a Vortex–2 Genie (Scientific Industries, New York, USA) at room temperature for 15 min. Phytochelatin without any heavy metal ions gives a typical cyclic voltammogram shown in Fig. 4A. We found out that reductive signal of phytochelatin2 decreased and signal corresponding to phytochelatin – cadmium(II) complex increased with increasing concentration of the heavy metal (Fig. 4A,B,C). The dependence obtained exponentially decreased according to the equation: y = 90.383e-0.0067x; R2 = 0.9924 and could be divided into two dependences: i) sharp decrease (y = -0.3473x + 83.666; R2 = 0.9799; Fig. 4Ca) and ii) more gradual decrease (y = -0.0745x + 37.649; R2 = 0.9566; Fig. 4Ba).

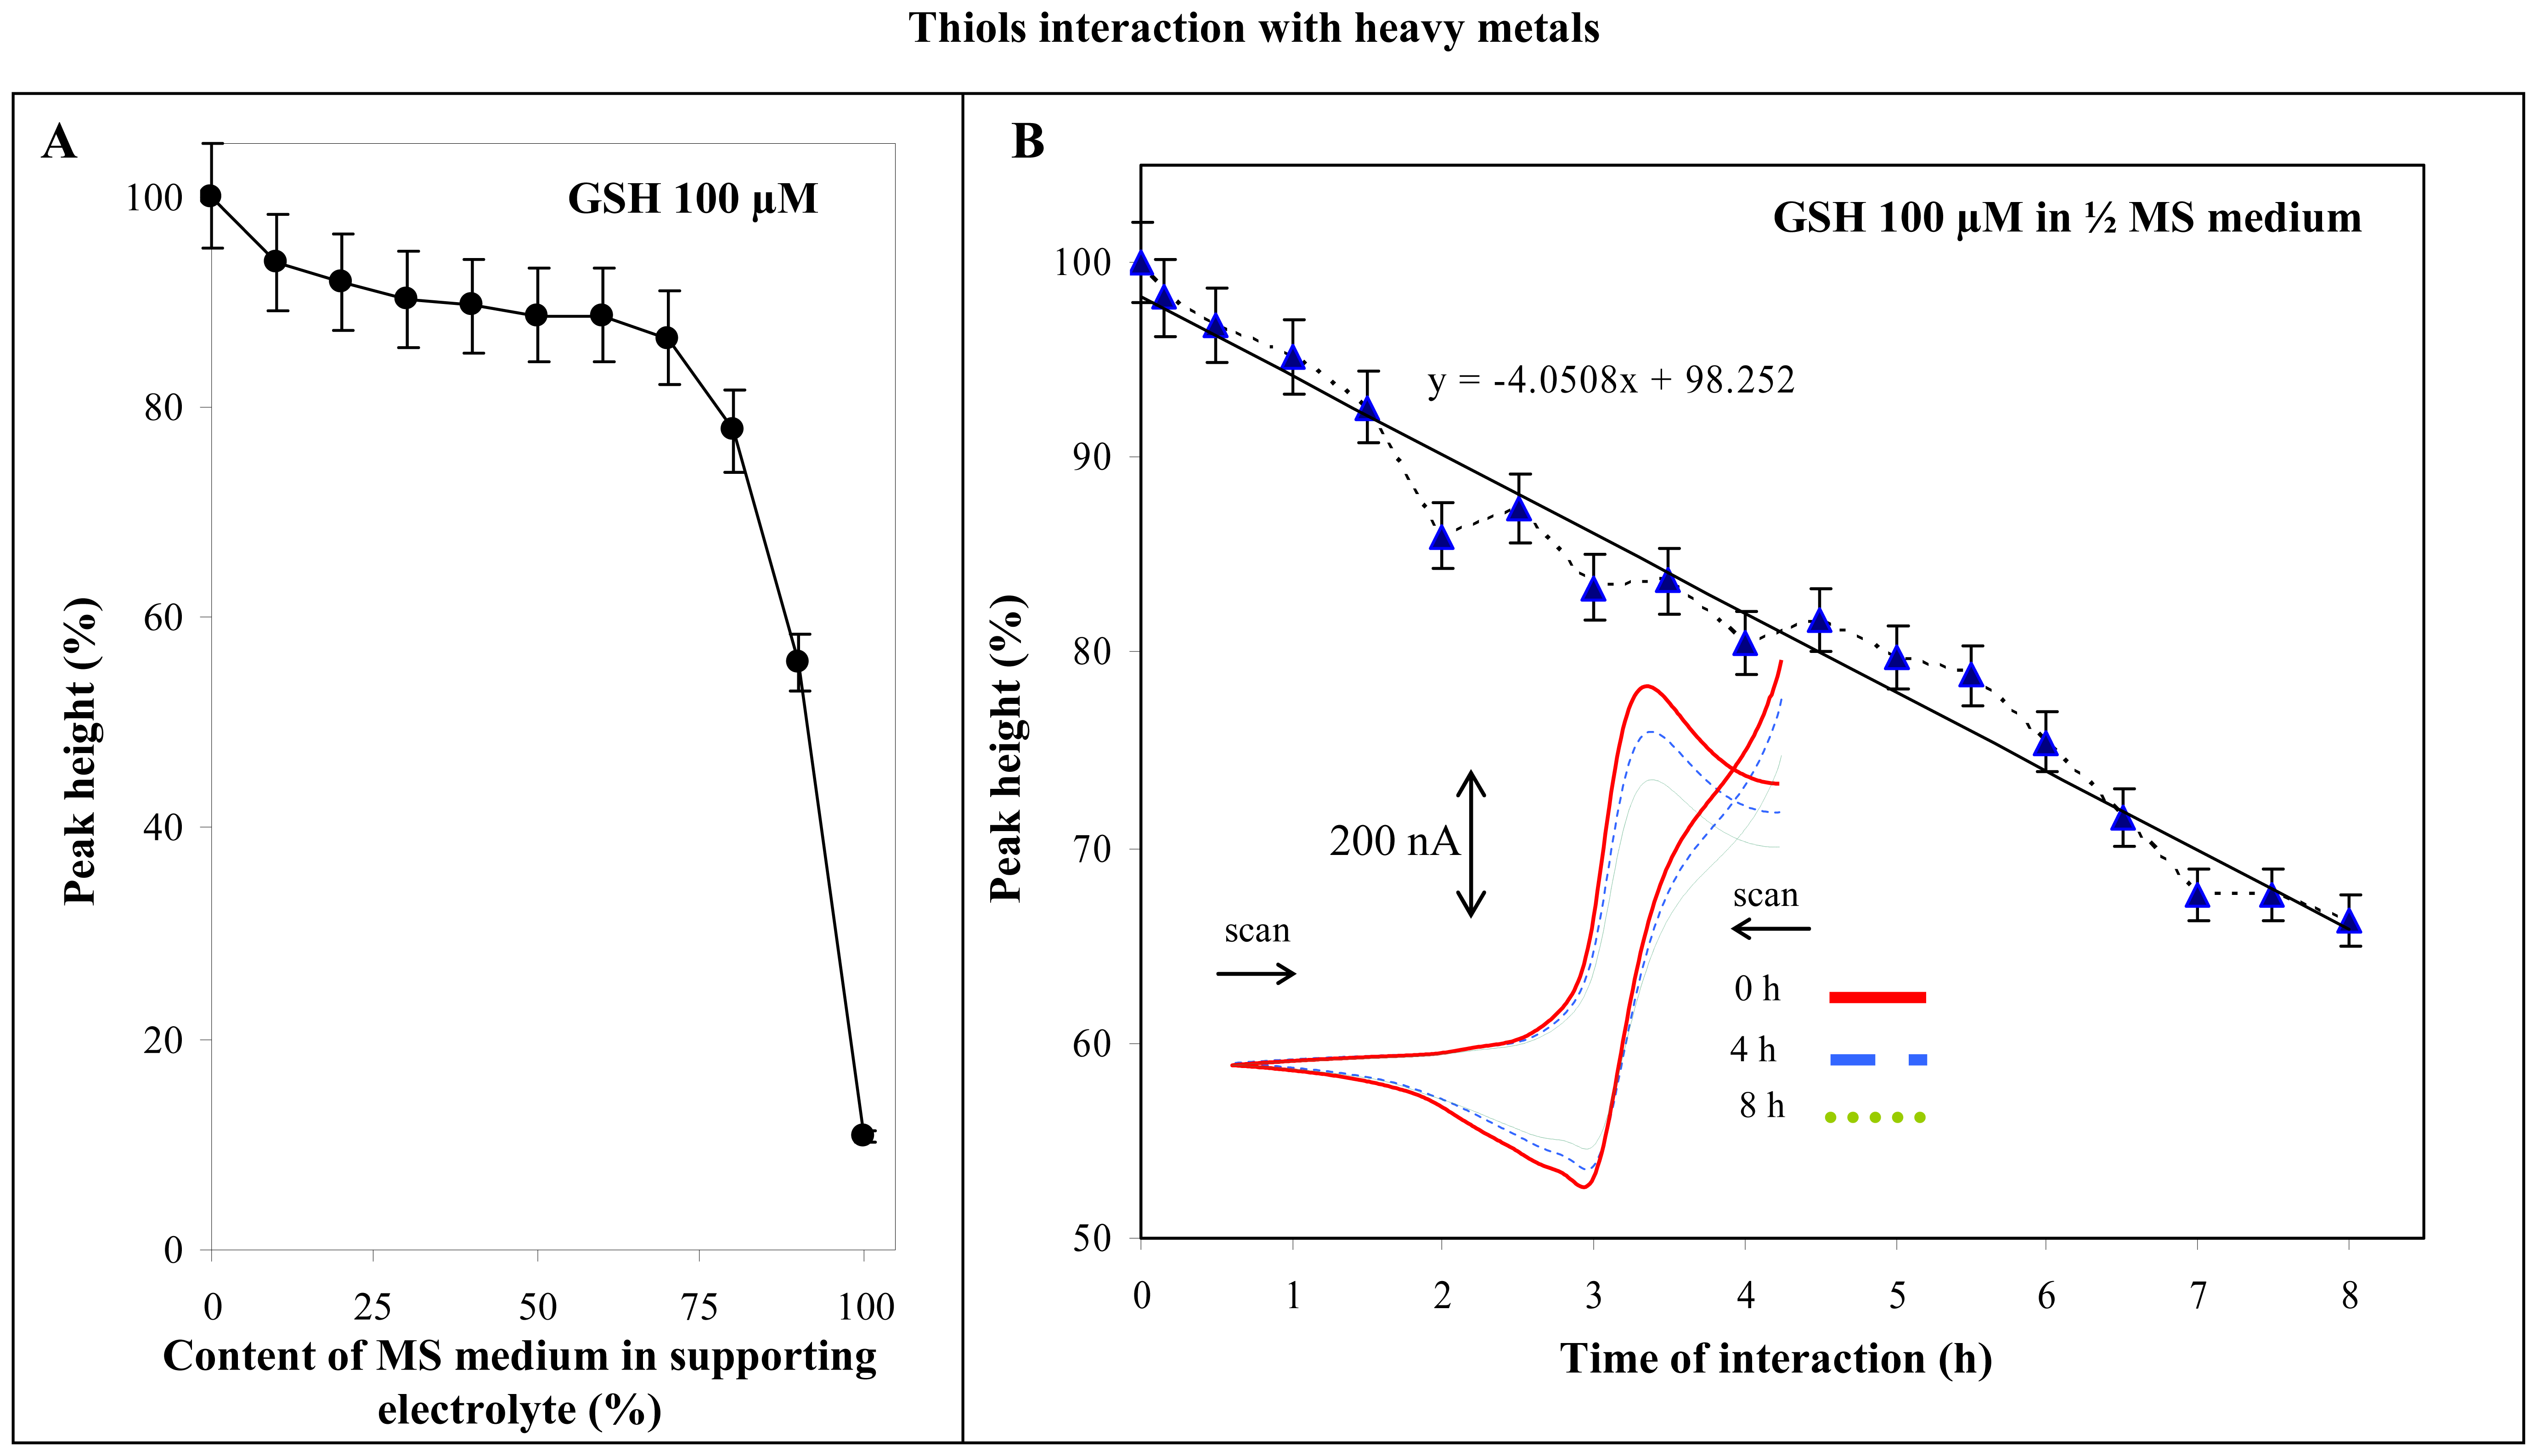
3.1.2 Glutahione and Murashige-Skoog medium

Further, we utilized CV to analyse interaction of other biologically important thiol, glutathione, with more complex mixture – plant cultivation medium. Optimal composition of cultivation media for plants has been investigated and tested for many years. Media for plant cultivation contain macro- and microelements, phytohormones, vitamins, carbon sources and osmotic potential in the best balanced ratio. The influence of individual components on plant growth is still not clear due to a number of reactions between certain components and, most probably, between organism metabolites and components of the medium. Murashige-Skoog (MS) medium is most commonly used for in vitro plant cultivation. A number of experimental works have been devoted to the study of the influence of both organic and inorganic components of this medium on cell cultures [97,98]. Several authors described the influence of GSH added to cultivation medium on cell cultures [97]. GSH is a highly reactive molecule and, thus, has the ability to bind different ions, functional groups and/or toxic compounds via their SH group and to influence composition of the medium. By means of these interactions the concentration of reduced glutathione could be decreased. GSH (100 μM) was added to borate buffer with increasing volume of MS medium. The typical dependence of signal height on the volume of added MS medium is shown in Fig. 5A.
The slow decrease of the signal up to 70 % (v/v) content of the medium in supporting electrolyte was observed. When the concentration increased above 70%, the decrease of the glutathione signal was sharper. At the highest amounts of MS medium the glutathione signal was 11 % of original value and the concentration of free GSH was about 10 μM, what is ten times lower than initially added amount of GSH. The time of the interaction was 4 minutes with intensive stirring and deoxygenating with argon. This time of the interaction was relatively short. Thus we studied the interaction of GSH and MS in the time scale up to eight hours. The obtained experimental dependence of the glutathione concentration on the time of interaction is shown in Fig. 5B. The GSH amount decreased more than 30 % during the experiment. This means that the decreasing correlation between the time of interaction and GSH content resulted (y = -4.0508x + 98.252). Based on the results obtained we assumed that GSH interacted with inorganic components of MS medium, most of all, with metal ions such as zinc(II), copper(II), cobalt(II) [99,100].

3.1.3 Thiols and cadmium(II) ions

Moreover, we attempted to utilize flow injection analysis with electrochemical detection (FIA-ED) to study interactions between thiols (GSH, GSSG and PC2) and cadmium(II) ions. Therefore, we had to characterize the thiols by means of FIA-ED, while glassy carbon electrode served as working one. The most suitable flow rate of mobile phase (Britton-Robinson, pH 2.0) for determination of the thiols was 1 ml/min. The typical hydrodynamic voltammograms of GSH, GSSG and PC2 are shown in Fig. 6A.
We studied the current responses of the thiols with the range from 500 to 1,000 mV. The current responses increased with increasing potential. The maximal responses for GSH and PC2 were obtained within potential from 750 to 900 mV, whereas GSSG gave the highest signal at the highest applied potential. The highest current responses give GSH (three times higher in comparison with GSSG signals), whereas the lowest responses give PC2 (inset in Fig. 6A). The differences in the current responses are probably associated with size of the molecules analysed and with accessibility of their electroactive moieties to be oxidized on the surface of the working electrode. Moreover, we studied the influence of thiols concentration on their signals. The signals obtained were well developed and symmetric (inset in Fig. 6A).
As soon as we have characterized the behaviour of thiols measured by FIA-ED, we aimed on studying their interactions with heavy metals. We were interested in the issue if we can observe interactions between PC2 and cadmium(II) ions using FIA-ED as we were able, when we utilized CV for the same purposes (described above). It is clear from the results obtained that we were able to follow the interaction using FIA-ED. Particularly, decrease in PC2 signal with increasing concentration of cadmium(II) ions was observed in the flow-amperometric record (Fig. 6Ba).
To our knowledge, free –SH moieties in PC2 molecule not only have the highest affinity to heavy metals but also show the highest electroactivity. PC2 signal decreased markedly with increasing cadmium(II) concentration up to 40 μM. This sudden decrease is probably associated with binding of cadmium(II) into all free –SH moieties of phytochelatins (Fig. 6Bb). In addition, the PC2 signal decreased with cadmium(II) dose higher than 50 μM more gradually, which can be associated with interactions of cadmium(II) ions with other free moieties in PC2 molecule (e.g. –NH).

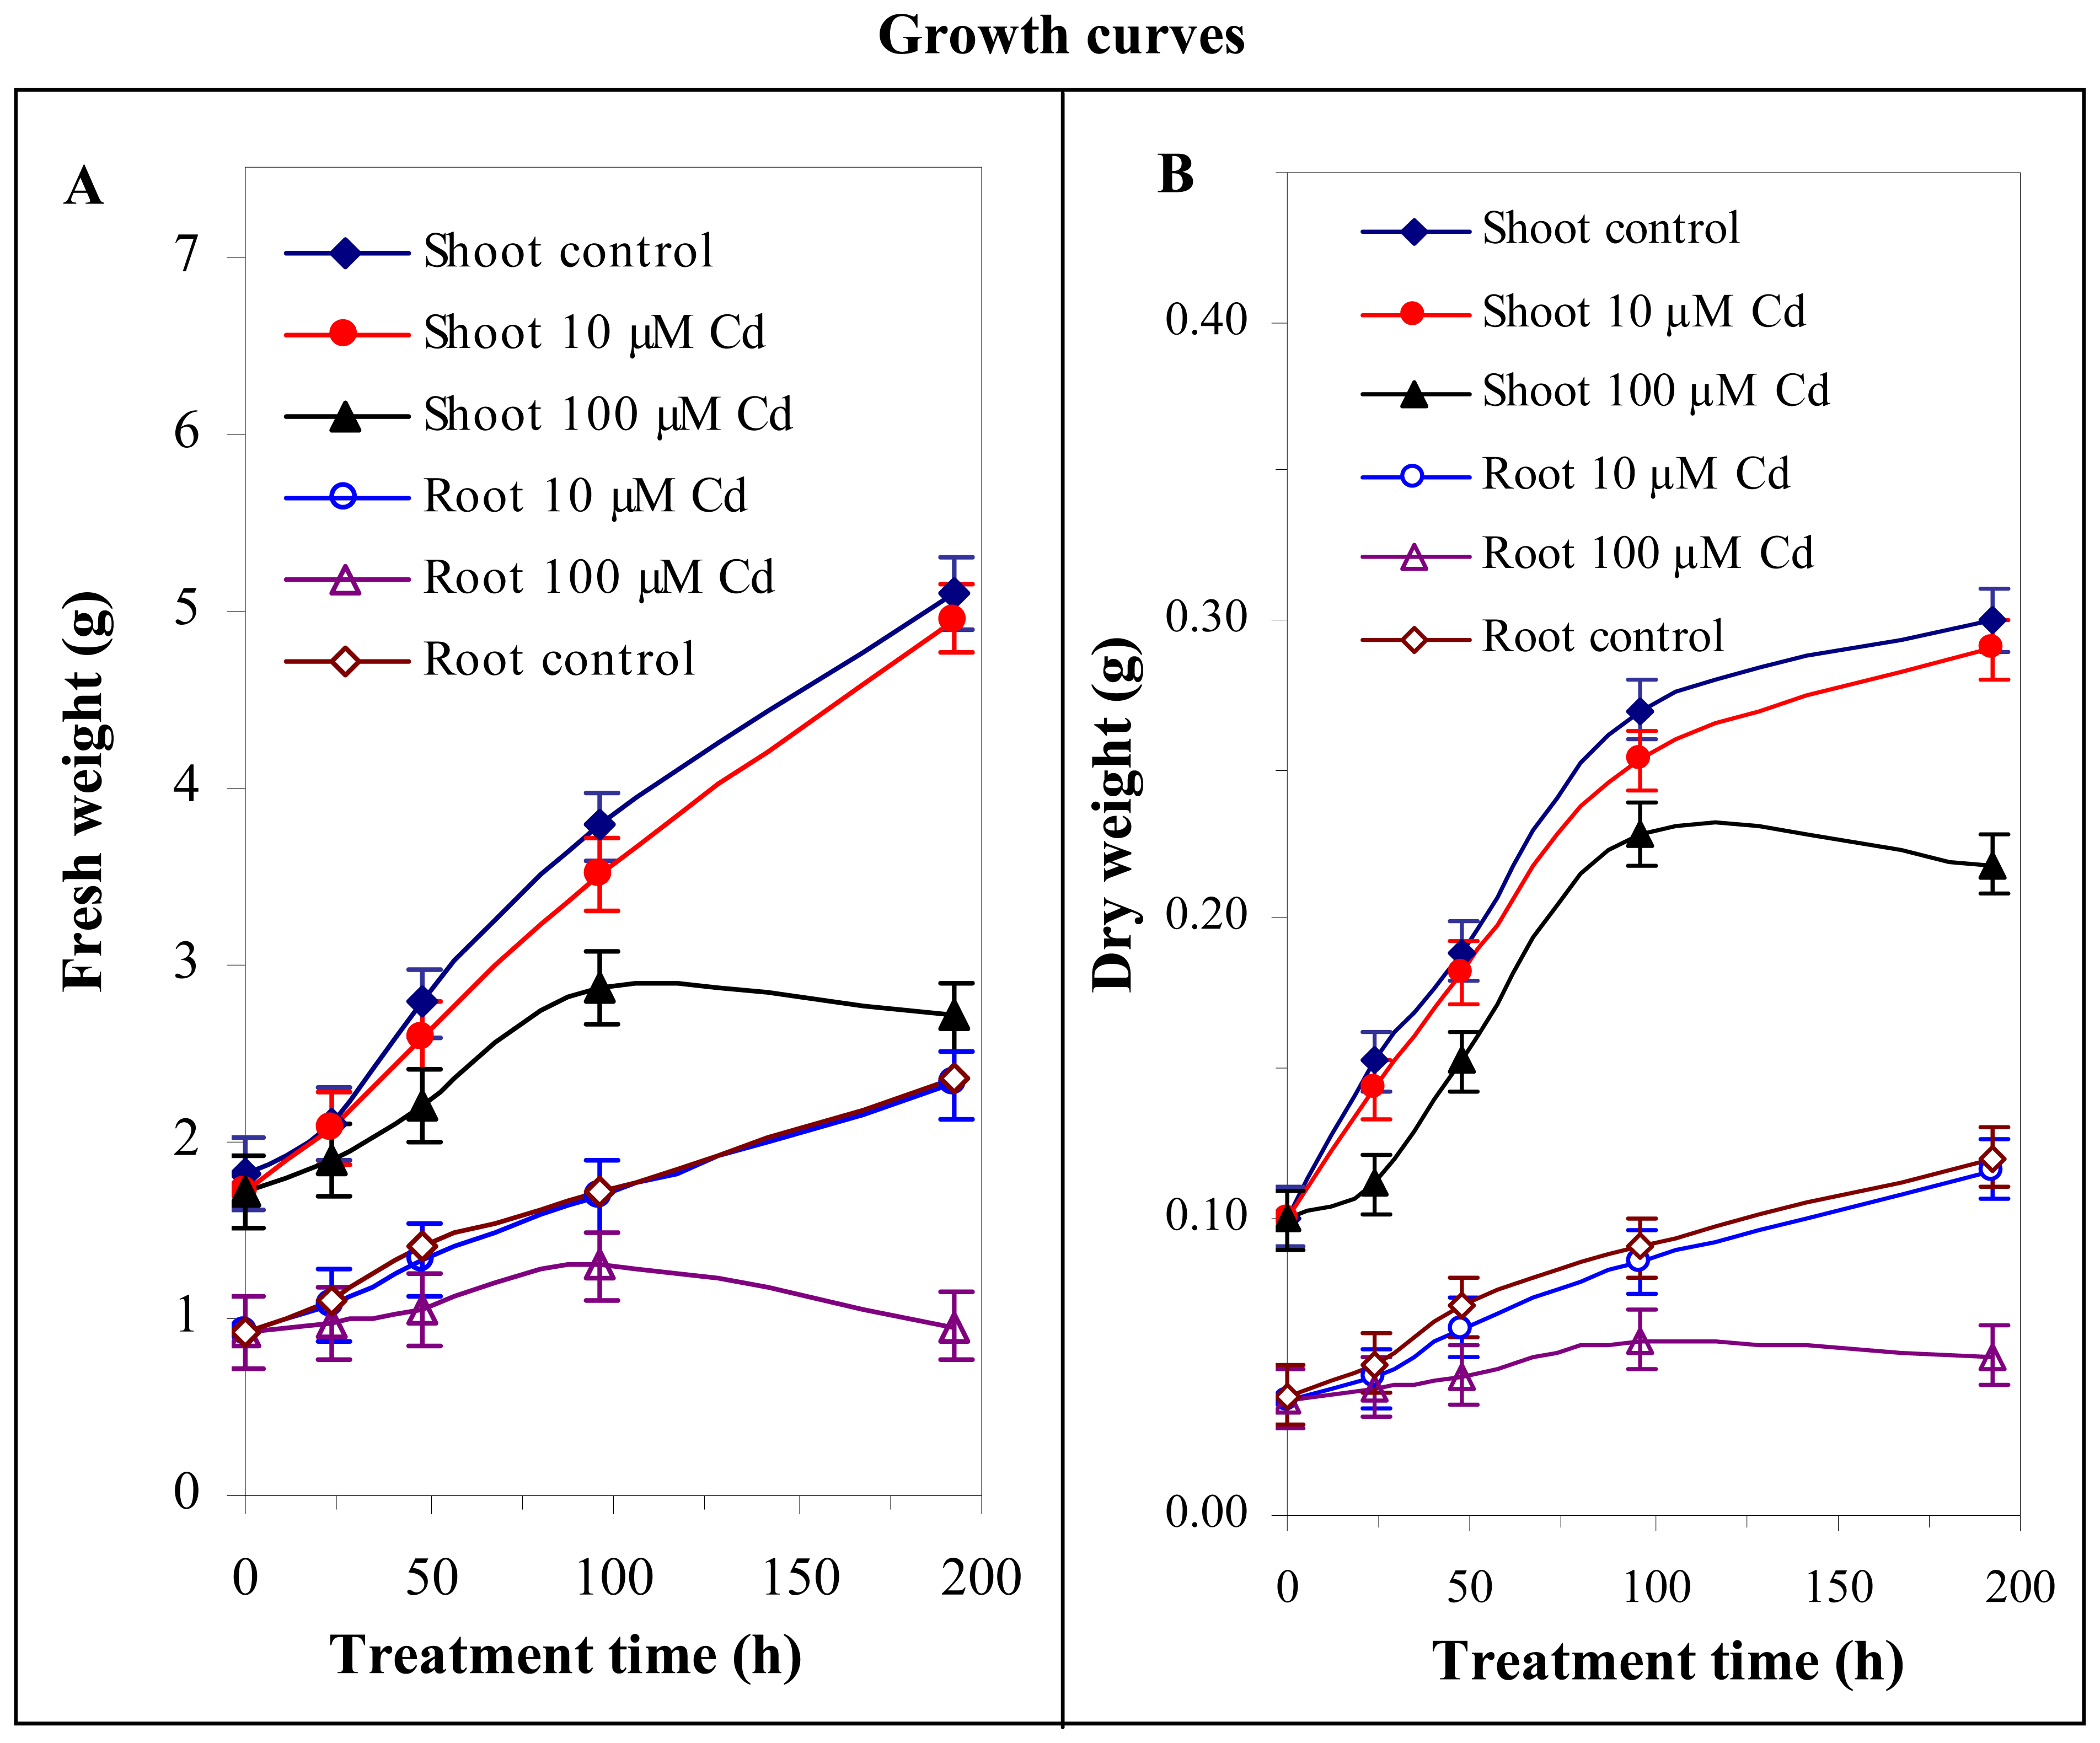
3.2 Effect of cadmium(II) ions on growth of maize plants

After we have investigated the interaction between thiols and cadmium ions, the influence of cadmium(II) ions on maize plants was studied. After 14 days long cultivation the maize plants were used for the study of the influence of three different cadmium concentrations (0, 10 and 100 μM) on their growth during 192 hours long treatment. Ten maize plants were harvested in certain time intervals (0, 24, 48, 96 and 192 h). The harvested plants were divided into leaves, stems and roots and the obtained plant parts were homogenised and analysed. Five plants were used for the determination of GSH content and fresh weight and the other five for the determination of dry weight and Cd concentrations. The next important factor that influenced plant growth is transpiration. Transpiration was determined on the basis of nutrient solution mass decrease and according to the increase of fresh weight of plants according to Zaidi et al. [85]. Results of nutrient solution mass decrease were recalculated on 1 g fresh weight of plant (Fig. 3B).
In the certain experimental time intervals (0, 24, 48, 96, and 192 h) plant samples were used to construct growth curves. Significant inhibition of plant growth was not observed at 10 μM Cd in nutrient solution in comparison with the control plant (Fig. 7). On the other hand, in nutrient solution containing 100 μM Cd significant growth depression of leaves, stems and roots was observed. The plants cultivated at the highest Cd concentration (100 μM) had brown leaves tips and very poorly developed root systems. The morphological differences between control plants and plants treated by 100 μM Cd were observed already after 24 h (not shown). Growth curves for fresh and dry weights of treated maize plants are shown in Figs. 7A,B, respectively. Both, dry and fresh weights of maize plants cultivated at 10 μM Cd increase almost linearly with time (Figs. 7A,B) on the contrary to 100 μM Cd dosage where maize plants growth reached a maximum after 96 hours (Fig. 7A,B) and then growth depression probably followed. Even after 48 hours, differences of plant growth curves for both cadmium concentrations were significant. Similar differences were also described in chickpea root and tobacco [101-103]. Growth curves for fresh and dry weights of non-treated maize plants are shown in Fig. 7A,B and are almost similar to growth curves of maize plants treated by 10 μM Cd.

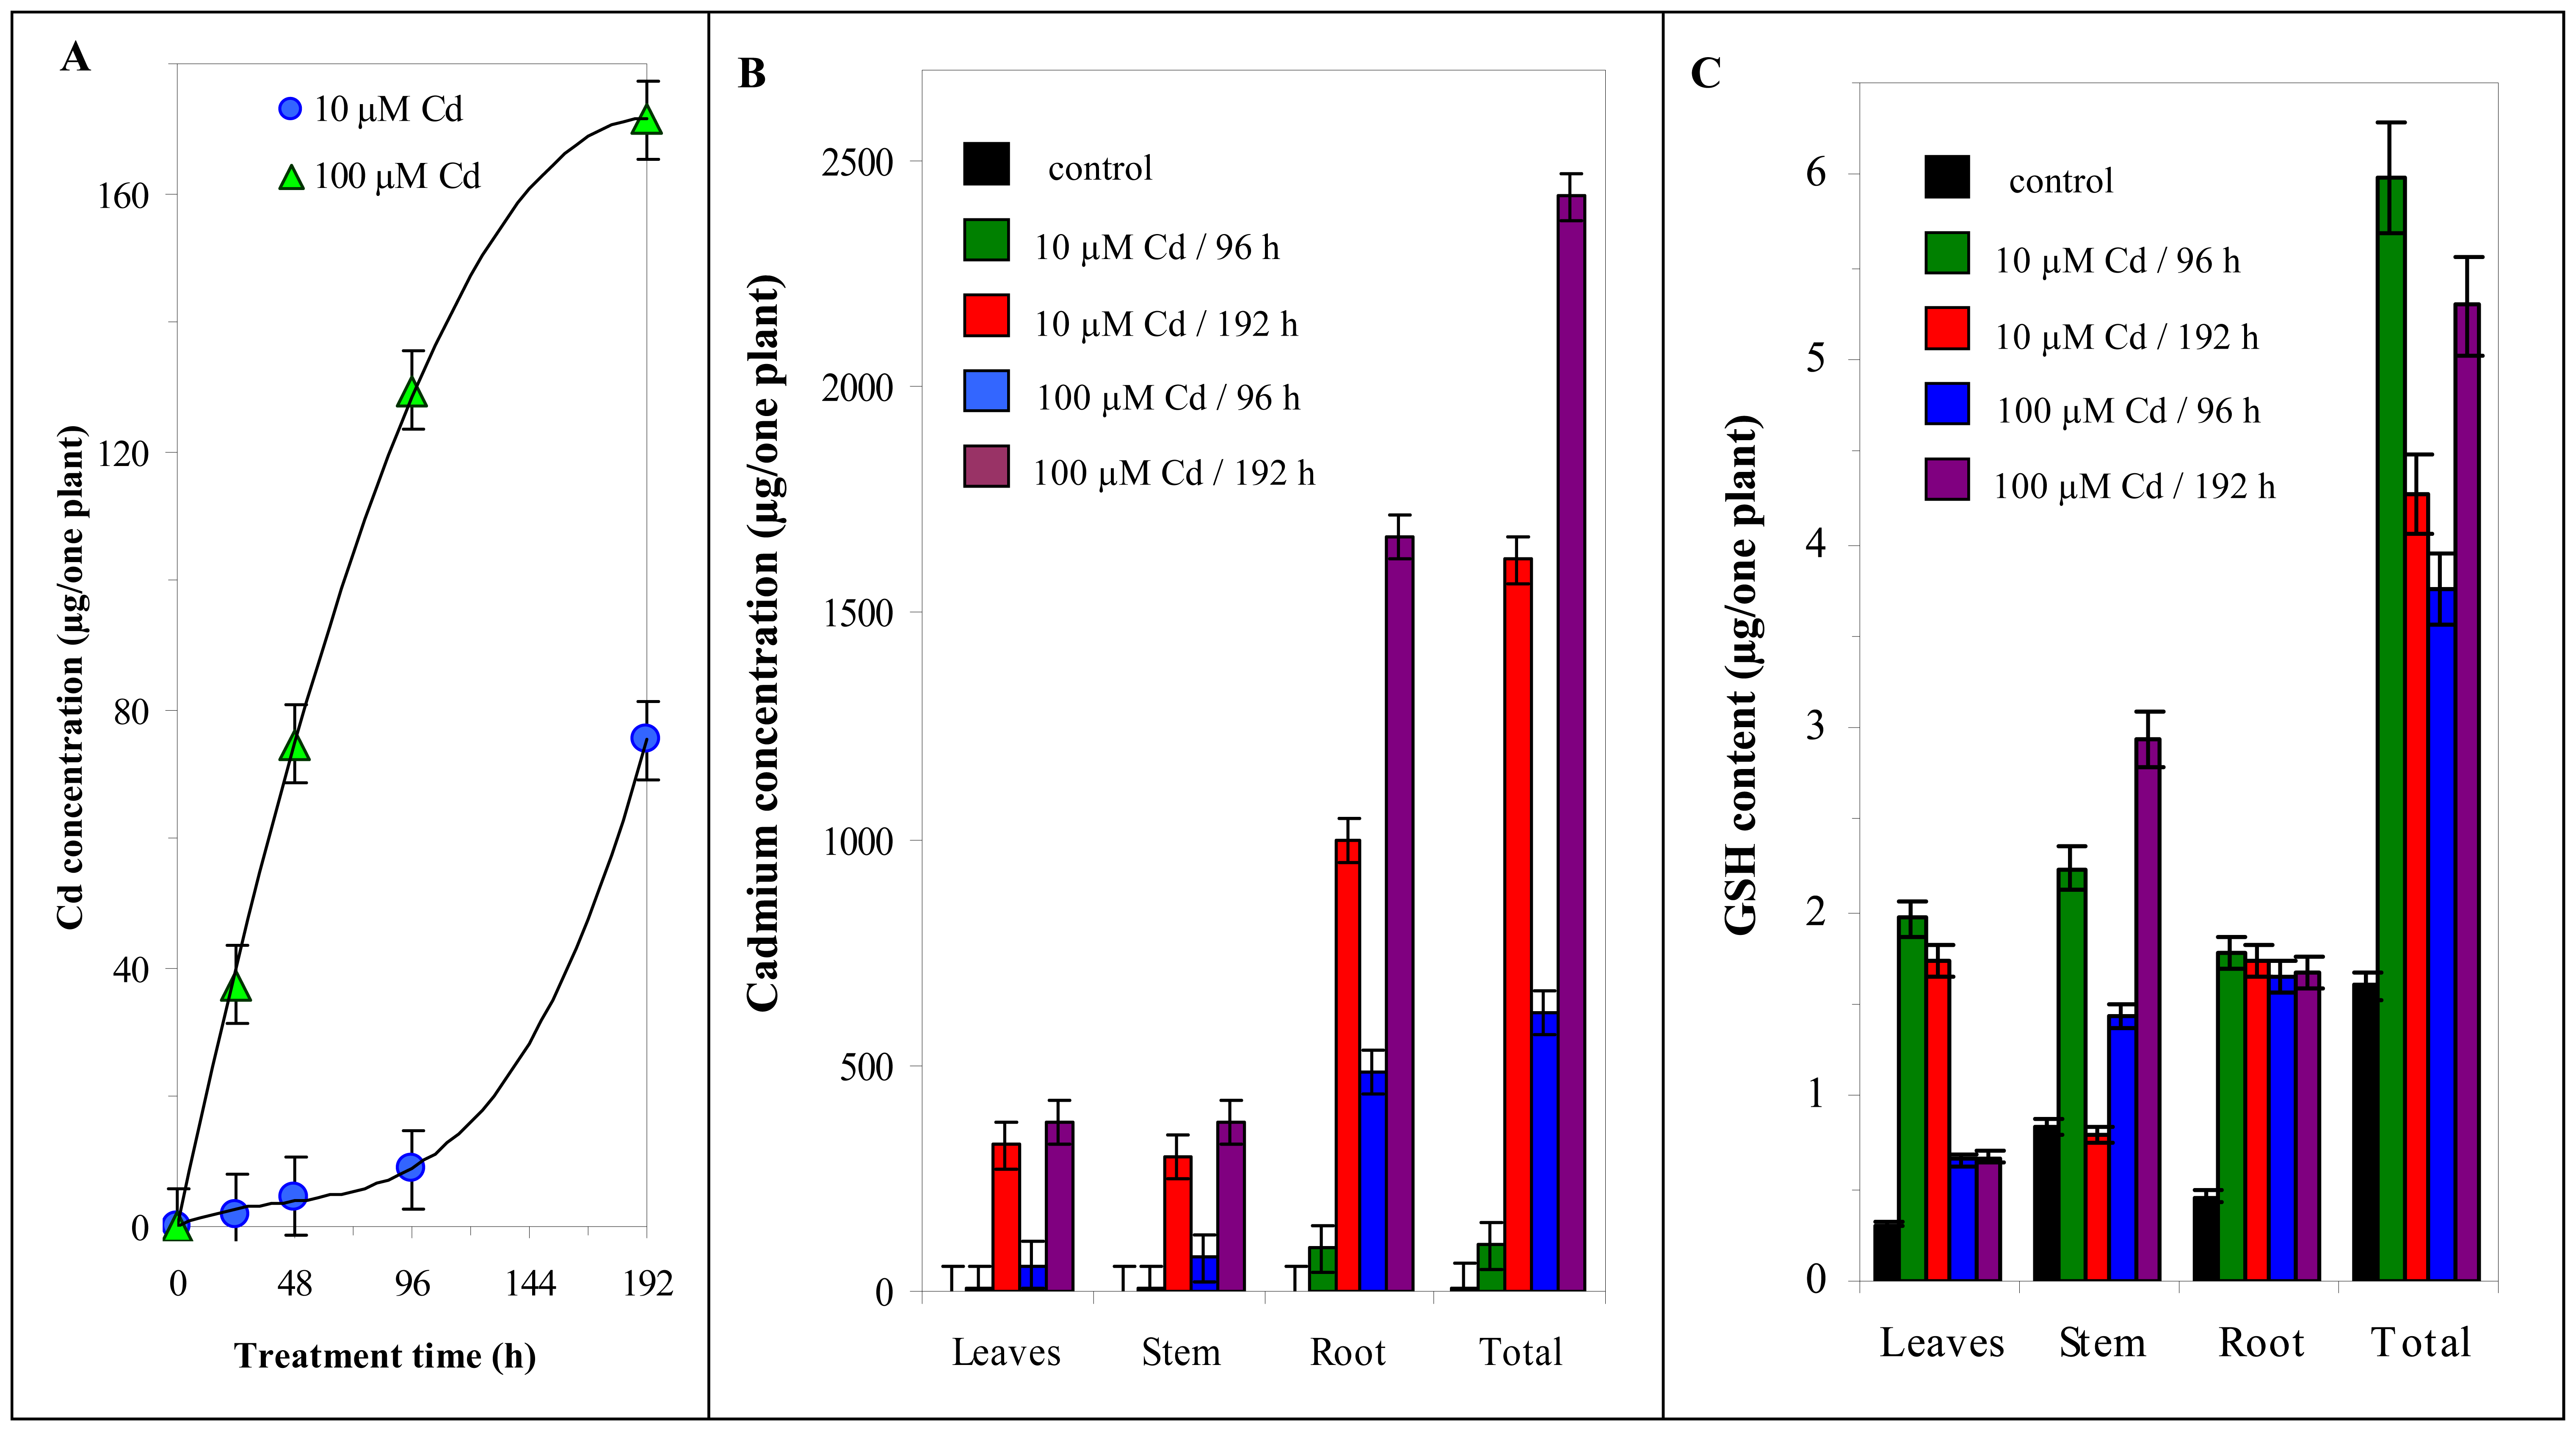
3.3 Cadmium concentration changes in nutrient solution

Primarily we focused on determination of cadmium concentration changes in nutrient solution during 196 h long experiment. These changes could be used to evaluate the plant's ability to uptake Cd from the nutrient solution. Electrochemical determination of cadmium in nutrient solution was accomplished by differential pulse anodic stripping voltammetry (DPASV). The typical voltammograms of simultaneous determination of zinc(II), cadmium(II), lead(II) and cupper(II) (5, 10, 20 and 39 nM; are shown in inset in Fig. 8A. The calibration curves in acetate buffer (Fig. 8A) is strictly linear with R2 = 0.99. The detection limits for the heavy metals as 3 S/N were evaluated as units and tens of pM. This very sensitive detection method was used due to precise detection of very small cadmium concentration changes in nutrient solution.
Exactly 10 ml of nutrient solution were taken from cultivating vessels during the experiment at specified time intervals (0, 24, 48, 96 and 192 h). Each sample was diluted in ratio of 1:100 (v/v) by acetate buffer (pH 5.6) before analysis. Cadmium concentration in nutrient solution without maize plants that was determined by DPASV was not changed during 192 h (deviation around 5 %, not shown). We did not want to change any experimental parameters so we did not add any new nutrient solution during the cultivation. That is why we were sure that the water volume in nutrient solution in vessels had fallen and, simultaneously, Cd concentration had changed according to transpiration. After re-estimating of cadmium(II) concentration on the transpired amount of water the concentration in nutrient solution was decreasing faster at dosage 10 μM than 100 μM (Fig. 8B) [85]. The concentration of cadmium in cultivating vessels decreased up to about 20/60 % of initially applied 10/100 μM Cd, respectively, at the end of experiment (Fig. 8B).

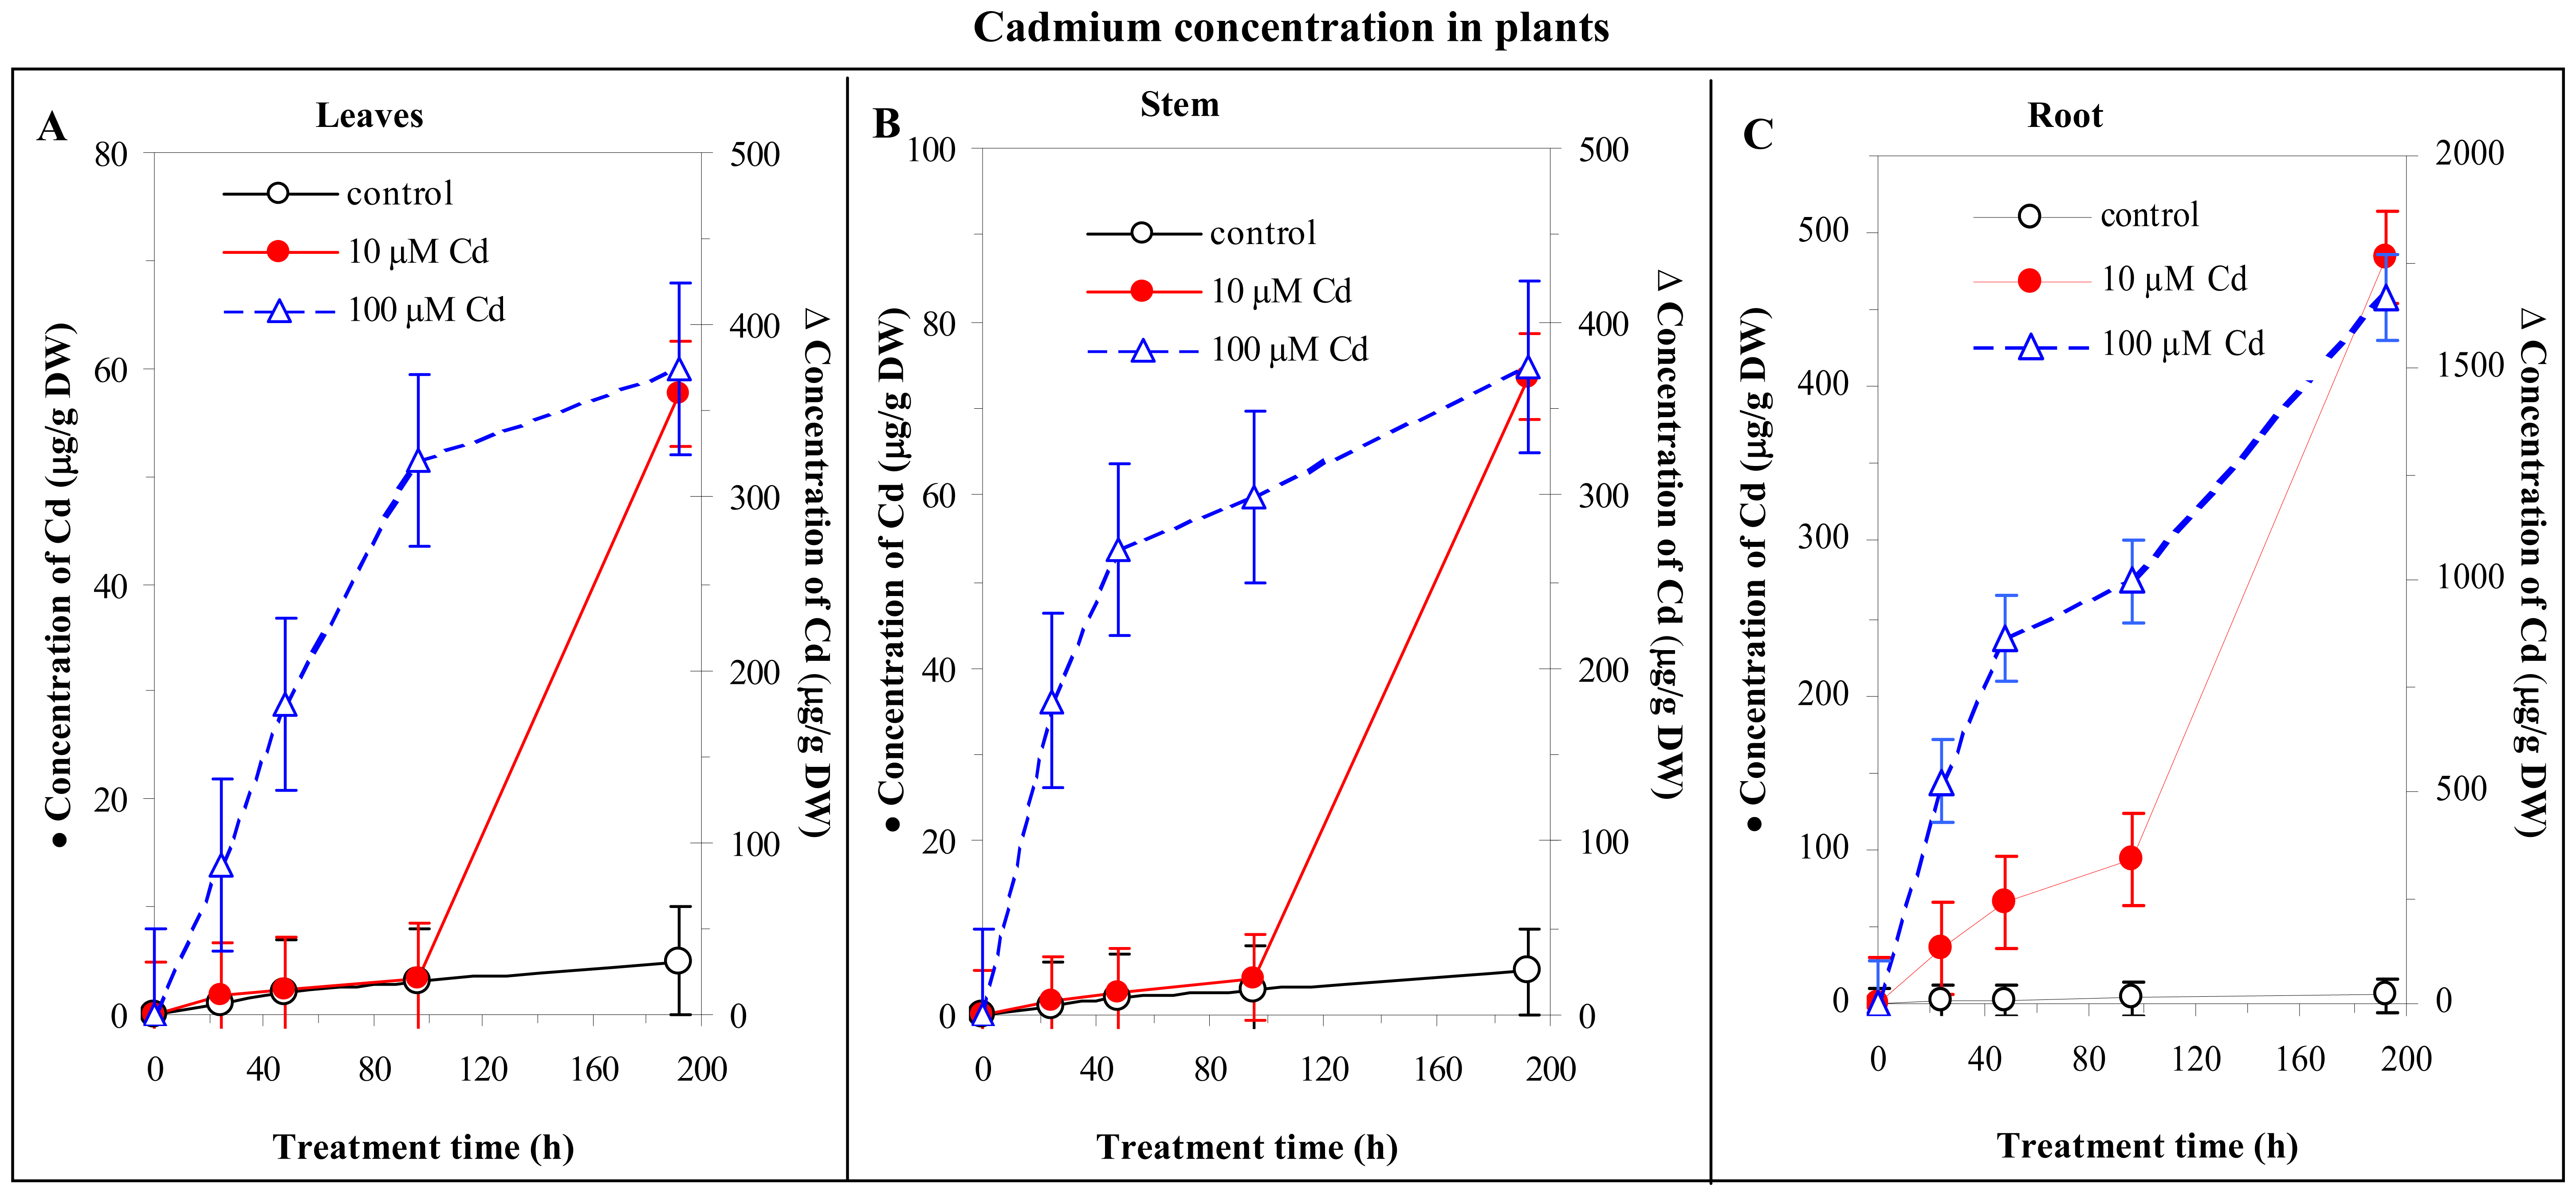
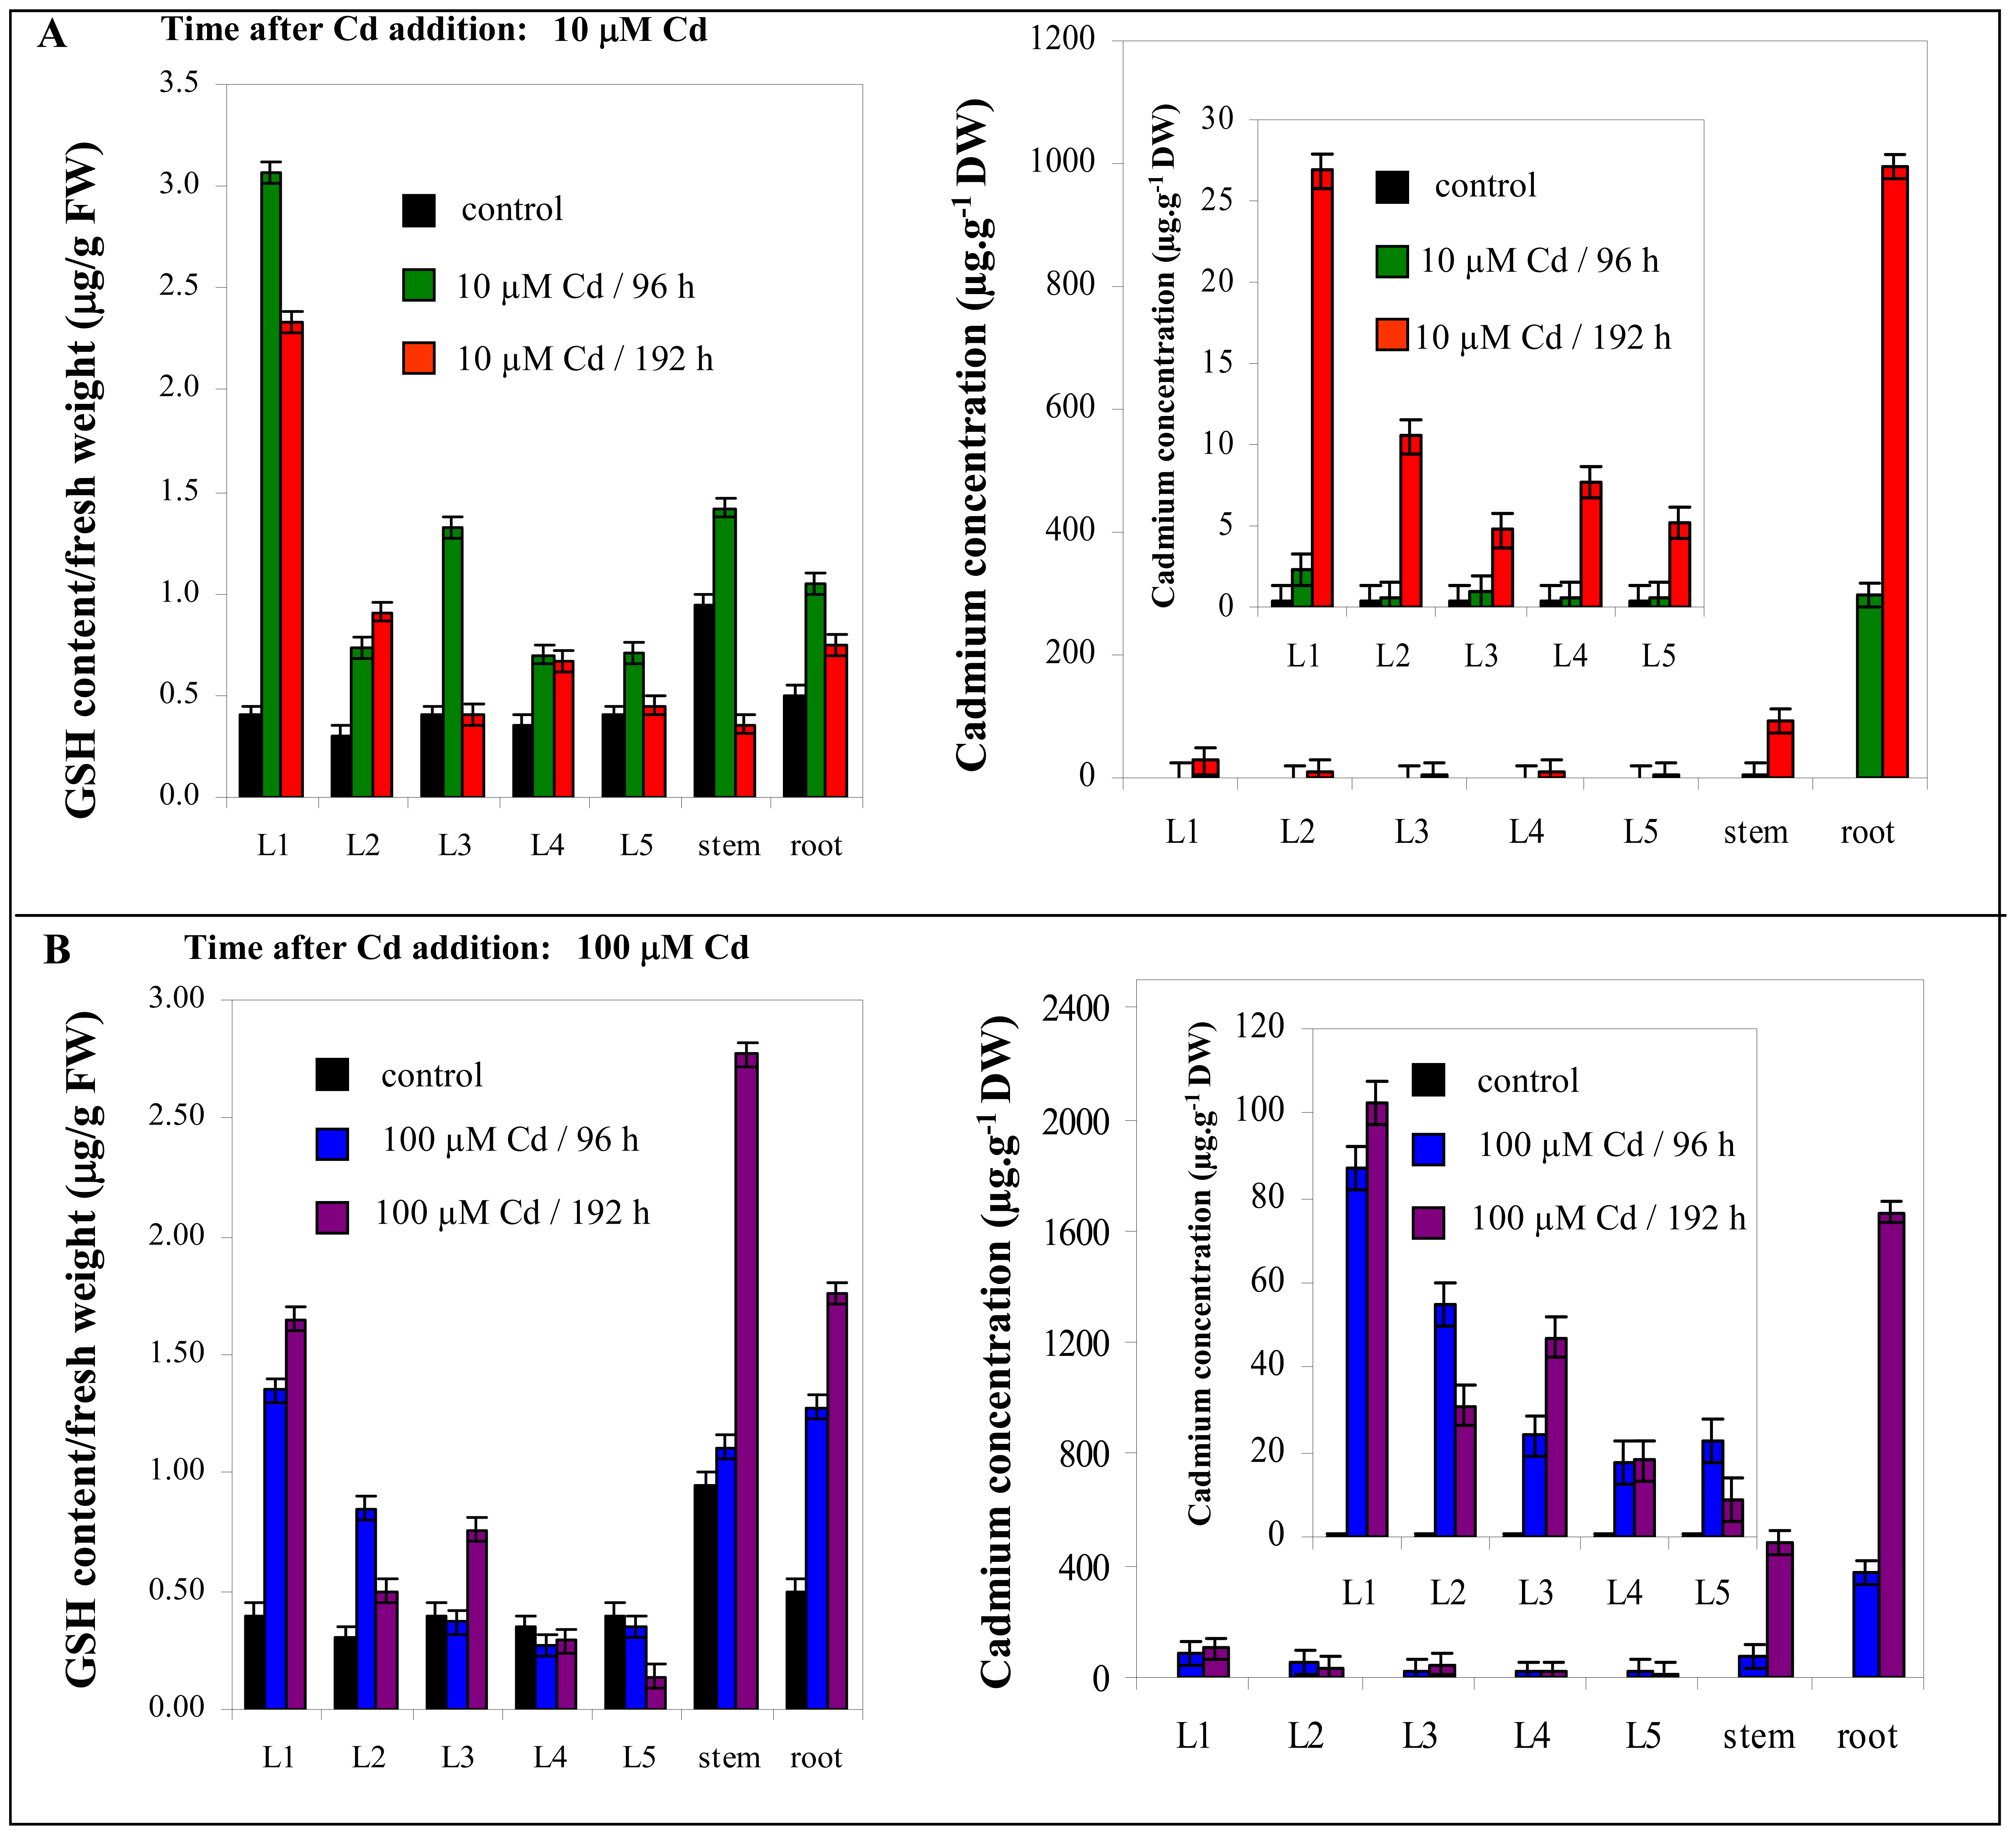
3.4 Cadmium concentration changes in plants

In addition we electrochemically determined concentration of cadmium in different parts (leaves, stems and roots) of maize plants by DPASV (Fig. 9). We found out very interesting trend in Cd uptake by plants. Cadmium concentration was very low in all parts of maize plants cultivated in nutrient solution containing 10 μM Cd for 96 hours of treatment and then the concentration of Cd in all studied plant parts markedly increased (Fig. 9). This sudden increase probably relates with failure of root protective mechanisms that can prevent in uptake of heavy metals by plant [17,104]. Marked decrease of cadmium concentration in nutrient solution with initially 10 μM Cd concentration is shown in Fig. 8B. On the other hand maize plants did not almost receive any cadmium from nutrient solution during first 96 hours of treatment (Fig. 9). The disproportion probably relates with cadmium adsorption on surface of roots and, consequently, the adsorbed cadmium was cleared away using EDTA before analysis [77].
On the contrary, the dosage of 100 μM Cd caused the immediate and sharp increase of cadmium concentration in stems and leaves to 96 hours of treatment but after that the Cd concentration in stems and leaves increased more slowly (Fig. 9). Concentration of cadmium in roots of maize plants exposed by the highest cadmium concentration (100 μM Cd) markedly increased to 48 hours, between 48 and 96 hours of treatment increased very slowly but from 96 to 192 hours concentration of cadmium again markedly increased. Protective mechanisms contained in roots, which obstruct in uptake of heavy metals by plant, were probably damaged due to high and toxic cadmium concentration (100 μM Cd) already in the beginning of the experiment. That is why cadmium was easily transported to the plant by root immediately in the beginning of experiment. Increase of cadmium concentration in all parts of plants to 96 hours of treatment probably relates with active transport of nutrients from roots to above-ground parts of plants [105]. After 96 hours of treatment, the transport pathways were probably damaged by cadmium presence and its concentration increase only in roots (Fig. 9). Due to damaging of the transport pathways, the transport of nutrients from roots to other parts of plants were insufficient and consequently we observed the growth depression (Fig. 7) [105-108]. The highest concentrations of Cd were determined in roots in comparison with other studied parts of plants treated by 10 and/or 100 μM Cd. Approximately the same concentrations of cadmium were detected in leaves and stems of plants treated by 10 and/or 100 μM Cd. The same results were obtained in oilseed rape and tomato [109,110].

3.5 Electrochemical determination of thiols

3.5.1 Cyclic voltammetry of the thiols

Electrochemical behaviour of certain thiols measured on the surface of mercury electrode in the presence of phosphate buffer has already been described [73]. On the other hand, the behaviour in the presence of other supporting electrolytes can differ seriously. Here we analysed three thiols (reduced GSH and oxidized GSSG glutathione, and phytochelatin PC2) in the presence of 0.05 M sodium tetraborate (pH 9.6). We chose this buffer because it belongs to the most commonly used buffers in electroanalysis. Cyclic voltammograms were recorded within the potential range from -0.2V to -0.8 V, whereas potential of -0.8 V was vertex potential. The typical voltammogram of certain compounds of interest has been obtained (Fig. 10A). GSH gave signal at potential PGSH (−0.44 V), GSSG peak PGSSG (−0.69 V) and PC2 peak PPC2 (−0.62 V). As for GSH, there are evident both reductive and oxidative signals [26]. The reductive signal corresponds to reduction of GS-Hg complex. In addition oxidative signal probably relates with oxidizing of GSH to GSSG [76] (Fig. 10Aa). Similar mechanisms could be expected for analysis of phytochelatin (Fig. 10Ac).
On the other hand, GSSG is probably reduced on the surface of HMDE with consequent GSH formation. The formed GSH molecules could be oxidized. Voltammograms obtained by analysis of GSSG confirm these presumptions because they consist from several processes (there are three well observable signals, Fig. 10Ab).
We found out that processes taking place on a surface of working electrode are strongly influenced by a supporting electrolyte and its pH [111]. We assume that a thiol would firstly be adsorbed on a surface of working electrode and then a compound of the thiol with mercury would be formed. After that electrode reaction of the thiol-mercury compound would take place.
In our following experiments, we investigated the influence of scan rates (10, 20, 40, 80, 160, 320 and 640 mV/s) on reductive signals of the thiols. We observed that the height of the analysed thiols signals increased proportionally with increasing scan rate (GSH, R2 = 0.98; GSSG, R2 = 0.87; and PC2 R2 = 0.99). The potentials of the peaks shifted about 0.8 mV per 100 mV/s to more positive potentials. In addition we investigated dependence of thiols signals on their concentration (0 – 20 μM). The dependences were obtained at scan rate of 20 mV.s-1 by dilution of stock solutions of thiols and were linear (GSH, y = 0.4431x + 0.0054, R2 = 0.9999; GSSG, y = 0.3189x - 0.0486, R2 = 0.9965; and PC, y = 0.2311x - 0.0085, R2 = 0.9933) with R.S.D. 6.5% (Fig. 10B). When we analysed thiols in the concentration range from 0 to 1,000 μM, we found out that the GSH signal shifted to a more negative potential and the potentials of GSSG and PC2 to more positive ones with their decreasing concentration. If the concentration of thiols decreased below 10 μM, they gave reductive signal at the same potential (–0.53 V), Fig. 10B.

3.5.2 Changes in content of thiols in maize plants

Detoxification mechanisms based on the synthesis of phytochelatins is the most probable explanation of the observed plant response at Cd presence. Many authors have observed that the most expressed effect of heavy metals in plants is easily observable in roots [101,102,112-116]. Roots are the most important gates for heavy metals uptake and that is why non-protein thiol compounds synthesised from glutathione as a response to stress factors are mainly presented in roots [104]. Thus, we analysed the level of glutathione in various maize parts (including roots) by optimised HPLC-ED method optimized by Petrlova et al. [44] and Potesil et al. [47]. GSH contents and cadmium concentrations in individual parts of plants exposed to Cd (0, 10 and 100 μM Cd) after 96 and 192 h of treatment are shown in Fig. 11A,B. The relatively high GSH content in the leaf L1 and the stem are the most interesting findings. The content of GSH decreased from the oldest to the youngest leaves. Observed changes in GSH content according to time of exposition were also very interesting. The GSH content maximum was reached close to 96 h and then the amount of GSH gradually decreased in plants exposed to 10 μM Cd.
In plants exposed to cadmium dosage 100 μM, on the other hand, amounts of GSH increased continuously till the end of the experiment. The highest GSH contents were detected in stem, root and leaf L1. Again the tendency to a decrease in GSH content is evident in younger leaves (Fig. 11B). Number of authors has also observed changes in glutathione content during exposition by different stress factors [112,117,118]. On the other hand, a recent study of the regulation of phytochelatin synthesis in marine green alga has been published, where the authors have shown that glutathione content was constant [119].
We obtained surprising results for the total concentrations of Cd and GSH in a whole plant (Fig. 12). Concentration of Cd in one plant according to treatment time is shown in Fig. 12A. Cadmium concentration in plants treated by 100 μM Cd increased almost linearly according to treatment time. On the other hand, Cd concentration in plants cultivated in nutrient solution containing 10 μM Cd markedly increased after 96 h of exposition. In addition, we determined cadmium concentrations in individual parts of maize plants (Fig. 12B). Finally we showed GSH content per a plant (Fig. 12C), because we attempted to observe the heavy metal stress response in whole organism exposed to the heavy metal. GSH content in roots did not change according to time of exposition and Cd concentration (Fig. 12C). This trend could suggest that protection mechanisms in roots are triggered by very low concentrations of a heavy metal. The maximal concentration of GSH was determined in the leaves of plants exposed to a lower cadmium dosage (10 μM Cd). The higher Cd dosage caused significant depression of GSH concentration that is probably related to phytochelatin synthesis [44,101,112].

Conclusion

As we have shown, electroanalytical techniques enable easy and rapid analysis of thiols. Moreover, these techniques could be utilized to study interactions between thiols and metals.

Acknowledgments

The work on this project was supported by grants GACR 522/07/0692, 1M06030, INCHEMBIOL MSMT 0021622412, IGA MZLU 20/2007 and MSMT 6215712402.

References

  1. Kizek, R.; Vacek, J.; Trnkova, L.; Klejdus, B.; Kuban, V. Electrochemical biosensors in agricultural and environmental analysis. Chem. Listy 2003, 97, 1003–1006. [Google Scholar]
  2. Zehnalek, J.; Adam, V.; Kizek, R. Influence of heavy metals on production of protecting compounds in agriculture plants. Lis. Cukrov. Reparske 2004, 120, 222–224. [Google Scholar]
  3. Zehnalek, J.; Vacek, J.; Kizek, R. Application of higher plants in phytoremetiation of heavy metals. Lis. Cukrov. Reparske 2004, 120, 220–221. [Google Scholar]
  4. Pulford, I.D.; Riddell-Black, D.; Stewart, C. Heavy metal uptake by willow clones from sewage sludge-treated soil: The potential for phytoremediation. Int. J. Phytoremediation 2002, 4, 59–72. [Google Scholar]
  5. Singh, K.P.; Mohan, D.; Sinha, S.; Dalwani, R. Impact assessment of treated/untreated wastewater toxicants discharged by sewage treatment plants on health, agricultural, and environmental quality in the wastewater disposal area. Chemosphere 2004, 55, 227–255. [Google Scholar]
  6. Shrotriya, N.; Joshi, J.K.; Mukhiya, Y.K.; Singh, V.P. Toxicity assessment of selected heavy-metals, herbicides and fertilizers in agriculture. Int. J. Environ. Stud. 1984, 22, 245–248. [Google Scholar]
  7. Endo, T.; Haraguchi, K.; Cipriano, F.; Simmonds, M.P.; Hotta, Y.; Sakata, M. Contamination by mercury and cadmium in the cetacean products from Japanese market. Chemosphere 2004, 54, 1653–1662. [Google Scholar]
  8. Bordajandi, L.R.; Gomez, G.; Abad, E.; Rivera, J.; Fernandez-Baston, M.D.; Blasco, J.; Gonzalez, M.J. Survey of persistent organochlorine contaminants (PCBs, PCDD/Fs, and PAHs), heavy metals (Cu, Cd, Zn, Pb, and Hg), and arsenic in food samples from Huelva (Spain): Levels and health implications. J. Agr. Food. Chem. 2004, 52, 992–1001. [Google Scholar]
  9. Fargasova, A. Toxicity comparison of some possible toxic metals (Cd, Cu, Pb, Se, Zn) on young seedlings of Sinapis alba L. Plant Soil Environ. 2004, 50, 33–38. [Google Scholar]
  10. Sharma, R.K.; Agrawal, M. Biological effects of heavy metals: An overview. J.Environ.Biol. 2005, 26, 301–313. [Google Scholar]
  11. Barocsi, A.; Csintalan, Z.; Kocsanyi, L.; Dushenkov, S.; Kuperberg, J.M.; Kucharski, R.; Richter, P.I. Optimizing phytoremediation of heavy metal-contaminated soil by exploiting plants stress adaptation. Int. J. Phytoremediation 2003, 5, 13–23. [Google Scholar]
  12. Bukvic, G.; Antunovic, M.; Popovic, S.; Rastija, M. Effect of P and Zn fertilisation on biomass yield and its uptake by maize lines (Zea mays L.). Plant Soil Environ. 2003, 49, 505–510. [Google Scholar]
  13. Garcia, G.; Zanuzzi, A.L.; Faz, A. Evaluation of heavy metal availability prior to an in situ soil phytoremediation program. Biodegradation 2005, 16, 187–194. [Google Scholar]
  14. Hanzlik, P.; Jehlicka, J.; Weishauptova, Z.; Sebek, O. Adsorption of copper, cadmium and silver from aqueous solutions onto natural carbonaceous materials. Plant Soil Environ. 2004, 50, 257–264. [Google Scholar]
  15. Smejkalova, M.; Mikanova, O.; Boruvka, L. Effects of heavy metal concentrations on biological activity of soil micro-organisms. Plant Soil Environ. 2003, 49, 321–326. [Google Scholar]
  16. Cohen-Shoel, N.; Ilzycer, D.; Gilath, I.; Tel-Or, E. The involvement of pectin in Sr-2+ biosorption by Azolla. Water Air Soil Pollut. 2002, 135, 195–205. [Google Scholar]
  17. Clemens, S. Molecular mechanisms of plant metal tolerance and homeostasis. Planta 2001, 212, 475–486. [Google Scholar]
  18. Clemens, S.; Simm, C. Schizosaccharomyces pombe as a model for metal homeostasis in plant cells: the phytochelatin-dependent pathway is the main cadmium detoxification mechanism. New Phytol. 2003, 159, 323–330. [Google Scholar]
  19. di Toppi, L.S.; Gabbrielli, R. Response to cadmium in higher plants. Environ. Exp. Bot. 1999, 41, 105–130. [Google Scholar]
  20. Cobbett, C.S. Phytochelatins and their roles in heavy metal detoxification. Plant Physiol. 2000, 123, 825–832. [Google Scholar]
  21. Meister, A.; Anderson, M.E. Glutathione. Annu. Rev. Biochem. 1983, 52, 711–760. [Google Scholar]
  22. Kruusma, J.; Benham, A.M.; Williams, J.A.G.; Kataky, R. An introduction to thiol redox proteins in the endoplasmic reticulum and a review of current electrochemical methods of detection of thiols. Analyst 2006, 131, 459–473. [Google Scholar]
  23. Brazdova, M.; Kizek, R.; Havran, L.; Palecek, E. Determination of glutathione-S-transferase traces in preparations of p53 C-terminal domain (aa320-393). Bioelectrochemistry 2002, 55, 115–118. [Google Scholar]
  24. Mannervik, B.; Danielson, U.H. Glutathione Transferases - Structure and Catalytic Activity. Crc Crit. Rev. Biochem. 1988, 23, 283–337. [Google Scholar]
  25. Habig, W.H.; Pabst, M.J.; Jakoby, W.B. Glutathione S-Transferases - First Enzymatic Step in Mercapturic Acid Formation. J. Biol. Chem. 1974, 249, 7130–7139. [Google Scholar]
  26. Vitecek, J.; Petrlova, J.; Petrek, J.; Adam, V.; Potesil, D.; Havel, L.; Mikelova, R.; Trnkova, L.; Kizek, R. Electrochemical study of S-nitrosoglutathione and nitric oxide by carbon fibre NO sensor and cyclic voltammetry - possible way of monitoring of nitric oxide. Electrochim. Acta 2006, 51, 5087–5094. [Google Scholar]
  27. Mayer, B.; Pfeiffer, S.; Schrammel, A.; Koesling, D.; Schmidt, K.; Brunner, F. A new pathway of nitric oxide cyclic GMP signaling involving S-nitrosoglutathione. J. Biol. Chem. 1998, 273, 3264–3270. [Google Scholar]
  28. Clancy, R.M.; Levartovsky, D.; Leszczynskapiziak, J.; Yegudin, J.; Abramson, S.B. Nitric-Oxide Reacts with Intracellular Glutathione and Activates the Hexose-Monophosphate Shunt in Human Neutrophils - Evidence for S-Nitrosoglutathione as a Bioactive Intermediary. Proc. Natl. Acad. Sci. U. S. A. 1994, 91, 3680–3684. [Google Scholar]
  29. Lu, S.C. Regulation of hepatic glutathione synthesis: current concepts and controversies. Faseb J. 1999, 13, 1169–1183. [Google Scholar]
  30. Schafer, F.Q.; Buettner, G.R. Redox environment of the cell as viewed through the redox state of the glutathione disulfide/glutathione couple. Free Radic. Biol. Med. 2001, 30, 1191–1212. [Google Scholar]
  31. Cobbett, C.S. Phytochelatin biosynthesis and function in heavy-metal detoxification. Curr. Opin. Plant Biol. 2000, 3, 211–216. [Google Scholar]
  32. Rauser, W.E. Phytochelatins and Related Peptides - Structure, Biosynthesis, and Function. Plant Physiol. 1995, 109, 1141–1149. [Google Scholar]
  33. Rauser, W.E. Phytochelatins. Annu. Rev. Biochem. 1990, 59, 61–86. [Google Scholar]
  34. Grill, E.; Loffler, S.; Winnacker, E.L.; Zenk, M.H. Phytochelatins, the Heavy-Metal-Binding Peptides of Plants, Are Synthesized from Glutathione by a Specific Gamma-Glutamylcysteine Dipeptidyl Transpeptidase (Phytochelatin Synthase). Proc. Natl. Acad. Sci. U. S. A. 1989, 86, 6838–6842. [Google Scholar]
  35. Grill, E.; Winnacker, E.L.; Zenk, M.H. Phytochelatins, a Class of Heavy-Metal-Binding Peptides from Plants, Are Functionally Analogous to Metallothioneins. Proc. Natl. Acad. Sci. U. S. A. 1987, 84, 439–443. [Google Scholar]
  36. Ramos, J.; Clemente, M.R.; Naya, L.; Loscos, J.; Perez-Rontome, C.; Sato, S.; Tabata, S.; Becana, M. Phytochelatin synthases of the model legume Lotus japonicus. A small multigene family with differential response to cadmium and alternatively spliced variants. Plant Physiol. 2007, 143, 1110–1118. [Google Scholar]
  37. Kawakami, S.K.; Gledhill, M.; Achterberg, E.P. Determination of phytochelatins and glutathione in phytoplankton from natural waters using HPLC with fluorescence detection. Trac-Trends Anal. Chem. 2006, 25, 133–142. [Google Scholar]
  38. Bramanti, E.; Toncelli, D.; Morelli, E.; Lampugnani, L.; Zamboni, R.; Miller, K.E.; Zemetra, J.; D'Ulivo, A. Determination and characterization of phytochelatins by liquid chromatography coupled with on line chemical vapour generation and atomic fluorescence spectrometric detection. J. Chromatogr. A 2006, 1133, 195–203. [Google Scholar]
  39. Bramanti, E.; Lomonte, C.; Onor, M.; Zamboni, R.; D'Ulivo, A.; Raspi, G. Mercury speciation by liquid chromatography coupled with on-line chemical vapour generation and atomic fluorescence spectrometric detection (LC-CVGAFS). Talanta 2005, 66, 762–768. [Google Scholar]
  40. Kang, S.H.; Kim, J.W.; Chung, D.S. Determination of homocysteine and other thiols in human plasma by capillary electrophoresis. J. Pharmaceut. Biomed. 1997, 15, 1435–1441. [Google Scholar]
  41. Kand'ar, R.; Zakova, P.; Lotkova, H.; Kucera, O.; Cervinkova, Z. Determination of reduced and oxidized glutathione in biological samples using liquid chromatography with fluorimetric detection. J. Pharm. Biomed. Anal. 2007, 43, 1382–1387. [Google Scholar]
  42. Hiraku, Y.; Murata, M.; Kawanishi, S. Determination of intracellular glutathione and thiols by high performance liquid chromatography with a gold electrode at the femtomole level: comparison with a spectroscopic assay. BBA-Gen. Subjects 2002, 1570, 47–52. [Google Scholar]
  43. Norris, R.L.; Eaglesham, G.K.; Shaw, G.R.; Smith, M.J.; Chiswell, R.K.; Seawright, A.A.; Moore, M.R. A sensitive and specific assay for glutathione with potential application to glutathione disulphide, using high-performance liquid chromatography-tandem mass spectrometry. J. Chromatogr. B 2001, 762, 17–23. [Google Scholar]
  44. Petrlova, J.; Mikelova, R.; Stejskal, K.; Kleckerova, A.; Zitka, O.; Petrek, J.; Havel, L.; Zehnalek, J.; Adam, V.; Trnkova, L.; Kizek, R. Simultaneous determination of eight biologically active thiol compounds using gradient elution-liquid chromatography with Coul-Array detection. J. Sep. Sci. 2006, 29, 1166–1173. [Google Scholar]
  45. Petrlova, J.; Potesil, D.; Mikelova, R.; Blastik, O.; Adam, V.; Trnkova, L.; Jelen, F.; Prusa, R.; Kukacka, J.; Kizek, R. Attomole voltammetric determination of metallothionein. Electrochim. Acta 2006, 51, 5112–5119. [Google Scholar]
  46. Potesil, D.; Mikelova, R.; Adam, V.; Kizek, R.; Prusa, R. Change of the protein p53 electrochemical signal according to its structural form - Quick and sensitive distinguishing of native, denatured, and aggregated form of the “guardian of the genome”. Protein J. 2006, 25, 23–32. [Google Scholar]
  47. Potesil, D.; Petrlova, J.; Adam, V.; Vacek, J.; Klejdus, B.; Zehnalek, J.; Trnkova, L.; Havel, L.; Kizek, R. Simultaneous femtomole determination of cysteine, reduced and oxidized glutathione, and phytochelatin in maize (Zea mays L.) kernels using high-performance liquid chromatography with electrochemical detection. J. Chromatogr. A 2005, 1084, 134–144. [Google Scholar]
  48. Spadaro, A.; Bousquet, E.; Santagati, N.A.; Vittorio, F.; Ronsisvalle, G. Simple analysis of glutathione in human colon carcinoma cells and epidermoid human larynx carcinoma cells by HPLC with electrochemical detection. Chromatographia 2005, 62, 11–15. [Google Scholar]
  49. Salimi, A.; Hallaj, R. Catalytic oxidation of thiols at preheated glassy carbon electrode modified with abrasive immobilization of multiwall carbon nanotubes: applications to amperometric detection of thiocytosine, L-cysteine and glutathione. Talanta 2005, 66, 967–975. [Google Scholar]
  50. Zhang, W.; Wan, F.L.; Zhu, W.; Xu, H.H.; Ye, X.Y.; Cheng, R.Y.; Jin, L.T. Determination of glutathione and glutathione disulfide in hepatocytes by liquid chromatography with an electrode modified with functionalized carbon nanotubes. J. Chromatogr. B 2005, 818, 227–232. [Google Scholar]
  51. Hiraku, Y.; Murata, M.; Kawanishi, S. Determination of intracellular glutathione and thiols by high performance liquid chromatography with a gold electrode at the femtomole level: comparison with a spectroscopic assay. Biochim. Biophys. Acta-Gen. Subj. 2002, 1570, 47–52. [Google Scholar]
  52. Zhang, S.; Sun, W.L.; Xian, Y.Z.; Zhang, W.; Jin, L.T.; Yamamoto, K.; Tao, S.G.; Jin, J.Y. Multichannel amperometric detection system for liquid chromatography to assay the thiols in human whole blood using the platinum microelectrodes chemically modified by copper tetraaminophthalocyanine. Anal. Chim. Acta 1999, 399, 213–221. [Google Scholar]
  53. Zitka, O.; Stejskal, K.; Kleckerova, A.; Adam, V.; Beklova, M.; Horna, A.; Supalkova, V.; Havel, L.; Kizek, R. Utilizing electrochemical techniques for detection of biological samples. Chem. Listy 2007, 101, 225–231. [Google Scholar]
  54. Xu, F.; Wang, L.; Gao, M.N.; Jin, L.T.; Jin, J.Y. Amperometric determination of glutathione and cysteine on a Pd-IrO2 modified electrode with high performance liquid chromatography in rat brain microdialysate. Anal. Bioanal. Chem. 2002, 372, 791–794. [Google Scholar]
  55. Klejdus, B.; Zehnalek, J.; Adam, V.; Petrek, J.; Kizek, R.; Vacek, J.; Trnkova, L.; Rozik, R.; Havel, L.; Kuban, V. Sub-picomole high-performance liquid chromatographic/mass spectrometric determination of glutathione in the maize (Zea mays L.) kernels exposed to cadmium. Anal. Chim. Acta 2004, 520, 117–124. [Google Scholar]
  56. Petrek, J.; Vitecek, J.; Vlasinova, H.; Kizek, R.; Kramer, K.J.; Adam, V.; Klejdus, B.; Havel, L. Application of computer imaging, stripping voltammetry and mass spectrometry to study the effect of lead (Pb-EDTA) on the growth and viability of early somatic embryos of Norway spruce (Picea abies/L./Karst.). Anal. Bioanal. Chem. 2005, 383, 576–586. [Google Scholar]
  57. El-Zohri, M.H.A.; Cabala, R.; Frank, H. Quantification of phytochelatins in plants by reversed-phase HPLC-ESI-MS-MS. Anal. Bioanal. Chem. 2005, 382, 1871–1876. [Google Scholar]
  58. Gomez-Ariza, J.L.; Garcia-Barrera, T.; Lorenzo, F.; Bernal, V.; Villegas, M.J.; Oliveira, V. Use of mass spectrometry techniques for the characterization of metal bound to proteins (metallomics) in biological systems. Anal. Chim. Acta 2004, 524, 15–22. [Google Scholar]
  59. Rellan-Alvarez, R.; Hernandez, L.E.; Abadia, J.; Alvarez-Fernandez, A. Direct and simultaneous determination of reduced and oxidized glutathione and homoglutathione by liquid chromatographyelectrospray/mass spectrometry in plant tissue extracts. Anal. Biochem. 2006, 356, 254–264. [Google Scholar]
  60. Kupper, H.; Mijovilovich, A.; Meyer-Klaucke, W.; Kroneck, P.M.H. Tissue- and age-dependent differences in the complexation of cadmium and zinc in the cadmium/zinc hyperaccumulator Thlaspi caerulescens (Ganges ecotype) revealed by X-ray absorption spectroscopy. Plant Physiol. 2004, 134, 748–757. [Google Scholar]
  61. Sestakova, I.; Mader, P. Voltammetry on mercury and carbon electrodes as a tool for studies of metallothionein interactions with metal ions. Cell. Mol. Biol. 2000, 46, 257–267. [Google Scholar]
  62. Alberich, A.; Arino, C.; Diaz-Cruz, J.M.; Esteban, M. Multivariate curve resolution applied to the simultaneous analysis of electrochemical and spectroscopic data: Study of the Cd(II)/glutathione-fragment system by voltammetry and circular dichroism spectroscopy. Anal. Chim. Acta 2007, 584, 403–409. [Google Scholar]
  63. Huska, D.; Zitka, O.; Adam, V.; Beklova, M.; Krizkova, S.; Zeman, L.; Horna, A.; Havel, L.; Zehnalek, J.; Kizek, R. A sensor for investigating the interaction between biologically important heavy metals and glutathione. Czech J. Anim. Sci. 2007, 52, 37–43. [Google Scholar]
  64. Cruz, B.H.; Diaz-Cruz, J.M.; Sestakova, I.; Velek, J.; Arino, C.; Esteban, M. Differential pulse voltammetric study of the complexation of Cd(II) by the phytochelatin (gamma-Glu-Cys)(2)Gly assisted by multivariate curve resolution. J. Electroanal. Chem. 2002, 520, 111–118. [Google Scholar]
  65. Adam, V.; Zehnalek, J.; Petrlova, J.; Potesil, D.; Sures, B.; Trnkova, L.; Jelen, F.; Vitecek, J.; Kizek, R. Phytochelatin modified electrode surface as a sensitive heavy-metal ion biosensor. Sensors 2005, 5, 70–84. [Google Scholar]
  66. Krizkova, S.; Adam, V.; Petrlova, J.; Zitka, O.; Stejskal, K.; Zehnalek, J.; Sures, B.; Trnkova, L.; Beklova, M.; Kizek, R. A suggestion of electrochemical biosensor for study of Platinum(II)-DNA interactions. Electroanalysis 2007, 19, 331–338. [Google Scholar]
  67. Petrlova, J.; Potesil, D.; Zehnalek, J.; Sures, B.; Adam, V.; Trnkova, L.; Kizek, R. Cisplatin electrochemical biosensor. Electrochim. Acta 2006, 51, 5169–5173. [Google Scholar]
  68. Prusa, R.; Petrlova, J.; Kukacka, J.; Adam, V.; Sures, B.; Beklova, M.; Kizek, R. Study of interaction of glutathiones and metallothionein with cytostatics. Clin. Chem. 2006, 52, A175–A175. [Google Scholar]
  69. Vasilescu, I.; Litescu, S.; Radu, G.L. Electrochemical study of pH influence on the behaviour of the cystine-cysteine system. Rev. Chim. 2006, 57, 955–959. [Google Scholar]
  70. Serrano, N.; Sestakova, I.; Diaz-Cruz, J.M.; Arino, C. Adsorptive accumulation in constant current stripping chronopotentiometry as an alternative for the electrochemical study of metal complexation by thiol-containing peptides. J. Electroanal. Chem. 2006, 591, 105–117. [Google Scholar]
  71. Tang, H.; Chen, J.H.; Nie, L.H.; Yao, S.Z.; Kuang, Y.F. Electrochemical oxidation of glutathione at well-aligned carbon nanotube array electrode. Electrochim. Acta 2006, 51, 3046–3051. [Google Scholar]
  72. Dorcak, V.; Sestakova, I. Electrochemical behavior of phytochelatins and related peptides at the hanging mercury drop electrode in the presence of cobalt(II) ions. Bioelectrochemistry 2006, 68, 14–21. [Google Scholar]
  73. Han, H.Y.; Tachikawa, H. Electrochemical determination of thiols at single-wall carbon nanotubes and PQQ modified electrodes. Front. Biosci. 2005, 10, 931–939. [Google Scholar]
  74. Mladenov, M.; Mirceski, V.; Gjorgoski, I.; Jordanoski, B. Redox kinetic measurements of glutathione at the mercury electrode by means of square-wave voltammetry. The role of copper, cadmium and zinc ions. Bioelectrochemistry 2004, 65, 69–76. [Google Scholar]
  75. Budnikov, G.K.; Ziyatdinova, G.K.; Valitova, Y.R. Electrochemical determination of glutathione. J. Anal. Chem. 2004, 59, 573–576. [Google Scholar]
  76. Kizek, R.; Vacek, J.; Trnkova, L.; Jelen, F. Cyclic voltammetric study of the redox system of glutathione using the disulfide bond reductant tris(2-carboxyethyl)phosphine. Bioelectrochemistry 2004, 63, 19–24. [Google Scholar]
  77. Vacek, J.; Petrek, J.; Kizek, R.; Havel, L.; Klejdus, B.; Trnkova, L.; Jelen, F. Electrochemical determination of lead and glutathione in a plant cell culture. Bioelectrochemistry 2004, 63, 347–351. [Google Scholar]
  78. Calvo-Marzal, P.; Chumbimuni-Torres, K.Y.; Hoehr, N.F.; Neto, G.D.; Kubota, L.T. Determination of reduced glutathione using an amperometric carbon paste electrode chemically modified with TTF-TCNQ. Sens. Actuator B-Chem. 2004, 100, 333–340. [Google Scholar]
  79. Salimi, A.; Pourbeyram, S. Renewable sol-gel carbon ceramic electrodes modified with a Ru-complex for the amperometric detection of L-cysteine and glutathione. Talanta 2003, 60, 205–214. [Google Scholar]
  80. Seymour, E.H.; Wilkins, S.J.; Lawrence, N.S.; Compton, R.G. Electrochemical detection of glutathione: An electrochemically initiated reaction pathway. Anal. Lett. 2002, 35, 1387–1399. [Google Scholar]
  81. Zeng, B.Z.; Ding, X.G.; Zhao, F.Q. Voltammetric response of glutathione and 3-mercaptopropionic acid self-assembled monolayer modified gold electrodes to Cu(II). Electroanalysis 2002, 14, 651–656. [Google Scholar]
  82. Supalkova, V.; Petrek, J.; Baloun, J.; Adam, V.; Bartusek, K.; Trnkova, L.; Beklova, M.; Diopan, V.; Havel, L.; Kizek, R. Multi-instrumental investigation of affecting of early somatic embryos of Spruce by cadmium(II) and lead(II) ions. Sensors 2007, 7, 743–759. [Google Scholar]
  83. Richter, O. Beiträge zur Ernährungsphysiologie der Kulturgräser. I. Uber das grosse Eisenbedürfnis der Reispflanze (Oriza sativa L.). Sitz.-Ber. Akad. Wiss. 1926, 203–242. [Google Scholar]
  84. Hoagland, D.R.; Snyder, W.C. Nutrition of strawberry under controlled conditions. (a) Effects of deficies of boron and certain other elements, (b) susceptibility to injury from sodium salts. Proc. Amer. Soc. Horticult. Sci. 1933, 1930, 288–294. [Google Scholar]
  85. Zaidi, P.H.; Rafique, S.; Singh, N.N. Response of maize (Zea mays L.) genotypes to excess soil moisture stress:morpho-physiological effects and basis of tolerance. Europ. J. Agronomy 2003, 19, 383–399. [Google Scholar]
  86. Rauser, W.E.; Meuwly, P. Retention of cadmium in roots of maize seedlings - role of complexation phytochelatins and related thiol peptides. Plant Physiol. 1995, 109, 195–202. [Google Scholar]
  87. di Toppi, S.L.; Gabbrielli, R. Response to cadmium in higher plants. Environ. Exp. Bot. 1999, 41, 105–130. [Google Scholar]
  88. Strouhal, M.; Kizek, R.; Vecek, J.; Trnkova, L.; Nemec, M. Electrochemical study of heavy metals and metallothionein in yeast Yarrowia lipolytica. Bioelectrochemistry 2003, 60, 29–36. [Google Scholar]
  89. Waalkes, M.P. Cadmium carcinogenesis in rewiew. J. Inorg. Biochem. 2000, 79, 241–244. [Google Scholar]
  90. Kosobrukhov, A.; Knyazeva, I.; Mudrik, V. Plantago major plants responses to increase content of lead in soil: Growth and photosynthesis. Plant Growth Reg. 2004, 42, 145–151. [Google Scholar]
  91. Prasad, M.N.V. Cadmium toxicity and tolerance in vascular plants. Environ. Exp. Bot. 1995, 35, 525–545. [Google Scholar]
  92. Fojtova, M.; Kovarik, A. Genotoxic effect of cadmium is associated with apoptotic changes in tobacco cells. Plant Cell Environ. 2000, 23, 531–537. [Google Scholar]
  93. Cobbett, C.S.; Goldsbrough, P.B. Phytochelatins and metallothioneins: roles in heavy metal detoxification and homeostasis. Annu. Rev. Plant Biol. 2002, 53, 159–182. [Google Scholar]
  94. Stolt, J.P.; Sneller, F.E.C.; Bryngelsson, T.; Lundborg, T.; Schat, H. Phytochelatin and cadmium accumulation in wheat. Environ. Exp. Bot. 2003, 49, 21–28. [Google Scholar]
  95. Cosio, C.; Martinoia, E.; Keller, C. Hyperaccumulation of cadmium and zinc in Thlaspi caerulescens and Arabidopsis halleri at the leaf cellular level. Plant Physiol. 2004, 134, 716–725. [Google Scholar]
  96. Grill, E.; Winnacker, E.L.; Zenk, M.H. Phytochelatins: the principal heavy-metal complexing peptides of higher plants. Science 1985, 320, 674–676. [Google Scholar]
  97. Urdaneta, A.; Jimenez, A.R.; Izquierdo, D.; Paramio, M.T. Effect of the addition of glutathione and glucose to the culture medium on embryo development of IVM-IVF prepubertal goat oocytes. Zygote 2003, 11, 131–138. [Google Scholar]
  98. Inoue, Y.; Moriyasu, Y. Degradation of membrane phospholipids in plant cells cultured in sucrose-free medium. Autophagy 2006, 2, 244–246. [Google Scholar]
  99. Zechmann, B.; Muller, M.; Zellnig, G. Intracellular adaptations of glutathione content in Cucurbita pepo L. induced by treatment with reduced glutathione and buthionine sulfoximine. Protoplasma 2006, 227, 197–209. [Google Scholar]
  100. Nunez-Vergara, L.J.; Squella, J.A.; Olea-Azar, C.; Bollo, S.; Navarrete-Encina, P.A.; Sturm, J.C. Nitrosobenzene: electrochemical, UV-visible and EPR spectroscopic studies on the nitrosobenzene free radical generation and its interaction with glutathione. Electrochim. Acta 2000, 45, 3555–3561. [Google Scholar]
  101. Vogeli-Lange, R.; Wagner, G.J. Subcellular localization of cadmium and cadmium-binding peptides in tobacco leaves. Plant Physiol. 1990, 92, 1086–1093. [Google Scholar]
  102. Gupta, D.K.; Tohoyama, H.; Joho, M.; Inouhe, M. Possible roles of phytochelatins and glutathione metabolism in cadmium tolerance in chickpea roots. J. Plant Res. 2002, 115, 429–437. [Google Scholar]
  103. Mazen, A.M.A. Calcium oxalate deposits in leaves of Corchorus olitotius as related to accumulation of toxic metals. Russ. J. Plant Physiol. 2004, 51, 281–285. [Google Scholar]
  104. Potters, G.; De Gara, L.; Asard, H.; Horemans, N. Ascorbate and glutathione: guardians of the cell cycle, partners in crime? Plant. Physiol. Bioch. 2002, 40, 537–548. [Google Scholar]
  105. Wang, Y.; Fang, J.; Leonard, S.S.; Rao, K.M.K. Cadmium inhibits the electron transfer chain and induces reactive oxygen species. Free Radic. Biol. Med. 2004, 36, 1434–1443. [Google Scholar]
  106. Lux, A.; Sottnikova, A.; Opatrna, J.; Greger, M. Differencens in structure of adventitious roots in Salix clones with contrasting characteristics of cadmium accumulation and sensitivity. Physiol Plantarum 2004, 120, 537–545. [Google Scholar]
  107. Lai, H.-Y.; Chen, Z.-S. Effects of EDTA on solubility of cadmium, zinc, and lead and their uptake by rainbow pink and vetiver grass. Chemosphere 2004, 55, 421–430. [Google Scholar]
  108. Romero-Puertas, M.C.; Palma, J.M.; Gomez, M.; Del Rio, L.A.; Sandalio, L.M. Cadmium causes the oxidative modification of proteins in pea plants. Plant Cell Environ. 2002, 2002, 677–686. [Google Scholar]
  109. Bartolf, M.; Brennan, E.; Price, C.A. Partial characterization of a cadmium-binding protein from the roots of cadmium-treated tomato. Plant Physiol. 1980, 66, 438–441. [Google Scholar]
  110. Carrier, P.; Baryla, A.; Havaux, M. Cadmium distribution and microlocalization in oilseed rape (Brassica napus) after long-term growth on cadmium-contaminated soil. Planta 2003, 216, 939–950. [Google Scholar]
  111. Heyrovsky, M.; Mader, P.; Vavricka, S.; Vesela, V.; Fedurco, M. The anodic reaction at mercury electrodes due to cystein. J. Electroanal. Chem. 1997, 430, 103–117. [Google Scholar]
  112. Vogeli-Lange, R.; Wagner, G.J. Relationship between cadmium, glutathione and cadmium-binding peptides (phytochelatins) in leaves of intact tobacco seedlings. Plant Sci. 1996, 114, 11–18. [Google Scholar]
  113. Kahle, H. Response of roots of trees to heavy metals. Environ. Exp. Bot. 1993, 33, 99–119. [Google Scholar]
  114. Inouhe, M.; Ito, R.; Ito, S.; Sasada, N.; Tohoyama, H.; Joho, M. Azuki bean cells are hypersensitive to cadmium and do not synthesize phytochelatins. Plant Physiol. 2000, 123, 1029–1036. [Google Scholar]
  115. Inouhe, M.; Ninomiya, S.; Tohoyama, H.; Joho, M.; Murayama, T. Different characteristics of roots in the cadmium-tolerance and Cd-binding complex formation between mono- and dicotyledonous plants. J. Plant. Res. 1994, 107, 201–207. [Google Scholar]
  116. Chen, Y.X.; He, Y.F.; Luo, Y.M.; Yu, Y.L.; Lin, Q.; Wong, M.H. Physiological mechanism of plant roots exposed to cadmium. Chemosphere 2003, 50, 789–793. [Google Scholar]
  117. Leopold, I.; Gunther, D.; Schmidt, J.; Neumann, D. Phytochelatins and heavy metal tolerance. Phytochemistry 1999, 50, 1323–1328. [Google Scholar]
  118. Hu, S.X.; Lau, K.W.K.; Wu, M. Cadmium sequestration in Chlamydomonas reinhardtii. Plant Sci. 2001, 161, 987–996. [Google Scholar]
  119. Tsuji, T.; Hirayanagi, N.; Iwabe, O.; Namba, T.; Taqawa, M.; Miyamoto, S.; Miyasaka, H.; Takagi, M.; Hirata, K.; Miyamoto, K. Regulation of phytochelatin synthesis by zinc and cadmium in marine green alga, Dunaliella tertiolecta. Phytochemistry 2003, 62, 453–459. [Google Scholar]
Abbreviations
GSH
reduced glutathione
GSSG
oxidized glutathione
PC2
phytochelatin2
M-PC complex
metal-phytochelatin complex
LMW
low molecular weight
HMW
high molecular weight
MS medium
Murashige-Skoog medium
HMDE
hanging mercury drop electrode
CV
cyclic voltammetry
DPASV
differential pulse anodic stripping voltammetry
SH
sulfhydryl group
FIA
flow injection analysis
HPLC
high performance liquid chromatography
ED
electrochemical detection
Figure 1. The basic scheme of maintaining of metals homeostasis and heavy metals distribution at plants [19,20].
Sensors 07 00932f1
Figure 2. The scheme of cadmium detoxification by phytochelatins in a plant cell. Cadmium ions are transported through proton pump into the vacuole. Here, cadmium ions activate phytochelatin synthase, which form with the metals ions the M-PC complex (LMW Cd). This complex is consequently transported through tonoplast to vacuole (ATP consumption). Here, low molecular complex is transformed to high molecular weight M-PC complex (HMW M-PC) via –S–S– groups [17,18].
Sensors 07 00932f2
Figure 3. Experimental scheme of maize plant used for cadmium and thiols determination (A). Total transpiration of control plants; transpiration was calculated according the procedure given in Material and methods. In inset: dependence of temperature and humidity during maize cultivation in greenhouse (0 – 22 days); the arrow indicates cadmium addition (B).
Sensors 07 00932f3
Figure 4. Interaction of phytochelatin with cadmium measured with Autolab Analyser. (A) Cyclic voltammograms of phytochelatin (10, 50 and 100 μM). (B) Influence of phytochelatin additions (0 – 500 μM) on cadmium signals (150 μM). Arrows indicate changes of cadmium signals with increasing phytochelatin concentration. (C) Dependence of decrease of cadmium signal (150 μM of cadmium(II) ions) on phytochelatin additions (0 – 500 μM), changes within the range of (a) 0 – 150 μM and (b) 150 -500 μM. Peak height of 100% corresponds to 717 nA. CV parameters were as follows: the initial potential of –0.2 V, the end potential –0.8 V and step potential 5 mV.
Sensors 07 00932f4
Figure 5. (A) Changes in concentration of “free” GSH with increasing concentration of MS medium to supporting electrolyte, time of interaction 4 min, stirring 1400 rpm and deoxygenating by argon. (B) Dependence of GSH concentration on time of interaction with ½ MS medium; in inset: typical voltammograms of GSH measured in ½ MS medium at 0, 4 and 8 h long interaction. GSH concentration 100 μM, temperature 25 °C. Peak height of 100 % corresponds to 390 nA.
Sensors 07 00932f5
Figure 6. (A) Hydrodynamic voltammograms of GSH, GSSG and PC2 (1 μM), temperature 25 °C; inset: comparison of peak heights of GSH, GSSG and PC2 and flow-amperometric responses of PC2 (0.5, 1 and 1.5 μM). Peak height of 100 % corresponds to 890 μA. (Ba) Flow-amperometric record of interaction of PC2 (14 μM) with cadmium(II) ions (0, 20, 40, 65, 88 and 110 μM). (Bb) Dependence of PC2 peak height on increasing concentration of cadmium(II) ions. Potential: 900 mV.
Sensors 07 00932f6
Figure 7. Dependences of fresh weight: FW (A), and dry weight: DW (B) of maize plant parts on cadmium treatment time. Maize plants (hybrid Gila) were cultivated hydroponically for 192 h and the roots were treated with or without 10 and 100 μM Cd. Data are expressed as means (n = 5).
Sensors 07 00932f7
Figure 8. Electrochemical determination of zinc, cadmium, lead and copper by DPASV; calibration curve of heavy metals in acetate buffer (pH 5.6) (A); tA 60 s at–0.7 V; Estart –0.7 V; Estop 0 V, step potential 5 mV, modulation amplitude 0.05 mV, time interval 0.26 s; changes of cadmium content in nutrient solution during cultivation of plants (B); initial concentration of cadmium was taken as 100 %.
Sensors 07 00932f8
Figure 9. Dependences of cadmium contents in leaves (A), stem (B), and root (C) on cadmium treatment time.
Sensors 07 00932f9
Figure 10. Electrochemical behaviour of reduced (GSH) and oxidized glutathione (GSSG) and phytochelatin2 (PC2). (A; a,b,c) Chemical formulas of GSH, GSSG and PC2, and their typical cyclic voltammograms. Thiol concentration 200 μM and scan rates (5, 25 and 50 mV/s). Dependence of (B) height and (C) potential of thiols signals on concentration (0 – 20 μM). Scan rates: 20 mV/s. Supporting electrolyte (0.05 M Na2B4O7, pH 9.2). CV parameters were as follows: step potential 5 mV, start potential −0.2 V, vertex potential −0.8 V, deoxygenating by argon for 140 s.
Sensors 07 00932f10
Figure 11. Glutathione contents and cadmium concentrations in maize plants after treating 10 μM Cd (A) 100 μM Cd (B). Sample was collected at the time 0, 96 and 192 h.
Sensors 07 00932f11
Figure 12. Cadmium concentration in one whole maize plant (A); cadmium concentration (B) and glutathione content (C) in individual parts of maize plants.
Sensors 07 00932f12

