1. Introduction
Various maritime survey methods, such as sonar, optical and magnetic technologies [
1-
3], are used for locating submerged artifacts. Marine magnetic surveys have been successfully used for mapping marine ferrous targets [
4], for magnetic mapping of contaminated seabed sediments [
5], and for mapping archeological structures [
6].
Of the various technologies used for seabed mapping, the magnetic method has proved to be the most effective for locating ferro-metallic objects masked by sea floor sediments or buried under the seabed. Because the intensity of the magnetic field produced by a magnetized body drops rapidly as the distance to the measured point increases, tow fish configuration is widely used. Optimal and safe magnetometer altitude over the seabed is maintained by adjusting the depressor wings and/or by placing the cable weights periodically along the length of the tow cable [
7]. Most modern magnetic surveys are conducted using gradiometers that consist of two or more sensors separated by a fixed distance.
There are, however, situations where the survey area features an extremely low water depth (< 10 m) and complex bottom topography, exposing the tow fish to hazardous rocks or debris.
Numerous examples of such sites are found in the field of underwater archeology; most of the discoveries have been found in shallow water regions. Underwater archaeological research conducted along the Mediterranean coast of Israel has revealed numerous remnants of shipwrecks and cargos [
8], submerged prehistoric sites from Late Pre-Pottery Neolithic (8000 years BP) to Late Chalcolithic (5200 years BP), as well as younger remains of manmade structures and shipwrecks from the Middle Bronze age (4000-3500 years BP) and latter. The evidence suggests a rapid rise in sea level over the shallow continental shelf flooding prehistoric settlements and eventually burying them under sand [
9].
Most underwater excavations are labor intensive and therefore the need to accurately locate artifacts is paramount for the success of the expedition. In such cases, magnetometer utilization on a floating platform is recommended [
10].
2. System description
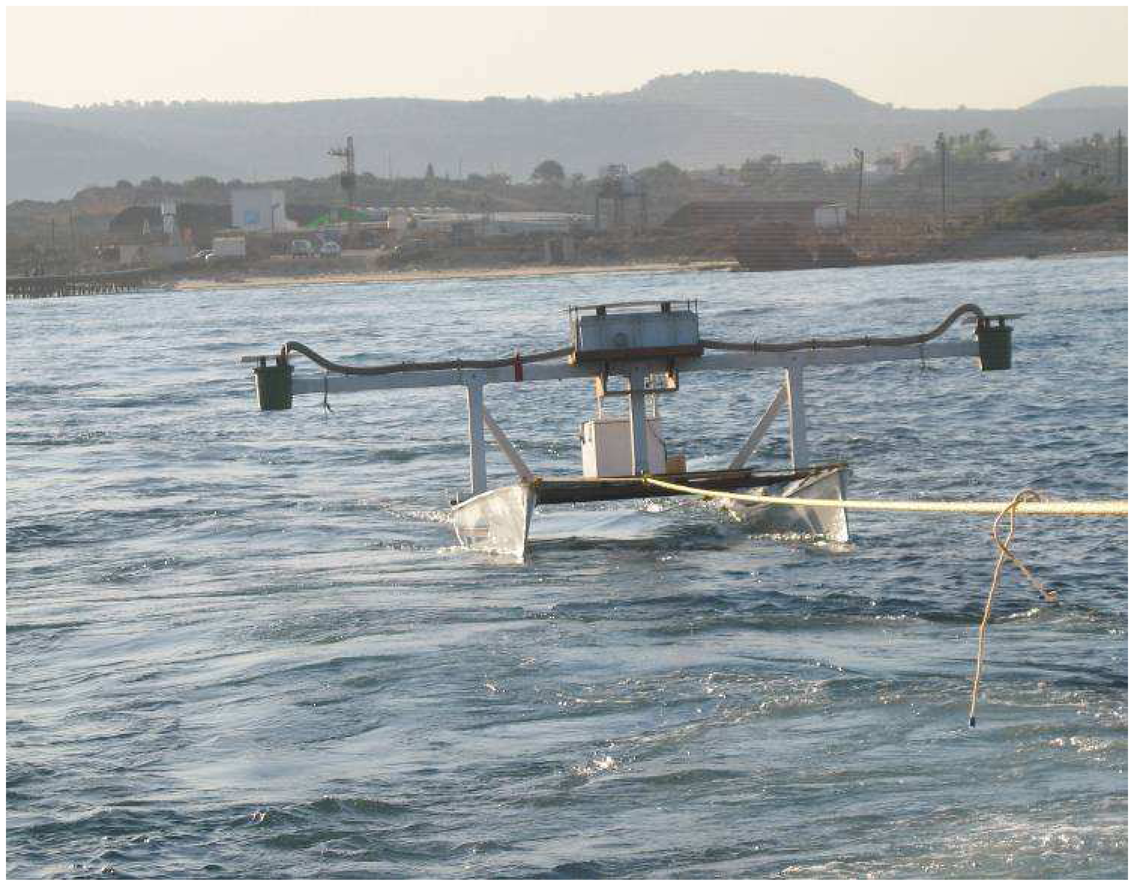
2.1. Survey vessel
A catamaran was chosen to serve as the survey vessel for the magnetic anomaly mapping mission (
Fig. 2). The catamaran is often preferred because of its width, stability and ability to explore shallow waters and access the shoreline. It is built of composite materials and therefore does not interfere with magnetic measurements. Originally designed as a non-magnetic platform for precise marine magnetic mapping [
9], the catamaran was further improved for the current mission. The adjustments included removing the drag sail, installing fixed steering blades, and adding a wooden deck for mounting the electronic equipment. The span of the Catamaran with its extended beams is roughly 5m wide, allowing the magnetic sensors to be placed at that pitch across the sail route. The sensors created a horizontal measurement system enabling its readings to be post-processed as both gradiometer and single-sensor data.
All catamaran parts were carefully inspected for the absence of magnetic noise sources. The inspection revealed that the magnetic interference of the platform was less than 10 pT at the points of sensor location.
The catamaran boat was towed approximately 40 m behind the “Kadmonit” boat of the Israel Antiquities Authority (Boston Whaler 27 feet propelled by a single Volvo Penta 220 hp engine).
2.2. Magnetometers
An optically pumped potassium magnetometer/gradiometer GSMP-30GS (GEM Systems, Canada [
8]) was used for survey magnetic measurements. Its low intrinsic sensor noise (1 pT/√Hz @ 1 Hz; and high sampling rate of 5 samples/sec allowed the accurate field and spatial resolution needed for precise magnetic mapping. Not less important was the low heading error of less than 0.05 nT for 360° full rotation about sensor axis.
Combined with comprehensive measures for reducing magnetism of electronics systems installed on catamaran (described hereinafter), this feature allowed consistent measurements for any direction of platform motion.
Since Earth's magnetic field inclination is close to 45°, installation of the sensors with vertically oriented axis provided their optimal orientation relative to the ambient magnetic field for all directions of the catamaran movement.
GSMP-30GS system comprised two sensors and a single electronics unit with a serial port interface without an additional console for manual control. Due to limited space availability, the distance between the electronics unit and the sensors was set to about 2.5 meters. According to measurements, this spatial separation was enough to reduce the influence of the electronic component's intrinsic magnetism to a negligible level. However, a stray magnetic field caused by DC electric currents flowing through electronic circuits was found to exert a noticeable influence. Because of its vector character, this stray field caused a heading error of the whole system and therefore needed to be compensated.
Compensation for the stray field was implemented by placing a homemade three-component coil inside the magnetometer electronics unit. All three coils were connected in series with a power supply voltage input (+ 24 V). The number of turns in each coil was adjusted to compensate for all stray magnetic field components. It is clear that such a solution provides compensation capability independent of the magnetometer operating modes that differ in power consumption. Magnetometer full control and data output were fed through a RS-232 data link.
2.3. Ground magnetic station
In order to compensate for the natural temporal changes of the Earth's magnetic field during the entire survey, the acquired data was referenced to a stationary-based ground magnetic station. Effective compensation for common magnetic field changes can be achieved by placing the ground station in a magnetically quiet place in the vicinity of the survey area. We were successful in finding such a place in the shore zone within less than 5 km of the survey area.
We used a GSMP-30 potassium vapor gradiometer (GEM systems, Canada) for reference magnetic measurements. Data of a single magnetic sensor served as a reference for survey data while the gradiometer readings were used as an indicator of magnetic noise level at the location of the ground station.
The ground magnetic station was equipped with a GPS that provided clock time stamps for synchronization with the survey data.
2.4. Position and orientation measurements
GPS is an effective method for positioning a vessel. However, it can sometimes be inaccurate, with margins of error of up to 20 m. In order to achieve sub-meter precision, required for archeological surveying and for the airplane wreckage survey project, a DGPS (Differential Global Positioning System) configuration was used.
A reference station was chosen and accurately measured in advance. The station (base station) sent real-time corrections to the survey vessel (rover). We have found, however, that the off-line post-processing method is more reliable.
To this end, the raw data of both rover and base devices were recorded and stored locally with subsequent recalculating of the more accurate positions with an off-line technique. This allowed us to proceed with the survey even if radio contact between the base GPS and rover GPS was severed. The DGPS system used was Navcom RT3020M.
The catamaran attitude was measured with an electronic digital Honeywell HMR3000 compass module equipped with two tilt meters. The attitude data could be used in the case of heavy sea conditions to compensate for rolling and wave noise.
2.5. Data acquisition subsystem
An on-board embedded computer was installed on the catamaran for acquiring and synchronizing the data from the magnetic gradiometer, DGPS, and electronic compass.
A RISC based embedded computer (MOXA UC-7420) with a Linux operating system was programmed to collect and synchronize data from the measurement devices. The data were available from three channels for control, data transfer and storage:
Local data recording on flash memory;
Data transmission through a radio channel with a range of ∼5 km to a shore-based control station where all the data were stored in a PC;
The embedded computer was accessible via a cellular local network that allowed monitoring of the data from anywhere in the world and establishing an interface to each of the measurement devices.
Due to insufficient reliability of channel (b), only channel (a) served as a source of survey data for subsequent analysis and processing, while channels (b) and (c) were used for on-line analysis of data quality and for system control.
2.6. Power supply
Two series-connected 12 V lead-acid batteries (Volta 60023-BT, 12 V 100 Ah) were used as a primary power source. It was sufficient to continuously power the system for two survey days.
Special attention was paid to avoid possible magnetic interference produced by the batteries. Based on our measurements, it turned out that the batteries featured negligible magnetism in passive (unloaded) state. However, when connected to all catamaran-based power consumers, they produced a noticeable (more than 0.2 nT at 3 m) stray magnetic field that required compensation.
As in the case of the magnetometer electronics unit, compensation was achieved by connecting a small coil in series with batteries. In this specific case only the vertical component of a stray magnetic field had an appreciable value, while horizontal components were balanced by placing the batteries in the opposite direction.
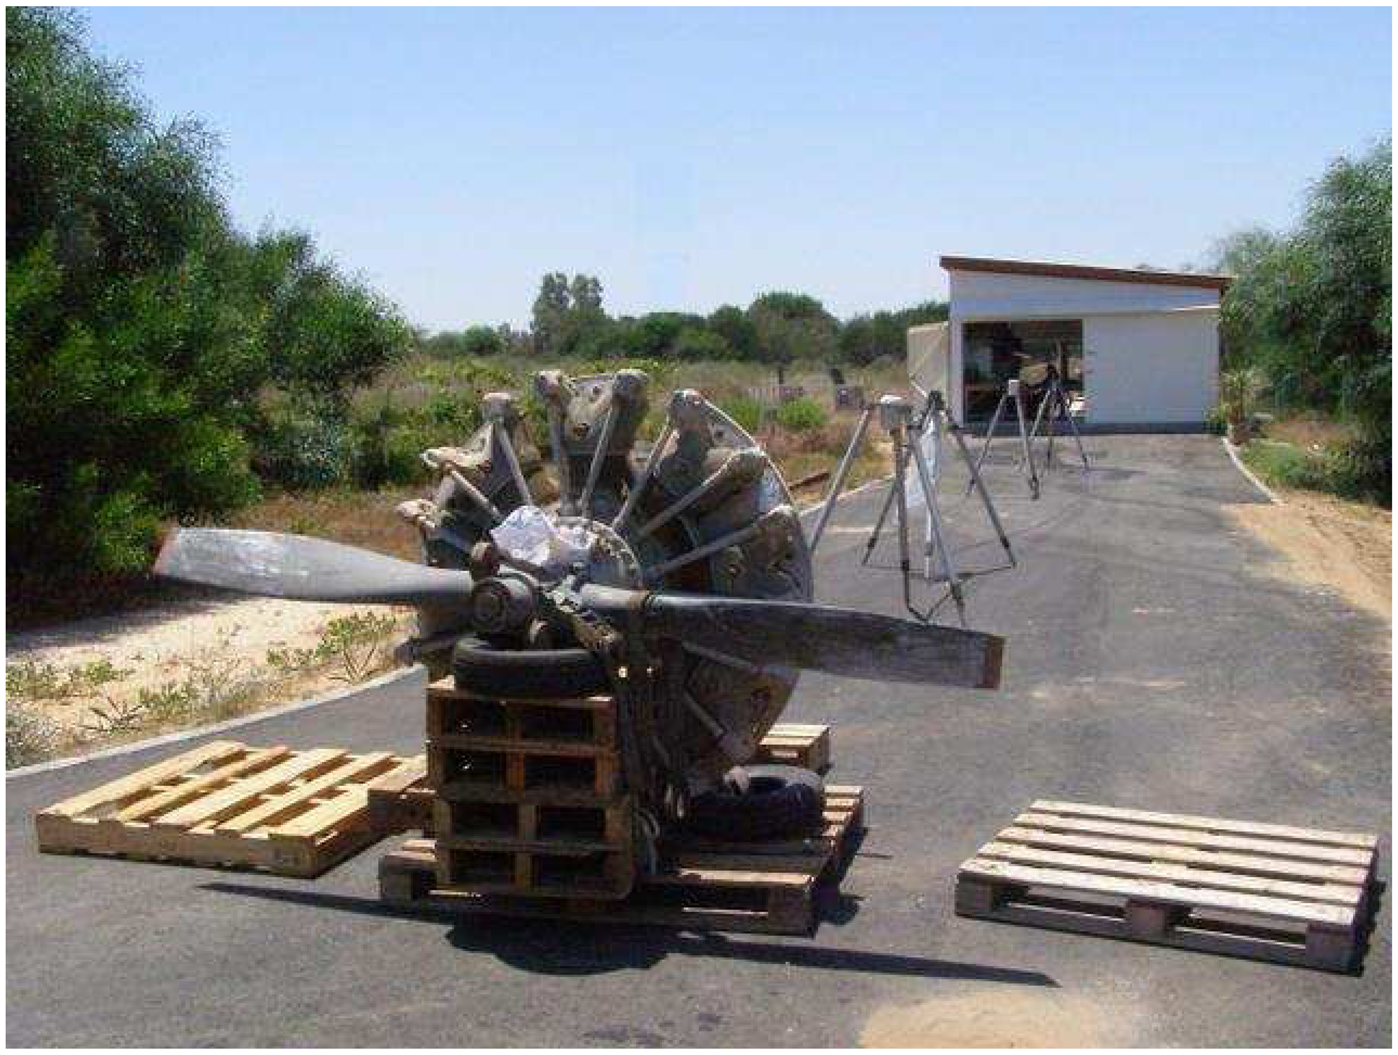
3. Survey goal
As mentioned above, one of the primary purposes of the survey was to search for the wreck of a T-6 Harvard airplane that crashed in 1960. Most of the airplane parts were made of non-ferromagnetic materials. Its engine, however, contained parts consisting of ferromagnetic materials. The T-6 airplane was equipped with a radial internal-combustion engine - model Pratt and Whitney R-1340 “Wasp”. Fortunately, an example of such engine was available with the help of Israel Air Force museum in “Hazerim”. To estimate the anticipated level of the magnetic anomaly produced by the engine, we performed measurements of its magnetic moment.
To this end in view, we measured the magnetic field produced by the engine at a certain distance (5 meters) with different positions of the engine relative to the ambient Earth's magnetic field (
Fig. 3). The measurement set was chosen so as to distinguish between induced and remnant magnetism along each of the three mutually orthogonal axes. Obtained values of engine magnetic moments made up (8.5; 9.0; 11.0) Am
2 for induced magnetism. These values corresponded to the intensity of the magnetizing field of about 0.3 Oe which is close to both horizontal and vertical component of local Earth's magnetic field. Remnant magnetic moment components of measured sample were (5.5; 2.0; 4.5) Am
2.
Of course, value and direction of remnant magnetism can vary substantially for different engine samples. However, as in the case of UXO, remnant magnetism of the wreckage gains its value during striking water surface and/or seabed. Therefore, remnant magnetism is unlikely to be oriented opposite to the induced one.
With maximal water depth of approximately 25 meters over the survey area, the magnetic anomaly intensity on the water surface produced by the buried engine could be estimated at 0.2 nT in dipole approximation. In practice this figure could be even smaller since aircraft parts may be scattered forming a kind of magnetic cluster instead of a pure dipole.
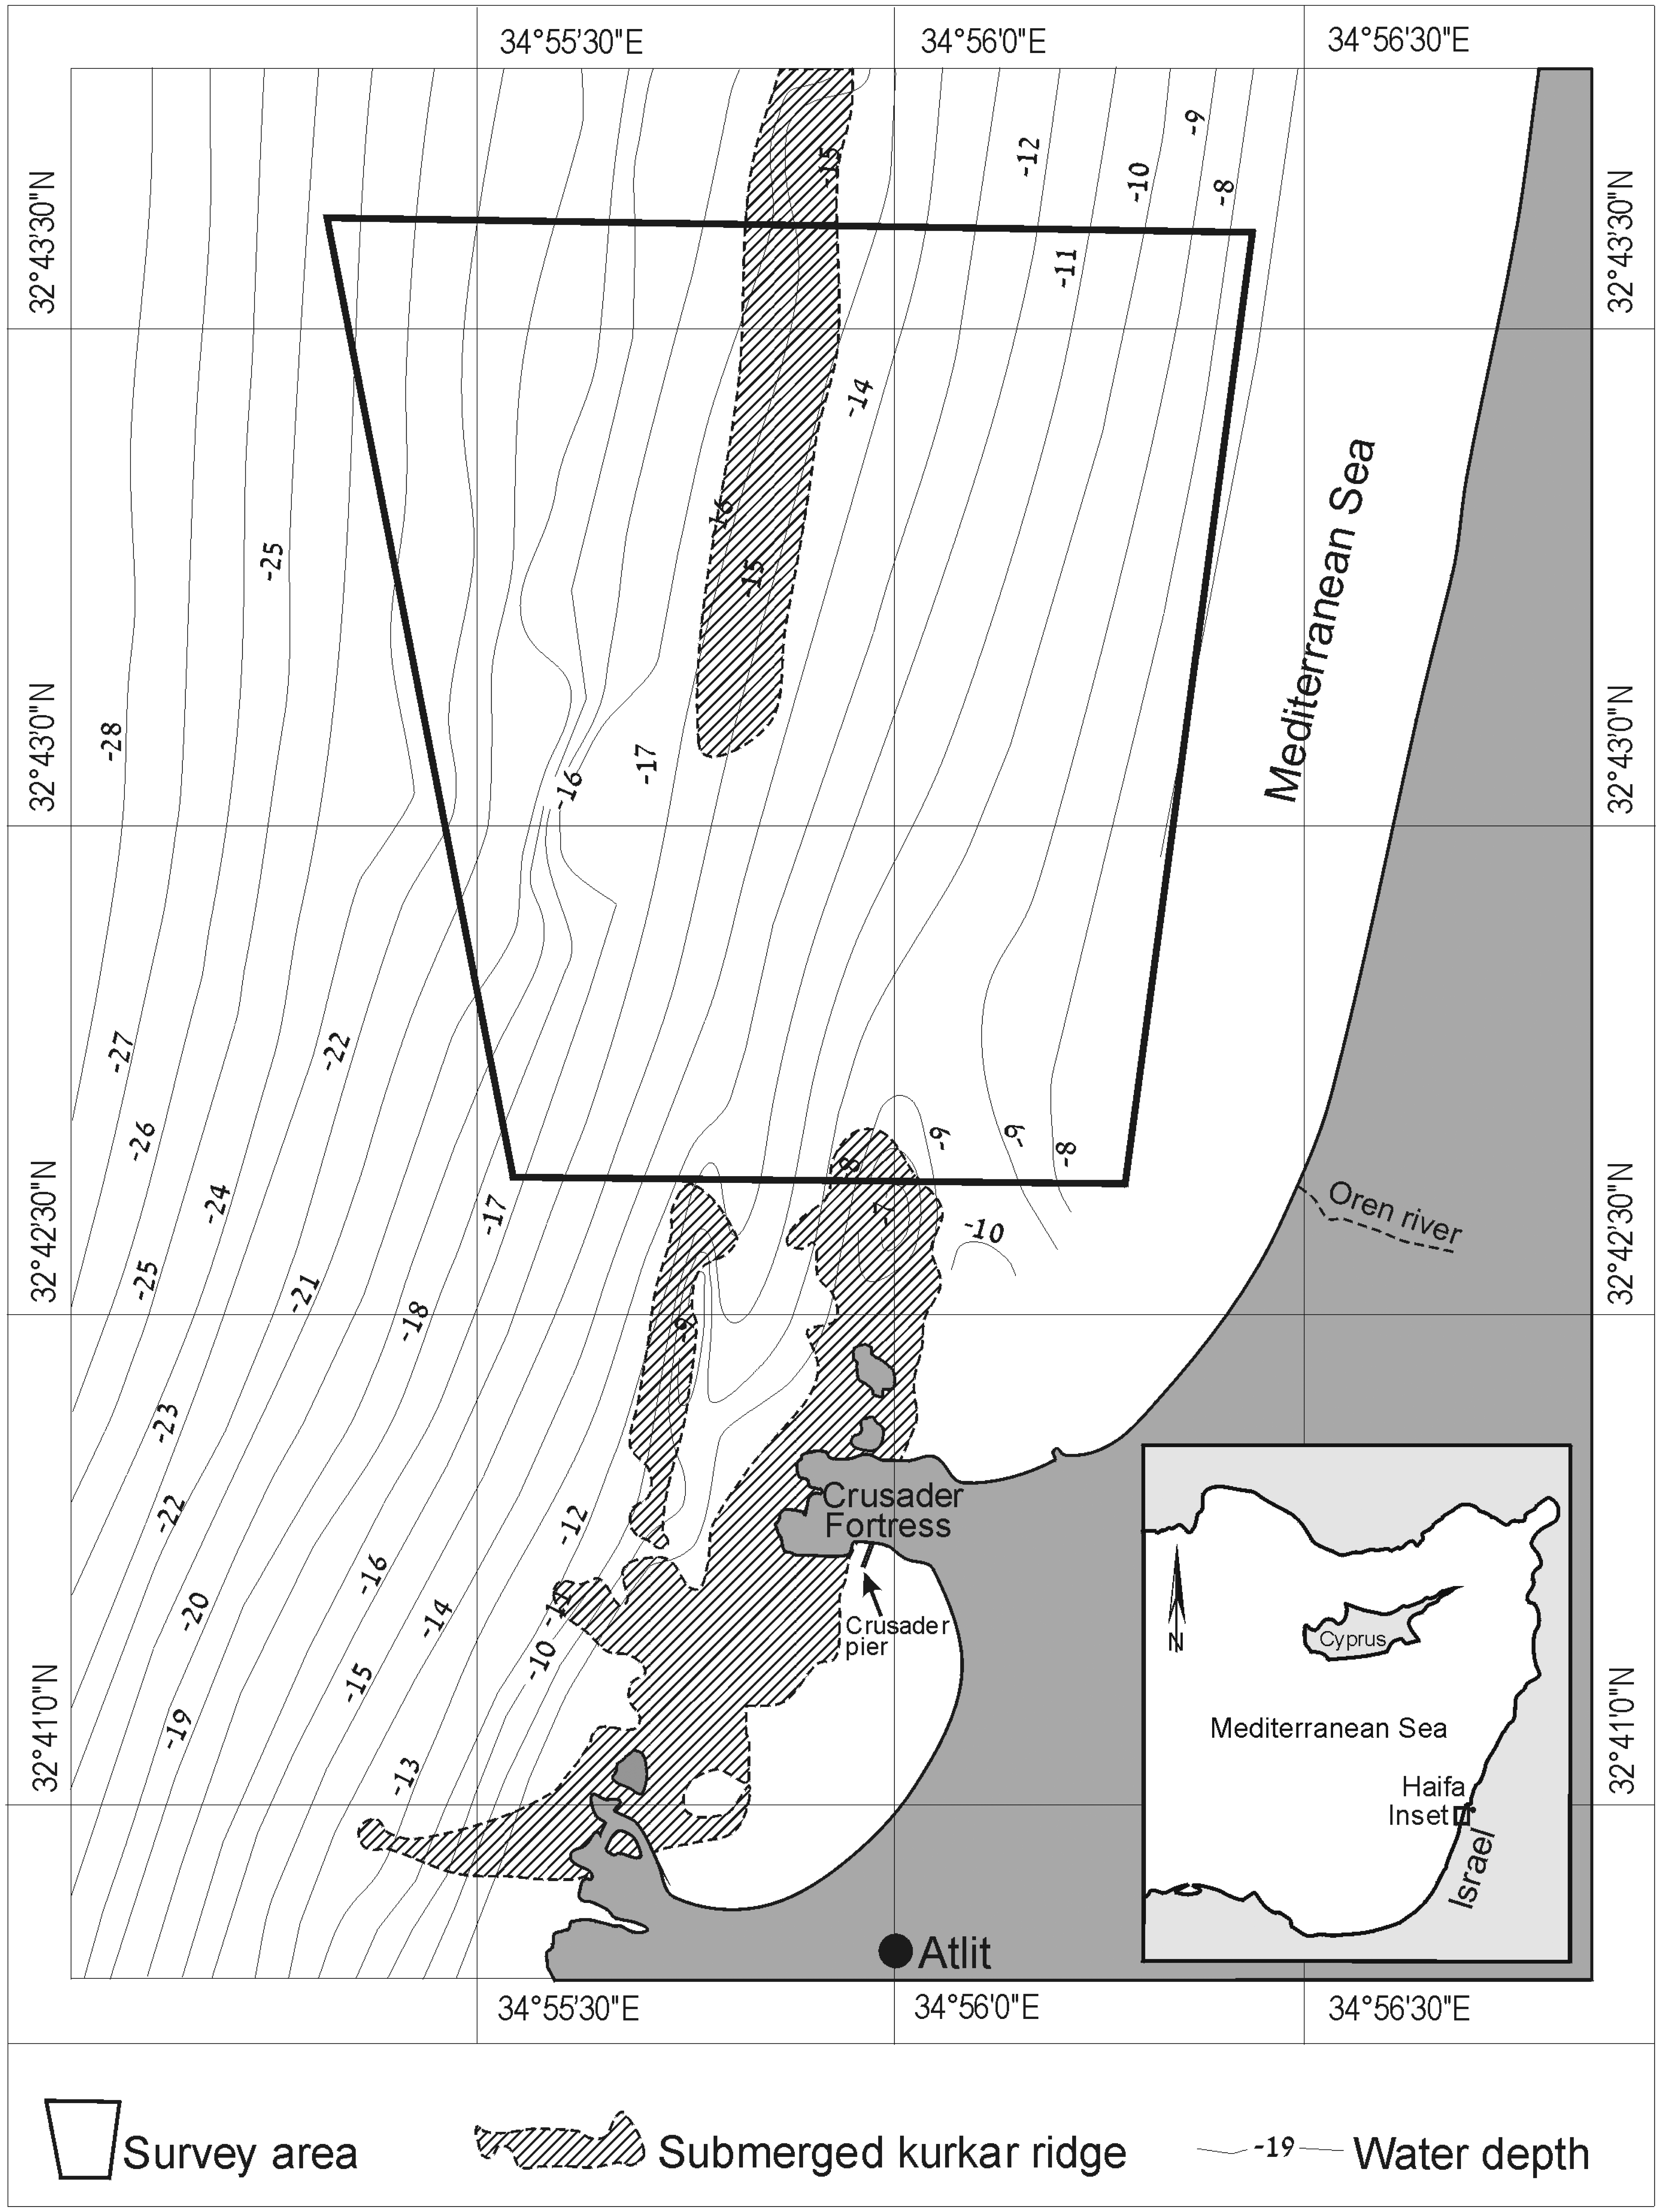
4. Survey area
The survey area is trapeze shaped measuring roughly 1.8 km wide and 2 km long (
Fig. 1). It is located about 1 km northwest of the Atlit Crusader fortress promontory off the Israeli Mediterranean coast at a water depth ranging from 7 to 25 meters. The Seabed coastal plain is composed of underlying sandstone bedrock with partial sand overburden up to 1 meter thickness. Rock magnetic properties may feature significant spatial changes depending on concentration rates of iron-rich paleosol layers.
Because of the proximity to the shore line, the seabed sediments comprise materials swept away from the shore in addition to sand overburden. These sediments, especially iron-rich “humra” (χmass=71·10
−6 cgs) and sandstone bedrock “Calcareous” ((χmass=4·10
−6 cgs) [
6] that are exposed along the shoreline, cause an extra complication of magnetic relief.
It should be noted that the survey area is located in a zone where thousands of years of intense seafaring have left numerous ancient relics on the sea floor. Therefore, considerable contamination with ferro-metallic debris and archeological remains was expected. Furthermore, it is likely that shore-based iron structures also contributed to magnetic picture of the area.
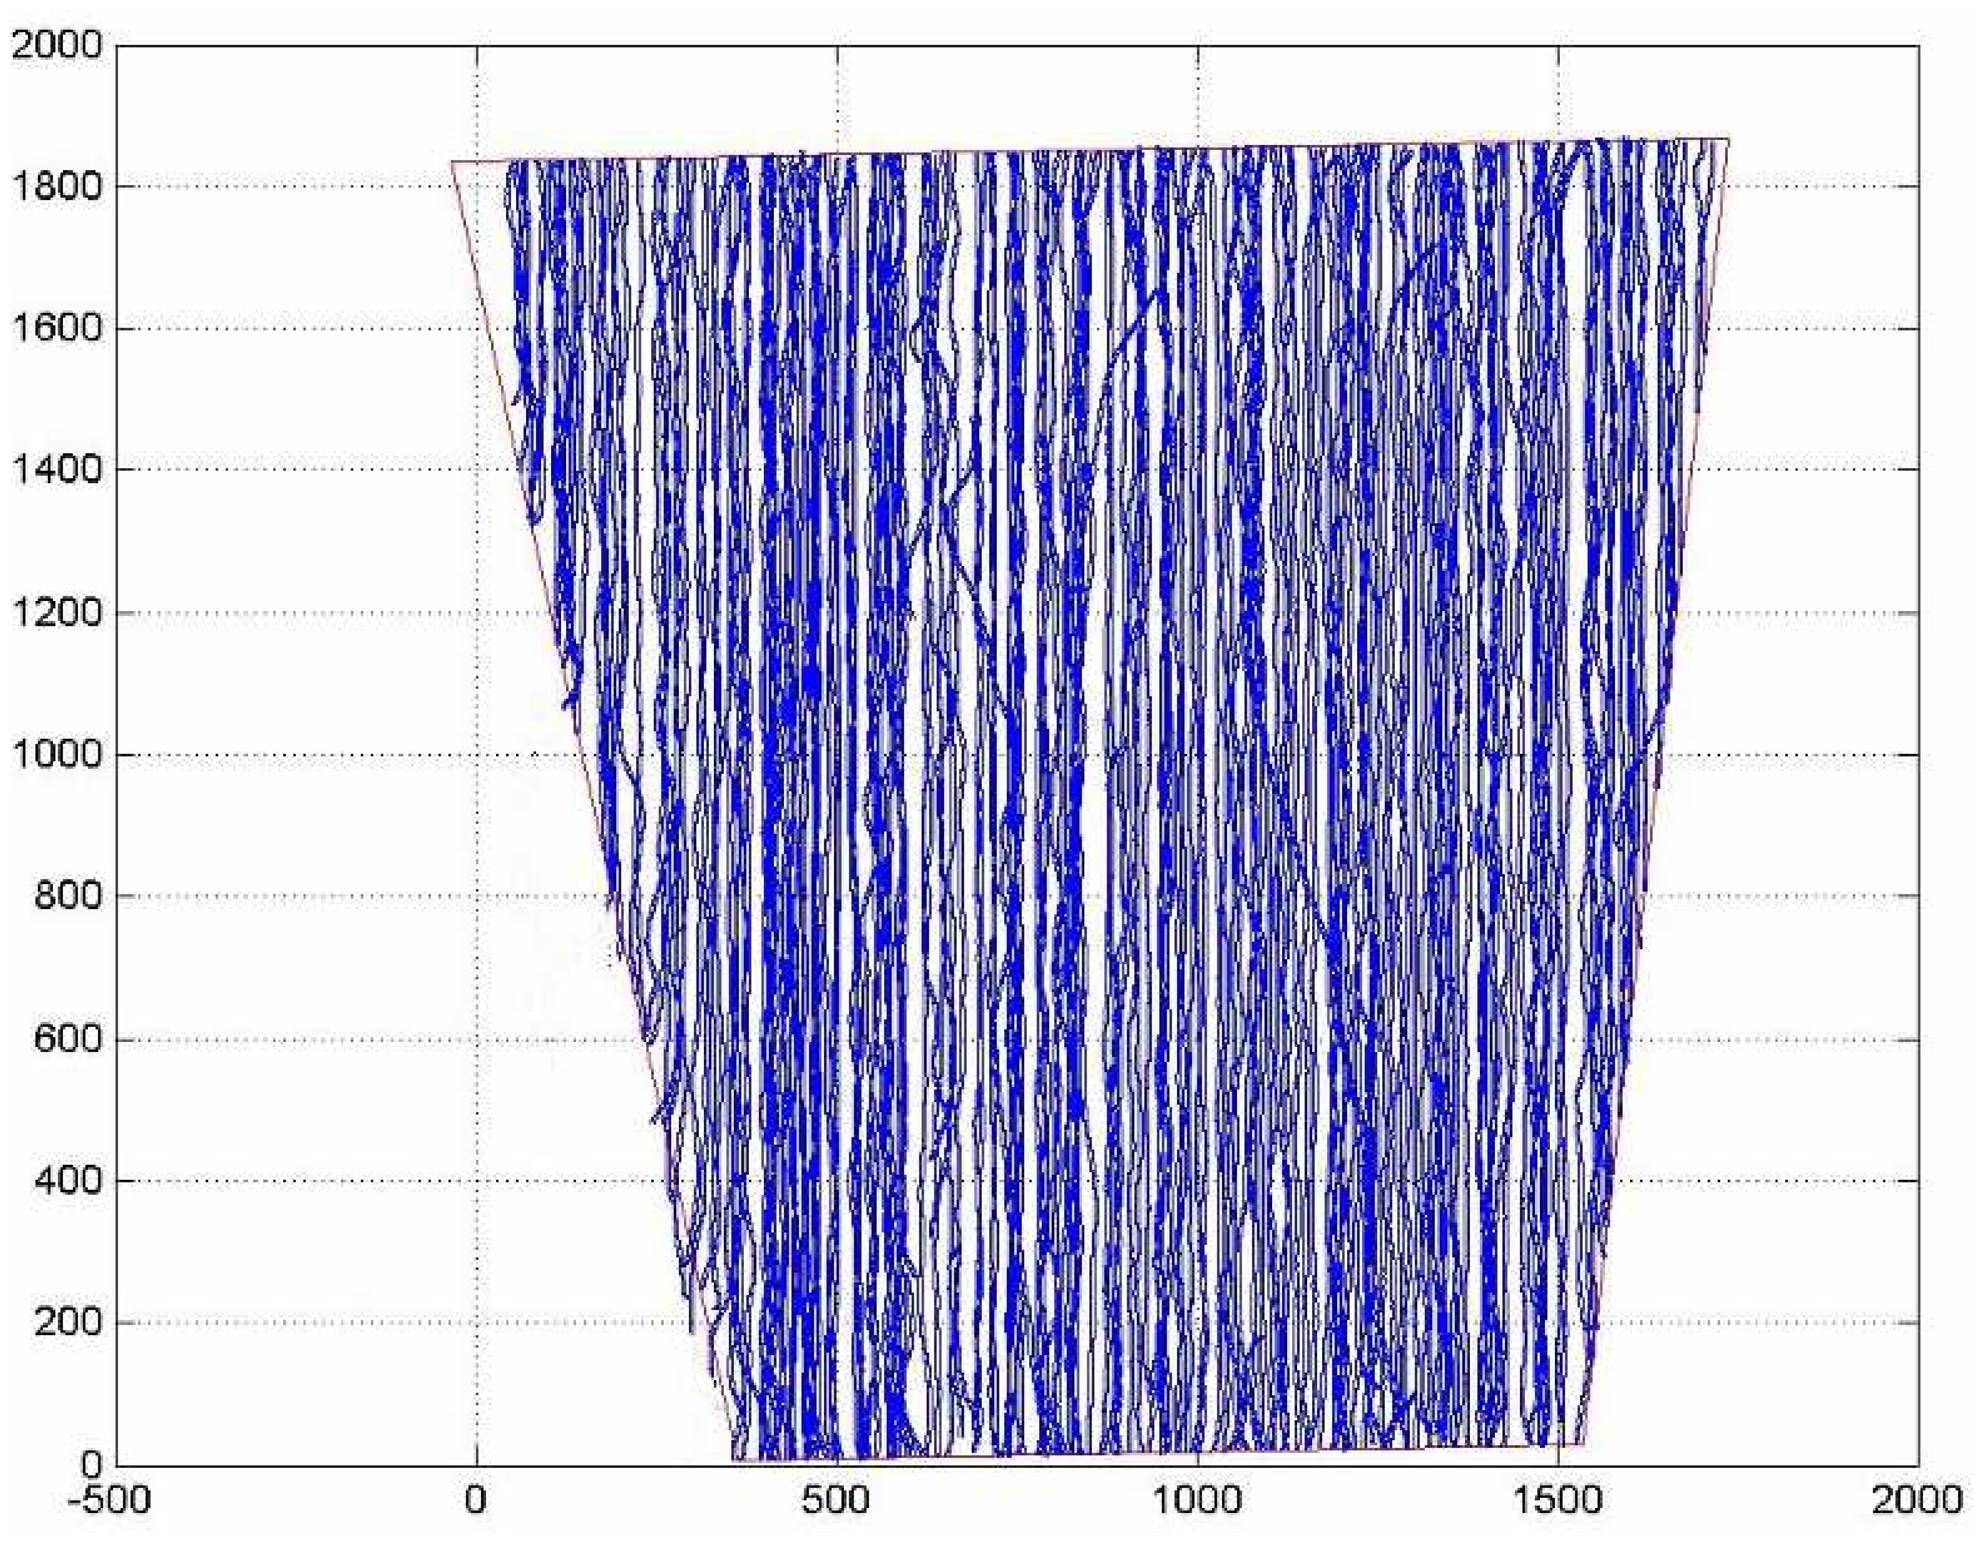
The survey was carried out along North–South parallel lines with ∼10 m spacing between them as well as a few East–West tie lines (
Fig. 4). The survey lines' pitch was selected according to the expected magnetic moment of the airplane engine.
5. Survey Data Processing
Post-survey processing of the magnetic data included diurnal and leg corrections, tie-line and micro leveling in order to remove uncompensated diurnal errors. Drape corrections [
12] were considered, but abandoned because of the almost plain seabed relief over the survey area and specific mission goal - search for small ferromagnetic targets.
Data from the survey vessel computer, ground magnetic station, and reference GPS system were processed to create the measurements grid. The GPS data were corrected by post-processing the recorded raw data from both rover and base units in order to get sub-meter accuracy.
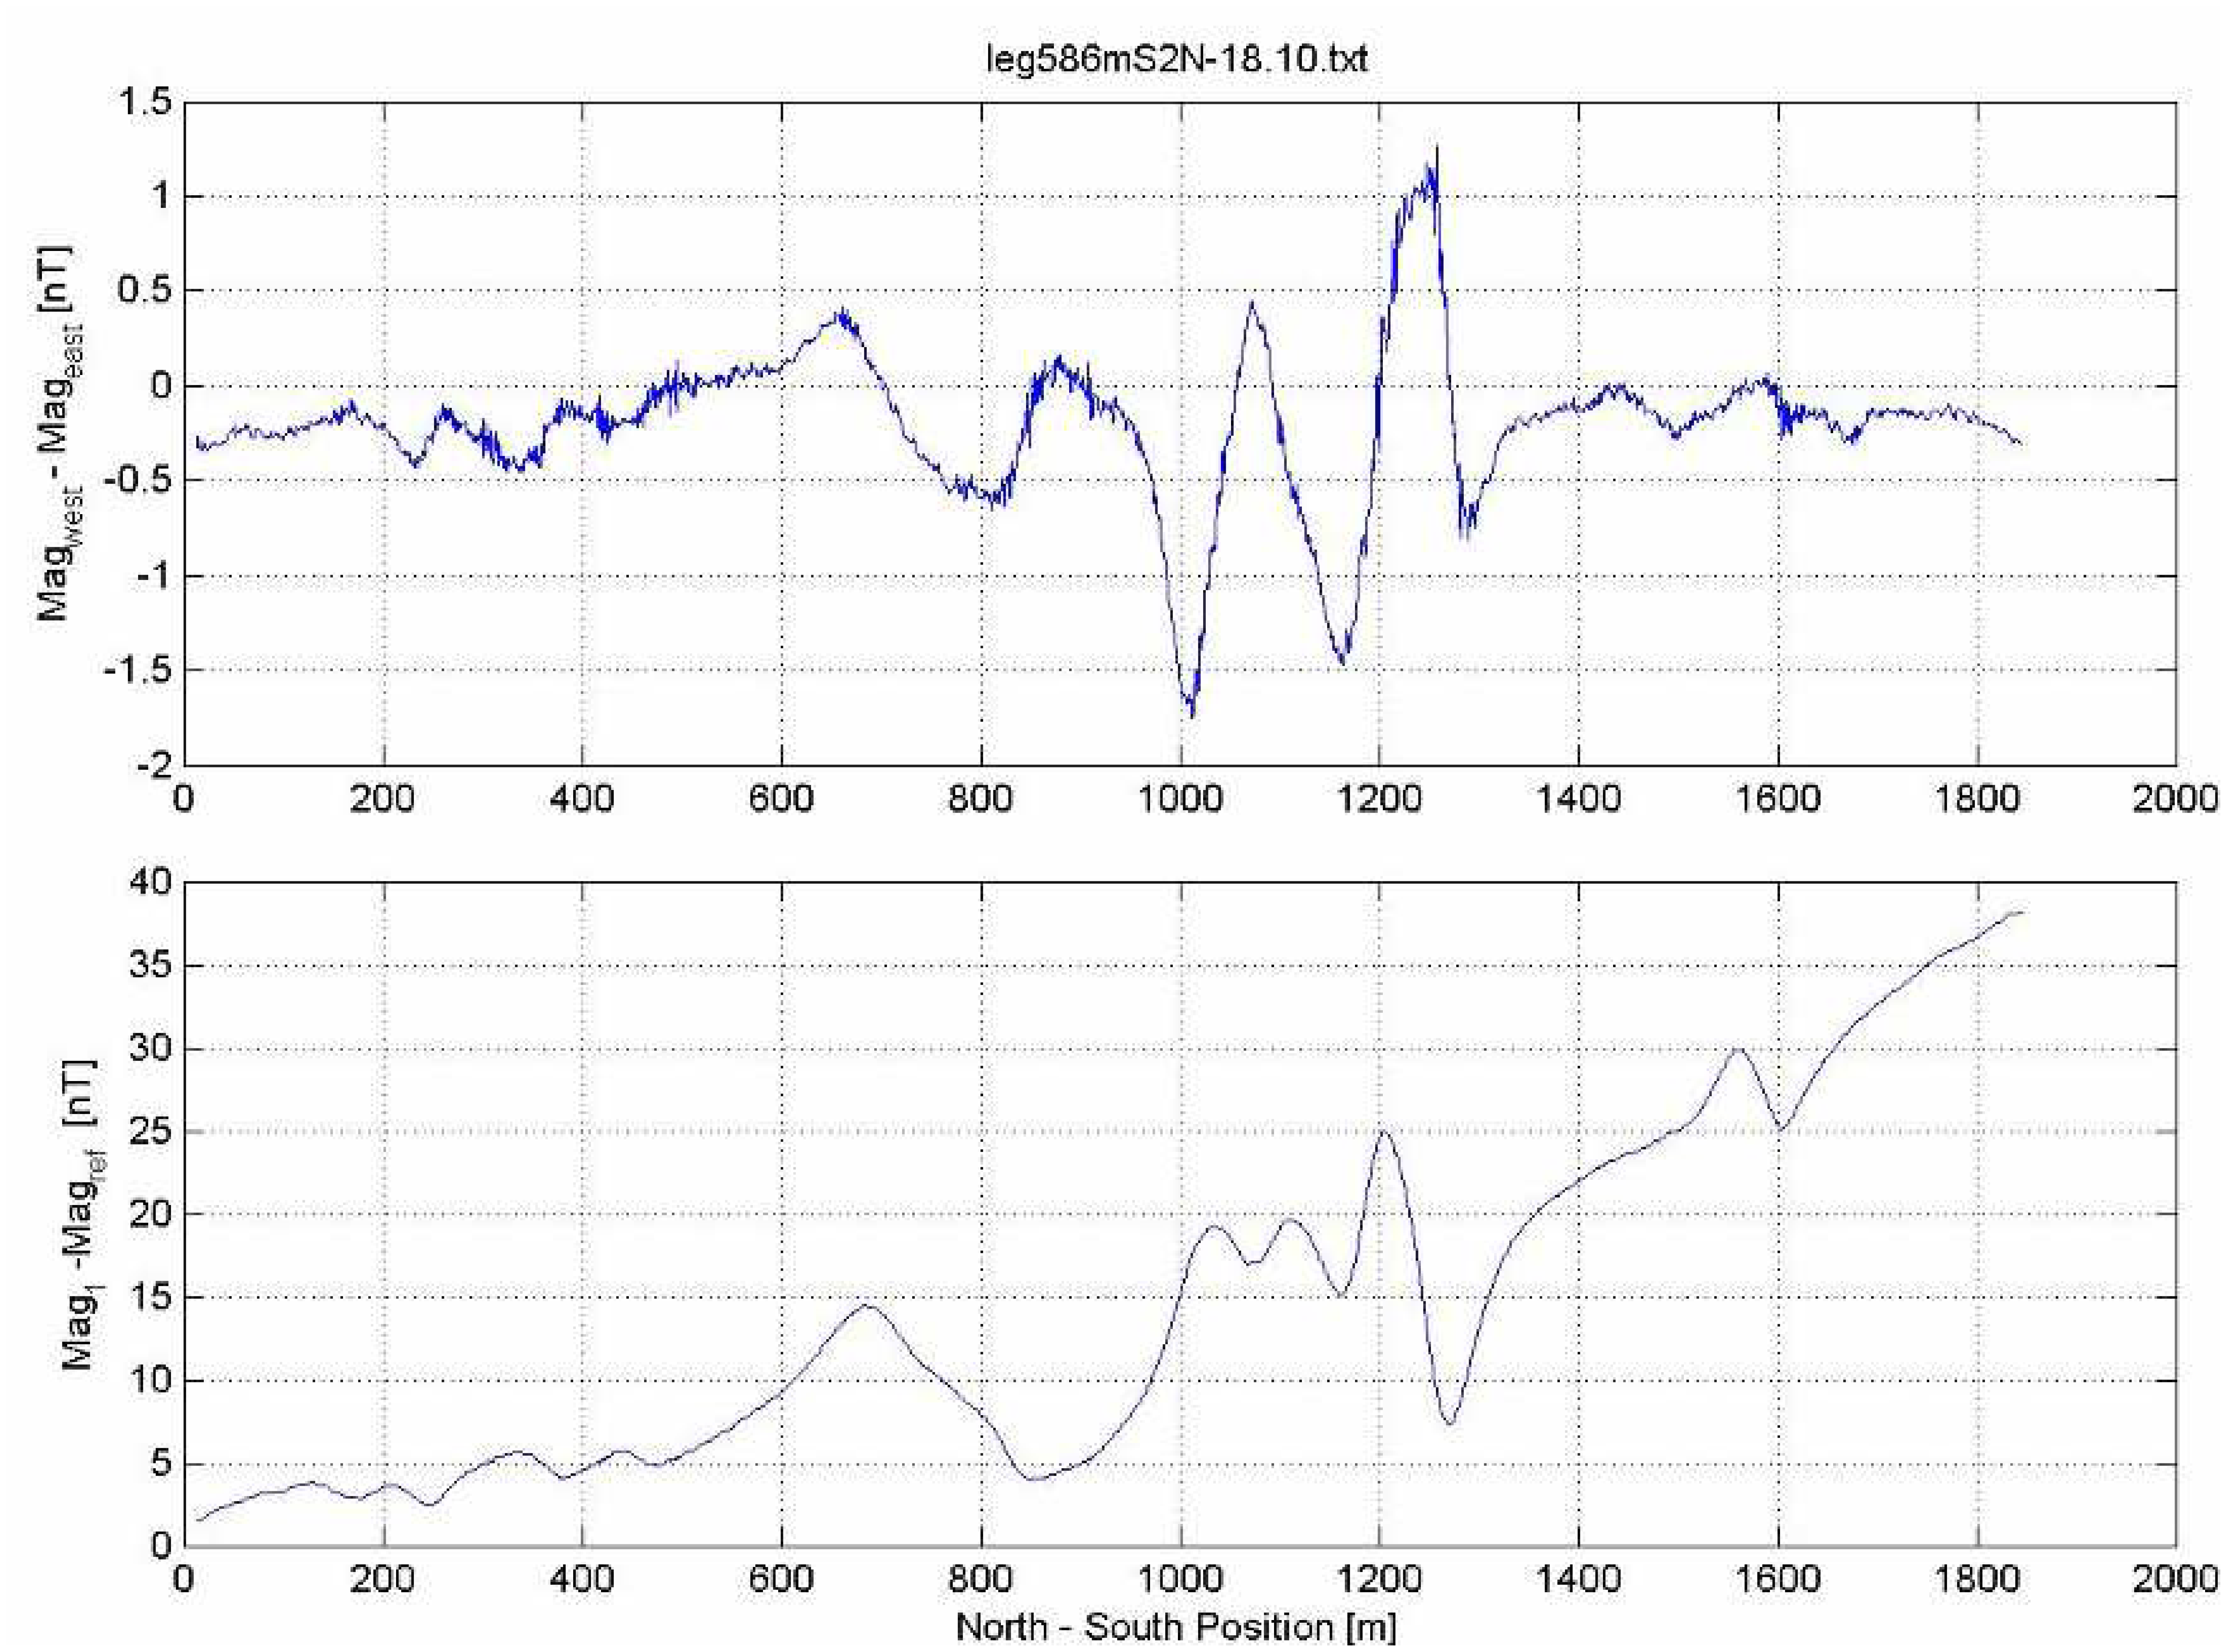
Sampling rate of both survey gradiometer and ground magnetic station was 5 samples/sec position and attitude measurements taken with 1 sample/sec, were interpolated to 5 samples/sec rate and synchronized according to UTC time. After which, all the data were re-sampled, smoothened, and loaded into a data table. An example of corrected magnetic trace along one of the survey legs is shown in
Figure 5.
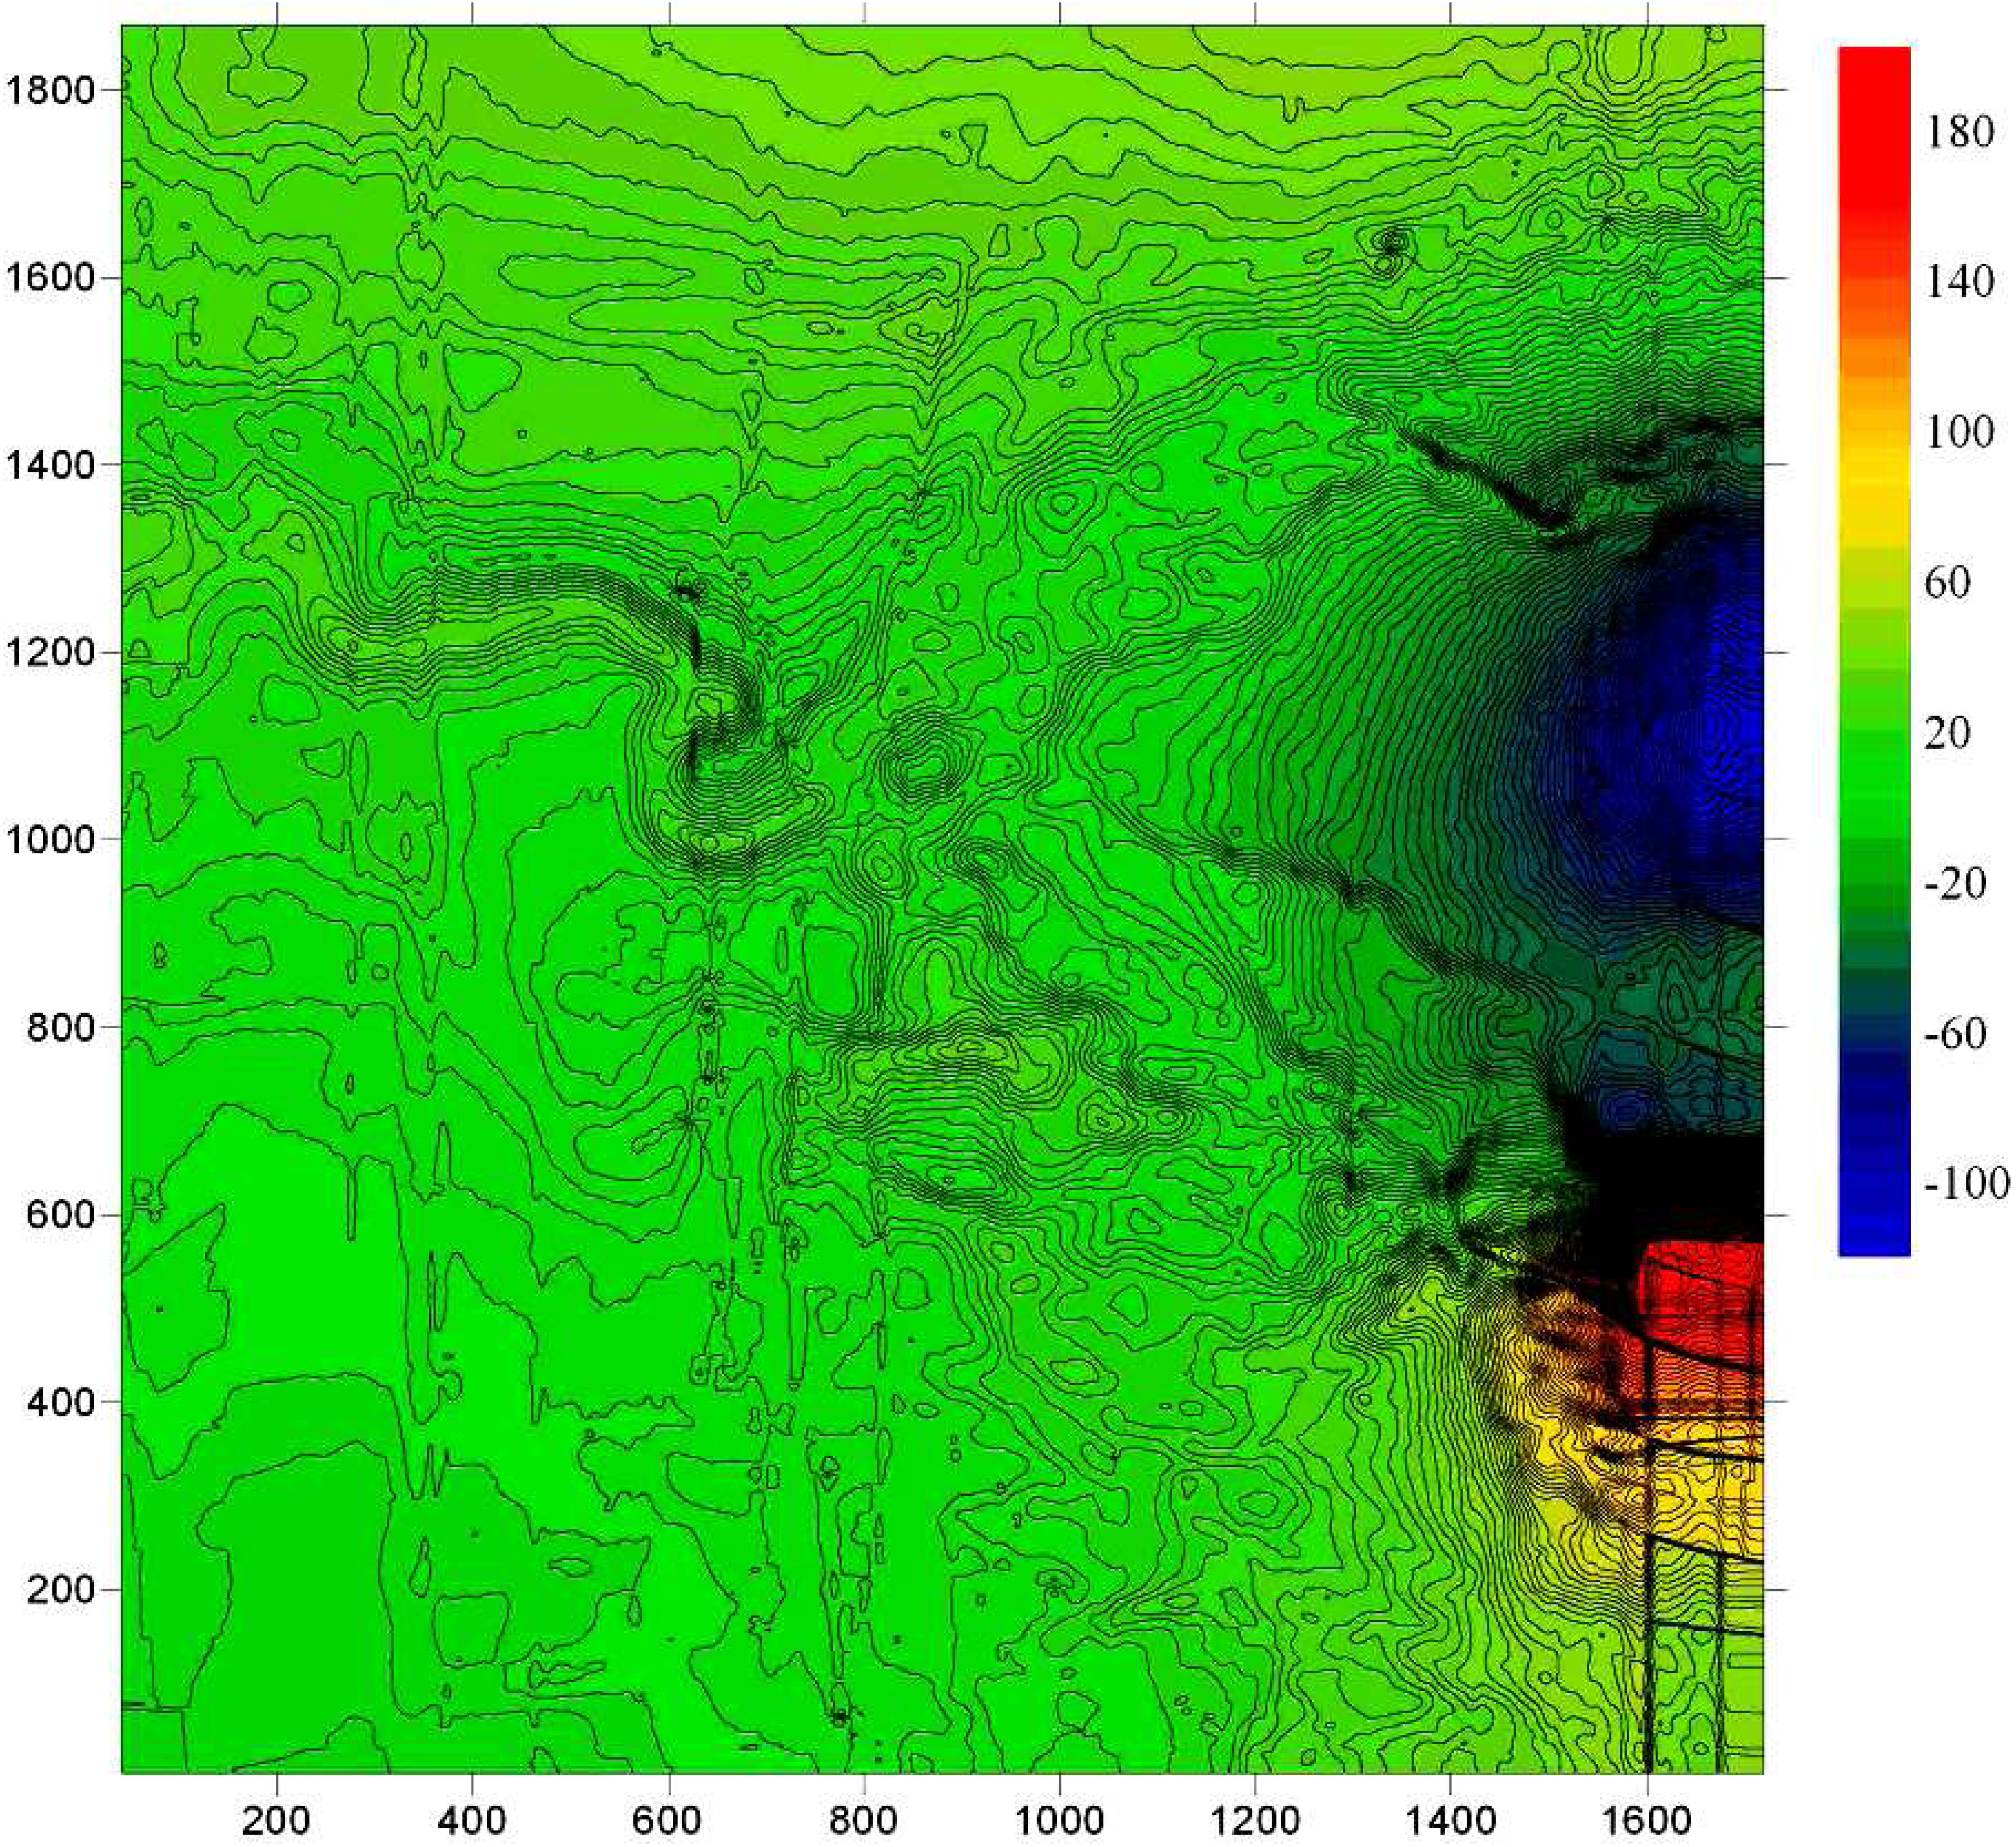
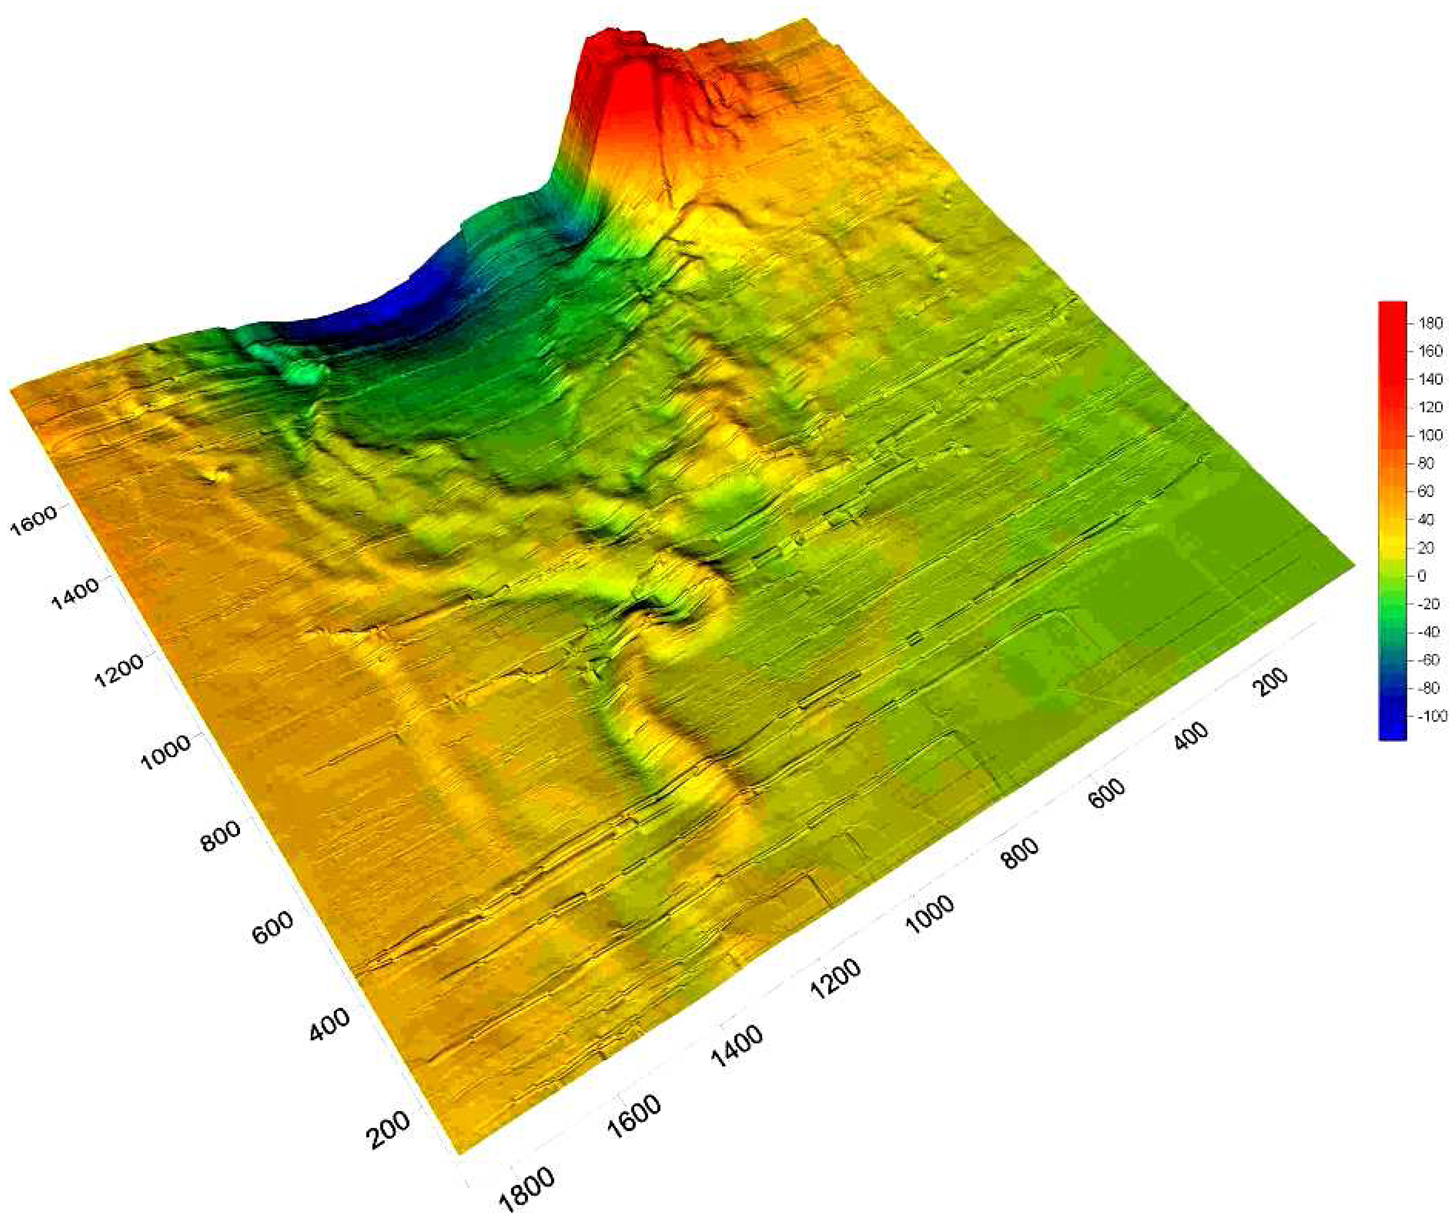
The fully corrected magnetic data were gridded with a cell spacing of 0.5 m using a Kriging algorithm to generate the total field magnetic map shown in
figure 6 and
7. The grid was processed using Surfer mapping software.
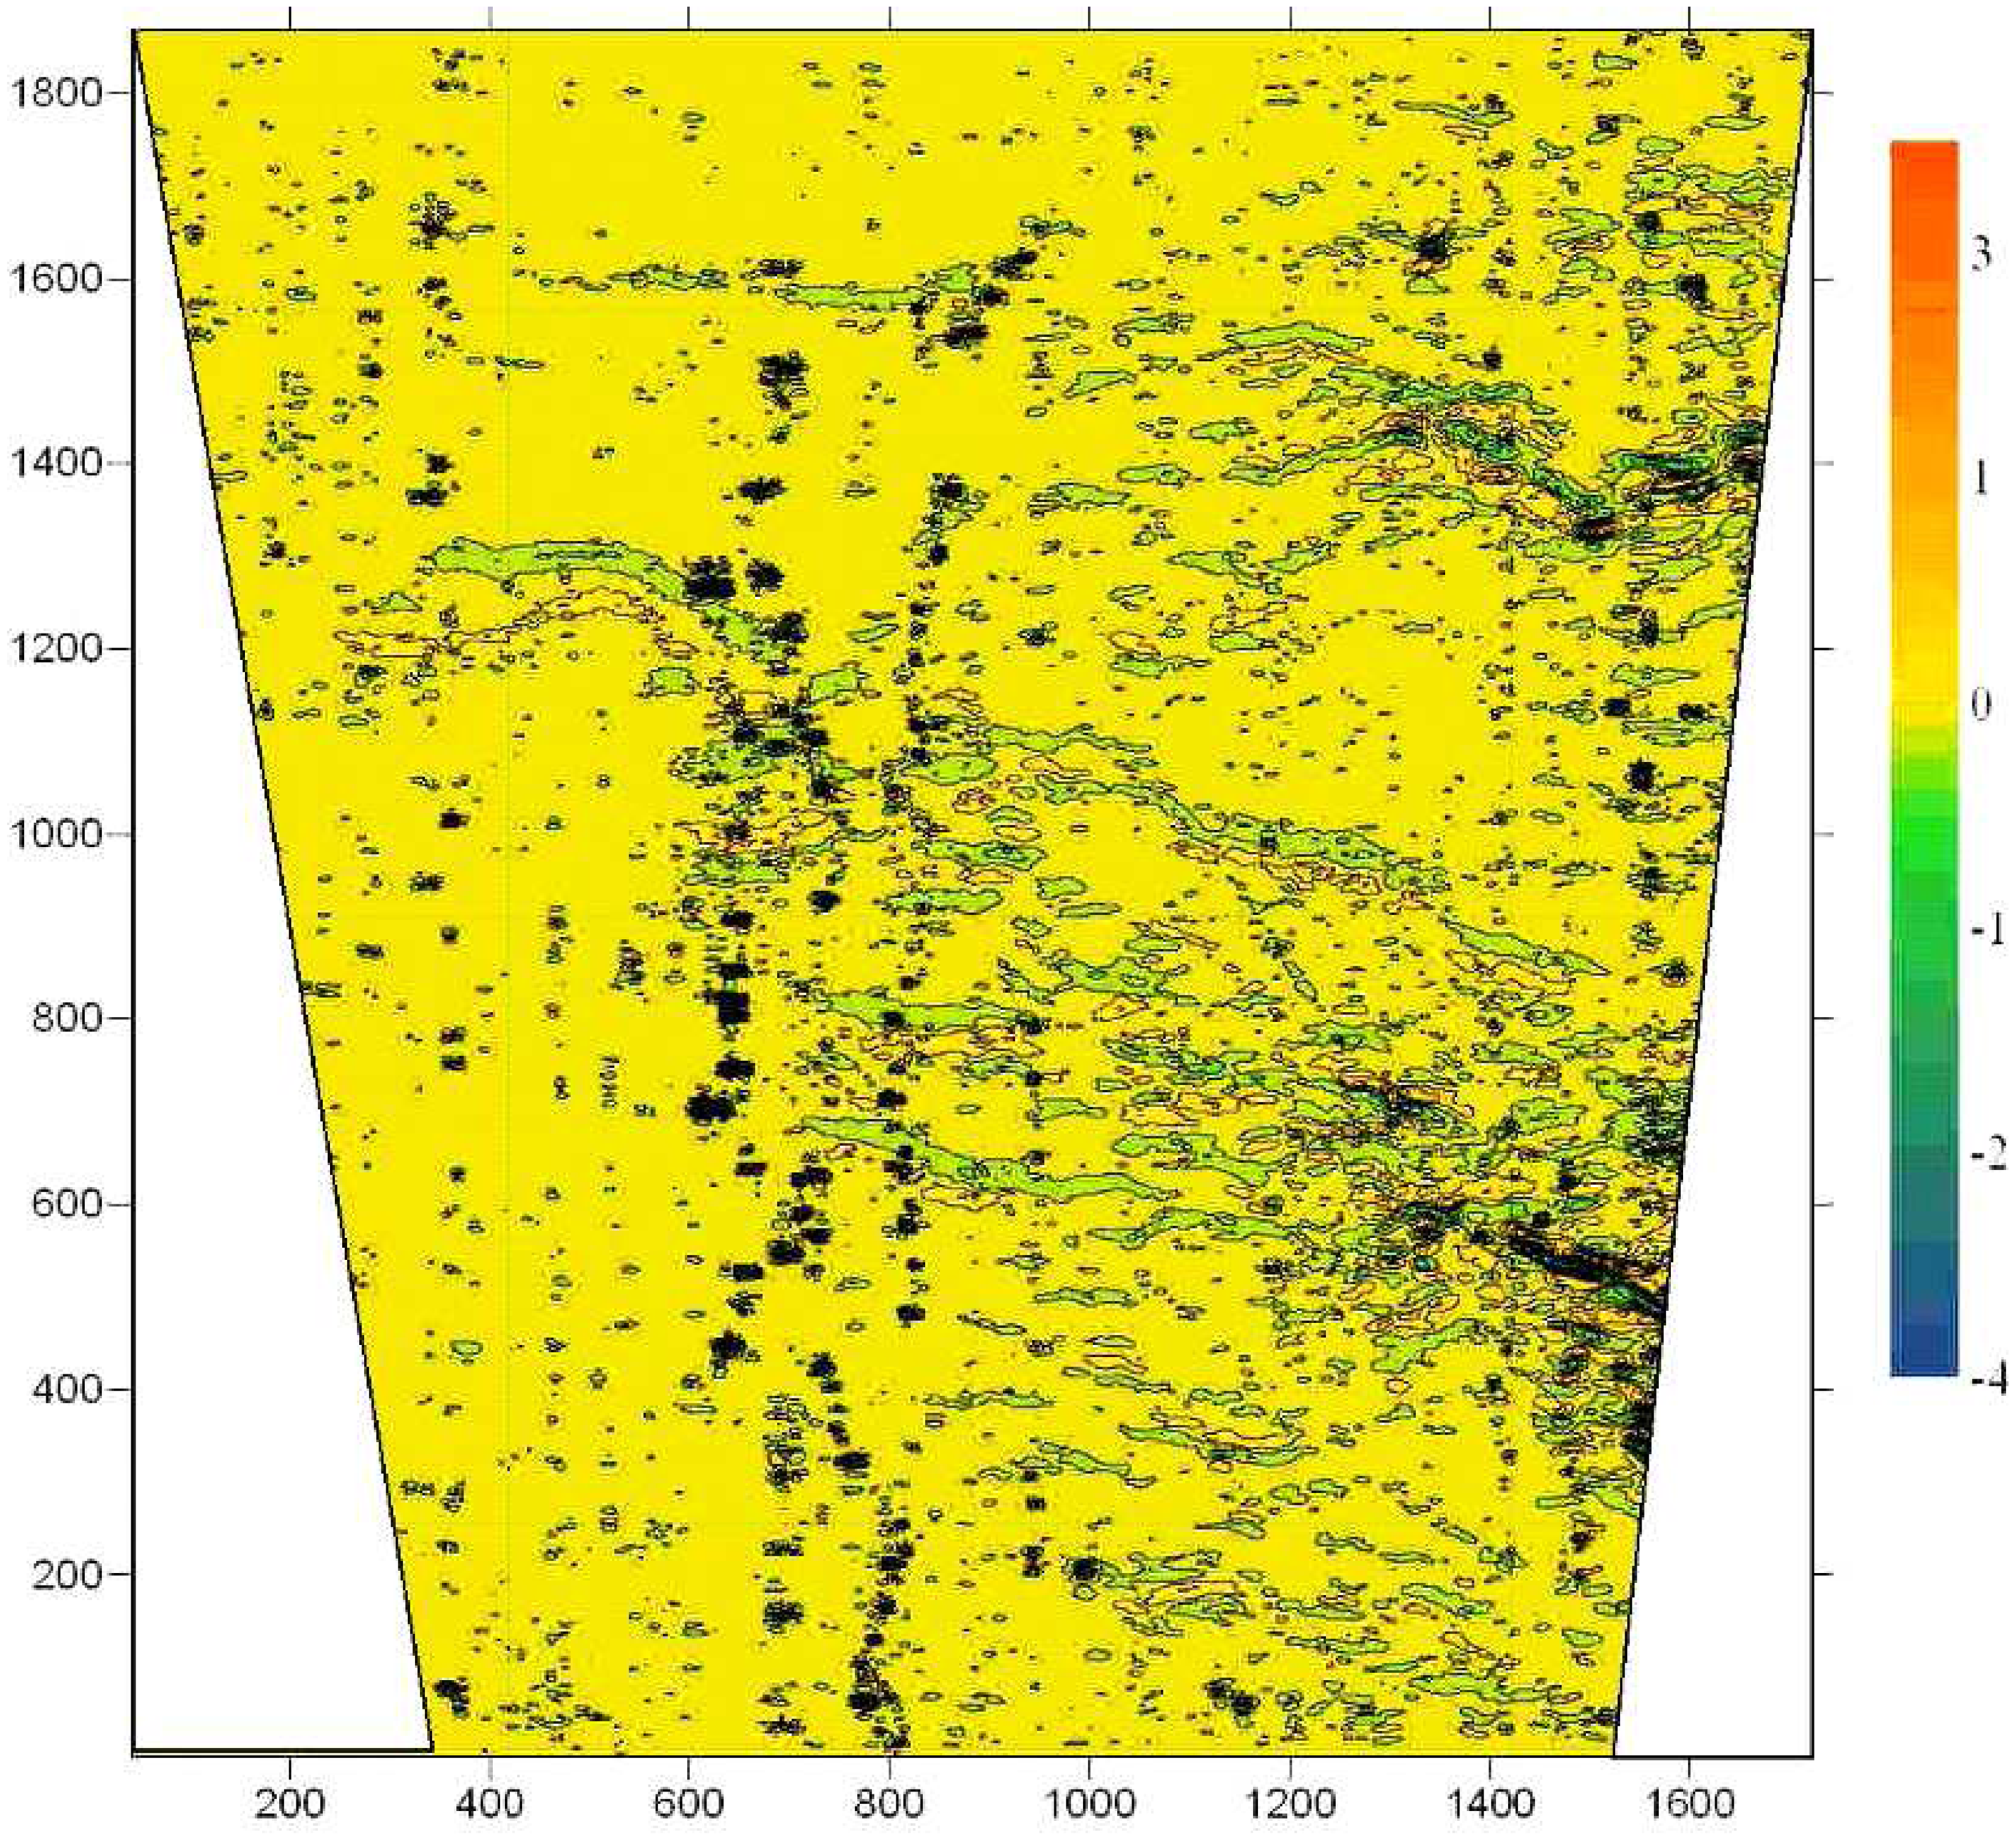
We applied spatial filtering in order to remove long-wavelength anomalies thus enhancing the contrast of shallow buried targets. An example of such band pass filtering is shown in
Figure 8. The values of spatial cut-off frequencies were chosen based on water depth. Comparing this filtered map to the unfiltered one (
Fig. 6), we see that anomalies, caused by stationary seabed targets, are considerably pronounced.
As should be expected, band pass filtering could appreciably distort the spatial shape of the anomaly, especially in the case of clustered targets. That is why detailed analysis of all the anomalies resembling to be produced by potential mission targets was performed based on non-high-pass filtered zoomed map (see an example in
Fig. 9).
6. Results
Detailed analysis of the survey map revealed 59 anomalies in an area of approximately 3.5 km2. The anomalies were ranked according to their probability of being anomalies created by the airplane wreckage. The probability was estimated based on the results of the Wasp engine magnetic moment measurement.
Conclusive proof of target detection capability was obtained by direct probing in selected locations.
The anomaly sources are often buried in the seabed and therefore require an underwater dig. The dig was conducted by the Marine Archeology Unit of the Israel Antiquities Authority.
The divers' boat navigated to the mapped points using the same DGPS system that was used by the survey catamaran to avoid dissimilar coordinate system confusion. After reaching the intended point with 0.5 m accuracy, a marking sinker was lowered to mark the DGPS position of the anomaly. Scuba divers swam to the marked point to reveal the nature of the anomaly. The seabed was alternately rocky or sandy requiring different excavation methods. Rocky seabed anomaly sources though covered with encrustation were visible among the rocks. Sandy areas required a metal detector for final verification of the target before beginning the excavation.
The diver's ability to reach the exact locations of the anomalies at first attempts, corroborated by the data analysis, proved the high detection capability and pinpointing accuracy of our magnetic survey method. Some of the revealed anomaly sources are shown in
Figures 10,
11,
12 and
13.
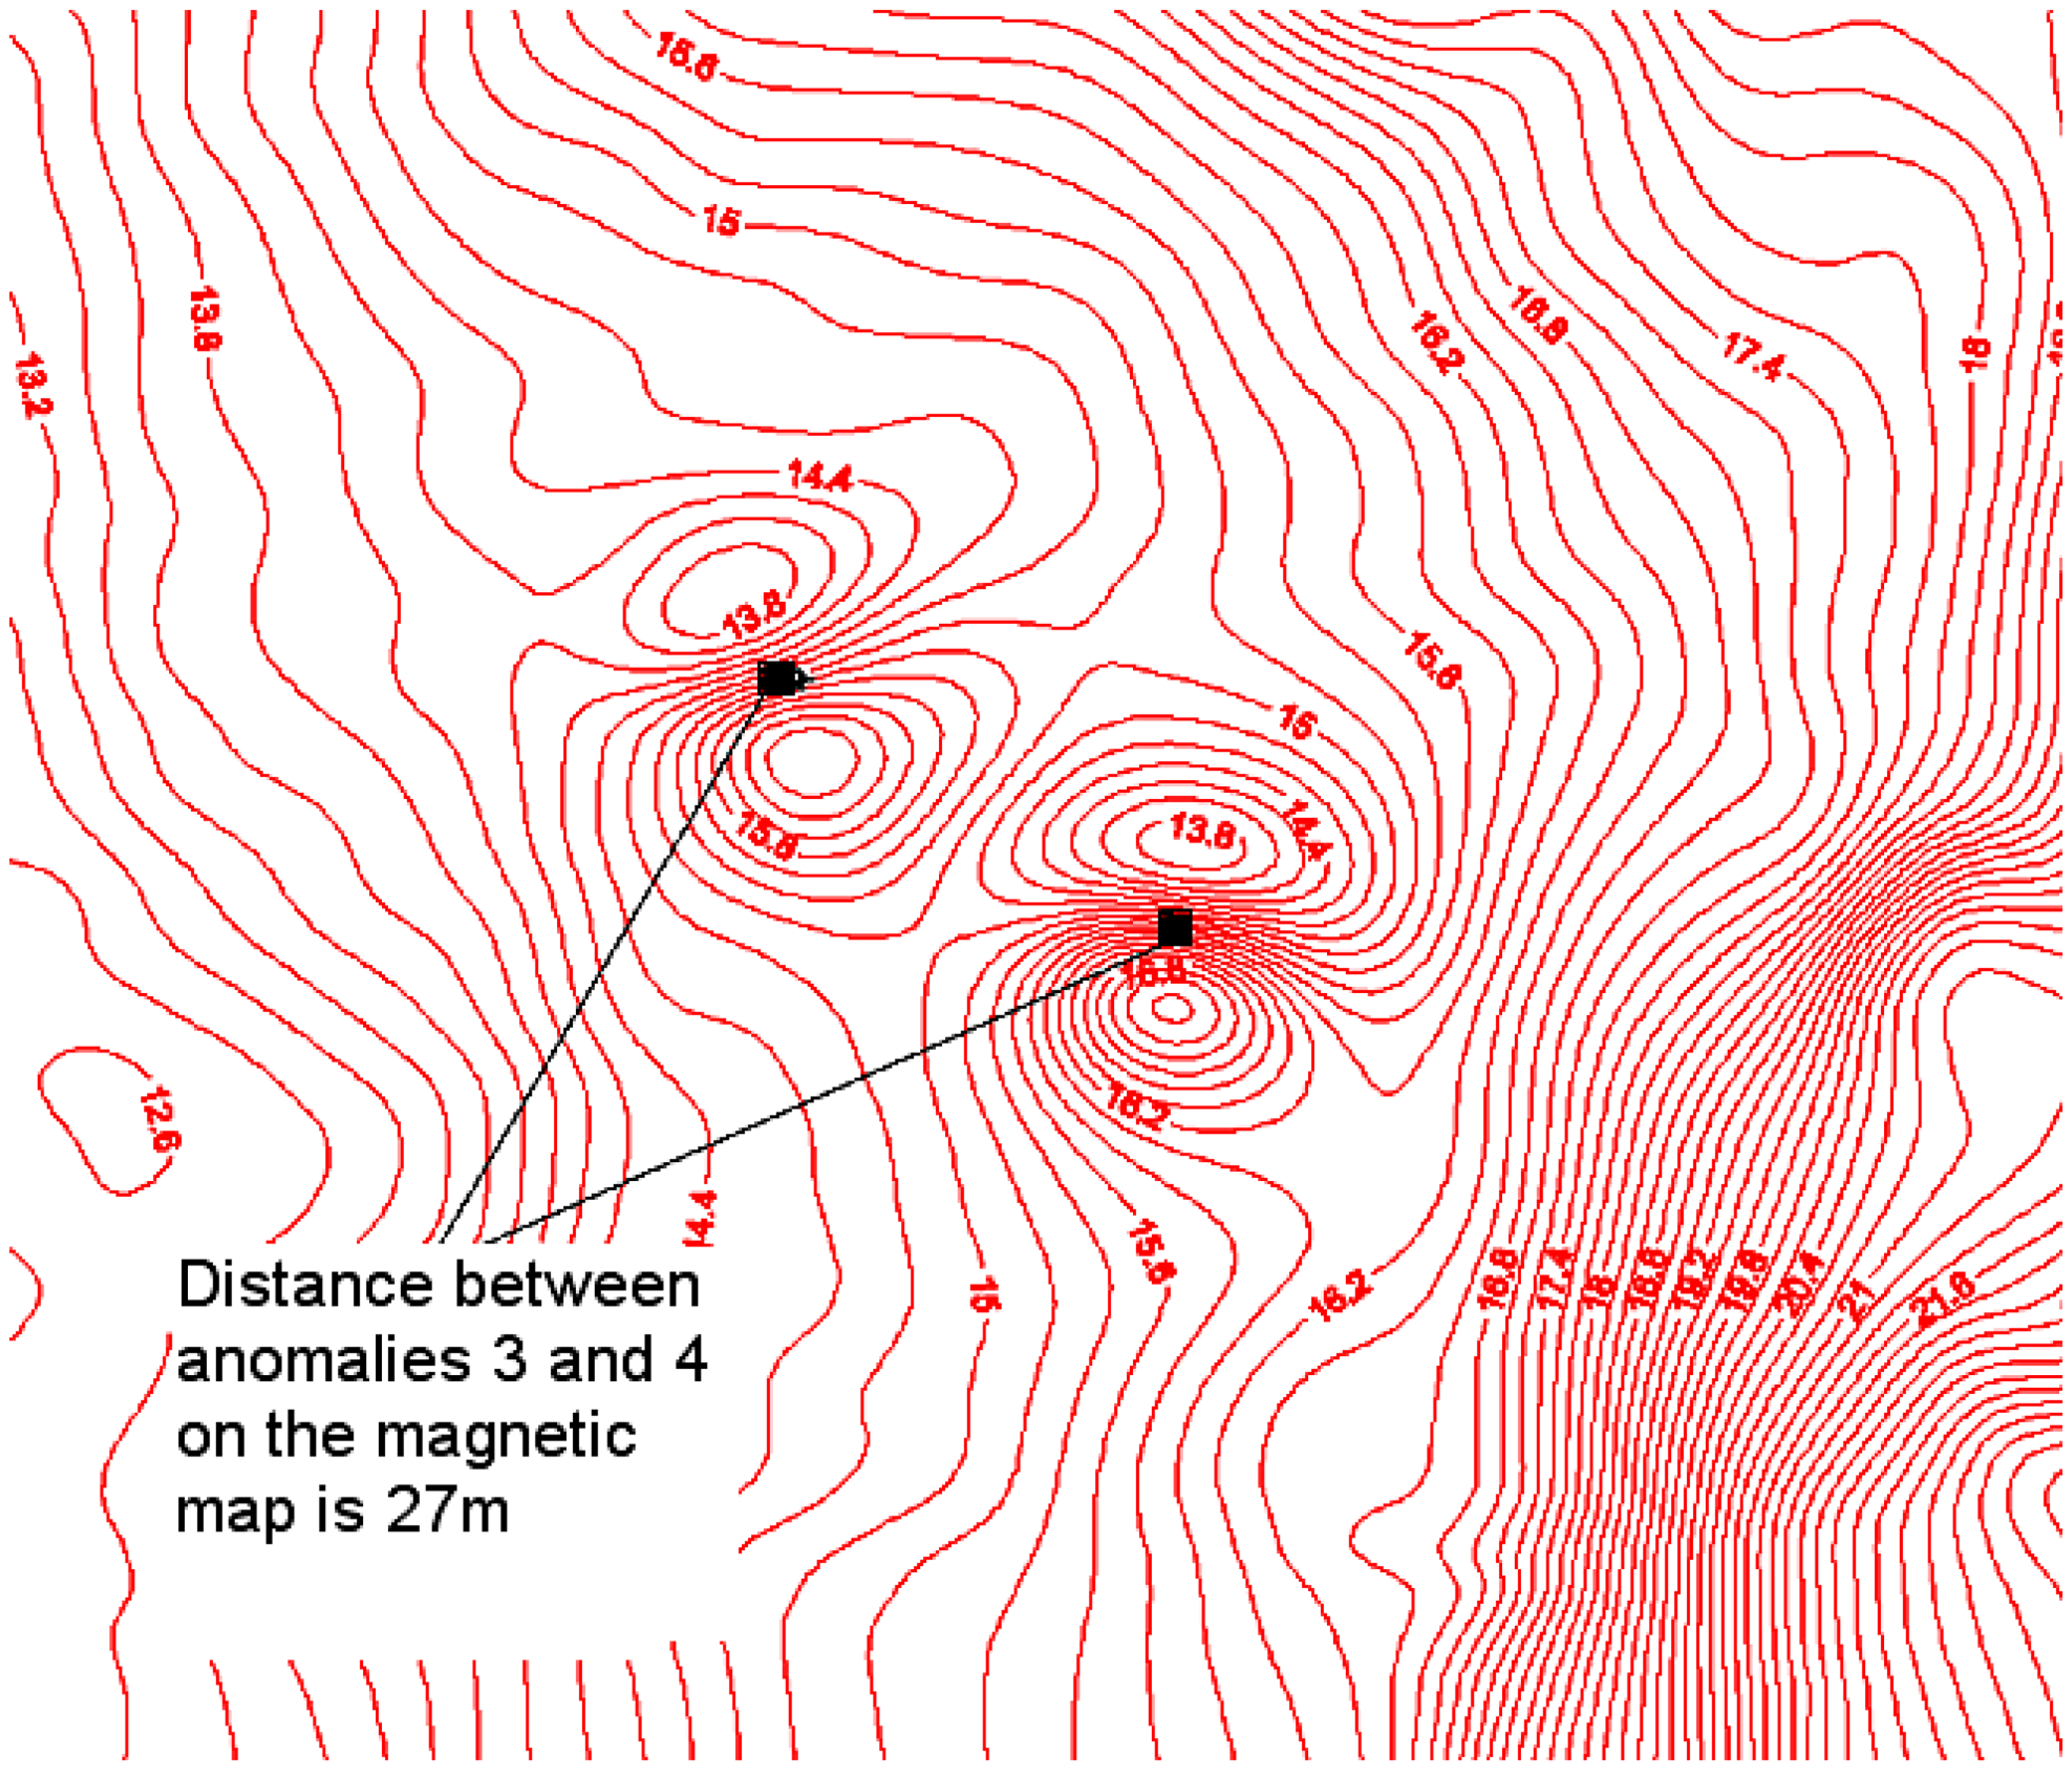
Further verification of location accuracy was provided by direct measurement of the distance between found sources 3 and 4 (
Figures 10,
11). Measured by the divers, this distance was found to be 26 m which was in excellent concordance with 27 m extracted from magnetic map (
Fig. 9).
Parts very similar to T-6 airplane wreckage were found in two of the surveyed target points. A figure depicting a possible airplane part salvaged may be seen in
figure 13. This figure also presents a sketch of the identified part and a picture taken from a museum T-6 airplane for comparison.
Conclusion
An integrated measurement system was developed in order to implement a high resolution marine magnetic survey of a shallow water littoral area. The system comprised precise potassium vapor magnetometer, a DGPS, electronic compass, a wireless link for data transfer, data storage equipment and a ground magnetic station.
High capability in detecting and accurate locating of ferromagnetic targets was proved by results of a marine survey of the 3.5 km2 area conducted in the vicinity of Atlit. Excellent system performance was confirmed by direct probing and site inspection performed by scuba divers.
For each investigated target location a corresponding ferro-metallic item was dug out, one of which turned to be very similar to a part of the crashed airplane. Based on that we believe that the primary purpose of the survey to search for a T-6 Harvard airplane wreck crashed in 1960 has been successfully attained. Found components were unambiguously identified as pertaining to the searched aircraft.
Based on the survey results, additional objects including ancient artifacts were revealed.
The system can be successfully employed for detection and accurate localizing of ferro-metallic objects buried below seabed in shallow waters.


