Abstract
In the present contribution, three methods for the preparation of nanoscaled SrTi1-xFexO3-δ sensor films for hydrocarbon sensing were investigated. Besides screen-printed thick films based on sol-precipitated nanopowders, two novel synthesis methods, electrospinning and electrospraying, were tested successfully. All of these sensor devices showed improved sensor functionality in comparison to conventional microscaled thick films. In order to explain the impact of the enhanced surface-to-volume ratio on sensor properties in a quantitative way, a mechanistic model was applied to micro- and nanoscaled devices. In contrast to the conventional diffusion-reaction model that has been proposed for n-type semiconducting sensors, it contained novel approaches with respect to the microscopic mechanism. With very few fit variables, the present model was found to represent well sensor functionality of p-type conducting SrTi0.8Fe0.2O3-δ films. In addition to the temperature dependency of the sensor response, the effect of the specific surface area on the sensor response was predicted.
1. Introduction
Due to their unique properties that are often different from bulk behavior, nanoscaled materials have received much attention in many research areas, including optical, biochemical, and electrical applications. As a high surface-to-volume ratio can be achieved using nanosized precursors, nanotechnology is of considerable interest in the field of semiconductor-based resistive gas sensing, where the underlying sensing mechanism is related to surface processes. A high surface area might lead to enhanced sensitivity, which helps to meet the ever-increasing demand for inexpensive, accurate, and reliable gas sensor devices [1-4]. In this context, nanotechnology involves the preparation of thin films with a thickness of several nanometers or the use of nanosized materials, e.g. nanopowders, nanowires, or nanobelts. Examples where nanotechnology has successfully been employed for gas sensor improvement include SnO2 [5], TiO2 [6], WO3, and MoO3 [7] for the detection of various harmful or explosive gases such as CO, nitrous oxides, ammonia, and hydrogen.
While n-type semiconductors dominate gas sensor technology, only a few p-type conducting materials have been studied so far in spite of their good catalytic properties. The p-type conducting perovskite family SrTi1-xFexO3-δ with x = 0.1..0.5 are promising materials for hydrocarbon sensing in the temperature range from 350 °C to 450 °C. With screen-printed thick films, a fast, stable, and reversible response to hydrocarbons is observed. In particular, the SrTi1-xFexO3-δ members with moderate iron content (10-20 %) show best performance [8, 9].
In this contribution, the use of nanosized materials for SrTi1-xFexO3-δ film manufacturing is investigated. Besides screen-printed thick films based on sol-precipitated nanopowders, two novel synthesis methods, electrospinning and electrospraying, are tested. Sensor functionality of the corresponding devices is compared to conventional thick film sensors prepared from micro-scaled powders.
As a unique feature of this study, each nanoscale deposition method was based on the same precursor sol in order to assure a perfect comparability of the data. In addition, identical electrode structures, i.e. interdigitated Pt electrodes, were used.
2. Experimental
For the conventional screen-printed sensor devices, microscaled powders were prepared by the mixed-oxide route as described elsewhere [8]. These powders yielded a grain size in the range of 1 μm and a specific surface area of ABET = 4 m²/g determined from BET measurements.
The synthesis of sol-precipitated Sr(Ti0.8Fe0.2)O3-δ nanopowders followed the preparation route described in [10] with a slight modification. As precursors, Sr(NO3)2 (purum, Fluka), Fe(NO3)3·9H2O (puriss. p.a., Fluka), and titanium isopropoxide (purum, Fluka) were used in stoichiometric proportions. The precipitation reaction was conducted in continuously stirred aqueous solution. The pH value was adjusted using glacial acetic acid (Hedinger). In contrast to the original method, no 4 M NaOH was added at this point of the synthesis. The solution was heated to 80 °C and kept at this temperature for 3.5 h. Only afterwards, powder precipitation was started by introducing 4 M NaOH prepared by dissolving NaOH pellets (p.a., Merck) in deionized water. The reaction product, which is denoted as nanoscaled powder in the following, is subsequently calcined at 850 °C for 3 h. The sol-precipated powders consisted of fine nano-sized grains with grain diameters of approximately 70 nm. BET measurements (Micromeritics Asap2010) yielded ABET = 19 m²/g for the nano-scaled powders. As reported in detail in [9], this was an improvement in comparison to the original recipe, which led to grain sizes of 150 nm to 200 nm with a BET surface area ABET = 8 m²/g.
Screen-printable pastes were prepared from both powders and deposited on alumina substrates equipped with a SrAl2O4 underlayer as described in [11] and two platinum interdigitated electrodes (IDE, 150 μm line / 150 μm spacing). After sintering at 850 °C (nanoscaled) or 1100 °C (microscaled) for one hour in air, the film thickness was determined by a profilometer (MFW-250, Mahr GmbH, Germany) and was found to be between 10 and 20 μm.
The precursor sol (without NaOH) is also used for electrospinning and electrospraying. The operation principle of both electric-field assisted deposition techniques is similar. A high voltage is applied between a substrate and the needle of a syringe, which contains the precursor solution and is operated at a constant rate by a programmable syringe pump. When the electric field is sufficient to overcome the surface tension of the fluid, a jet forms, and a thin film is deposited on the substrate. Its morphology is governed by several parameters such as deposition rate, voltage, and distance between substrate and needle [7]. In the case of electrospraying, the liquid precursor only contains solvated components of the metal oxide film. For electrospinning, however, an appropriate polymer solution is added. Under the action of the electric field, a polymer fiber network forms, which encapsulates the metal oxide precursor. This polymer matrix is removed subsequently during a thermal treatment.
In the case of electrospraying, the precursor sol was used as prepared. For electrospinning, one part of the sol was mixed with four parts of a poly vinylpyrollidone solution (poly vinylpyrollidone, Aldrich, 437190) in ethanol, 130 g/l).
In both cases, the films were deposited directly on identical alumina substrates with Pt-IDE (cf. above), which were placed at a distance of 55 mm from the needle. By means of an automatic syringe pump (kc Scientific), deposition rate (0.6 to 1.3 ml/h) and volume (0.4 ml for electrospinning, 2 ml for electrospraying) were adjusted. Subsequently, films were heat-treated at 750 °C in air for 1 h1.
For gas sensing, the annealed films were mounted in a tube furnace and heated to 400 °C. In an earlier study, this temperature had been identified as presenting the best tradeoff between high sensitivity and fast response [12]. For modeling purposes, the temperature range from 350 °C to 500 °C was covered. To a reference gas mixture of 20 % oxygen in nitrogen (flow rate: 1000 sccm/min), the different analyte gases were added in the corresponding concentrations using mass fow controllers. The sensor resistance was recorded with a digital multimeter (Agilent 34401A or Keithley 2700).
3. Results and Discussion
3.1. Screen-printed films
In Fig. 1, SrTi0.8Fe0.2O3-δ sensors prepared from conventional, coarse-grained powders and wet-chemically prepared sol precipitated powders with fine particle sizes are compared. Pt-IDE structures served as transducers. For comparing the sensor characteristics of the sensor films, the resulting resistance change response, R/R0, are plotted. R denotes the resistance in presence of the analyte gas, R0 is the base resistance in air.
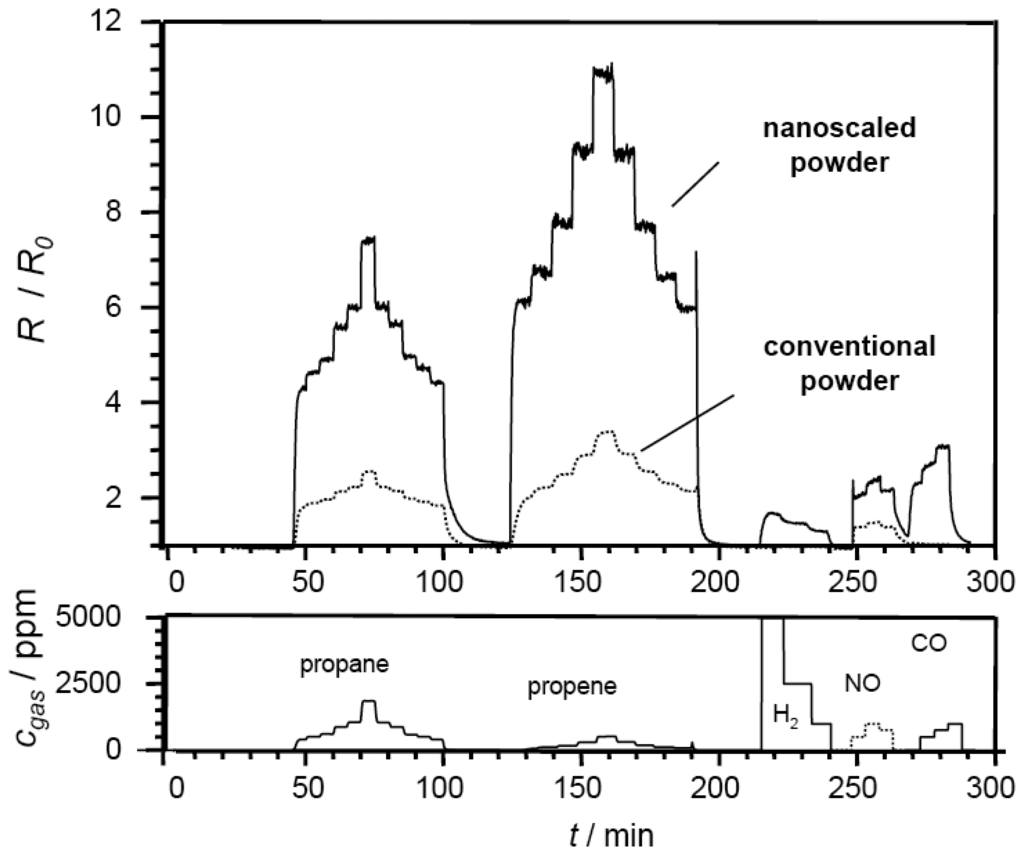
Figure 1.
Impact of the particle size on sensor response R/R0: SrTi0.8Fe0.2O3-δ thick films prepared from microscaled mixed-oxide powders (dotted line) and nanoscaled sol-precipitated precursors (solid line). Test gases as indicated in the bottom part, operating temperature: 400 °C, balance: dry air.
As analyte gases, propane, propene, hydrogen, NO, and CO were tested. The base resistance R0 was 264 kΩ for the nanoscaled sensor and 2.8 kΩ for the microscaled mixed-oxide based sensor at 400 °C. This resistance difference is attributed to the fine-grained microstructure of the nanoscaled sensor films, where the firing temperatures are very low, and consequently almost no sintering occurs. Hence, charge-carrier pathways are passing through many narrow interparticle contacts or “necks”, which contribute to total resistivity, and high resistance values are observed.
Based on these results, which have been reproduced in other test series, the following conclusions were drawn. Both sensors show a fast, reversible, and reproducible response towards propane and propene. Under identical operating conditions and film properties, nanoscaled sensors yielded higher base resistances. In dry air, the sensor baseline was stable, and these sensors responded very fast. Whereas the conventional microscaled powder reaches a maximum change R/R0 of only 3.5 when exposed to 500 ppm propene, the nano-scaled sensor shows a more pronounced response for both hydrocarbons. In this case, a maximum R/R0 value of 11.2 is observed during propene exposure. Compared to the high resistance increase in presence of hydrocarbons, only minor cross interference of NO, CO, and H2 is observed. The conventional device only presents a cross sensitivity towards NO. Neither CO nor H2 exposure led to an increase in resistance. Both devices are thus of high interest for the envisioned application as selective hydrocarbon sensors.
3.2. Electrodeposited films
Figure 2 presents FEG-SEM (LEO Gemini 1550) micrographs of the electrodeposited films. In the case of the electrospun film (Fig. 2 (left)), a randomly distributed net of nanowires with diameters below 100 nm is observed. Although no vacuum drying step had been included in the process, the network morphology was satisfying, and additional EDX studies confirmed that the polymer was burned completely. The electrosprayed sample presented in Fig. 2 (right) presents large microscaled particles (>1 μm) with surface features of dimensions less than 100 nm that could not be resolved further by FEG-SEM.
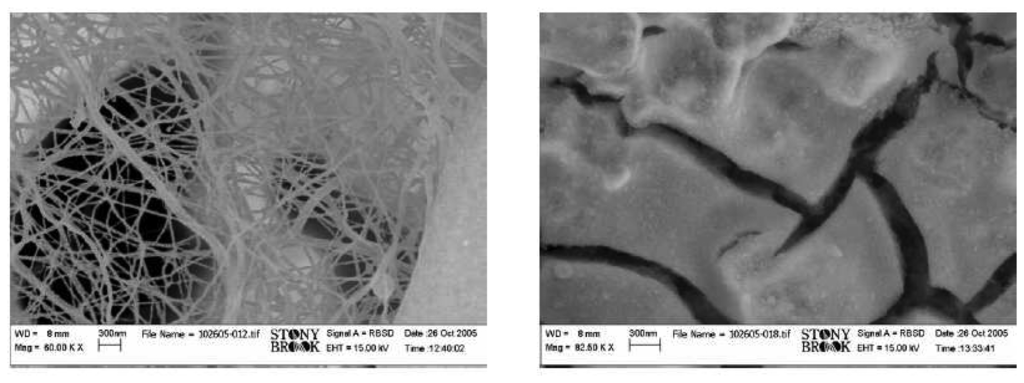
Figure 2.
FEG-SEM micrographs of SrTi0.8Fe0.2O3-δ sensor films prepared by electrospinning (left) and by electrospraying (right).
Typical response curves of an electrospun sample and an electrosprayed film measured at 400 °C are shown in Fig. 3 and in Fig. 4. The base resistance R0 in air was found to be 360 kΩ (electrospun) and 49 kΩ (electrosprayed), respectively. When exposed to reducing gases, the sensor resistance increases as expected for a p-type sensor film. Very good sensor characteristics such as short response and recovery time, and a stable baseline can be observed for both films. At 10 ppm methanol, sensor response R/R0 was observed to be 5.5 (electrospun) and 2.9 (electrosprayed). In the case of the electrospun film, the signal for methanol with concentrations ranging from 5 to 50 ppm in dry air was found to be reproducible.
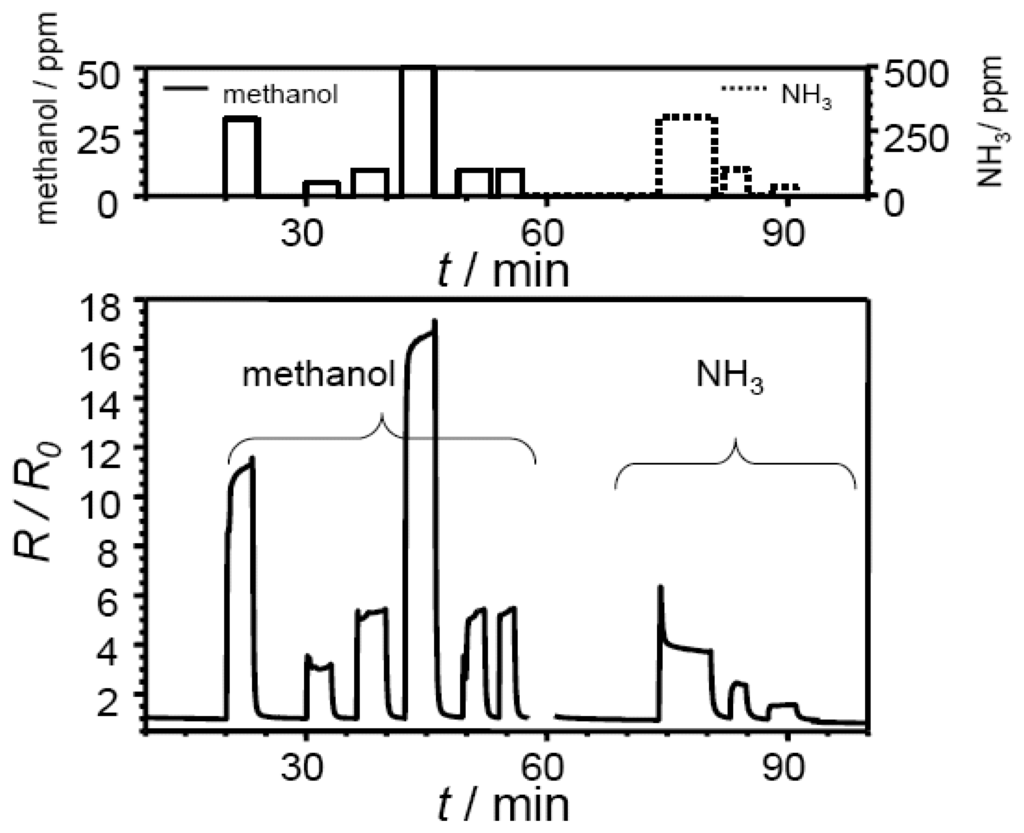
Figure 3.
Sensor response of a SrTi0.8Fe0.2O3-δ electrospun film towards different analyte gases at 400 °C (concentration as indicated, balance: dry air).
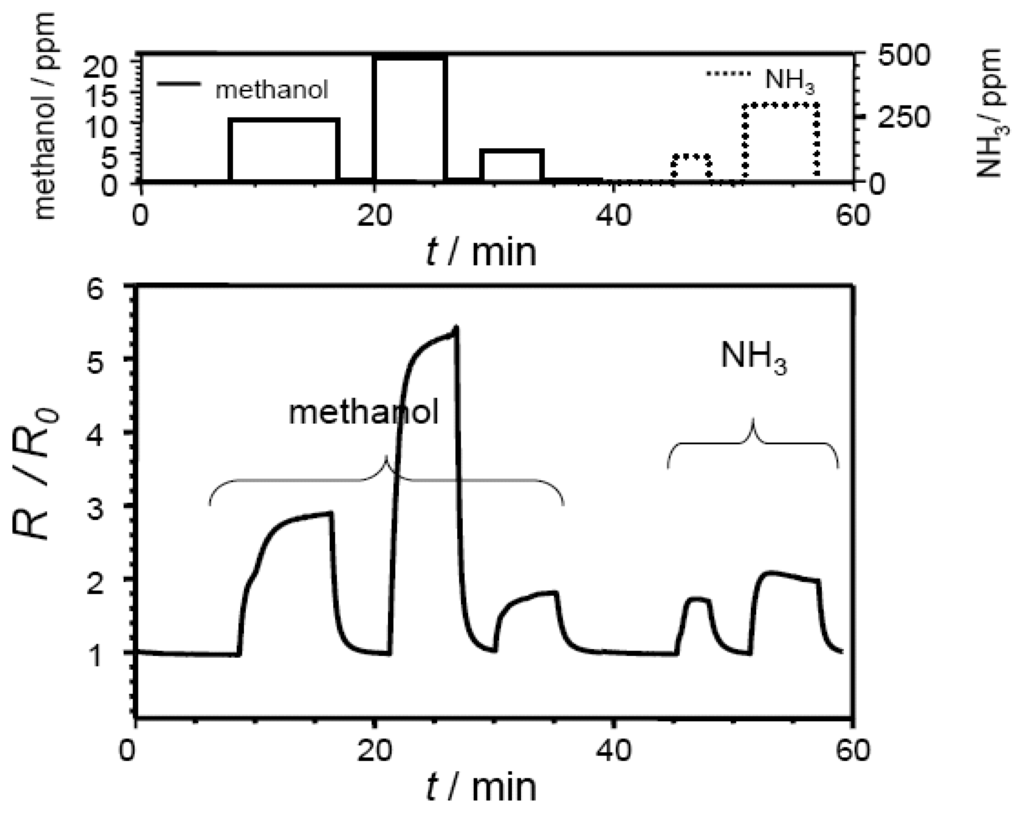
Figure 4.
Sensor response of a SrTi0.8Fe0.2O3-δ electrosprayed film towards different analyte gases at 400 °C (concentration as indicated, balance: dry air).
Compared to the hydrocarbon species, the cross interfering gas ammonia caused a smaller resistance change even if added in higher concentrations (up to 300 ppm).
4. Discussion
4.1. Comparison of the different sensor devices
In Table 1, the results of gas sensor tests towards a variety of test gases at 400 °C as well as typical base resistance values R0 are summarized for the different films. For comparison, the response values obtained with a conventional thick film prepared form microscaled powders (grain size approx. 1.2 μm) have been included.

Table 1.
Comparison of SrTi0.8Fe0.2O3-δ samples prepared by conventional means and by nanotechnology. R/R0 values towards different analyte gases (concentration as indicated) obtained at 400 °C in dry air.
Of the three nanostructured sensors, the electrosprayed film enhanced HC response least (R/R0 at 500 ppm propene: 2.2), but still presented a better performance than the conventional microscaled thick film. A possible explanation for the reduced sensitivity of the electrosprayed sample compared to the other nanosized films was revealed by XRD studies (Fig. 5, Philipps X'Pert, monochromated Cu-Kα radiation), where diffraction patterns showed that SrCO3 was present as a second phase in the sensor film (▾, reference: JCPDS 01-071-2393). Hence, the electrosprayed sample was not single phase perovskite, and the impurities were probably responsible for decreased gas sensing functionality. On the electrospun films, only the main perovskite diffraction peak was observed by XRD (•, reference: JCPDS 35-0734). To prevent the formation of impurities, optimization of the electrospraying parameters is necessary. In addition, an increase in the sintering temperature might improve the phase purity of the electrosprayed sample. Keeping in mind that thermal treatment at higher temperatures might also induce excessive grain growth, thus potentially destroying the nanosized features of the film, this effect will be investigated in a future study.
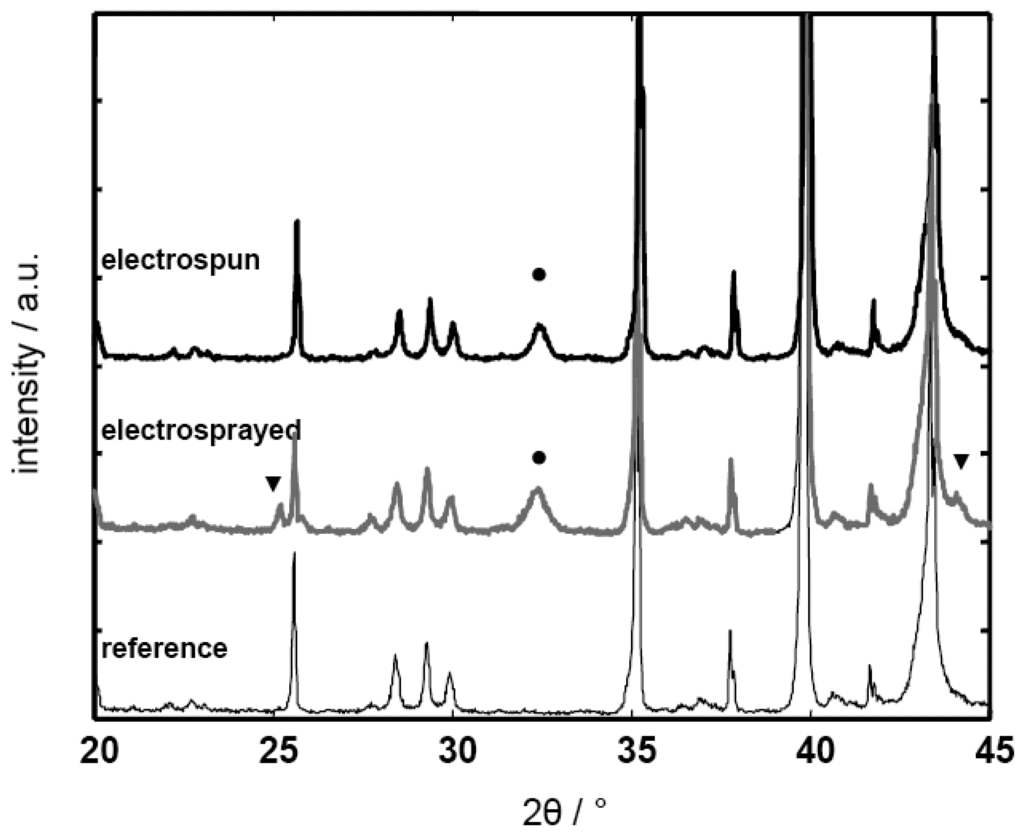
Figure 5.
XRD data of a SrTi0.8Fe0.2O3-δ electrospun film (top) and a SrTi0.8Fe0.2O3-δ electrosprayed film (middle); the complex XRD spectrum of the bare transducer (alumina substrate/ SrAl2O4 underlayer /platinum electrodes) has been added as a reference (bottom). The peaks attributed to the cubic perovskite phase are denoted with •, the strontium carbonate phase peaks are marked with ▾.
In each case, the use of nanosized materials increased sensitivity towards reducing gases with best results for the sol precipitated nanopowder, followed by the electrospun film. At the same time, the sensor response and recovery time are found to be very fast. The following section focuses on the comparison between conventional mixed oxide samples and the most promising sol precipitated nanoscaled powders.
4.2. Mechanistic model
Thorough characterization of the p-type SrTi1-xFexO3-δ sensor films showed that the use of nanoscaled precursor powders significantly enhanced sensor selectivity and sensor response. In the following, a mechanistic model is proposed to explain these observations. It is fundamentally based on the conventional diffusion-reaction model as known from n-type semiconductors [13-15], but it contains a new approach taking into account the catalytic properties and the surface reaction constants of the present p-type conducting oxides [9].
Sensor modeling consists of a macroscopic and a microscopic part. The first describes the macroscopic gas transport through the porous gas sensitive film. In analogy to n-type devices, it is governed by competitive diffusion of the reducing analyte (here denoted as “Red”) into the sensor layer and macroscopic oxidation reaction. The corresponding concentration profile was calculated for the simplified 1-dimensional geometry depicted in Fig. 6a) and the corresponding electrical equivalent circuit (Fig. 6b).
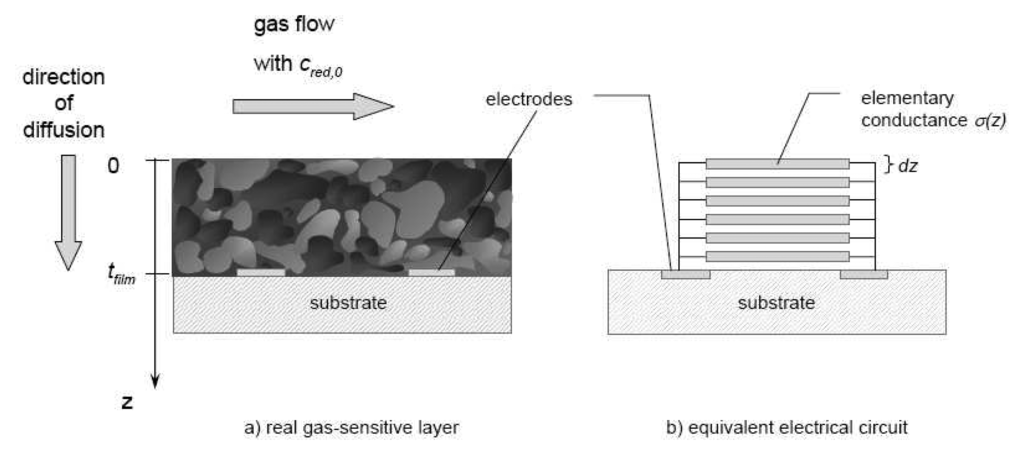
Figure 6.
a) Simplified 1-dimensional approach for modeling screen-printed thick film sensors. b) Simplified electrical equivalent circuit used for the calculation of total conductance. The sensor film was considered as a parallel connection of elementary conductances influenced by local gas concentration cred(z).
If the analyte oxidation follows a first order reaction law, the analyte concentration profile cred in steady-state is determined by the following differential equation as discussed for example in [13]
with Dred, eff: effective diffusion coefficient, depending on gas and microstructure
kred: reaction constant
Empirical equations reported in the literature were used to derive the diffusion constants for the micro- and nanoscaled SrTi0.8Fe0.2O3-δ sensor films [16]. In order to determine redox reaction kinetics, catalytic tests were conducted on microscaled powder samples following the “differential analysis” method described in [17, 18]. The corresponding results are summarized in Table 2 (from [9]). Solving Eq. 2 with the parameter sets for reaction constant and diffusion coefficient, the concentration profile cred(z) was determined.
Table 2.
Reaction constants for analyte oxidation over microscaled SrTi0.8Fe0.2O3-δ powders determined by additional catalytic tests (obtained from [9]).
In a second step, the microscopic dependency between local conductivity σ(z) and local gas concentration cred(z) needs to be derived. In contrast to the standard model for n-type semiconductors, where reaction involves charged oxygen adsorbates and gas sensitivity is related to near-surface depletion layers, another reaction pathway of gas oxidation was considered in the case of p-type SrTi1-xFexO3-δ sensor films. This approach assumes that a reducing gas Red reacts with the semiconducting lattice by consuming near-surface lattice oxygen,
. This would lead to the consumption of holes h• and the formation of near-surface oxygen vacancies
. For all defects, the Kröger-Vink defect notation is used [19]
with k'red: reaction constant
In the temperature range of interest, in- and ex-corporation of gas phase oxygen are slow, i.e.,
with ksurf,ox, k'surf,red : kinetic constants of oxygen in- and ex-corporation, respectively.
Hence, the additional
are not restored immediately by ambient O2. Assuming that bulk diffusion of vacancies is fast, material surface and bulk can equilibrate. As a consequence, surface and bulk defect concentrations are equal, so that the index “surf” can be omitted. Bulk defect concentrations in the presence of a reducing gas thus differ from their equilibrium values in pure air. In particular, hole concentration p changes, which immediately affects conductivity σ and sensor resistance R of the material.
Each of the reactions contributes to the change of oxygen vacancy concentration with time according to
Lattice oxygen Oox is considered as constant throughout the reduction process, i.e., its concentration is included in the modified reaction constants ksurf,red and kred.
The first and second term on the right-hand side correspond to the oxygen ex- and incorporation kinetics, respectively. Lattice reduction is included in the third term. An expression for
concentration was derived using electroneutrality equation and the bulk defect equilibriums. Details on the mechanism are reported elsewhere in detail [20]. Equation 5 was then solved for steady-state conditions, i.e., d [VO• •]/dt = 0, yielding an expression for the hole concentration p.
An Arrhenius-type temperature dependency was assumed for the kinetic constants ksurf,ox and ksurf,red [20]. In an initial approximation, they were correlated by the oxygen exchange equilibrium constant Ksurf as described in Eq. 6:
An Arrhenius-type equation for the equilibrium constant Ksurf is reported in the literature for low iron contents (x < 0.01) [21], but in this initial approach, they served as an estimation for samples with an iron content x ≤ 0.2†.
Substituting the analyte concentration profile cred(z) determined from Eq. 2, total conductance G of the film, which corresponds to a parallel connection network of elementary conductances as depicted in Fig. 6b, was calculated in an 1-dimensional approach.
The conductance in air G0 was obtained by setting cred(z) =0. As fit variable, ksurf,red with the corresponding Arrhenius parameters k0,surf,red and Ered,act was used in the expression for p(z), k,surf,ox being fixed by the oxygen exchange equilibrium constant Ksurf.. Thus, temperature dependent sensor response R/R0 = G0/G was calculated and compared to the experimental by least-squares fit. The film thickness tfilm was determined separately. Details of the modeling procedure are described elsewhere [9].
Figure 7 shows the fit results for propane, propene, and NO response of screen-printed thick films prepared from micro-scaled Sr(Ti0.8Fe0.2)O3-δ powders. The experimental data points were fitted well by the appropriate choice of just two fit parameters k0,surf,red and Ered,act, and a very good correlation between the model and the experimental results was obtained, in particular for propane and NO. R2 values, commonly used as a measure for the goodness of fit, are included in Table 3. The model was found to be a useful and easily manageable tool to predict sensor characteristics. Having thus explained the behavior of microscaled films, the model is expanded to nanoscaled devices.
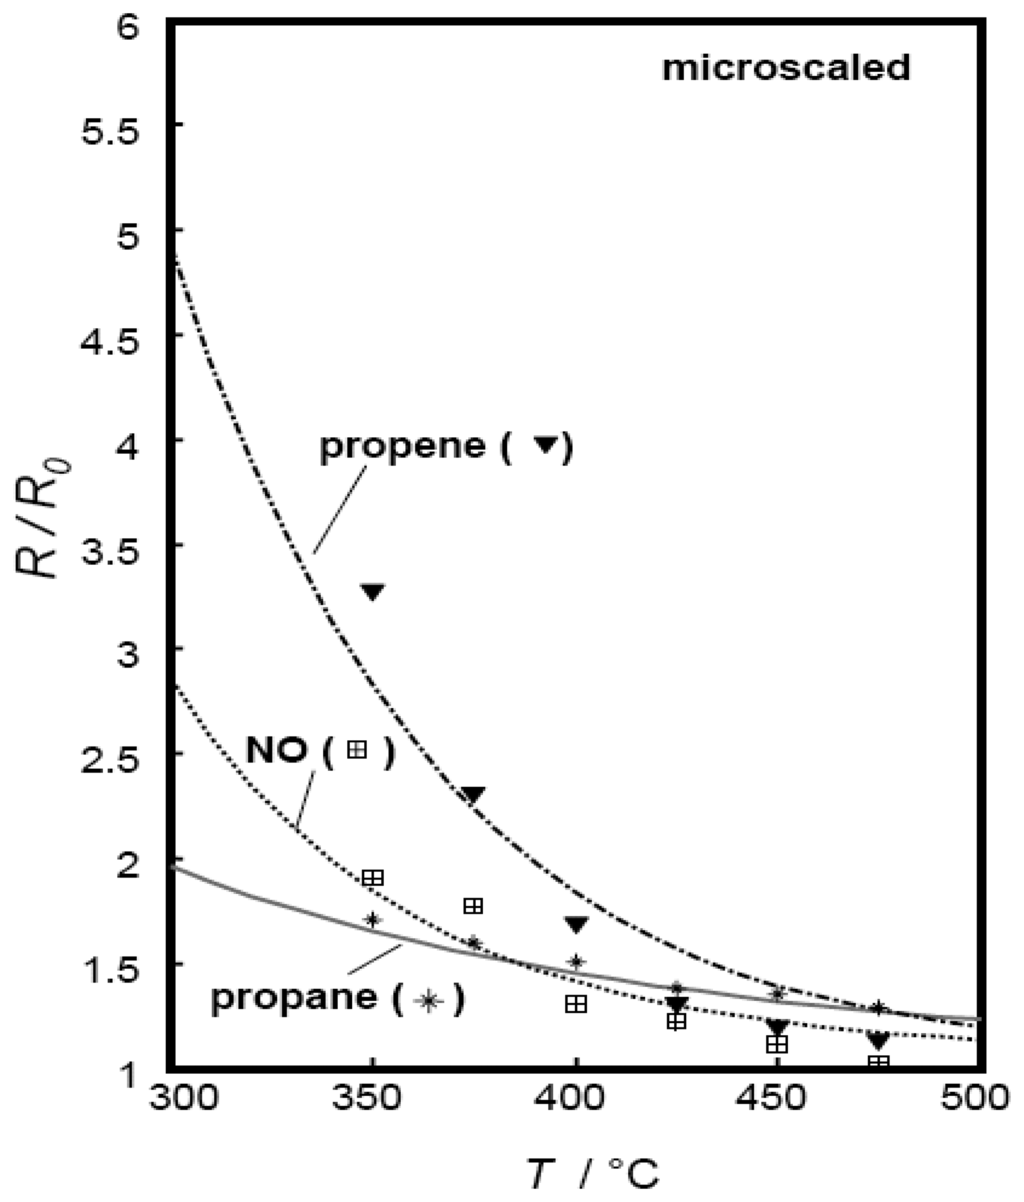
Figure 7.
Calculated and measured propane, propene, and NO response of a SrTi0.8Fe0.2O3-δ microscaled sensor thick film as a function of temperature, film thickness tfilm = 16.7 μm.
Table 3.
Parameters used for fitting the temperature-dependent propane, propene, and NO response of different SrTi0.8Fe0.2O3-δ sensor films. R2 values are included as a measure for the goodness of fit.
Catalytic activity of nanoscaled powders is expected to be higher due to the higher specific surface area. Consequently, the pre-exponential factor k0,redox, which is related to the amount of collisions between the gas phase reactants and the catalytic surface sites, should increase while the activation energy EA,redox should remain unaffected. Hence, to estimate kinetic data for nanoscaled powders, the k0,redox values in m³/kg/mol used for microscaled powders were multiplied by a “surface factor” αBET, the ratio of the corresponding measured BET surface areas of the powders.
Anano, Amicro: specific surface area (BET) of nano- and microscaled powders, respectively.
In Fig. 8, the fitting results of propane and propene response are presented. The cross-interfering gas NO was considered as well. The corresponding fit parameters for k0,surf,red and Ered,act are included in Table 3. The corresponding R2 values (cf. Table 3) were 0.996 for propane and NO, and 0.983 for propene.
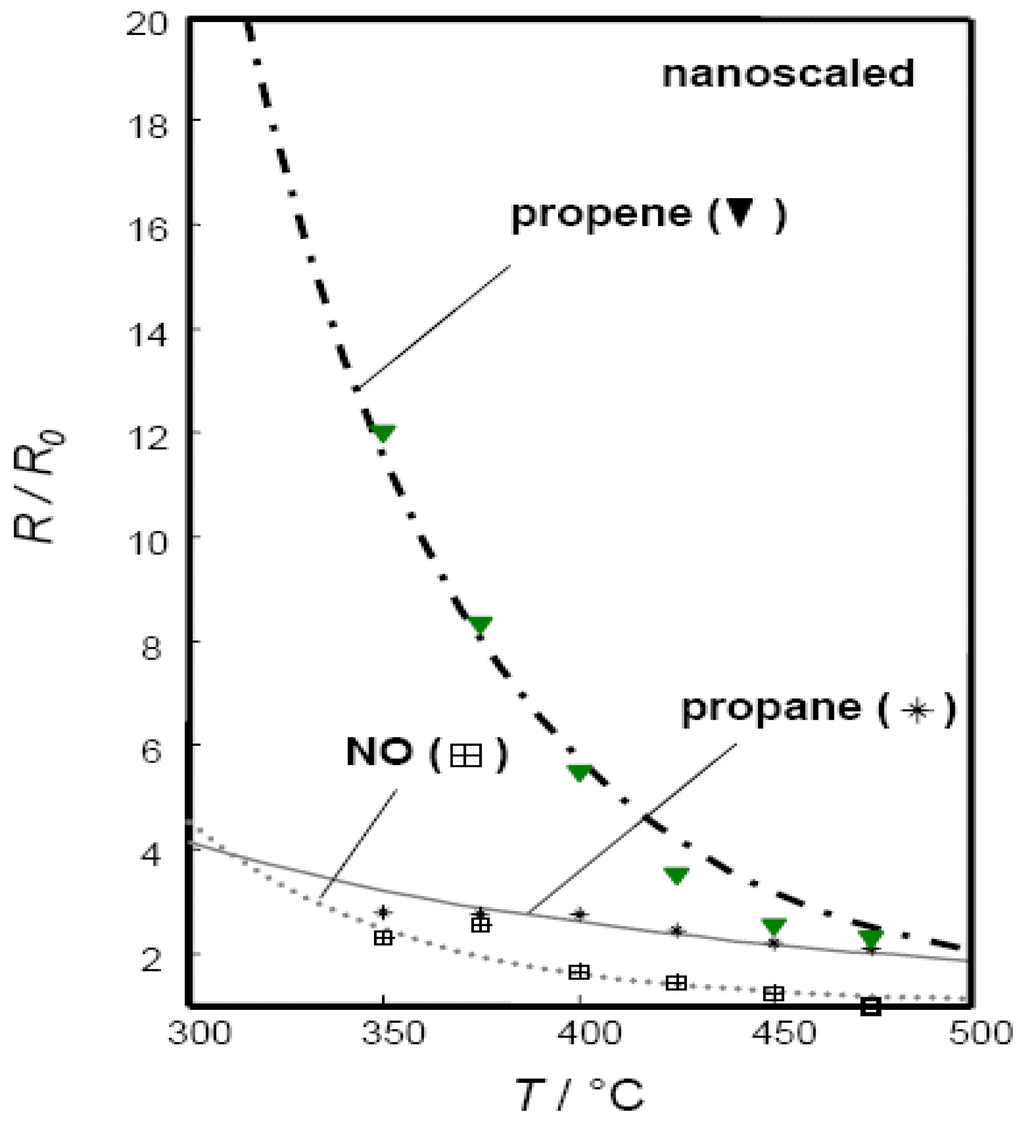
Figure 8.
Dependency of the sensor response towards propane, propene, and NO on operating temperature. Gas sensitive film: SrTi0.8Fe0.2O3-δ nanoscaled thick film, thickness: 10 μm. Solid line: calculated, symbols: experimental data.
5. Conclusions
Perovskite p-type conducting SrTi1-xFexO3-δ was investigated as a model material for application in conductometric hydrocarbon sensing in the temperature range from 350 °C to 450 °C. Using nanoscaled sol-precipitates, the surface-to-volume ratio of the devices was enhanced. These sensors presented an increased selectivity towards propene.
In addition, the first successful preparation of gas-sensitive SrTi1-xFexO3-δ films by novel electrodeposition techniques was shown during this work. Electrospun nanowires in particular presented excellent gas-sensing properties.
A quantitative model was proposed to explain the sensor mechanism. Although it was based on the model that has been applied previously to n-type semiconductors, i.e., sensors of the Taguchi type, it contained novel approaches with respect to the microscopic mechanism. With very few fit variables, the present model was found to represent well sensor functionality of p-type conducting SrTi0.8Fe0.2O3-δ films. In addition to temperature dependency of sensor response, dependency of sensor response on the specific surface area was predicted.
Acknowledgments
The authors thank Ms. K. I. Kalyanasundaram and Ms. A. Bishop, SUNY, for FEG-SEM micrographs and help with electrodeposition.
KS gratefully acknowledges financial support by German Academic Exchange Service (DAAD) as a short-term research scholar.
References and Notes
- Baraton, M. Surface chemistry and functionalization of semiconducting nanosized particles. In Nanostructures: Synthesis, Functional Properties and Applications; Kluwer Academic Publishers: Netherlands, 2003; pp. 427–440. [Google Scholar]
- Wang, Z. L. Nanobelts, nanowires, and nanodiskettes of semiconducting oxides - from materials to nanodevices. Advanced Materials 2003, 15, 432–436. [Google Scholar]
- Papargyri, S.A.; Tsipas, D. N.; Papargyris, D. A.; Botis, A. I.; Papagyris, A. D. Review on the production and synthesis of nanosized SnO2. Solid State Phenomena 2005, 106, From Nanopowders to Functional Materials. 57–62. [Google Scholar]
- Bochenkov, V.; Sergeev, G. Preparation and chemiresistive properties of nanostructured materials. Adv. Colloid Interface Sci. 2005, 116, 245–254. [Google Scholar]
- Comini, E.; Ferroni, M.; Guidi, V.; Faglia, G.; Martinelli, G.; Sberveglieri, G. Nanostructured mixed oxides compounds for gas sensing applications. Sens. Actuators B. 2002, 84, 26–32. [Google Scholar]
- Guidi, V.; Carotta, M. C.; Ferroni, M.; Martinelli, G.; Paglialonga, L.; Comini, E.; Sberveglieri, G. Preparation of nanosized titania thick and thin films as gas-sensors. Sens. Actuators B. 1999, 57, 197–200. [Google Scholar]
- Gouma, P. I. Nanostructured polymorphic oxides for advanced chemosensors. Rev. Adv. Mater. Sci. 2003, 5, 147–154. [Google Scholar]
- Sahner, K.; Moos, R.; Matam, M.; Tunney, J.; Post, M. Hydrocarbon sensing with thick and thin film p-type conducting perovskite materials. Sens. Actuators B. 2005, 108, 102–112. [Google Scholar]
- Sahner, K. Modeling of p-type semiconducting perovskites for gas sensor applications; Shaker: Verlag Aachen, Germany, 2006; pp. 23–25, and Chap. 5. [Google Scholar]
- Zheng, H.; Liu, I.; Meng, G.; Sørensen, O. T. Fine SrTiO3and Sr(Mg0.4Ti0.6)O3-δperovskite ceramic powders prepared by a sol-precipitation process. J. Mater. Sci.: Materials in Electronics 2001, 12, 629–635. [Google Scholar]
- Moos, R.; Rettig, F.; Hürland, A.; Plog, C. Temperature-independent resistive oxygen exhaust gas sensors for lean-burn engines in thick-film technology. Sens. Actuators B. 2003, 93, 43–50. [Google Scholar]
- Sahner, K.; Schönauer, D.; Matam, M.; Post, M.; Moos, R. Selectivity enhancement of p-type semiconducting hydrocarbon sensors - the use of sol precipitated nano-powders. Sens. Actuators B. accepted.
- Sakai, G.; Matsunaga, N.; Shimanoe, K.; Yamazoe, N. Theory of gas-diffusion controlled sensitivity for thin film semiconductor gas sensor. Sens. Actuators B. 2001, 80, 125–131. [Google Scholar]
- Ahlers, S.; Müller, G.; Doll, T. Factors influencing the gas sensitivity of metal oxide materials. In Encyclopedia of sensors; Grimes, C., Dickey, E., Pishko, M., Eds.; American Scientific Publishers, 2006; pp. 1–35. [Google Scholar]
- Williams, D. Conduction and gas response of semiconductor gas sensors. In The Adam Hilger Series on Sensors; IOP Publishing Ltd.: Bristol, 1987; pp. 71–123. [Google Scholar]
- Skelland, A. H. P. Diffusional Mass Transfer; Robert E. Krieger Publishing Company: Malabar, Florida, 1985; Chapter 3, Molecular Diffusivities; pp. 49–82. [Google Scholar]
- Baerns, M.; Hofmann, H.M.; Renken, A. Chemische Reaktionstechnik (Chemical reaction engineering); Georg Thieme Verlag: Stuttgart, 1999. [Google Scholar]
- Hagen, J. Chemische Reaktionstechnik (Chemical reaction engineering); VCH: Weinheim, 1993. [Google Scholar]
- Kröger, F.A.; Vink, H. J. Relations between the concentrations of imperfections in crystalline solids. Solid State Physics 1956, 3, 307–435. [Google Scholar]
- Sahner, K.; Moos, R. Modeling of hydrocarbon sensors based on p-type semiconducting perovskites. Phys. Chem. Chem. Phys 2007, 9, 635–642. [Google Scholar]
- Merkle, R.; Maier, J. Oxygen incorporation into Fe-doped SrTiO3: Mechanistic interpretation of the surface reaction. Phys. Chem. Chem. Phys 2002, 4, 4140–4148. [Google Scholar]
- Merkle, R. unpublished personal communication 2006.
- 1Preliminary tests with the present sol indicated that phase-pure perovskite is obtained after heat-treatment at temperatures as low as 700 °C. For thermal treatment of the electrodeposited films, a very low sintering temperature of 750 °C was chosen in order to maintain the nanosized features. For the screen-printed thick films, a higher sintering temperature of 850 °C was needed to assure a good adhesion to the sensor substrates.
- 2The data sets included in Table 1 were obtained in a measurement series on different samples. Variations in the base resistance (in comparison to Fig. 1 and 2) are attributed to the conventional scattering observed for different samples. In particular the electrodeposited films present a broad variation of the base resistance due to the intrinsic statistical characteristics of the deposition process. In order to compare the sensor responses, the normalized R/R0 values were therefore used.
- †From kinetic measurements, k0 is obtained in m³/(kg·s). For conversion of units to 1/s, k0 values are multiplied by the apparent density of the gas sensitive layer, i.e., ρapparent =ρbulk·(1-ε) in kg/ m³ with ε: film porosity determined from SEM micrographs.
- ‡estimated value
© 2007 by MDPI ( http://www.mdpi.org). Reproduction is permitted for noncommercial purposes.