Comparative and Combinative Study of Urban Heat island in Wuhan City with Remote Sensing and CFD Simulation

Abstract
:
1. Introduction
2. Methodology
2.1. Calculation of inversion model in Remote Sensing
2.2 Computational Fluid Dynamics
3. The case study of Wuhan
3.1 Comparative study of urban heat island using RS technology
3.1.1 Different scale comparison of heat environment situation in Wuhan
3.1.2 Urban heat island comparison at different stages
3.1.3 Comparative study of heat environment with another typical city
3.2 Heat environment study for city development planning with joint use of CFD simulation
4. Conclusions
Acknowledgments
References and Notes
- Stathopoulou, M.; Cartalis, C. Daytime urban heat islands from Landsat ETM+ and Corine land cover data: An application to major cities in Greece. Solar Energy 2007, 81, 358–368. [Google Scholar]
- Rizwan, A.M.; Dennis, L.Y.C.; Liu, C.H. A review on the generation, determination and mitigation of Urban Heat Island. J. Environ. Sci. 2008, 20, 120–128. [Google Scholar]
- Jusuf, S.K.; Wong, N.H.; Hagen, E.; Anggoro, R.; Hong, Y. The influence of land use on the urban heat island in Singapore. Habitat Int. 2007, 31, 232–242. [Google Scholar]
- Yuan, F.; Bauer, M.E. Comparison of impervious surface area and normalized difference vegetation index as indicators of surface urban heat island effects in Landsat imagery. Remote Sens. Environ. 2007, 106, 375–386. [Google Scholar]
- Mochida, A.; Murakami, S.; Ojima, T.; Kim, S.; Ooka, R.; Sugiyama, H. CFD analysis of mesoscale climate in the Greater Tokyo area. J. Wind Eng. Ind. Aerodyn. 1997, 67-68, 459–477. [Google Scholar]
- Ashie, Y.; Thanh Ca, V.; Asaeda, T. Building canopy model for the analysis of urban climate. J. Wind Eng. Ind. Aerodyn. 1999, 81, 237–248. [Google Scholar]
- Tian, G.L. Thermal remote sensing; Publishing House of Electronics Industry: Beijing, 2006. [Google Scholar]
- Qin, Z.H; Zhang, M.H.; Karniell, A.; Berliner, P. Mono-window algorithm for retrieving land surface temperature from landsat TM6 data. Acta Geograph. Sin. 2001, 56, 456–466. [Google Scholar]
- Qin, Z.H; Li, W.J.; Zhang, M.H.; Karniell, A.; Berliner, P. Estimating of the essential atmospheric parameters of mono-window algorithm for land surface temperature retrieval from landsat TM6. Remote Sens. Land Resour. 2003, 37–43. [Google Scholar]
- Qin, Z.H; Li, W.J.; Xu, B.; Chen, Z.X.; Liu, J. The estimation of land surface emissivity for landsat TM6. Remote Sens. Land Resour. 2004, 28–41. [Google Scholar]
- Li, J. Estimating land surface temperature from Landsat-5 TM. Remote Sens. Technol. Appl. 2006, 21, 322–325. [Google Scholar]
- Gu, X.L.; Zhao, J.N.; Gao, J.; Gao, P.S. CFD commercial software and air conditioning & refrigeration. Refrig. J. 2003, 45–49. [Google Scholar]
- Liu, H.Z.; Jiang, Y.J.; Liang, B.; Zhu, F.R.; Zhang, B.Y.; Shang, J.G.. Wind environment research around tall buildings in city. Sci. China Ser. D: Earth Sci. 2005, 35 (Suppl.), 84–96. [Google Scholar]
- Zheng, J. Research on the design strategies for the climate adaptabllity of residential quarter's outdoor space in hot summer and cold winter zone.; Dissertation, Huazhong University of Science & Technology: Wuhan, 2005. [Google Scholar]
- Bo, Y. Design strategies for the climate adaptability of multi-storied convex residential balconies in hot summer and cold winter zone.; Dissertation, Huazhong University of Science & Technology: Wuhan, 2004. [Google Scholar]
- Yu, Z.; Zhang, H. Digital model of CFD simulation design in urban planning. City Plan. Rev. 2007, 31, 52–55. [Google Scholar]


| Region | Meters ² | Percentage (%) | Mean land surface temperature value (°C) | Mean value of NDVI | Mean value of NDBI |
|---|---|---|---|---|---|
| High density | 31,257,004.5 | 2.461 | 45.180924 | -0.250509 | 0.263994 |
| Sub-high density | 77,053,284 | 6.067 | 43.405907 | -0.245984 | 0.229854 |
| Middle density | 164,602,462.5 | 12.961 | 39.613286 | -0.186561 | 0.179671 |
| Low density | 109,859,249.3 | 8.651 | 37.619073 | -0.095846 | 0.151695 |
| Vegetation | 389,091,305.3 | 30.638 | 32.560922 | 0.20666 | -0.023167 |
| River | 105,008,492.3 | 8.269 | 26.149353 | -0.532438 | -0.139054 |
| Lake | 107,268,171.8 | 8.447 | 28.83498 | -0.41505 | -0.110941 |
| Other | 285,804,783 | 22.505 | 32.34296 | -0.163481 | -0.025443 |
| Region | Meters² | Percentage (%) | Mean land surface temperature value (°C) | Mean value of NDVI | Mean value of NDBI |
|---|---|---|---|---|---|
| High density | 24,326,887.50 | 3.238 | 45.430794 | -0.253232 | 0.272563 |
| Sub-high density | 61,799,229.00 | 8.225 | 43.521017 | -0.247469 | 0.235672 |
| Middle density | 106,861,234.50 | 14.222 | 39.955588 | -0.194577 | 0.187942 |
| Low density | 51,787,435.50 | 6.892 | 37.800995 | -0.093743 | 0.1439 |
| Vegetation | 94,657,990.50 | 12.598 | 32.856176 | 0.197542 | -0.020667 |
| River | 48,274,454.25 | 6.425 | 25.926209 | -0.537256 | -0.121711 |
| Lake | 44,042,631.75 | 5.862 | 28.526494 | -0.416726 | -0.095614 |
| Other | 86,394,971.25 | 11.498 | 32.344091 | -0.171347 | -0.005489 |
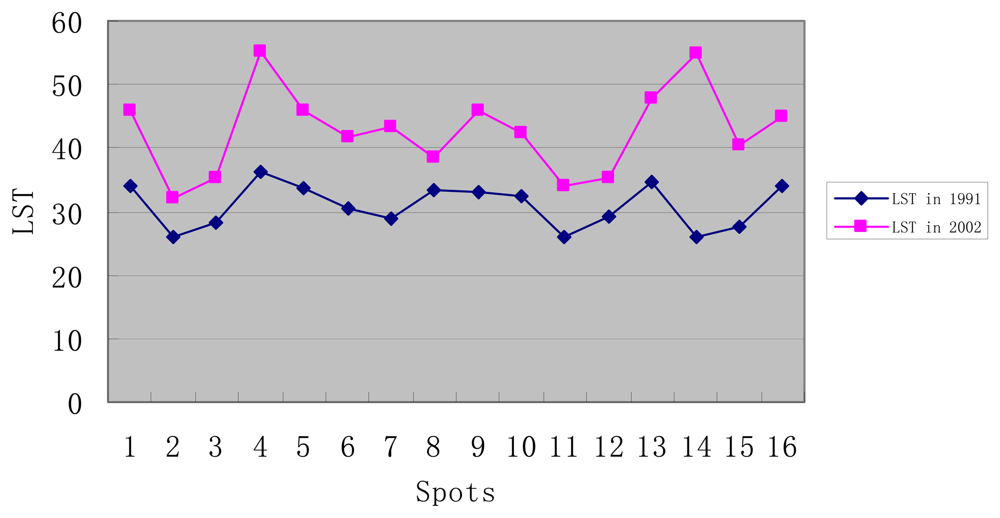
| Name | Land surface pattern | Land surface temperature in July 19th, 1991 (°C) | NDVI on July 19th, 1991 | Land surface temperature on July 9th, 2002 (°C) | NDVI on July 9th, 2002 |
|---|---|---|---|---|---|
| Hanzheng street | Commercial street | 33.873688 | -0.1 | 45.816256 | -0.350427 |
| Jiefang park | Green park | 26.13504 | 0.348837 | 32.089508 | 0.204301 |
| Zhongshan park | Green park | 28.264862 | 0.16129 | 35.433502 | 0.159664 |
| Wuhan steel plant | Factory | 36.295788 | -0.090909 | 55.130981 | -0.25 |
| Wuchang railway station | Traffic architecture | 33.845154 | -0.111111 | 45.852692 | -0.341772 |
| Guanggu square | Commercial building | 30.487366 | 0.257732 | 41.7742 | -0.244186 |
| Xudong square | Commercial building | 28.991302 | 0.207547 | 43.166731 | -0.101604 |
| Wuhan square | Commercial building | 33.25412 | 0.08046 | 38.343536 | -0.320388 |
| Wenhua lane | Old city region | 33.091064 | -0.090909 | 46.032379 | -0.302632 |
| Jiqin Street | Old city region | 32.419464 | 0.111111 | 42.206299 | -0.314286 |
| Guishan TV. tower | Green park | 26.043304 | 0.37931 | 33.854095 | 0.146853 |
| Qintai street | Traffic node | 29.112122 | -0.045455 | 35.436462 | -0.270073 |
| Yingwu state | Normal city region | 34.66684 | -0.103448 | 47.785339 | -0.251613 |
| Dongfeng stamping company | Factory | 25.8414 | 0.452991 | 54.78064 | -0.312977 |
| Huazhong University of Science & Technology | University | 27.517944 | 0.431818 | 40.284821 | -0.008 |
| Wuhan heavy hanging wall machine tool plant | Factory | 34.070038 | 0.052632 | 44.867493 | -0.045455 |
© 2008 by the authors; licensee Molecular Diversity Preservation International, Basel, Switzerland. This article is an open-access article distributed under the terms and conditions of the Creative Commons Attribution license (http://creativecommons.org/licenses/by/3.0/).
Share and Cite
Li, K.; Yu, Z. Comparative and Combinative Study of Urban Heat island in Wuhan City with Remote Sensing and CFD Simulation. Sensors 2008, 8, 6692-6703. https://doi.org/10.3390/s8106692
Li K, Yu Z. Comparative and Combinative Study of Urban Heat island in Wuhan City with Remote Sensing and CFD Simulation. Sensors. 2008; 8(10):6692-6703. https://doi.org/10.3390/s8106692
Chicago/Turabian StyleLi, Kun, and Zhuang Yu. 2008. "Comparative and Combinative Study of Urban Heat island in Wuhan City with Remote Sensing and CFD Simulation" Sensors 8, no. 10: 6692-6703. https://doi.org/10.3390/s8106692