Article

Using ASTER Imagery in Land Use/cover Classification of Eastern Mediterranean Landscapes According to CORINE Land Cover Project

1
Kahramanmaras Sutcu Imam University, Faculty of Forestry , Department of Forest Engineering, 46060, Kahramanmaras, Turkey
2
Kahramanmaras Sutcu Imam University, Faculty of Agriculture, Department of Soil Science , 46060, Kahramanmaras, Turkey
*
Author to whom correspondence should be addressed.
Sensors 2008, 8(2), 1237-1251; https://doi.org/10.3390/s8021287
Submission received: 7 February 2008 / Accepted: 19 February 2008 / Published: 21 February 2008

Abstract

:
The satellite imagery has been effectively utilized for classifying land cover types and detecting land cover conditions. The Advanced Spaceborne Thermal Emission and Reflection Radiometer (ASTER) sensor imagery has been widely used in classification process of land cover. However, atmospheric corrections have to be made by preprocessing satellite sensor imagery since the electromagnetic radiation signals received by the satellite sensors can be scattered and absorbed by the atmospheric gases and aerosols. In this study, an ASTER sensor imagery, which was converted into top-of-atmosphere reflectance (TOA), was used to classify the land use/cover types, according to COoRdination of INformation on the Environment (CORINE) land cover nomenclature, for an area representing the heterogonous characteristics of eastern Mediterranean regions in Kahramanmaras, Turkey. The results indicated that using the surface reflectance data of ASTER sensor imagery can provide accurate (i.e. overall accuracy and kappa values of 83.2% and 0.79, respectively) and low-cost cover mapping as a part of inventory for CORINE Land Cover Project.

1. Introduction

Monitoring and assessing land use/cover information is very important in managing natural resources. In recent decades, remotely sensed data have been widely used to provide the land use/cover information such as degradation level of forests and wetlands, rate of urbanization, intensity of agricultural activities, and other human-induced changes [1]. In remote sensing technology, classification as a common image processing technique is implemented to derive data regarding land use/cover types [2]. Especially in Mediterranean regions with complex and heterogeneous landscapes, classification techniques are crucial to generate accurate and inexpensive land use/cover maps [3, 4, 5, 6]. Besides, the classification of land use/cover types provides useful information in mapping vegetation and ecosystem types [7, 8, 9]. Then, these thematic maps can be also used to generate necessary database for empirical and process-based models of soil loss, hydrological cycle, and carbon flux [10, 11, 12, 13, 14].
The satellite imagery has been effectively utilized in classification process, especially, in generating land use/cover maps and detecting land cover conditions [6, 15, 16]. Landsat images have been commonly used in the studies of mapping and monitoring natural resources worldwide. Landsat imagery with a moderate spatial resolution of 30 m has been effectively used to classify homogeneous landscapes [5]; however, their accuracy may diminish in eastern Mediterranean regions with highly heterogeneous landscapes [17].
The Advanced Spaceborne Thermal Emission and Reflection Radiometer (ASTER) has been recently developed by collaboration of NASA and Japan's Ministry of International Trade and Industry to provide accurate satellite images with high spatial and spectral resolutions [18]. The ASTER sensor operates three different spectral regions including the visible and near infrared (VNIR), the short-wave infrared (SWIR), and the thermal infrared (TIR). According to Rowan and Mars [19], the visible and near-infrared telescope on ASTER with a spatial resolution of 15 m is very useful to acquire vegetative information. The ASTER images with high spatial and spectral resolutions can provide more accurate and low-cost land cover mapping [20, 21, 22].
The electromagnetic radiation (EMR) signals received by the satellite sensors are subject to some type of distortion due to scattering and absorption effects of atmospheric gases and aerosols [23, 24]. Therefore, atmospheric corrections have to be made by converting radiance values to top-of-atmosphere (TOA) reflectance, especially in multispectral VNIR bands [25]. The surface reflectance data results in better calibration of multi-sensor imagery, less blurring effects of atmospheric scattering, and easier interpretation, when comparing with original digital number (DN) value or calibrated radiance data [26, 27, 28, 29].
In classification process, supervised classification has been widely used in remote sensing applications. In supervised classification, spectral signatures are collected from specified locations (training sites) in the image by digitizing various polygons overlaying different land use types. The spectral signatures are then used to classify all pixels in the scene. The supervised classification is generally followed by knowledge-based expert classification systems depending on reference maps to improve the accuracy of the classification process [30, 31].
Expert systems have been successfully implemented in classifying land use/cover types, especially, for heterogeneous landscapes [32, 33]. Besides, expert systems can be used to reclassify the classified images according to some specific land use/cover classification standards. In this study, land use/cover classification standards of COoRdination of INformation on the Environment (CORINE) Land Cover Project were used in the process of expert classification system. The CORINE was established by the European Union (EU) in 1985 to generate the European environmental landscape based on interpretation of satellite images and ancillary data [34]. It provides land use/cover maps for European countries for environmentalists and for policy makers.
The main purpose of this study is to perform the land use/cover classification of a study area in the province of Kahramanmaras located in the Mediterranean region of Turkey. The classification was performed on an ASTER sensor imagery, which was converted into TOA reflectance. The capabilities and opportunities of applying ASTER imagery to provide accurate land use/cover classification of heterogeneous Mediterranean landscapes were investigated as a part of inventory for CORINE Land Cover Project.

2. Material and Methods

2.1 Study Area

The study area is located in the eastern Mediterranean region of Turkey, about 20 km southeast from the city of Kahramanmaras (Figure 1). The study area covers approximately 21000 ha of land with the elevation of 500 to 850 m and slope of 0 to 39%. The area represents the heterogonous characteristics of the eastern Mediterranean regions consisting of the wide variety of agricultural systems (i.e. fallow land, rainfed and irrigated field crops), forest ecosystems, rangelands, shrub lands, bare rocks, wetland, water bodies, and residential areas.

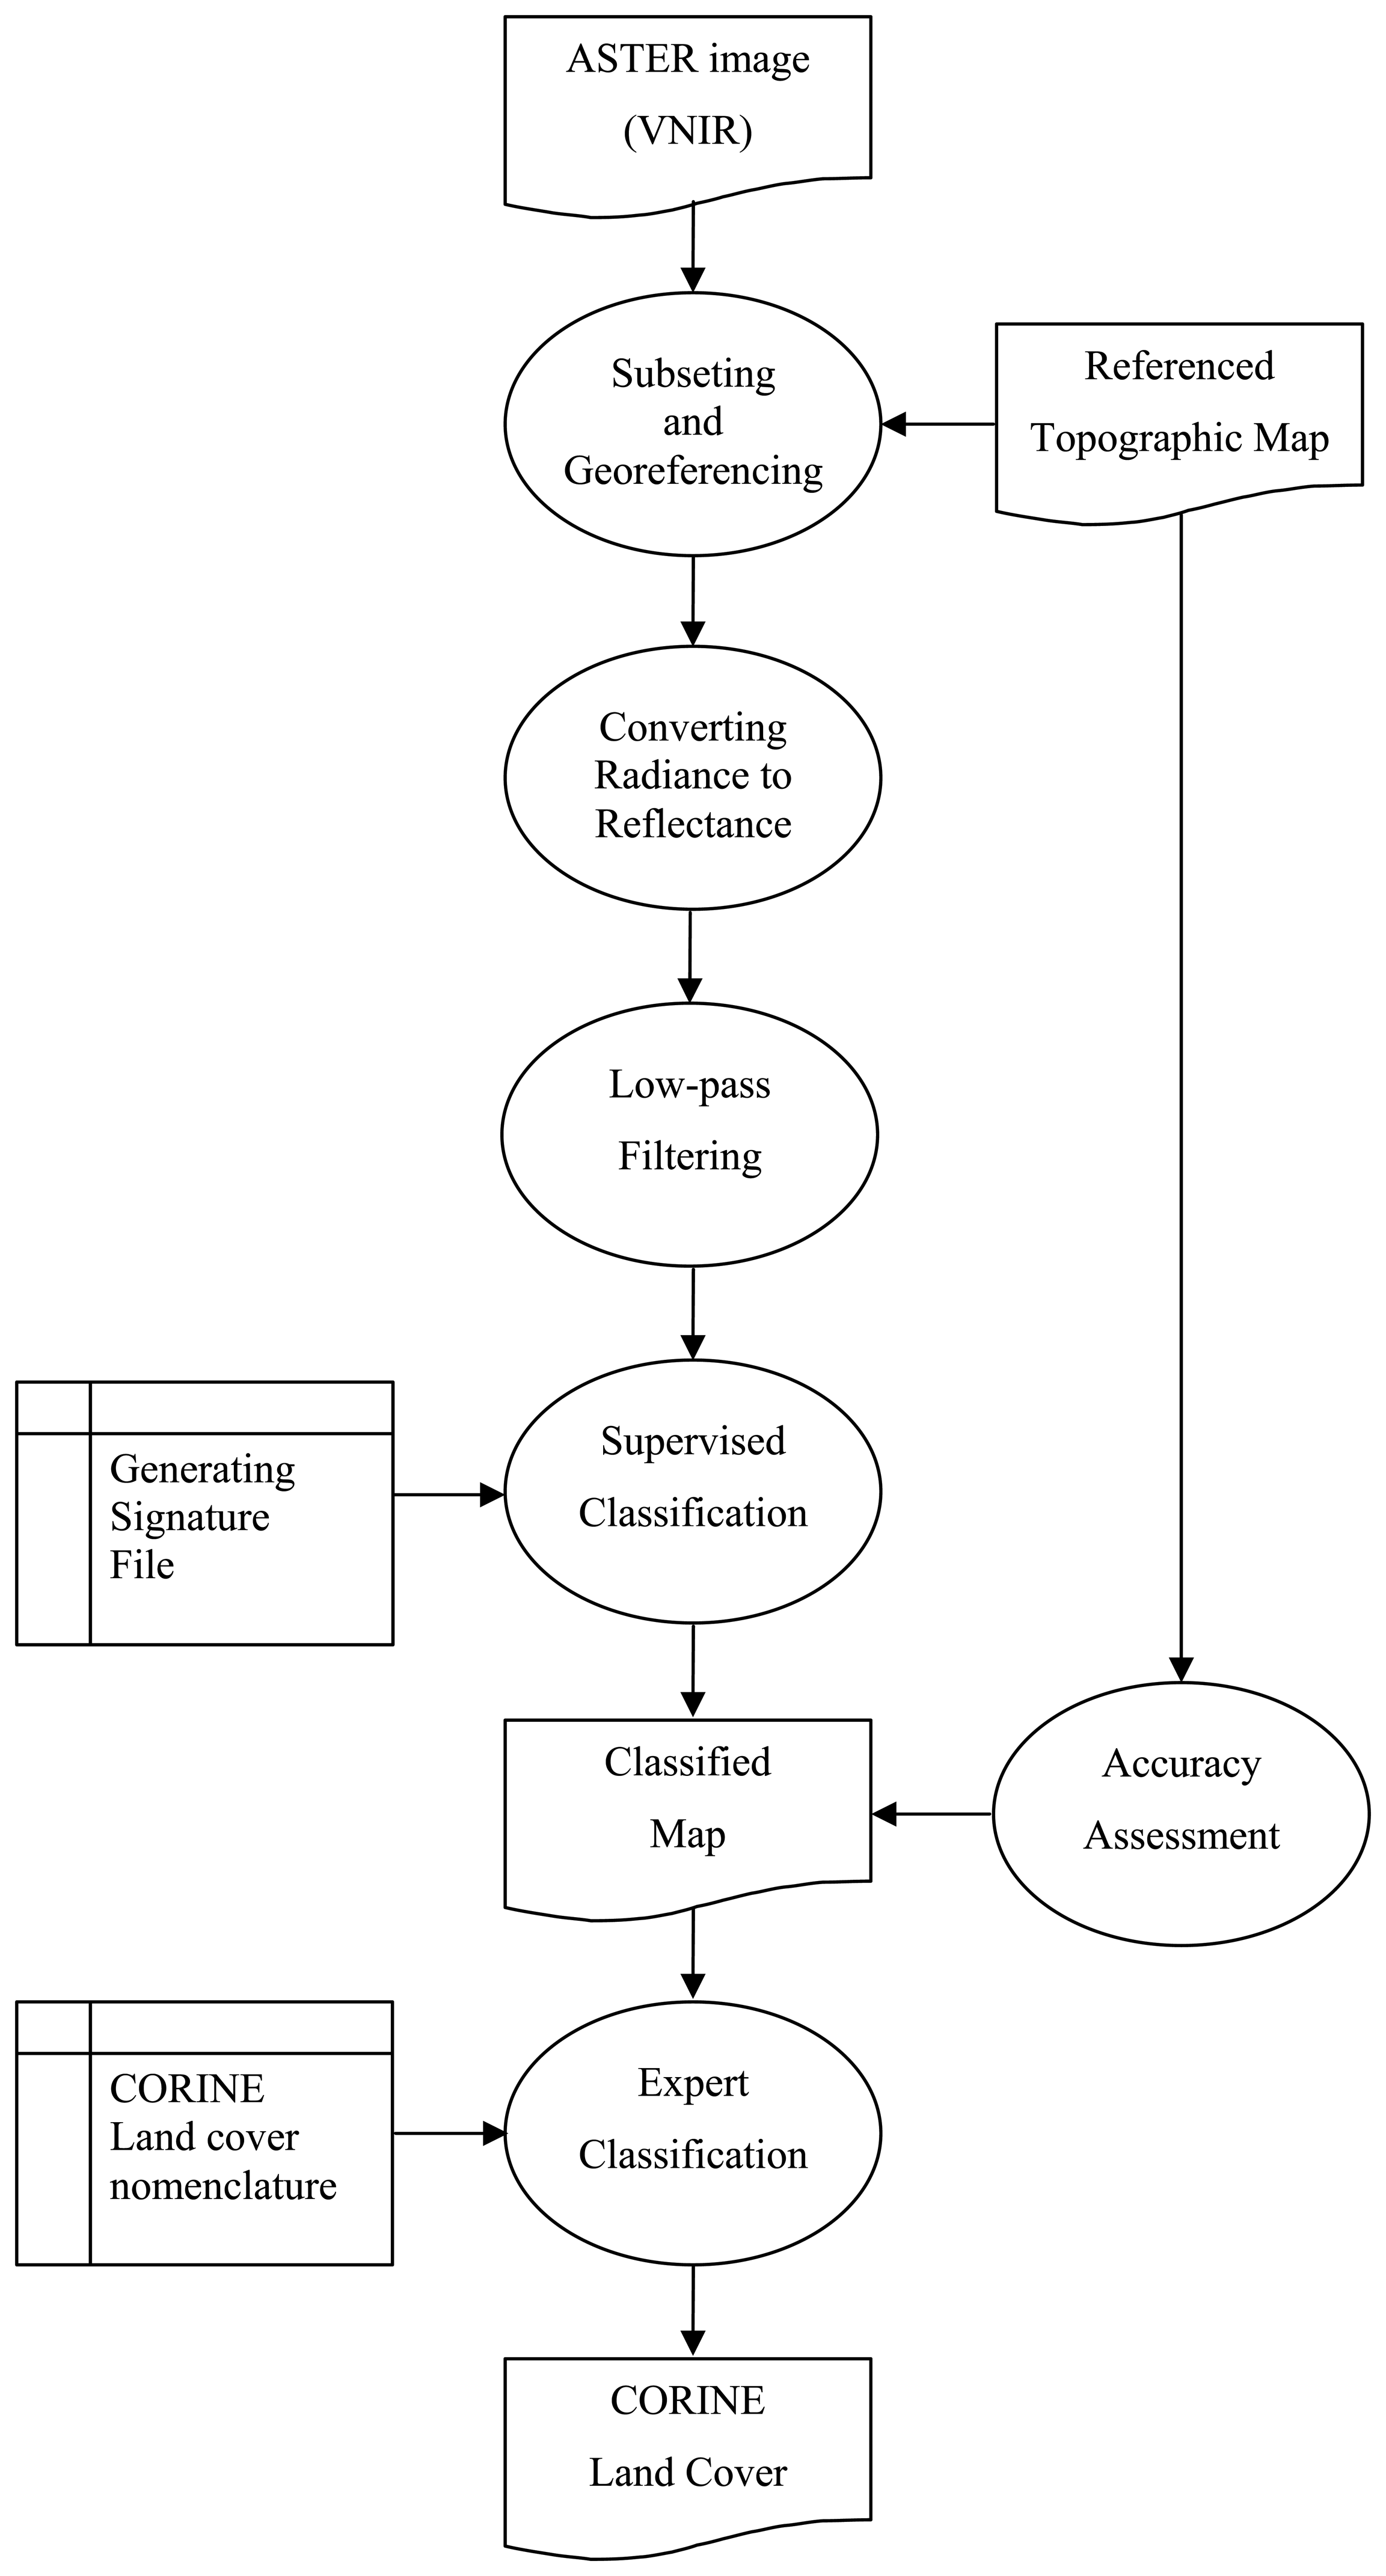
2.2. Image Processing

The image processing was performed in four stages including preprocessing, converting ASTER radiance values to reflectance, land use/cover classification, and expert classification. The logic behind the image processing techniques was indicated in Figure 2.

2.2.1. Preprocessing

A Level 1A ASTER image (VNIR) of the study area was acquired on the 16th of August, 2005 with a cloud cover of 0%. In preprocessing stage, first the images were imported into the “image” format in ERDAS Imagine 8.5 software [35] using the built-in ASTER import dialog. Then, the study area was clipped out from the ASTER image by using “Subset” function in ERDAS 8.5, referencing 7.5-minute topographic map (i.e. Gaziantep N38a1). The final image was georeferenced based on a topographic map with 1:25 000 scale and then re-projected into the UTM projection zone 37 and ED 50 datum, using a first-order polynomial nearest-neighbor transformation. Approximately 24 ground control points (GCPs) were used in the rectification process resulting in an overall RMS error of less than 0.5 pixels using a second order polynomial model.

2.2.2. Converting ASTER Radiance Values to Reflectance

To eliminate the effects of atmospheric scattering and absorption in the VNIR and to increase the accuracy of surface type classification [24, 26, 29], the ASTER DN values were converted to TOA reflectance by using the procedure reported by [36]. This procedure is divided into two stages; (1) Converting DN values to spectral radiance and (2) Transferring the sensor detected radiance into TOA reflectance. In the first stage, DN values of the sensor measurements are converted into spectral radiance measured (Lrad) by satellite sensors using the following equation:
L rad = ( D N 1 ) × c )
where c is the unit conversion coefficient which differs for each ASTER band. In this study, the normal values of c for each band (Table 1) were obtained from the user guide of ASTER [37]. In the second stage, the sensor detected radiance was transferred into the ground surface reflectance (RTOA) using Eq. 2:
R TOA = ( π × L rad × d 2 ) ÷ ( ESU N i × cos ( z ) )
where π ≈ 3.14159, ESUNi is the mean solar exoatmospheric irradiance of each band (Table 1), z is the solar zenith angle, (z = 90 – solar elevation angle), which is within the ASTER header file, and d is the earth-sun distance (in astronomical units), which can be calculated using the following equation in Microsoft EXCEL format [39, 40]:
d = 1 0.01672 × COS ( RADIANS ( 0.9856 × ( Julian _ Day 4 ) ) )
To evaluate the effects of converting processes, NDVI was calculated for both radiance values and TOA reflectance of ASTER in Band 2 and Band 3N by using the following formula:
NDVI = ( Band 3N Band 2 / ( Band 3N + Band 2 )
where Band 3N is near infrared and Band 2 is visible red reflectance [41].

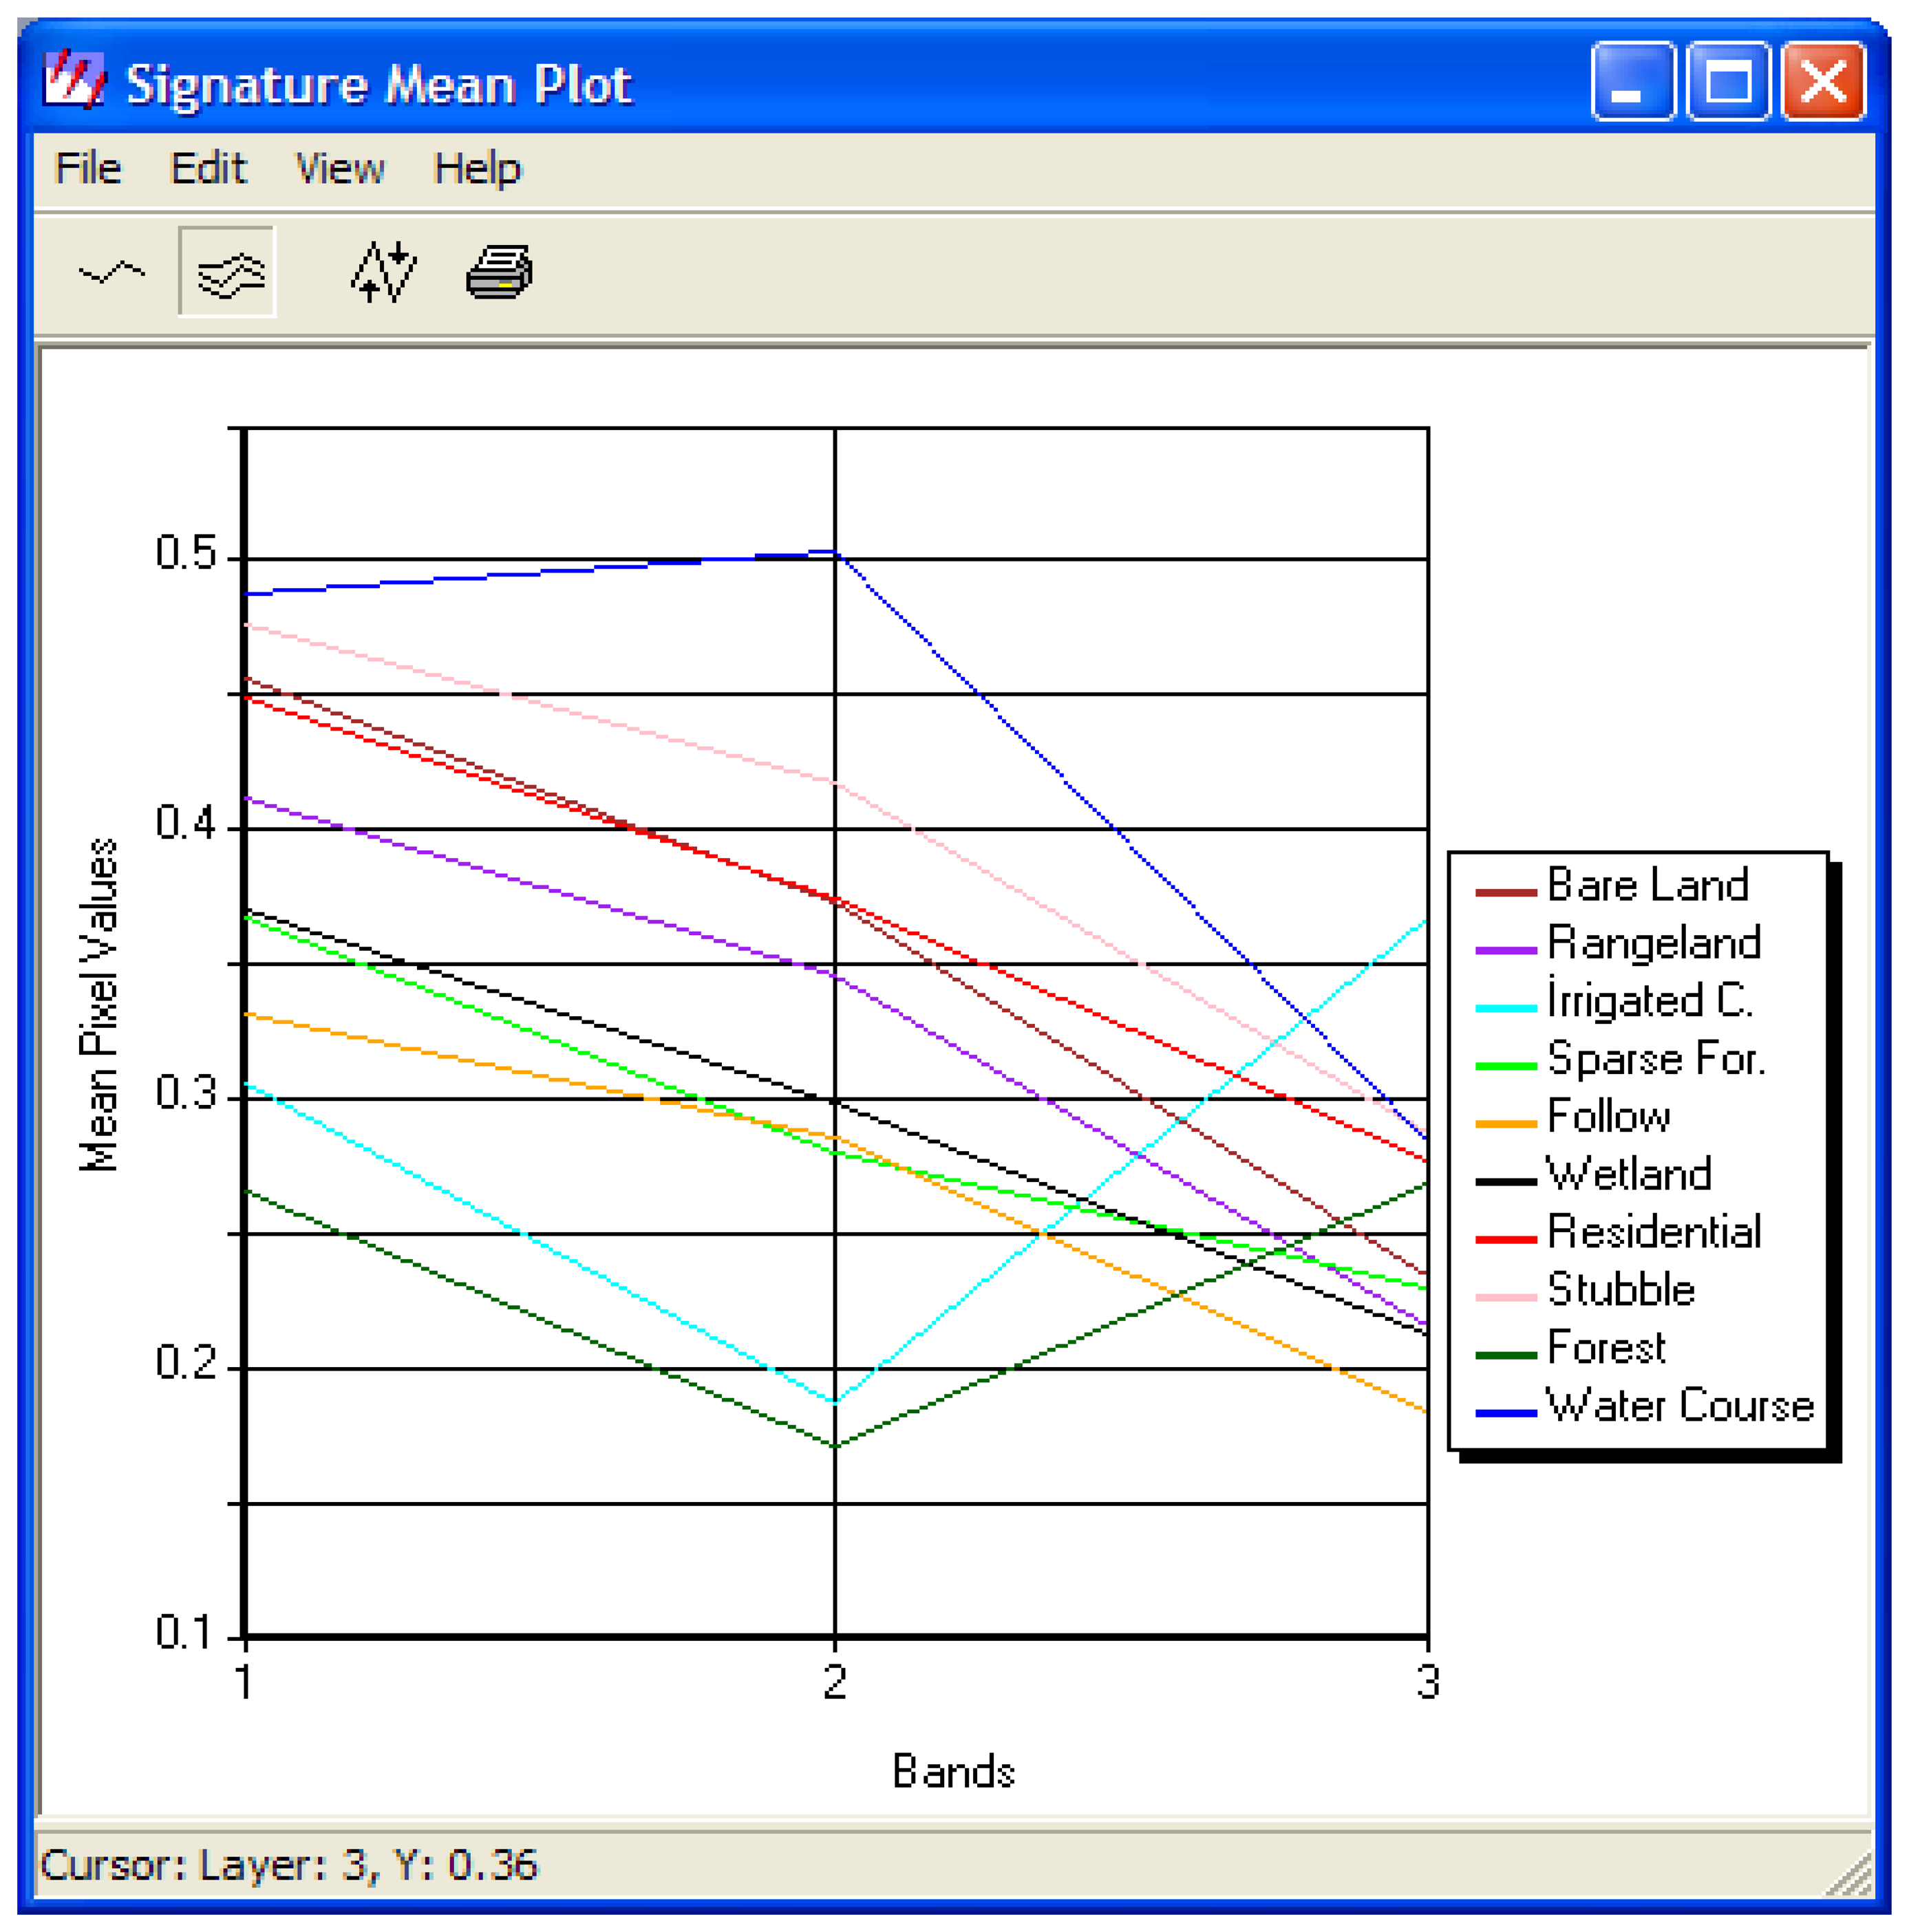
2.2.3. Land use/cover classification

In subset image of the research forest, there was a high frequency of data variability due to heterogonous characteristics of the landscape features. The low-pass filtering technique has been widely used to reduce spatial frequency [42]. Using “Convolution” function in ERDAS 8.5 [43], the performances of three different low-pass filtering standards (3×3, 5×5, and 7×7) were compared [44].
In classification process, Supervised Classification method in ERDAS 8.5 was performed based on a set of user-defined classes, by creating the appropriate spectral signatures from TOA reflectance data. In supervised classification process, “User-Defined Polygon” function reduces the chance of underestimating class variance since it involved a high degree of user control [32]. Over 80 training points were repeatedly selected from the whole study area by drawing a polygon around training sites of interests. Land use/cover classes of these training points were extracted with respect to general knowledge obtained from topographic maps and field visits. In selection process, “Signature Alarm” and “Signature Mean Plot” tools were used to accurately representing the land use/cover classes to be identified. Then, supervised classification was performed using the parallelepiped non-parametric rule provided by ERDAS 8.5. After the classification process, “Recode” function in ERDAS 8.5 was applied to combine the classes into 10 main classes including irrigated crops (1), fallow (2), stubble (3), rangeland (4), sparse forest (5), forest (6), bare land (7), residential (8), wetland (9), and river channel (10).
To evaluate the accuracy of the classified image, “Accuracy Assessment” tool in ERDAS 8.5 was used based on random sampling method in which 256 points were automatically selected from referenced topographic map. The referenced values were recorded on the “Accuracy Assessment Table” based on previously generated topographic map and Color IR air photos of the region, and field reconnaissance taken place in October 2005. In error matrix utility, the reference class values were compared with the classified class values in a c × c matrix, where c is the number of classes (including class 0). Then, overall accuracy and kappa values were computed by using user's accuracy (a measure of commission error) and producer's accuracy (a measure of omission error) of each class.

2.2.4. Expert Classification

After supervised classification process, classified image was post-processed by using “Expert Classification System” [43] according to the CORINE land cover nomenclature [34] (Table 2). Expert classification integrates the available knowledge about the area of interest into the classification data space to improve accuracy [41]. In expert classification, first, a referenced raster map was produced by digitizing irrigated and non-irrigated areas, water course, and residential areas from the referenced topographic map. Table 3 indicates class values in classified, referenced, and CORINE land use/cover maps used in expert classification process. In “Spatial Modeler” tool of ERDAS 8.5 [43], CORINE land use/cover maps were generated by using the conditional statement indicated under Table 3. In these statements, first, the discontinuous urban fabric was delineated when they were classified as fallow and stubble areas in classified land covers, while they were classified as residential in referenced map. Water courses were also delineated when they were classified as fallow and stubble areas in classified land covers, while they were classified as water courses in referenced map. When fallow and stubble were classified as irrigated in reference map, they were assigned as permanently irrigated land, while they were non-irrigated arable land when they were classified as non-irrigated in reference map.

3. Results and Discussion

3.1. Converting ASTER Radiance Values to Reflectance

After converting ASTER radiance values to reflectance, their NDVIs were calculated for both radiance values and TOA reflectance to evaluate the effects of converting processes. In previous studies, NDVI was commonly used to evaluate the effects of atmospheric correction process [24, 45, 46,47]. The results shown in Table 4 indicated that the NDVI of the TOA reflectance is greater than that of ASTER radiance values. Thus, quality of the image was improved after eliminating the negative effects of molecular scattering, gaseous observation, and aerosols. Vermote et al. [24] also reported that the NDVI values, on average, increased from -0.26 to 0.10 after atmospheric corrections.

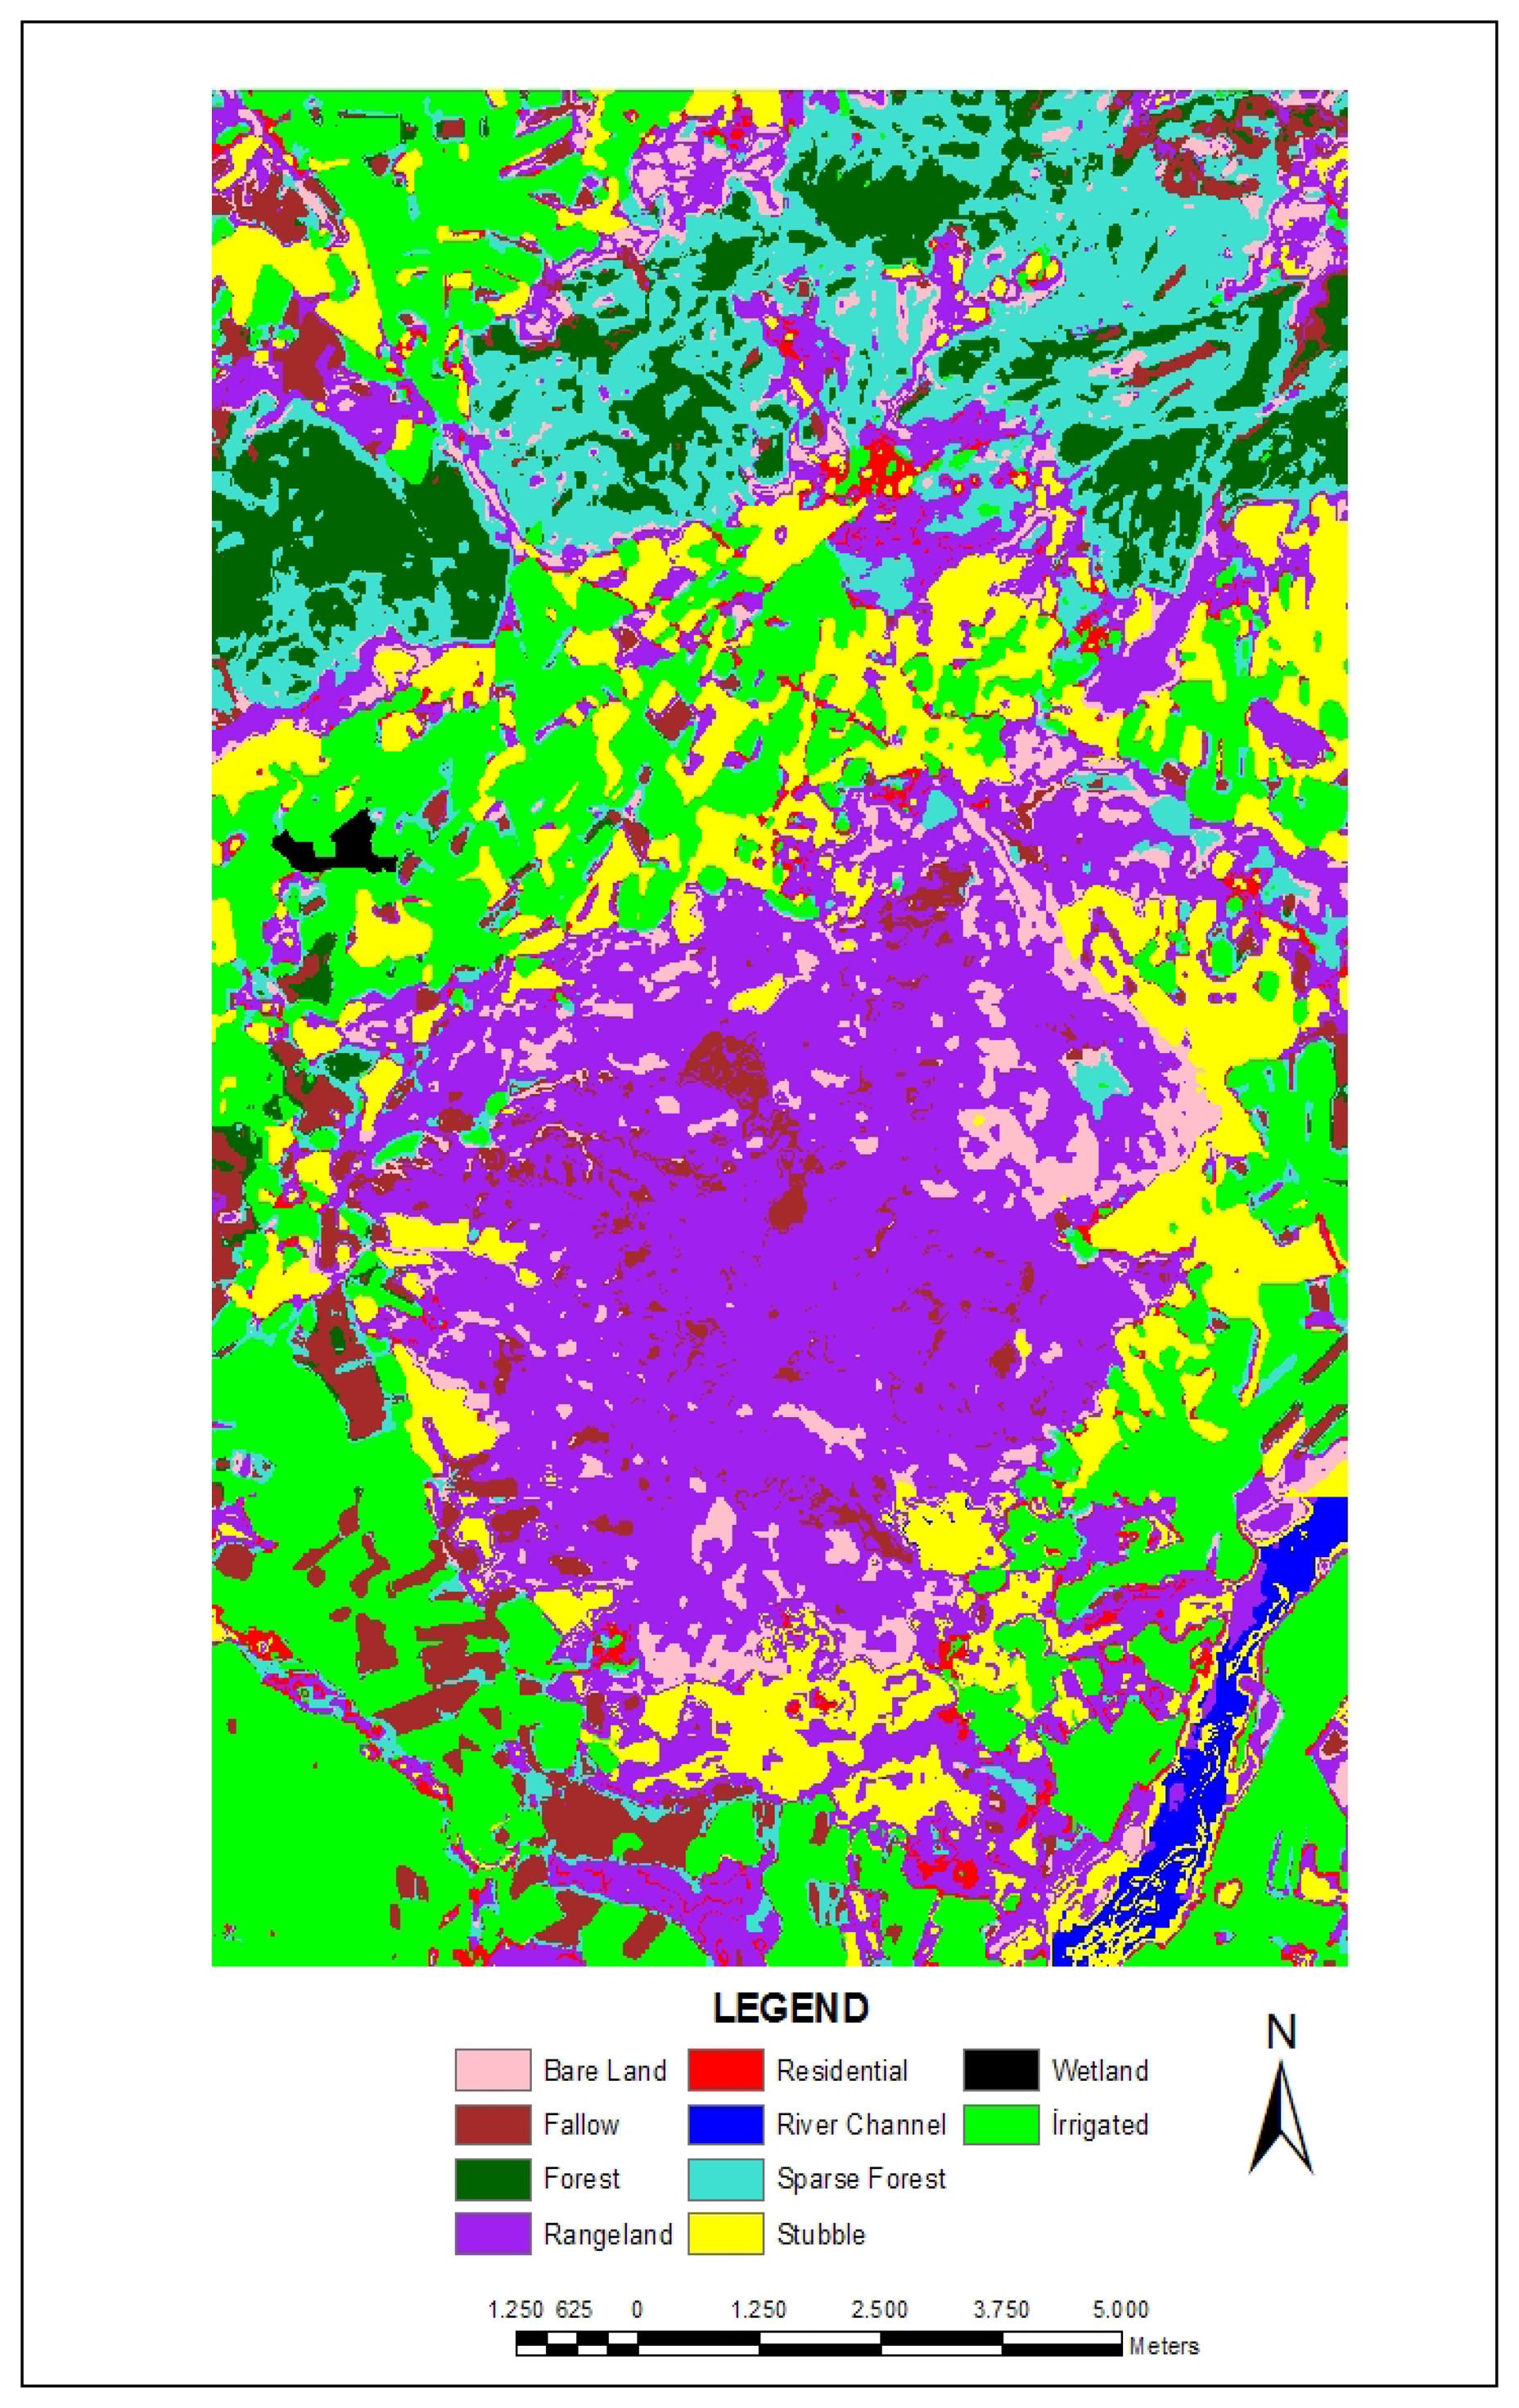
3.2. Land use/cover classification

The results indicated that applying 7×7 low-pass filter removed the data variation prior to classifications process. Akay et al. [48] also reported that using 7×7 low-pass filter provided better results in a study where tree and shrub species were classified. Then, supervised classification was applied to classify the land use/cover types into 10 main classes (Figure 3). The accuracy of the classified image was then assessed by using randomly selected 256 points based on referenced topographic map. The results indicated that classification process provided overall accuracy and kappa values of 83.2% and 0.79, respectively (Table 5).
Supervised classification provided satisfactory results in terms of distinguishing irrigated crops, forest, stubble, water courses, and rangeland; however, accuracy for fallow, sparse forest, bare land, and residential were relatively low due to large variation of spectral signatures. The highest producers and users accuracy was reached in classification of irrigated crops (96.61%) and stubble (94.87%), respectively. The lowest producers and users accuracy was for fallow (57.69%) and bare land (35.29%), respectively. It was assumed that low accuracy of the follow is due to close reflection values received from follows, sparse forest, and wetland (Figure 4). The results also indicated that supervised classification overestimated rangeland and bare land, while underestimated irrigated, forest, residential, and water courses. The roads in the study area could not be distinguished during the classification process due to close reflectance values with adjacent raster cells.

3.3. Expert Classification

In the Mediterranean region of Turkey, cereals grow in both irrigated and non-irrigated (rainfed) conditions in winter seasons. It is not easy to determine whether they grow in irrigated or rainfed conditions. Besides, some of the irrigated and non-irrigated lands were not cultivated, which leads to problems in distinguishing permanently irrigated lands from non-irrigated arable land. Thus, expert classification system was applied to improve the accuracy of the classified image and arrange the classes according to the CORINE nomenclature [49]. The results from the expert classification were shown in Table 6, indicating the total area and percentages of land use/cover classes based on CORINE Nomenclature. Figure 5 indicates the land use/cover map of the study area according to CORINE Land Cover Project.

4. Conclusions

ASTER sensor imagery, converted into TOA reflectance, was used to generate land use/cover maps according to the CORINE Land Cover Project. Supervised classification process using the TOA reflectance data provided accurate and low-cost land use/cover maps for heterogeneous Mediterranean landscapes. Knowledge-based expert classification system was further applied to improve the accuracy of the classified image and arranged the classes according to the CORINE nomenclature. The method used in this study is expected to contribute to the generation of land use/covers maps for the Mediterranean regions of Europe as a part of CORINE land cover dataset.

Acknowledgments

The authors are grateful to Michael J. Falkowski, Paul E. Gessler, and Alistair M.S. Smith in University of Idaho, Geospatial Laboratory for Environmental Dynamics (GLED) for their assistance in analysis of top-of-atmospheric correction. This work was financially supported by the Scientific and Technological Research of Turkey (TUBITAK) as part of research grant no. TOVAG 106O126.

References

  1. Alrababah, M.A.; Alhamad, M.N. Land use/cover classification of arid and semi-arid Mediterranean landscapes using Landsat ETM. International Journal of Remote Sensing 2006, 27, 2703–2718. [Google Scholar]
  2. Vogelmann, J.E.; Helderb, D.; Morfitta, R.; Choatea, M. J.; Merchantc, J.W.; Bulley, H. Effects of Landsat 5 Thematic Mapper and Landsat 7 Enhanced Thematic Mapper Plus radiometric and geometric calibrations and corrections on landscape characterization. Remote Sensing of Environment 2001, 78, 55–70. [Google Scholar]
  3. Berberoglu, S.; Lloyd, C.D.; Atkinson, P.M.; Curran, P.J. The integration of spectral and textural information using neural networks for land cover mapping in the Mediterranean. Computers and Geosciences 2000, 26, 385–396. [Google Scholar]
  4. Calvao, T.; Palmeirim, J.M. Mapping Mediterranean scrub with satellite imagery: Biomass estimation and spectral behaviour. International Journal of Remote Sensing 2004, 25, 3113–3126. [Google Scholar]
  5. Koutsias, N.; Karteris, M. Classification analyses of vegetation for delineating forest fire fuel complexes in a Mediterranean test site using satellite remote sensing and GIS. International Journal of Remote Sensing 2003, 24, 3093–3104. [Google Scholar]
  6. Lobo, A.; Legendre, P.; Rebollar, J.L.G.; Carreras, J.; Ninot, J.M. Land cover classification at a regional scale in Iberia: Separability in a multi-temporal and multi-spectral data set of satellite images. International Journal of Remote Sensing 2004, 25(1), 205–213. [Google Scholar]
  7. Hirataa, M.; Kogab, N.; Shinjoc, H.; Fujitad, H.; Gintzburger, G.; Miyazaki, A. Vegetation classification by satellite image processing in a dry area of northeastern Syria. International Journal of Remote Sensing 2001, 22, 507–516. [Google Scholar]
  8. Vieira, I.G.C.; De Almeida, A.S.; Davidson, E.A.; Stone, T.A.; De Ccarvalho, C.J.R.; Guerrero, J.B. Classifying successional forests using Landsat spectral properties and ecological characteristics in eastern Amazonia. Remote Sensing of Environment 2003, 87, 470–481. [Google Scholar]
  9. Zheng, D.; Rademacher, J.; Chen, J.; Crow, T.; Bresee, M.; Moine, J.L.; Ryu, S.-R. Estimating aboveground biomass using Landsat 7 ETM+ data across a managed landscape in northern Wisconsin, USA. Remote Sensing of Environment 2004, 93, 402–411. [Google Scholar]
  10. Anderson, A.B.; Wang, G.; Gertner, G. Local variability based sampling for mapping a soil erosion cover factor by co-simulation with Landsat TM images. International Journal of Remote Sensing 2006, 27, 2423–2447. [Google Scholar]
  11. Shi, P.J.; Yuan, Y.; Zheng, J.; Wang, J.A.; Ge, Y.; Qiu, G.Y. The effect of land use/cover change on surface runoff in Shenzhen region, China. Catena 2007, 69, 31–35. [Google Scholar]
  12. De Jong, B.H.J. Land-Use Change and Carbon Flux Between 1970s and 1990s in Central Highlands of Chiapas, Mexico. Environmental Management 1999, 23, 373–385. [Google Scholar]
  13. Evrendilek, F. Integrating Map Algebra and Statistical Modeling for Spatio-Temporal Analysis of Monthly Mean Daily Incident Photosynthetically Active Radiation (PAR) over a Complex Terrain. Sensors 2007, 7, 3242–3257. [Google Scholar]
  14. Evrendilek, F.; Berberoglu, S.; Gulbeyaz, O.; Ertekin, C. Modeling Potential Distribution and Carbon Dynamics of Natural Terrestrial Ecosystems: A Case Study of Turkey. Sensors 2007, 7, 2273–2296. [Google Scholar]
  15. Cohen, W.B.; Goward, S.N. Landsat's role in ecological applications of remote sensing. Bioscience 2004, 54, 535–545. [Google Scholar]
  16. Musaoglu, N.; Coskun, M.; Kocabas, V. Land use change analysis of Beykoz- Istanbul by means of satellite images and GIS. Water Science and Technology 2005, 51, 245–251. [Google Scholar]
  17. Benedetti, R.; Rossini, P.; Taddei, R. Vegetation classification in the middle Mediterranean area by satellite data. International Journal of Remote Sensing 1994, 15, 583–596. [Google Scholar]
  18. Abrams, M. The Advanced Spaceborne Thermal Emission and Reflection Radiometer (ASTER): data products for the high spatial resolution imager on NASA's Terra platform. International Journal of Remote Sensing 2003, 21(5), 847–859. [Google Scholar]
  19. Rowan, L.C.; Mars, J.C. Lithologic mapping in the Mountain Pass, California area using advanced spaceborne thermal emission and reflection radiometer (ASTER) data. Remote Sensing of Environment 2003, 84, 350–366. [Google Scholar]
  20. Zhu, G.; Blumberg, D.G. Classification using ASTER data and SVM algorithms; the case study of Beer Sheva, Israel. Remote Sensing of Environment 2001, 80, 233–240. [Google Scholar]
  21. Davis, F. W.; Simonett, D. S. GIS and remote sensing. In Geographical information systems: principles and applications; Maguire, D.J., Goodchild, M.F., Rhind, D.W., Eds.; Longman Scientific and Technical: London, GB, 1991; pp. 191–213. [Google Scholar]
  22. Jensen, J.R. Introductory Digital Image Processing: A Remote Sensing Perspective, 3rd Ed. ed; Prentice-Hall: Upper Saddle River, NJ, 2005. [Google Scholar]
  23. Vermote, E. F.; El Saleous, N.Z.; Justice, C.O. Atmospheric correction of MODIS data in the visible to middle infrared: first results. Remote Sensing of Environment 2002, 83, 97–111. [Google Scholar]
  24. Song, C.; Woodcock, C.E.; Seto, K.C.; Lenney, M.P.; Macomber, S.A. Classification and Change Detection Using Landsat TM Data: When and How to Correct Atmospheric Effects? Remote Sensing of Environment 2001, 75, 230–244. [Google Scholar]
  25. Kaufman, Y.J. The atmospheric effect on the separability of field classes measured from satellites. Remote Sensing of Environment 1985, 18, 21–34. [Google Scholar]
  26. Richter, R. A spatially adaptive fast atmospheric correction algorithm. International Journal of Remote Sensing 1996, 17, 1201–1214. [Google Scholar]
  27. Teillet, P.M. An algorithm for the radiometric and atmospheric correction of AVHRR data in the solar reflective. Remote Sensing Environment 1991, 41, 185–195. [Google Scholar]
  28. Falkowski, M.J.; Gessler, P.E.; Morgan, P.; Hudak, A.; Smith, T. Characterizing and mapping forest fire fuels using ASTER imagery and gradient modeling. Forest Ecology and Management 2005, 217, 129–146. [Google Scholar]
  29. Berberoglu, S.; Evrendilek, F.; Ozkan, C.; Donmez, C. Modeling Forest Productivity Using Envisat MERIS Data. Sensors 2007, 7, 2115–2127. [Google Scholar]
  30. Xiaoling, C.; Xiaobin, C.; Hui, L. Expert classification method based on patch-based neighborhood searching algorithm. Geo-Spatial Information Science 2006, 10(1), 37–43. [Google Scholar]
  31. Moller-Jensen, L. Classification of Urban land cover based on expert systems, object models and texture. Computers, Environment and Urban Systems 1997, 21, 291–302. [Google Scholar]
  32. EEA, CORINE Land Cover. European Environment Agency. Acquired from http://reports.eea.europa.eu/CORO-landcover/en Accessed in January 2008.
  33. ERDAS/Leica Geosystem. ERDAS Imagine 8.5. Tour Guide; 2001; Atlanta; ERDAS Inc. Geosystem. [Google Scholar]
  34. Smith, A.M.S. How to Convert ASTER Radiance Values to Reflectance. College of Natural Resources, University Idaho. An Online Guide. Acquired from www.cnrhome.uidaho.edu/default.aspx?pid=85984.
  35. Abrams, M.; Hook, S. ASTER User Handbook; 1998; Version 1; NASA/Jet Propulsion Laboratory: Pasadena. [Google Scholar]
  36. Thome, K.; Biggar, S.; Slater, P. Effects of assumed solar spectral irradiance on intercomparisons of earth-observing sensors. In Sensors, Systems, and Next-Generation Satellites; Proceedings of SPIE; December 2001; Fujisada, H., Lurie, J., Weber, K., Eds.; Vol. 4540, pp. 260–269. [Google Scholar]
  37. Archard, F.; D'Souze, G. Collection and pre-processing of NOAA-AVHRR 1km resolution data for tropical forest resource assessment. In Report EUR 16055 for European Commission; Luxembourg, 1994. [Google Scholar]
  38. Eva, H.; Lambin, E.F. Burnt area mapping in Central Africa using ATSR data. International Journal of Remote Sensing 1998, 19, 3473–3497. [Google Scholar]
  39. Jensen, J. R. Remote sensing of the environment: An earth resource perspective; Prentice-Hall: Upper Saddle River, NJ, 2000. [Google Scholar]
  40. Lillesand, T.M.; Kiefer, R.W. Remote Sensing and Image Interpretation; John Wiley & Sons: New York, NY, 1994; p. 750. [Google Scholar]
  41. ESRI. ERDAS Imagine 8.5. Field Guide; ESRI Inc.: Atlanta, 2001. [Google Scholar]
  42. Akay, A.E.; Tutus, A. Using Image Analysis in Estimating Blue Stain Defects on Fire-Killed Brutian Pine (Pinus brutia). Wood Research Journal 2006, 51(1), 41–48. [Google Scholar]
  43. Stefanov, W.L.; Netzband, M. Assessment of ASTER land cover and MODIS NDVI data at multiple scales for ecological characterization of an arid urban center. Remote Sensing of Environment 2005, 99, 31–43. [Google Scholar]
  44. Chen, X.; Vierling, L.; Deering, D. A simple and effective radiometric correction method to improve landscape change detection across sensors and across time. Remote Sensing of Environment 2005, 98, 63–79. [Google Scholar]
  45. Richter, R.; Schlapfer, D.; Muller, A. An automatic atmospheric correction algorithm for visible/NIR imagery. International Journal of Remote Sensing 2006, 26, 2077–2085. [Google Scholar]
  46. Akay, A.E.; Karas, I.R.; Gundogan, R. Classification of Tree and Shrub Species in KSU Research and Application Forest In Kahramanmaras, Turkey. In Proc. 10th Intl. Symposium on Physical Measurements and Spectral Signatures in Remote Sensing; Schaepman, M., Liang, S., Groot, N., Kneubühler, M., Eds.; Intl. Archives of the Photogrammetry, Remote Sensing and Spatial Information Sciences; Vol. XXXVI, WG VII/I, ISPRS; Davos (CH), ISSN; 2007. [Google Scholar]
  47. Tapiador, F. J.; Casanova, J.L. Land use mapping methodology using remote sensing for the regional planning directives in Segovia, Spain. Landscape and Urban Planning 2003, 62, 103–115. [Google Scholar]
Figure 1. The location of the study area on the topographic map of Turkey and on the ASTER image.
Sensors 08 01237f1
Figure 2. The flowchart indicating image processing stages.
Sensors 08 01237f2
Figure 3. Land use/cover classes after supervised classification of the study area.
Sensors 08 01237f3
Figure 4. Mean pixel value of the ten classes generated by supervised classification.
Sensors 08 01237f4
Figure 5. The land use/cover map of the study area according to CORINE Land Cover Project.
Sensors 08 01237f5
Table 1. The values of unit conversion coefficient for the operating bands of ASTER (VNIR).
BandCoefficient (W/m2*sr*um)/DN)*ESUNi

High GainNormalLow Gain 1
10.6761.6882.251847
20.7081.4151.891553
3N0.4230.8621.151118
3B0.4230.8621.15
*ESUNi = Calculated by convolving the ASTER spectral response functions [38].
Table 2. The classes used in classification process based on the CORINE land cover nomenclature.
Level 1Level 2Level 3
1. Artificial surfaces1.1. Urban Fabric1.1.2. Discontinuous urban fabric
1.2. Industrial, commercial, and transport units1.2.2. Road and rail networks and associated land
2. Agricultural areas2.1. Arable land2.1.1.Non-irrigated arable land
2.1.2.Permanently irrigated land
3. Forests and semi-natural areas3.1. Forests3.1.2. Coniferous forest
3.2. Shrub and/or herbaceous vegetation association3.2.1. Natural grassland
3.2.4. Transitional woodland/shrub
3.3. Open spaces with little or no vegetation3.3.2. Bare rock
4. Wetlands4.1. inland wetlands4.1. 1. Inland marshes
5. Water bodies5.1. Inland waters5.1.1. Water courses
Table 3. The class values in classified, referenced, and CORINE land use/cover maps used in expert classification process.
Classified Land CoversReference Land CoversCORINE Land Covers

Class ValuesClass NamesClass ValuesClass NamesClass ValuesCORINE Nomenclature
1Irrigated Crops1Resident1Permanently irrigated land
2Fallow2Irrigated2Natural grassland
3Stubble3Water Course3Transitional woodland/shrub
4Rangeland4Non-irrigated4Coniferous forest
5Sparse forest5Bare rock
6Forest6Discontinuous urban fabric
7Bare land7Inland marshes
8Residential8Water Courses
9Wetland9Non-irrigated arable land
10Water Courses10Road and rail networks and associated land

Statement Used in ERDAS Spatial Modeler:
CONDITIONAL {(Reference = = 1) 6, (Reference = = 3) 8, (Classified = = 1) 1, (Classified = = 4) 2, (Classified = = 5) 3, (Classified = = 6) 4, (Classified = = 7) 5, (Classified = = 8) 6, (Classified = = 9) 7, (Classified = = 10) 8, (Classified = = 2 AND Reference = = 1) 6, (Classified = = 2 AND Reference = = 2) 1, (Classified = = 2 AND Reference = = 3) 8, (Classified = = 2 AND Reference = = 4) 9, (Classified = = 3 AND Reference = = 1) 6, (Classified = = 3 AND Reference = = 2) 1, (Classified = = 3 AND Reference = = 3) 8, (Classified = = 3 AND Reference = = 4) 9}
Table 4. Comparison of radiance and TOA reflectance values of NDVI
StatisticsRadianceReflectance
Min-0.500-0.365
Max0.4000.501
Mean-0.255-0.100
Median0.342-0.019
Mode-0.402-0.257
Std. Dev.0.1870.188
Table 5. The results from the accuracy assessment process.
Class NameClass NamesReference TotalClassified TotalsNumber CorrectProducers AccuracyUsers Accuracy
1Irrigated Crops59635796.61%90.48%
2Fallow26161557.69%93.75%
3Stubble41393790.24%94.87%
4Rangeland71706287.32%88.57%
5Sparse forest33302060.61%66.67%
6Forest12131191.67%84.62%
7Bare land717685.71%35.29%
8Residential67466.67%57.14%
9Wetland000----
10Water Courses111100.0%100.0%

Totals256256213
*Overall Classification Accuracy = 83.20%
*Overall Kappa Statistics = 0.79
Table 6. The total area and percentages of land use/cover classes based on CORINE nomenclature.
Class ValuesCORINE NomenclaturePercentageArea (ha)
1Permanently irrigated land0.337206.17
2Natural grassland0.286107.20
3Transitional woodland/shrub0.112504.16
4Coniferous forest0.061385.10
5Bare rock0.051199.20
6Discontinuous urban fabric0.04778.21
7Inland marshes0.0036.45
8Water Courses0.02473.85
9Non-irrigated arable land0.102121.39
10*Road and rail networks and associated land----
*Class 10 could not be distinguished from the adjacent classes during the classification process.

