Preliminary Results on Design and Implementation of a Solar Radiation Monitoring System


Technical University of Cluj-Napoca, 103-105 Muncii Bvd.; 400641 Cluj-Napoca, Romania
*
Author to whom correspondence should be addressed.
Sensors 2008, 8(2), 963-978; https://doi.org/10.3390/s8020963
Submission received: 29 December 2007
/
Accepted: 4 February 2008
/
Published: 19 February 2008
Abstract
:The paper presents a solar radiation monitoring system, using two scientific pyranometers and an on-line computer home-made data acquisition system. The first pyranometer measures the global solar radiation and the other one, which is shaded, measure the diffuse radiation. The values of total and diffuse solar radiation are continuously stored into a database on a server. Original software was created for data acquisition and interrogation of the created system. The server application acquires the data from pyranometers and stores it into a database with a baud rate of one record at 50 seconds. The client-server application queries the database and provides descriptive statistics. A web interface allow to any user to define the including criteria and to obtain the results. In terms of results, the system is able to provide direct, diffuse and total radiation intensities as time series. Our client-server application computes also derivate heats. The ability of the system to evaluate the local solar energy potential is highlighted.
1. Introduction
In the context of our day's relatively acute energy crisis, the scientific world is reconsidering the approach through all types of renewable energies. Between those, the solar energy is representing one with the highest potential, all over the world. For a very long period of time, the Sun can be considered a huge source of free energy, being also the unique energy source able to entertain the life on Earth. The life of the Sun is estimated at the following 4-5 billions of years, this being an enough reason to exploit the solar energy potential. [1]
The incoming solar radiant energy, per square meter, at the outside limit of the earth atmosphere, named solar constant, determined by satellite technologies measurements, is reported in range of 1350… 1366 W/m2. From the outside limit of the atmosphere, until the Earth surface, the intensity of the solar radiation is decreased by several known effects (reflection, dispersion, absorption, etc.) and at the ground, solar radiation presents very different values, depending on:
- -
- geographical position (latitude, longitude, altitude);
- -
- meteorological conditions;
- -
- presence or absence of pollution;
- -
- etc.
There are two types of solar radiation manifested at the ground level: direct and diffuse radiation, the addition between the two representing the total or global solar radiation. It is important to monitor both type of solar radiation, because in this way it can be obtained a better image about the structure of the solar radiation and about the possible technical applications. The monitoring process should be continuous and systematically, for a long period of time, in order to be able to furnish a complete and consistent set of data. Important considerations about the need of equally monitoring the global and diffuse radiation are also mentioned in [12-14].
The daily solar radiation is significantly changing during the year, due to the important changes in the position of the Sun on the sky. In order to predict the variable values of the solar radiation, theoretical models were developed and presented in papers such as [3]. One of the most popular of those models, known as the “ASHRAE Clear Day Solar Flux Model” [11], is represented by the following equations:
where:
- -
- IDir is representing the predicted average clear days direct solar radiation;
- -
- IDif is representing the predicted average clear days diffuse solar radiation;
- -
- β is representing the angle between the Earth surface and the direction giving the position of the Sun;
- -
- A,B and C, are empirically coefficients, determined by local measurements. Coefficient A is called apparent direct normal solar flux, at the outer atmosphere, coefficient B is called apparent atmospheric extinction coefficient and coefficient C is the diffuse radiation factor;
- -
- FS is representing the angle factor between the surface and the sky.
When there will be enough available recorded data, the authors intention is to determine the values of A, B and C coefficients, for Cluj-Napoca.
The “extinction”, or depletion, or reduction of the solar radiation in the atmosphere, is due to the following effects:
- -
- Absorption determined by components such as ozone in the upper atmosphere, or water vapors near the Earth surface;
- -
- Scattering determined by components such as dry air molecules, water or dust.
A series of papers [2,3] presented the estimation and effect of solar radiation [4]. Previously concerns of the authors in the field of the paper, lead to development of a series of systems [5-8] in the field of open system creation and implementation [9] for assessment and use [10] of alternative source of energies opens the path for the present study.
The presented solar radiation monitoring system was designed to measure and to allow the calculation of all the three types of solar radiation (total, diffuse and direct), the monitoring system being located at latitude of 46°47.758′ relative to north and longitude of 23°37.563′ relative to east and the place is in Cluj-Napoca, Romania. The analysis of the recorded data, and of the computed values of the total, diffuse and direct solar heat, is able to highlight a lot of major aspects concerning the local potential of the solar radiant energy, as renewable energy, able to be used by different types of both thermal collectors and photovoltaic systems. To reach this purpose, a long term solar radiation monitoring is needed, but even after five month of monitoring, the paper presents some preliminary results and discussions.
2. Methods
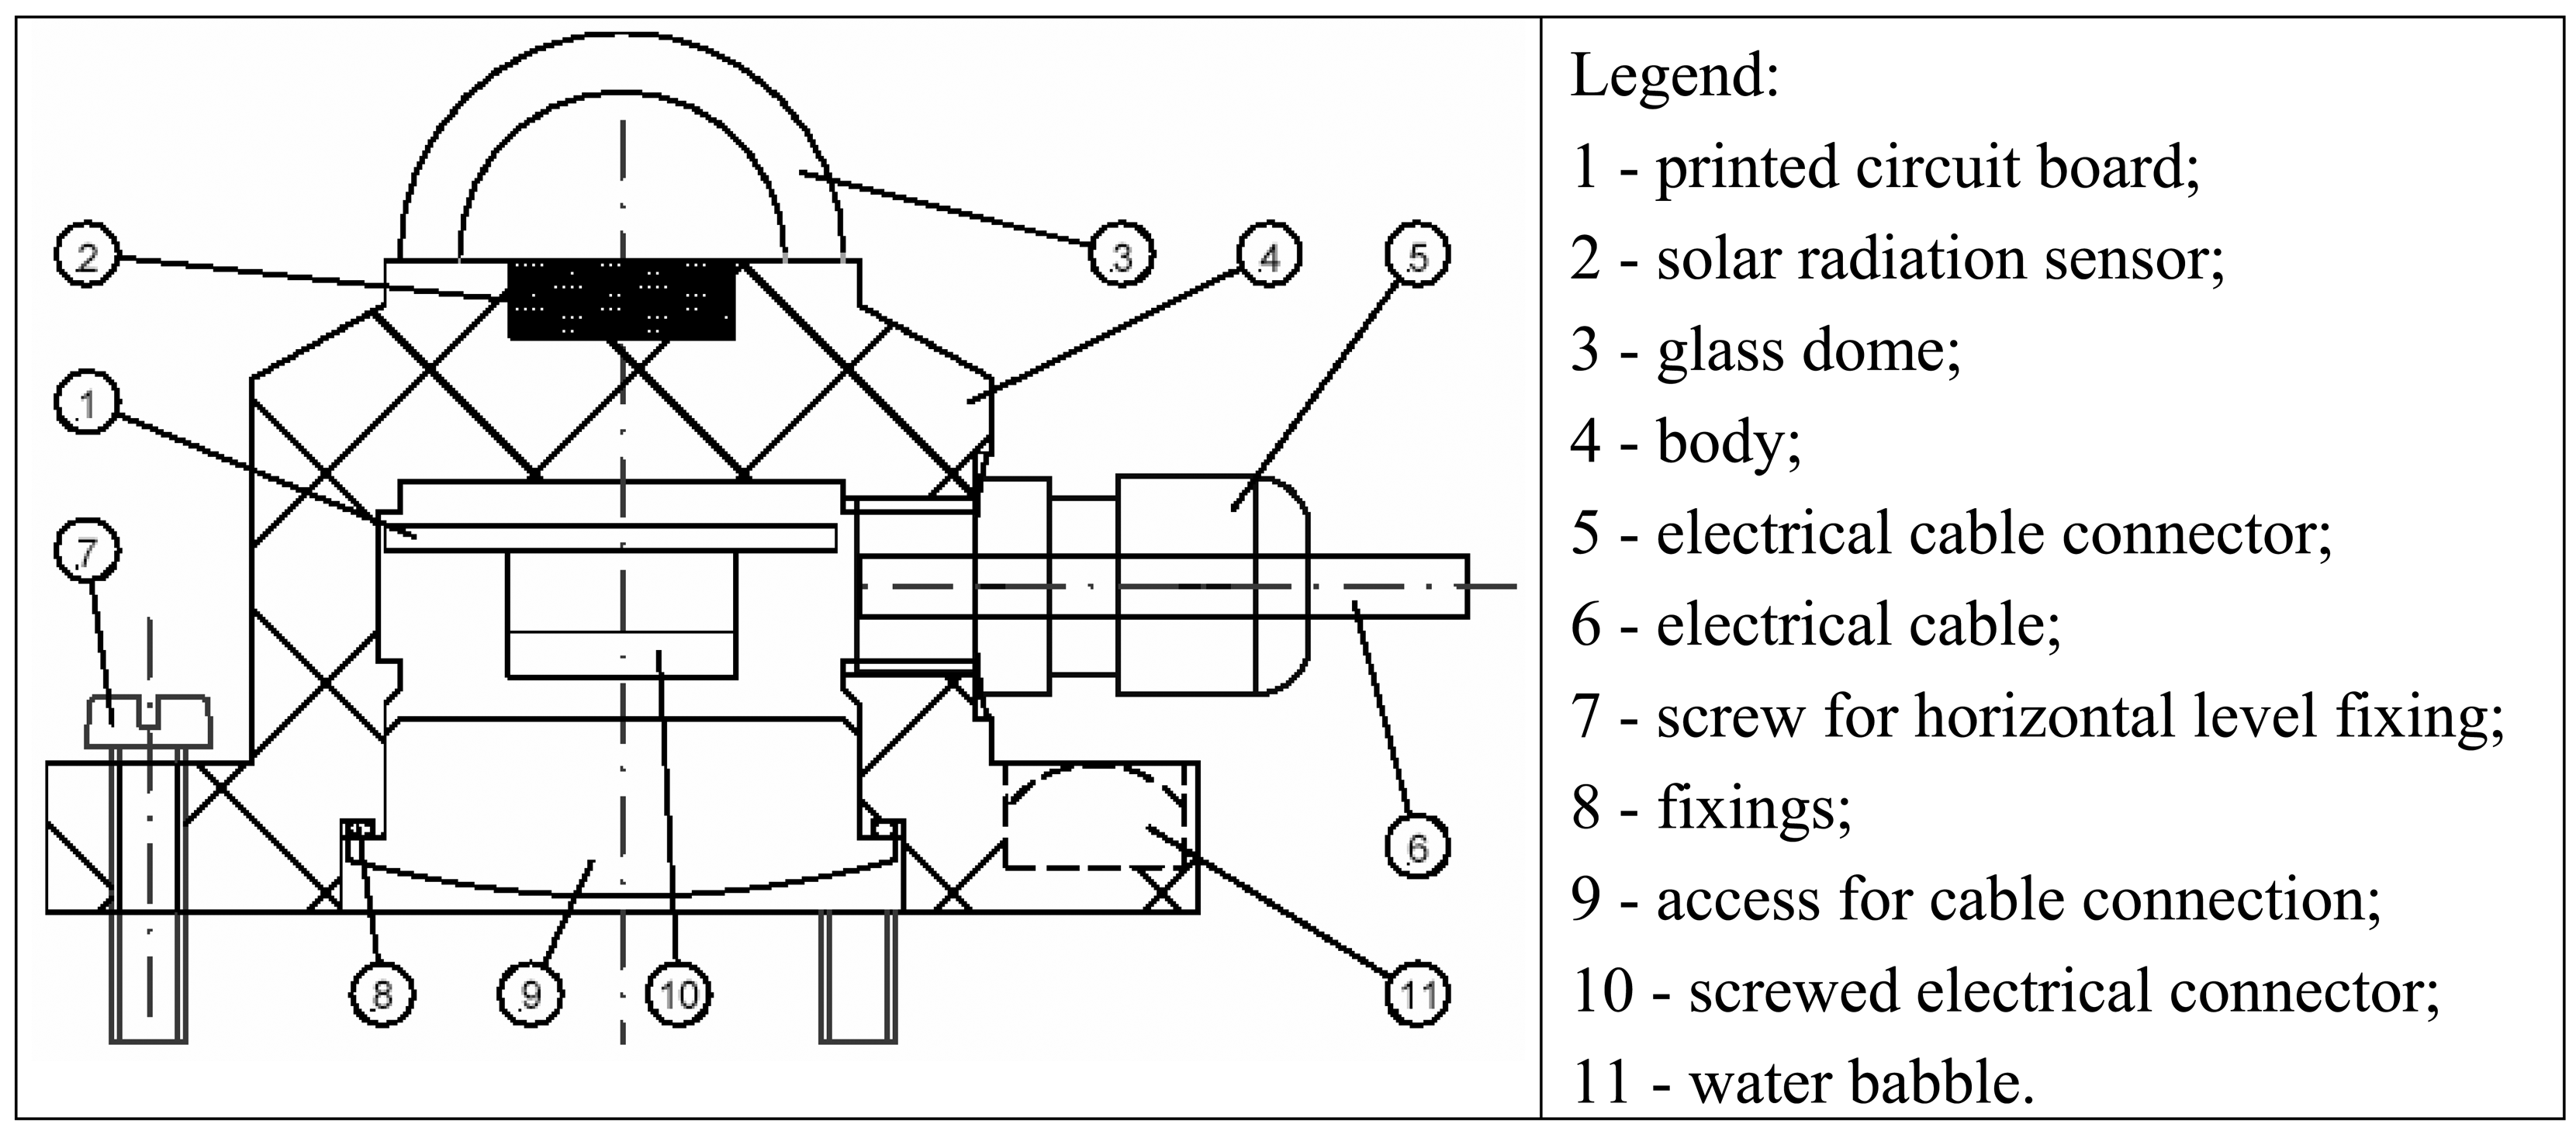
In order to measure the total and the diffuse radiation intensity, were used two CMP3 pyranometers from the company Kipp & Zonen. One was used to determine the total solar radiation intensity and one, being shaded, to determine the diffuse solar radiation intensity. Figure 1 presents the working principle of a pyranometer and some used pyranometers specifications are presented in table 1.
The two pyranometers are mounted in horizontal position, and the distance between the sensors and the data logging system is short, between 3.5m and 4m, for the measurement accuracy purposes.
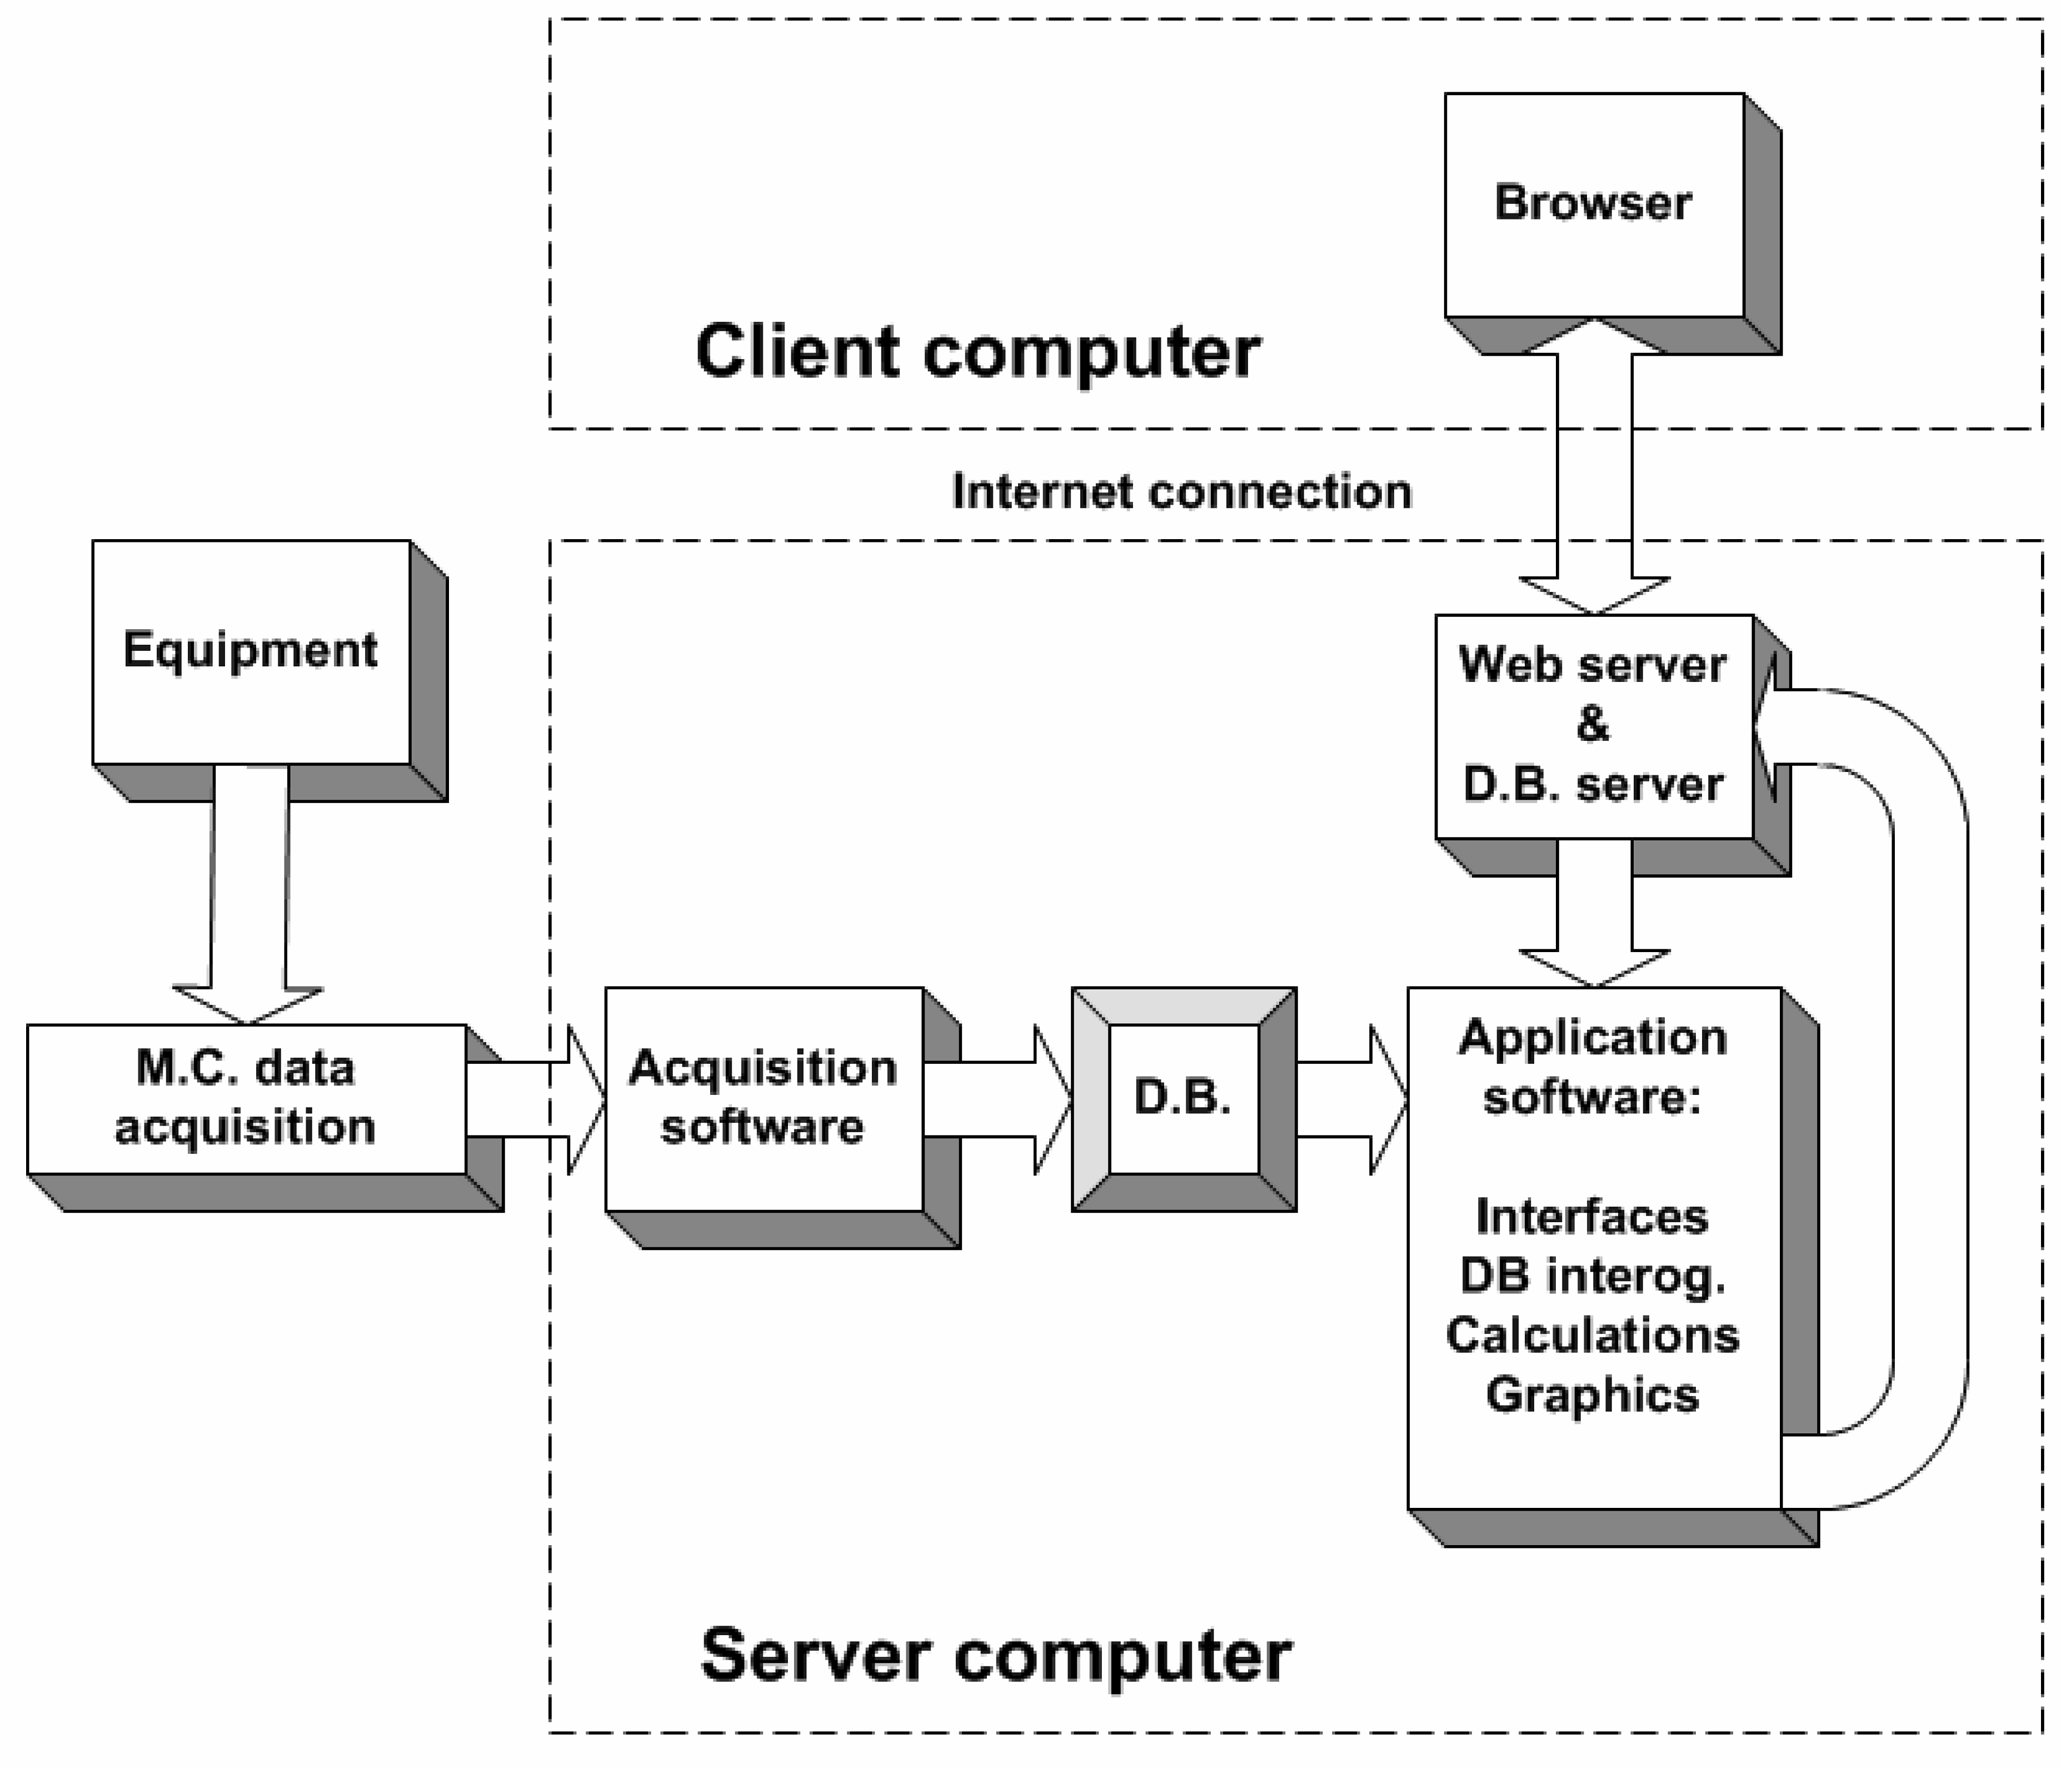
The scheme of the original data acquisition and solar radiation monitoring system, developed at the Technical University of Cluj-Napoca, is presented in figure 2.
The on scheme indicated equipment is represented by the two pyranometers, connected to the original data acquisition and monitoring system.
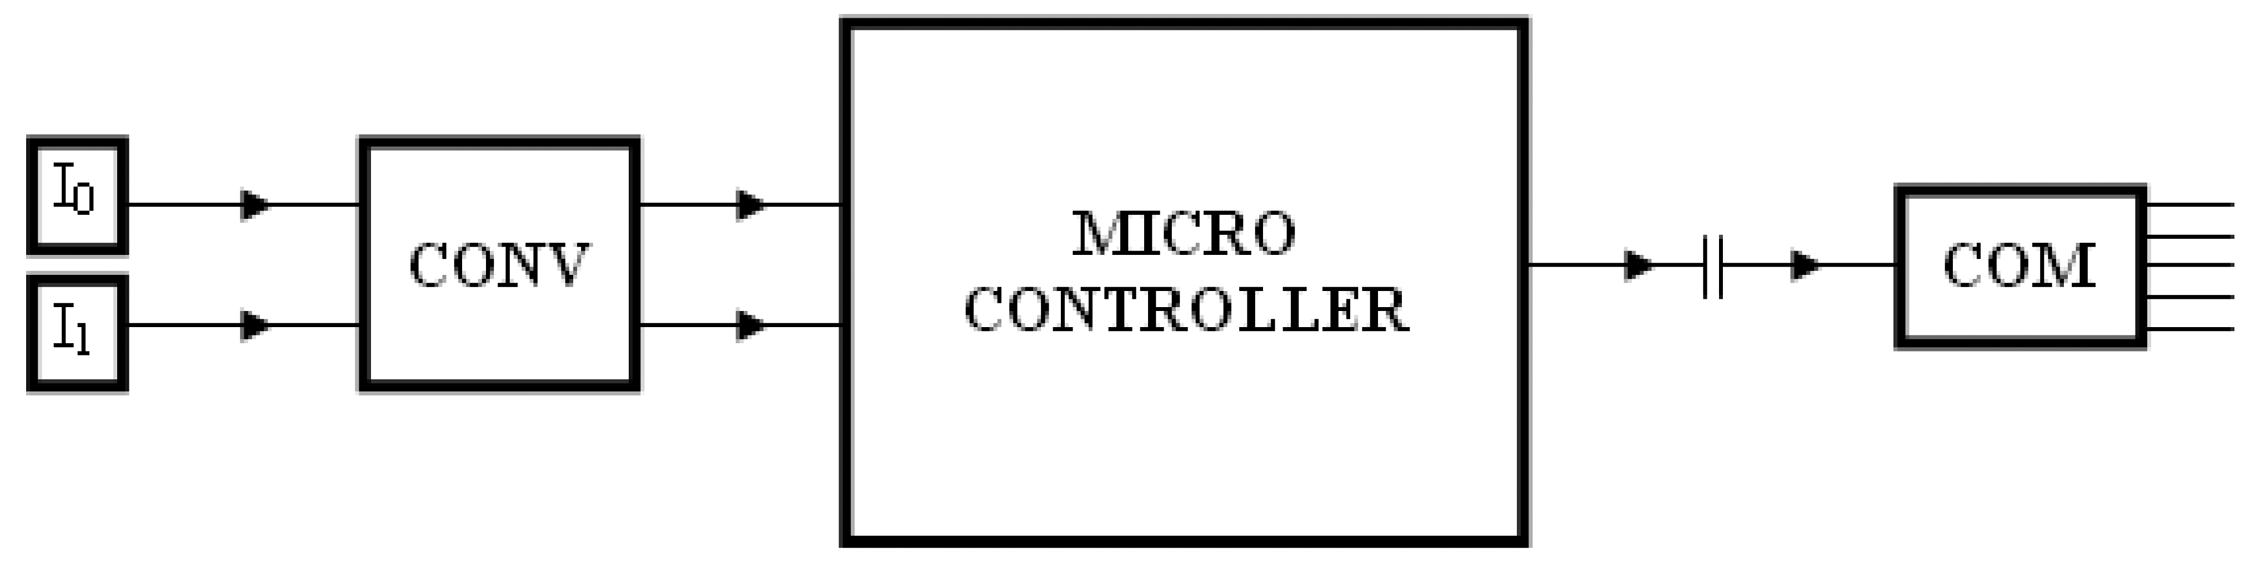
The values of total and diffuse solar radiation intensities are captured by a microcontroller MC, using the original electronic conversion module CONV and original software, as indicated in figure 3.
The two electrical pyranometers output tensions, proportional with the solar radiation intensities, are converted into the effective values of the total and diffuse solar radiation intensities, in the electronic conversion module and then are registered into the microcontroller memory. It is also realized, the transmission of the recorded values to an IBM compatible PC, using the COM serial interface. The total solar radiation intensity is noted with I0, and the diffuse solar radiation intensity is noted with I1.
The presence of the PC used as a server computer, as indicated in figure 2, is compulsory because it was highlighted the at distance monitoring.
The monitoring application, involve many software components:
- -
- Storing the values of the solar radiation intensities into a database;
- -
- Multiple criteria selection of the stored data;
- -
- Display of the data on a web based virtual monitoring panel;
- -
- Graphical representation of the selected database stored information.
The database indicated by D.B. on figure 2, designed to store the values of measured solar radiation intensities is of MySQL type and allow the interrogation via internet. The structure of the database table, used for data storing is presented in table 2.
It can be observed that each record receive a unique code named id and the stored information are: date and time of the measurement, into the field data, and the two values of total respective diffuse solar radiation intensity, into the pyr0 and pyr1 fields.
Two of the most important original software components of the data acquisition and monitoring application, are the “Acquisition software” and “Database interrogation”. The principle flow chart diagrams of the two software components are presented in figures 4a and 4b
The “Acquisition software” component is continuously operating, reading and storing into database the instant measured values of the total and diffuse solar radiation intensities, with a time step of 50 seconds.
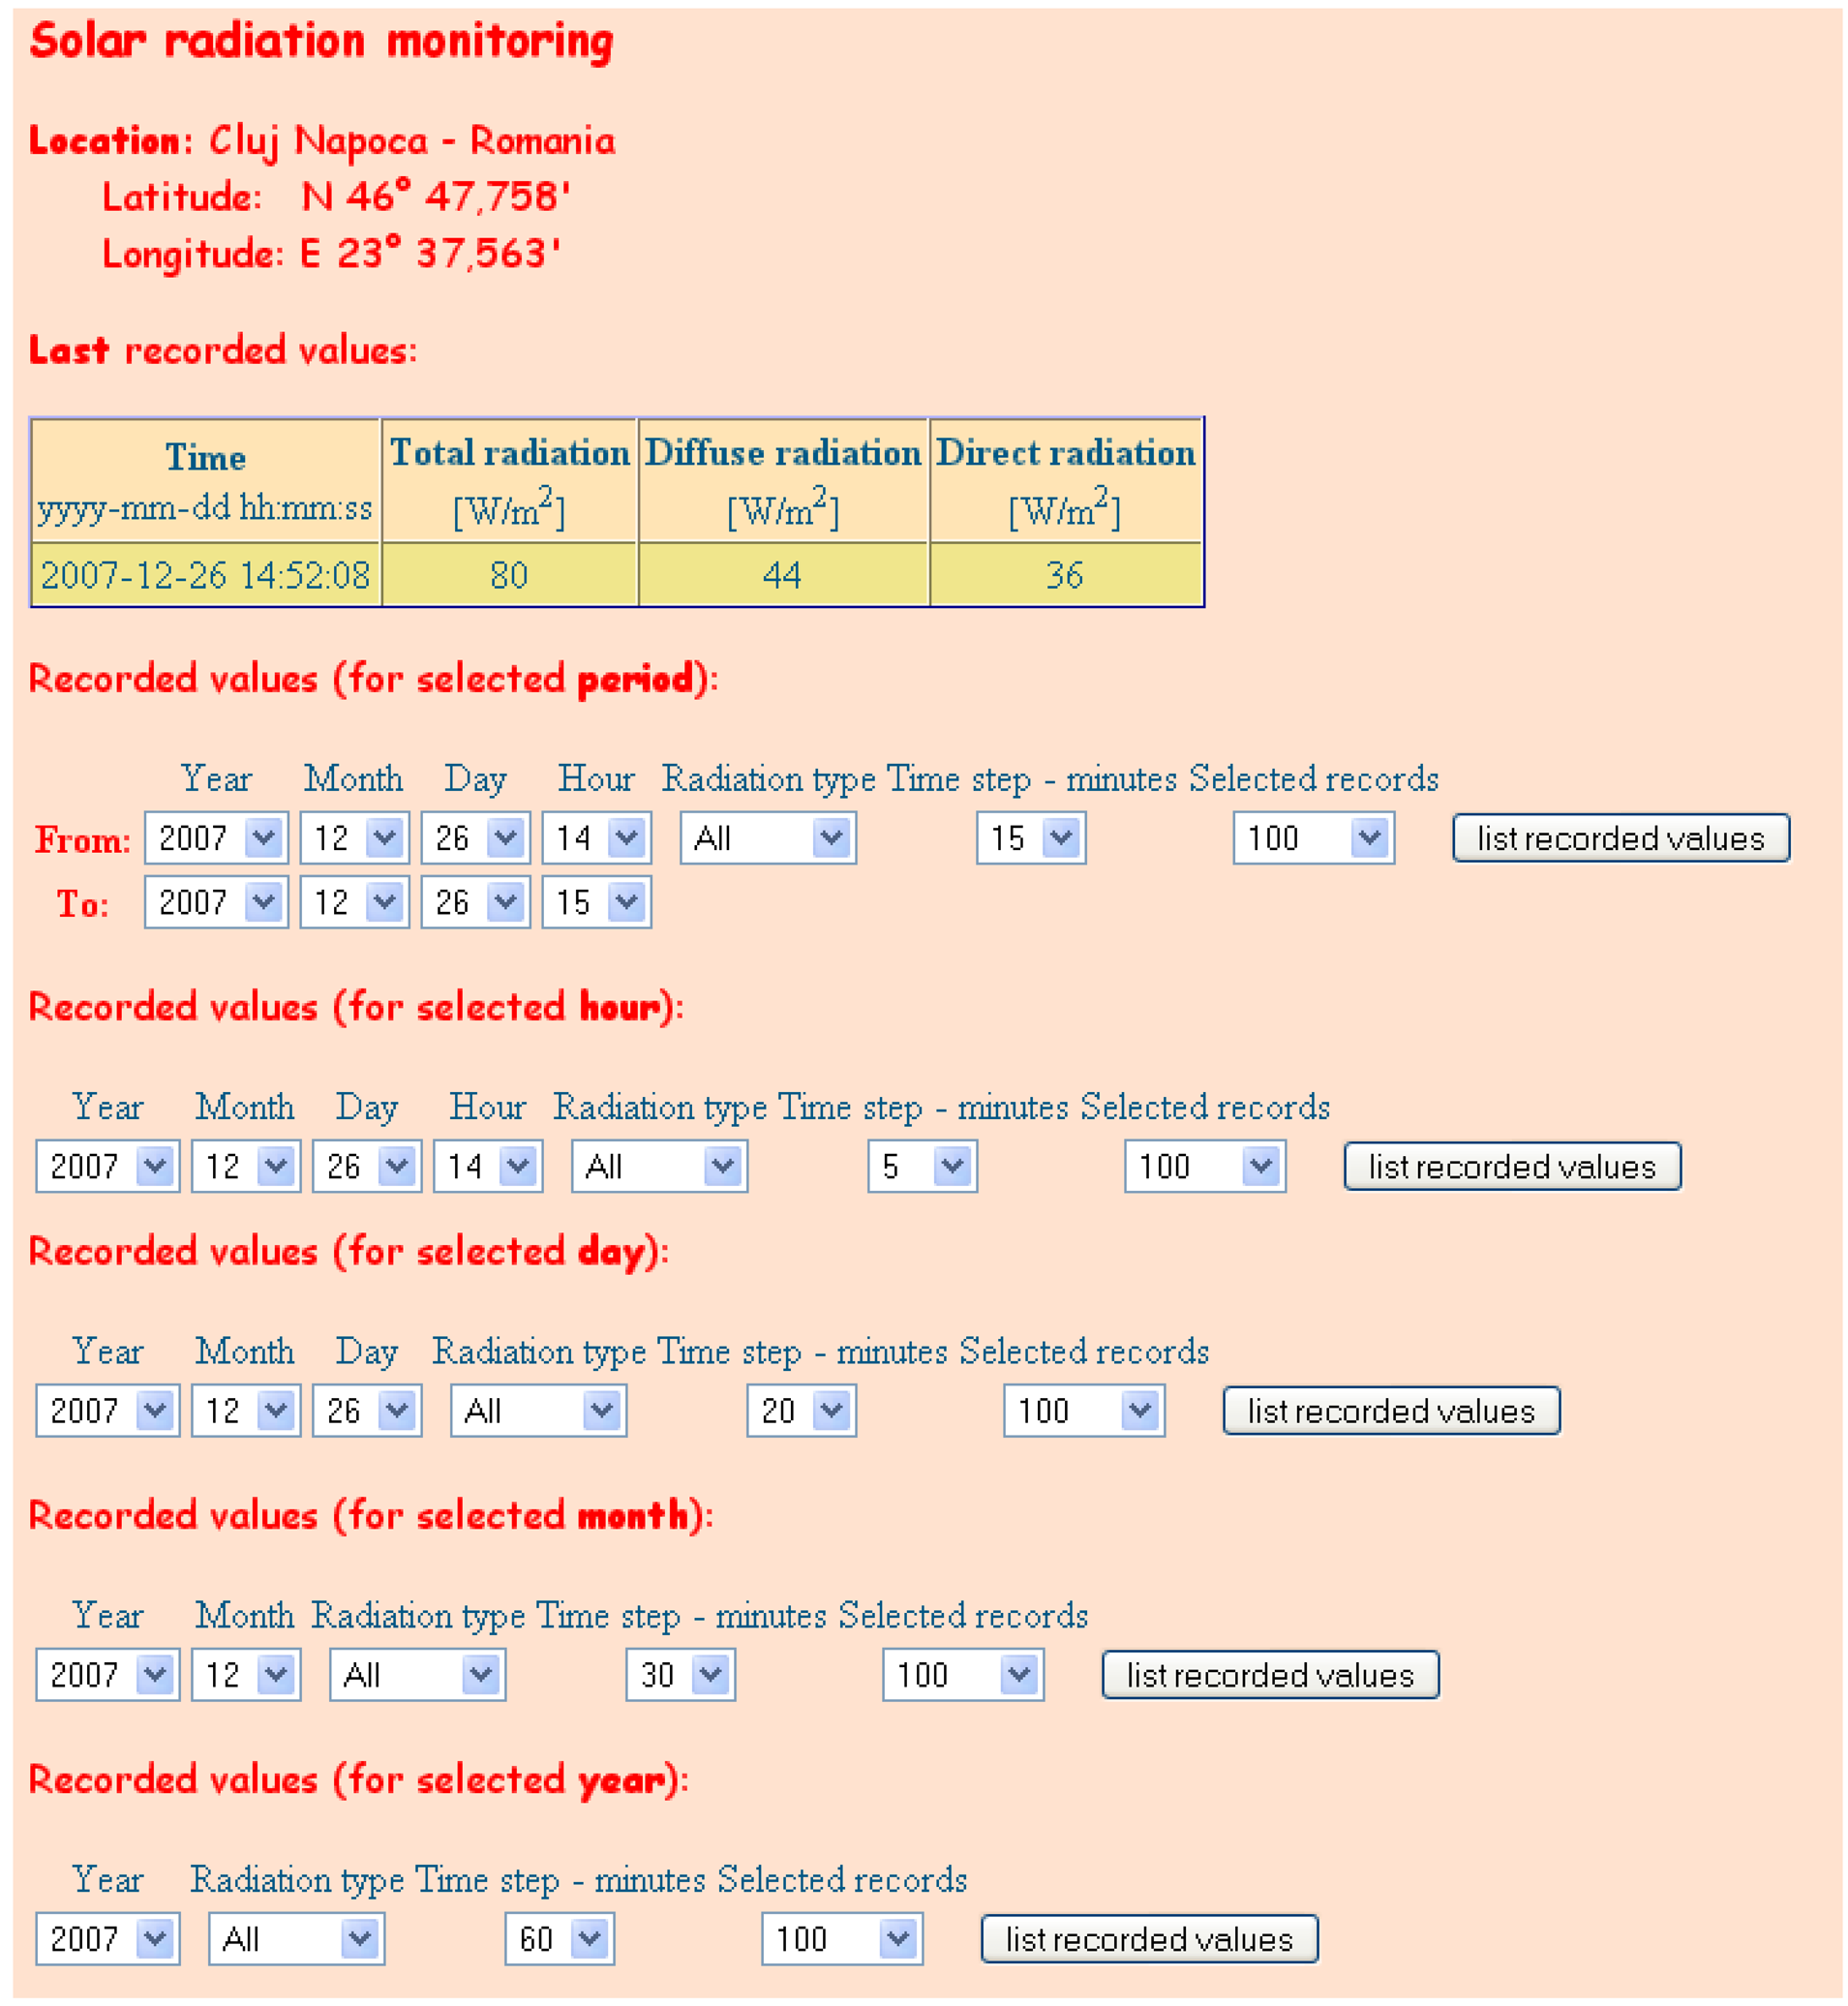
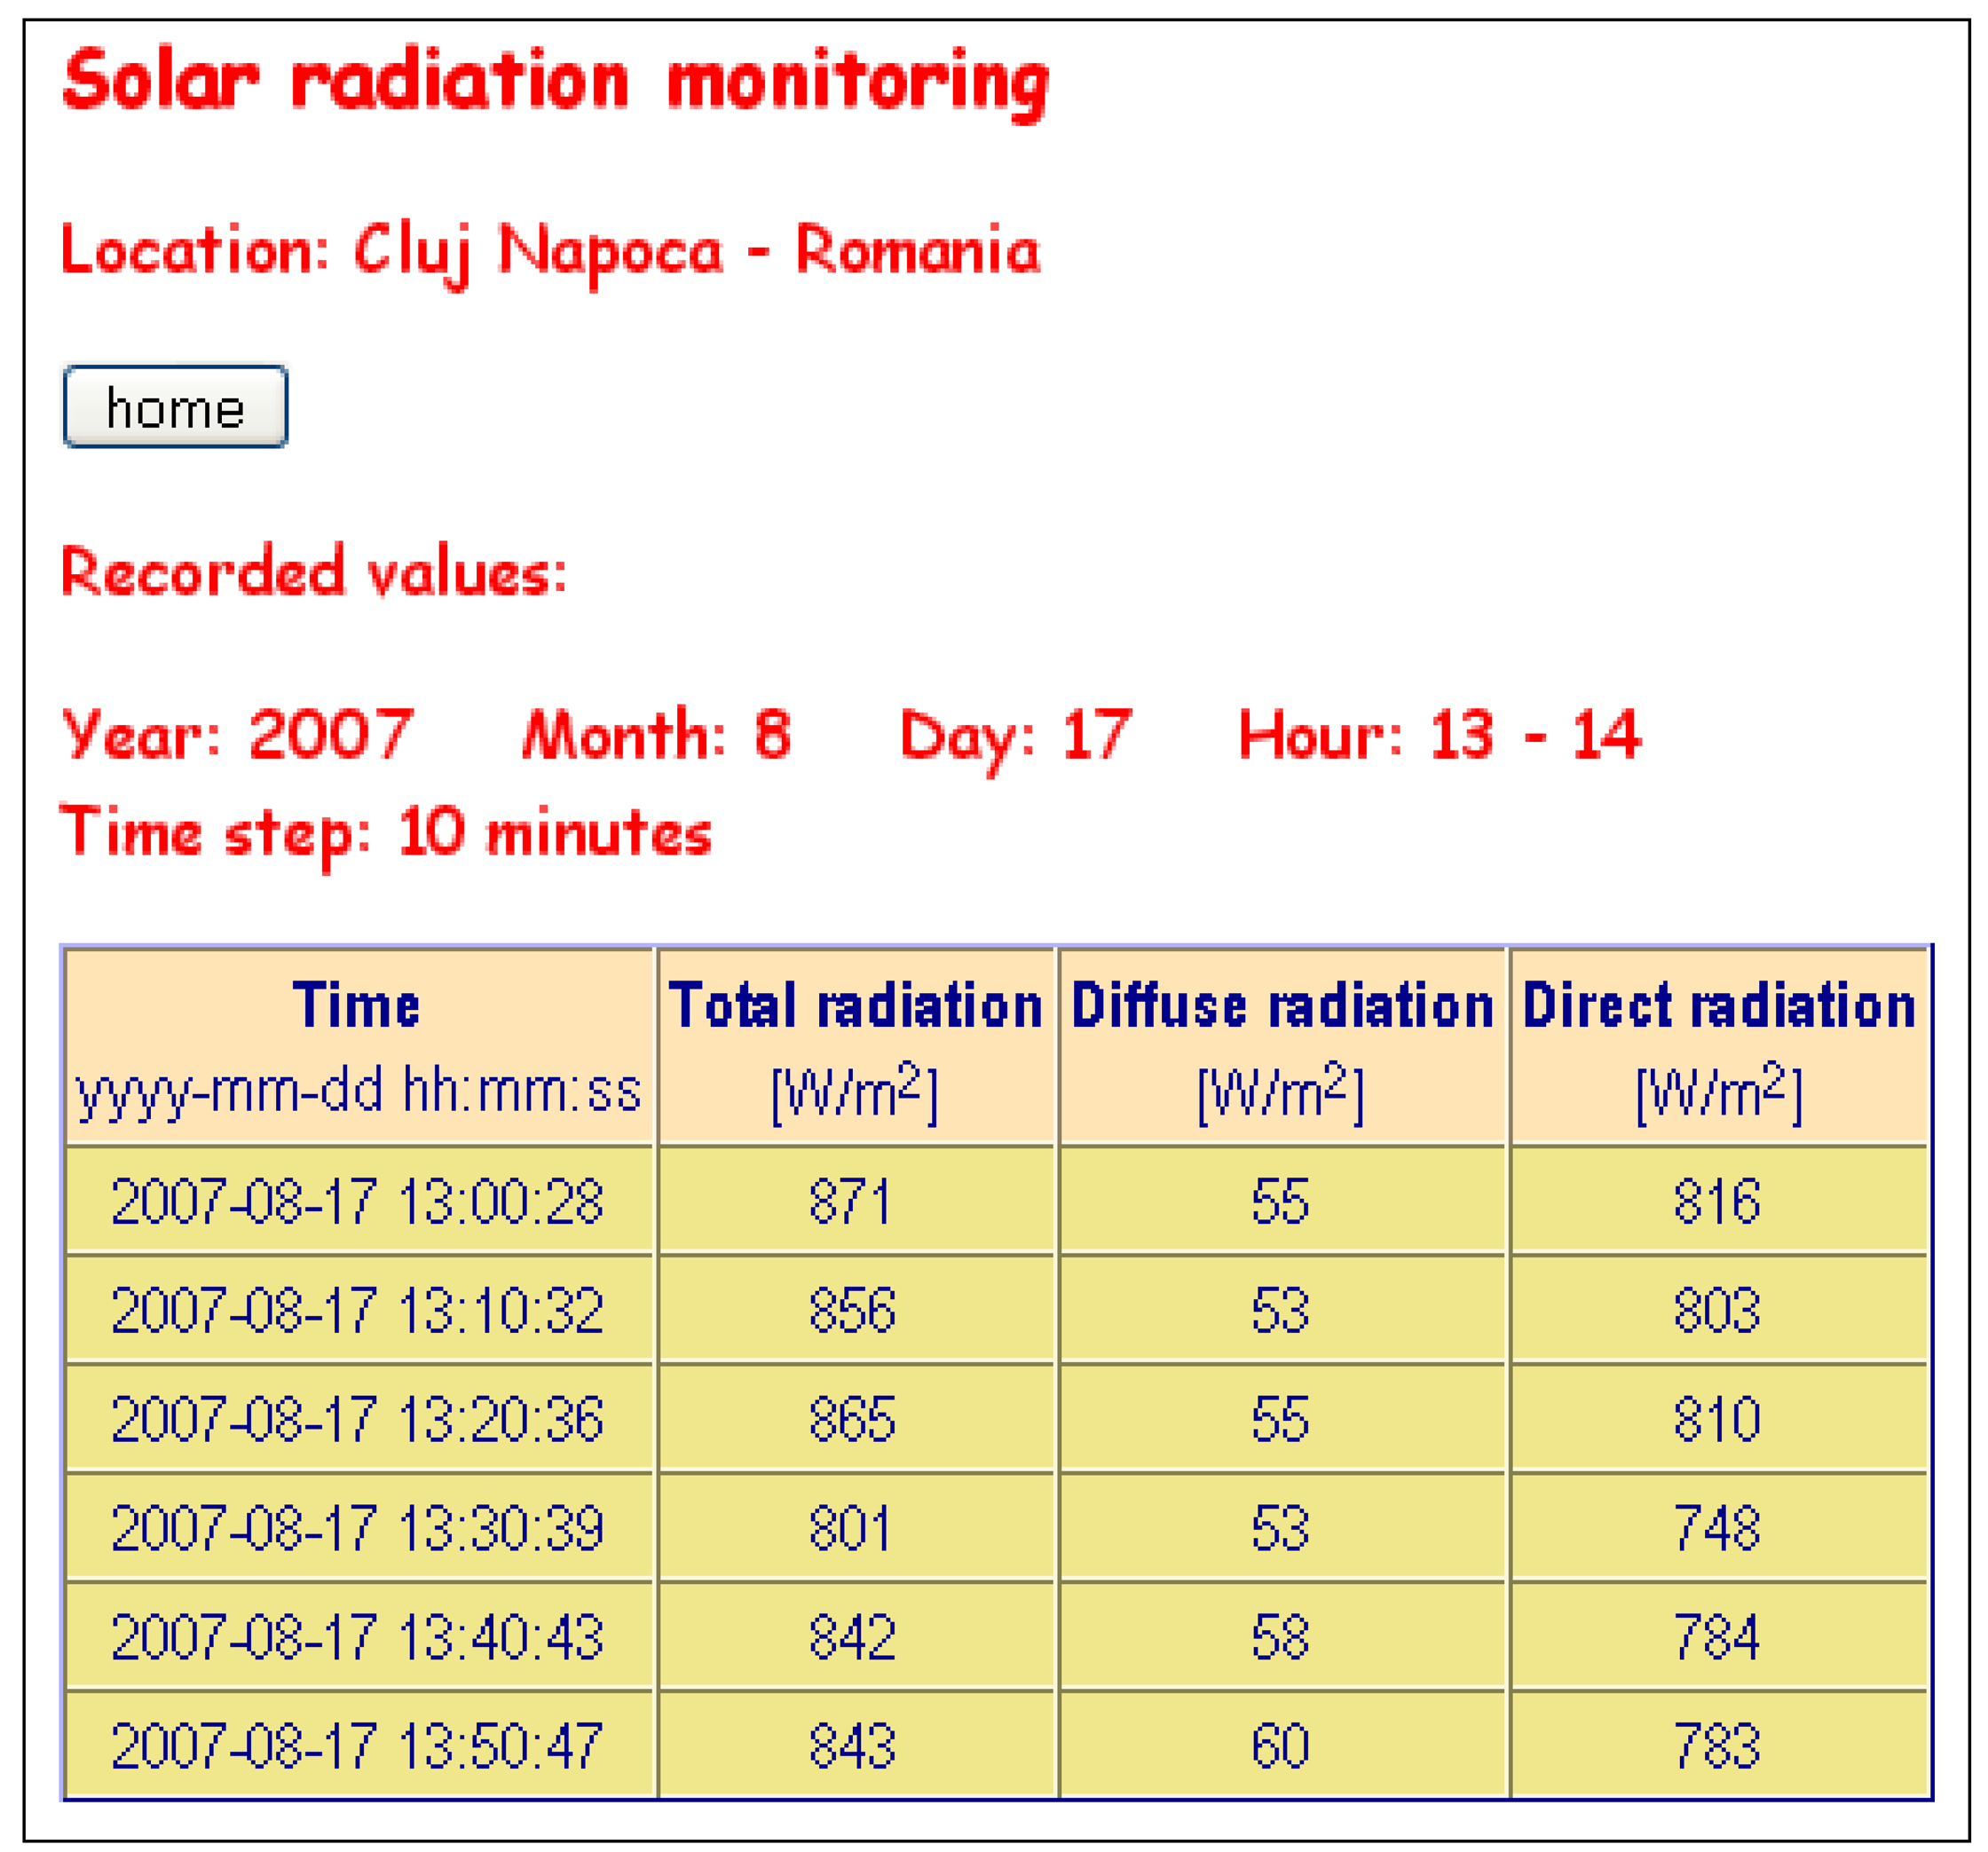
The display of the recorded data, based on multiple criteria selection of the stored data is realized on a web based virtual monitoring panel, using the interface presented in figure 5.
The web based interface, presented in figure 5, can be displayed on any internet connected computer, indicated as “Client computer” on figure 2. The interface will be displayed in the web browser of that computer. This element suggests that the presented solar radiation monitoring system was designed and realized into client-server architecture.
The interface present the last recorded values of the solar total, diffuse and calculated direct radiation intensities and offer the indicated in the figure, selection criteria options, for the recorded data.
For each option, it can be selected also the time step, in minutes, for witch the database stored date to be displayed. The possible values for the time step, depending of the selected criteria are: 1, 5, 10, 15, 20, 30, 60 minutes.
Each selection criteria can be activated by pressing one of the buttons marked by “list recorded values”.
Additional to the selected data following each criterion, the activated software components will also display the following computed values:
- -
- Direct solar radiation intensity, calculated as difference between the total and the diffuse solar radiation intensities;
- -
- Average values for the solar radiation intensities (total, diffuse and direct), for the whole selected period of time;
- -
- Average values for the solar radiation intensities (total, diffuse and direct), corresponding to the sunshine duration in the whole selected period of time;
- -
- Total values of radiant solar heat (total, diffuse and direct).
3. Results and Discussions
Some results, displayed by the different software components of the solar radiation monitoring system, are given below.
Figure 6 presents the values of the solar radiation intensities, recorded in august 17, 2007, between 13 and 14 EET (Eastern European Time), with a time step of 10 minutes. It was a completely sunny day, the sky was practically clear the whole day, and it can be observed that the recorded values are higher than 800W/m2.
Table 3 contains the values of the solar radiation intensities recorded in October 17, 2007, from hour to hour for the whole 24 hours of the day. We are interested to see if we are able to obtain the sunshine duration (defined as the period with direct radiation higher than 120 W/m2 - see 3.3.16.1 from [15]). From the information provided in table 3, an approximation of sunshine duration is immediate: from 8:00-9:00 AM to 5:00-6:00 PM. By using the recordings from the database, an exact value for sunshine duration on October 17, 2007 can be calculated using the definition from [15]. Following information results for a time step of one minute:
- -
- The average value of the total radiation intensity for sunshine duration is around 441 W/m2 comparing with the value of 163 W/m2 corresponding to the whole 24 hours considered period;
- -
- The average value of the diffuse radiation intensity for sunshine duration is around 37 W/m2 comparing with the value of 14 W/m2 corresponding to the whole 24 hours considered period;
- -
- The average value of the direct radiation intensity for sunshine duration is around 403 W/m2 comparing with the value of 148 W/m2 corresponding to the whole 24 hours considered period;
- -
- The sunshine duration is 8 hours 31 minutes and 36 seconds ± 50 seconds (from 08:45:44 to 17:17:20, 50 seconds being our recording baud rate);
- -
- The data from our database allowed us to obtain the heat components (by summing the elemental heats of every time step). Solar radiation components are:
- -
- Global solar radiation: 3887 Wh/m2;
- -
- Diffuse solar radiation: 453 Wh/m2;
- -
- Direct solar radiation: 3525 Wh/m2.
The results of the different software components of the presented monitoring system are very accurate and consistent.
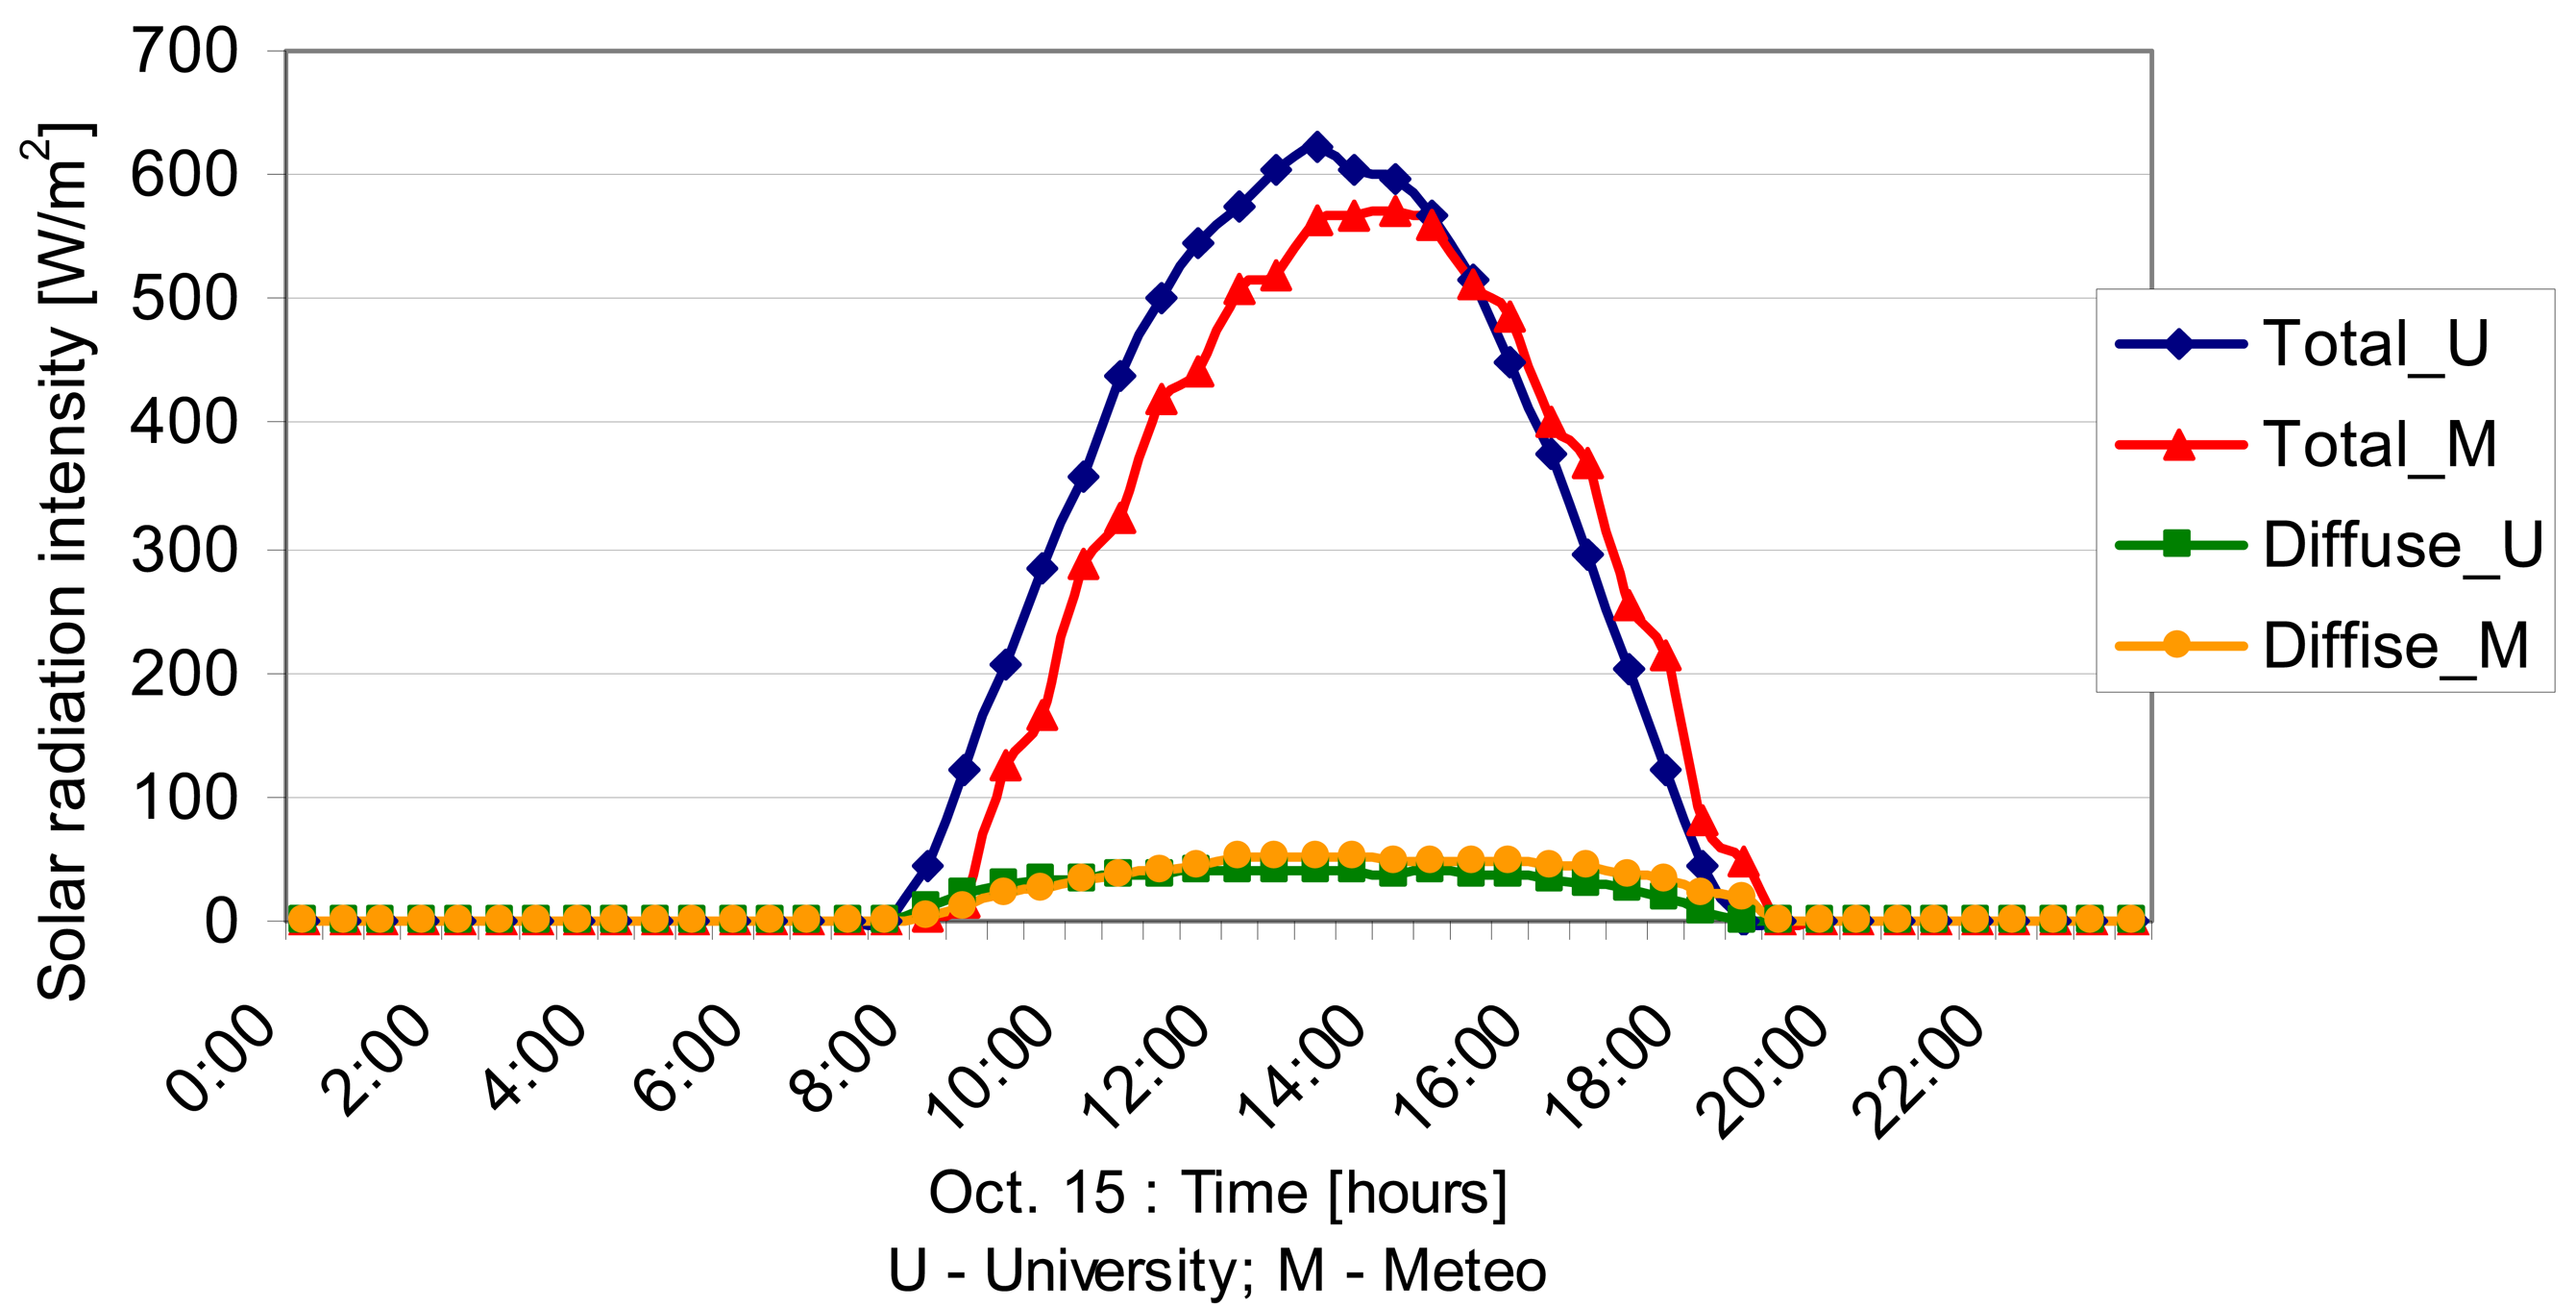
It has been performed a comparison with other measurements, made near our location (at 3.9 km distance) at a Meteorological Station of Cluj-Napoca, located at 46°46.665′ N and 23°34.941′ E (386m elevation, comparing to our location elevation of 338m).
In order to check if it exist a significant difference between our measurements and those provided by Meteorological Station, for October 15, 2007, we applied the nonparametric Wilcoxon Matched Pairs Test [16] by using the Statistica v.6.0 software. Forty-eight measurements were not null and entered into the comparison. A T value of 84 and a Z value of 1.886 were obtained. The p-level resulting from the Wilcoxon test was 0.059, being higher than 0.05, thus at 5% level of significance is no difference between our measurements and measurements at meteorological station.
These types of data are to be recorded for a long period of time (many years) and are going to be analyzed in order to evaluate the local potential of the solar energy, to be used in thermal collectors or in PV panels. At the moment of this paper realizing, there are available data for the period: August - December 2007. Even for this short period of time, the stored data reveals interesting ideas, such as assessing amount of total usable solar radiation depending on conversion equipment (on which a set of conversion parameters dependencies are known). For consistent conclusions, a longer period of time is needed, probably at less for one year, to include also a spring and mainly a summer period of time. The monitoring period, started immediately after a very unusual sultry and droughty summer.
Using the preliminary measurements (available from August 2007), it was possible to obtain the following results concerning the solar radiation intensity, during the observation period.
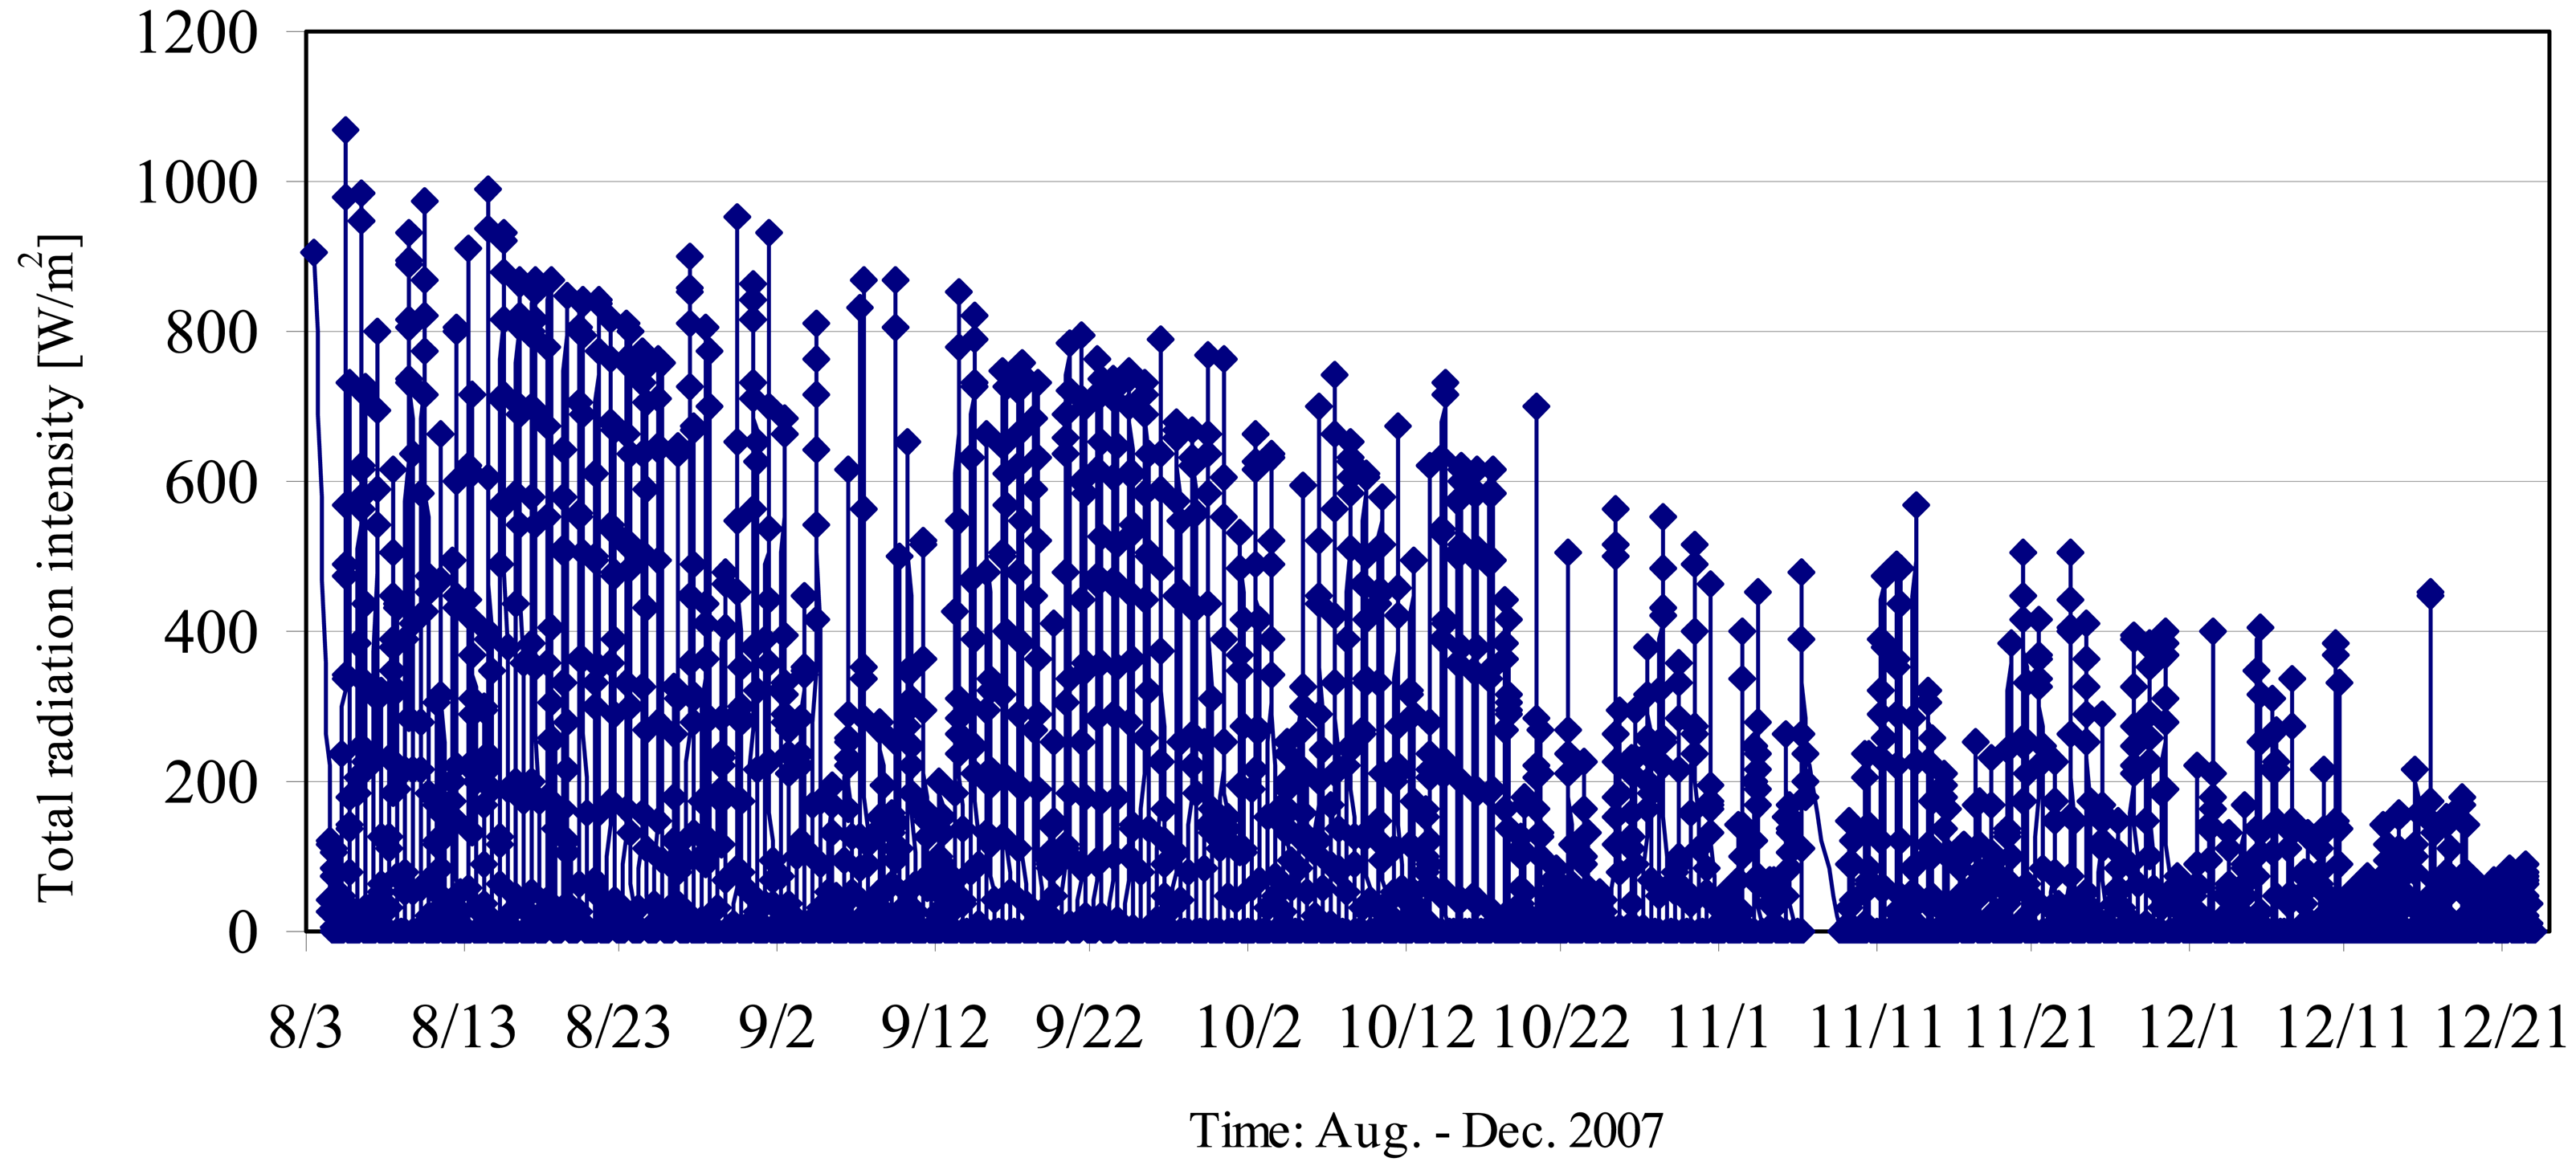
Figure 8 presents the variation of the total solar radiation intensity, in the period August - December 2007.
It can be observed the descendent trend of the recorded values of the total solar radiation intensity.
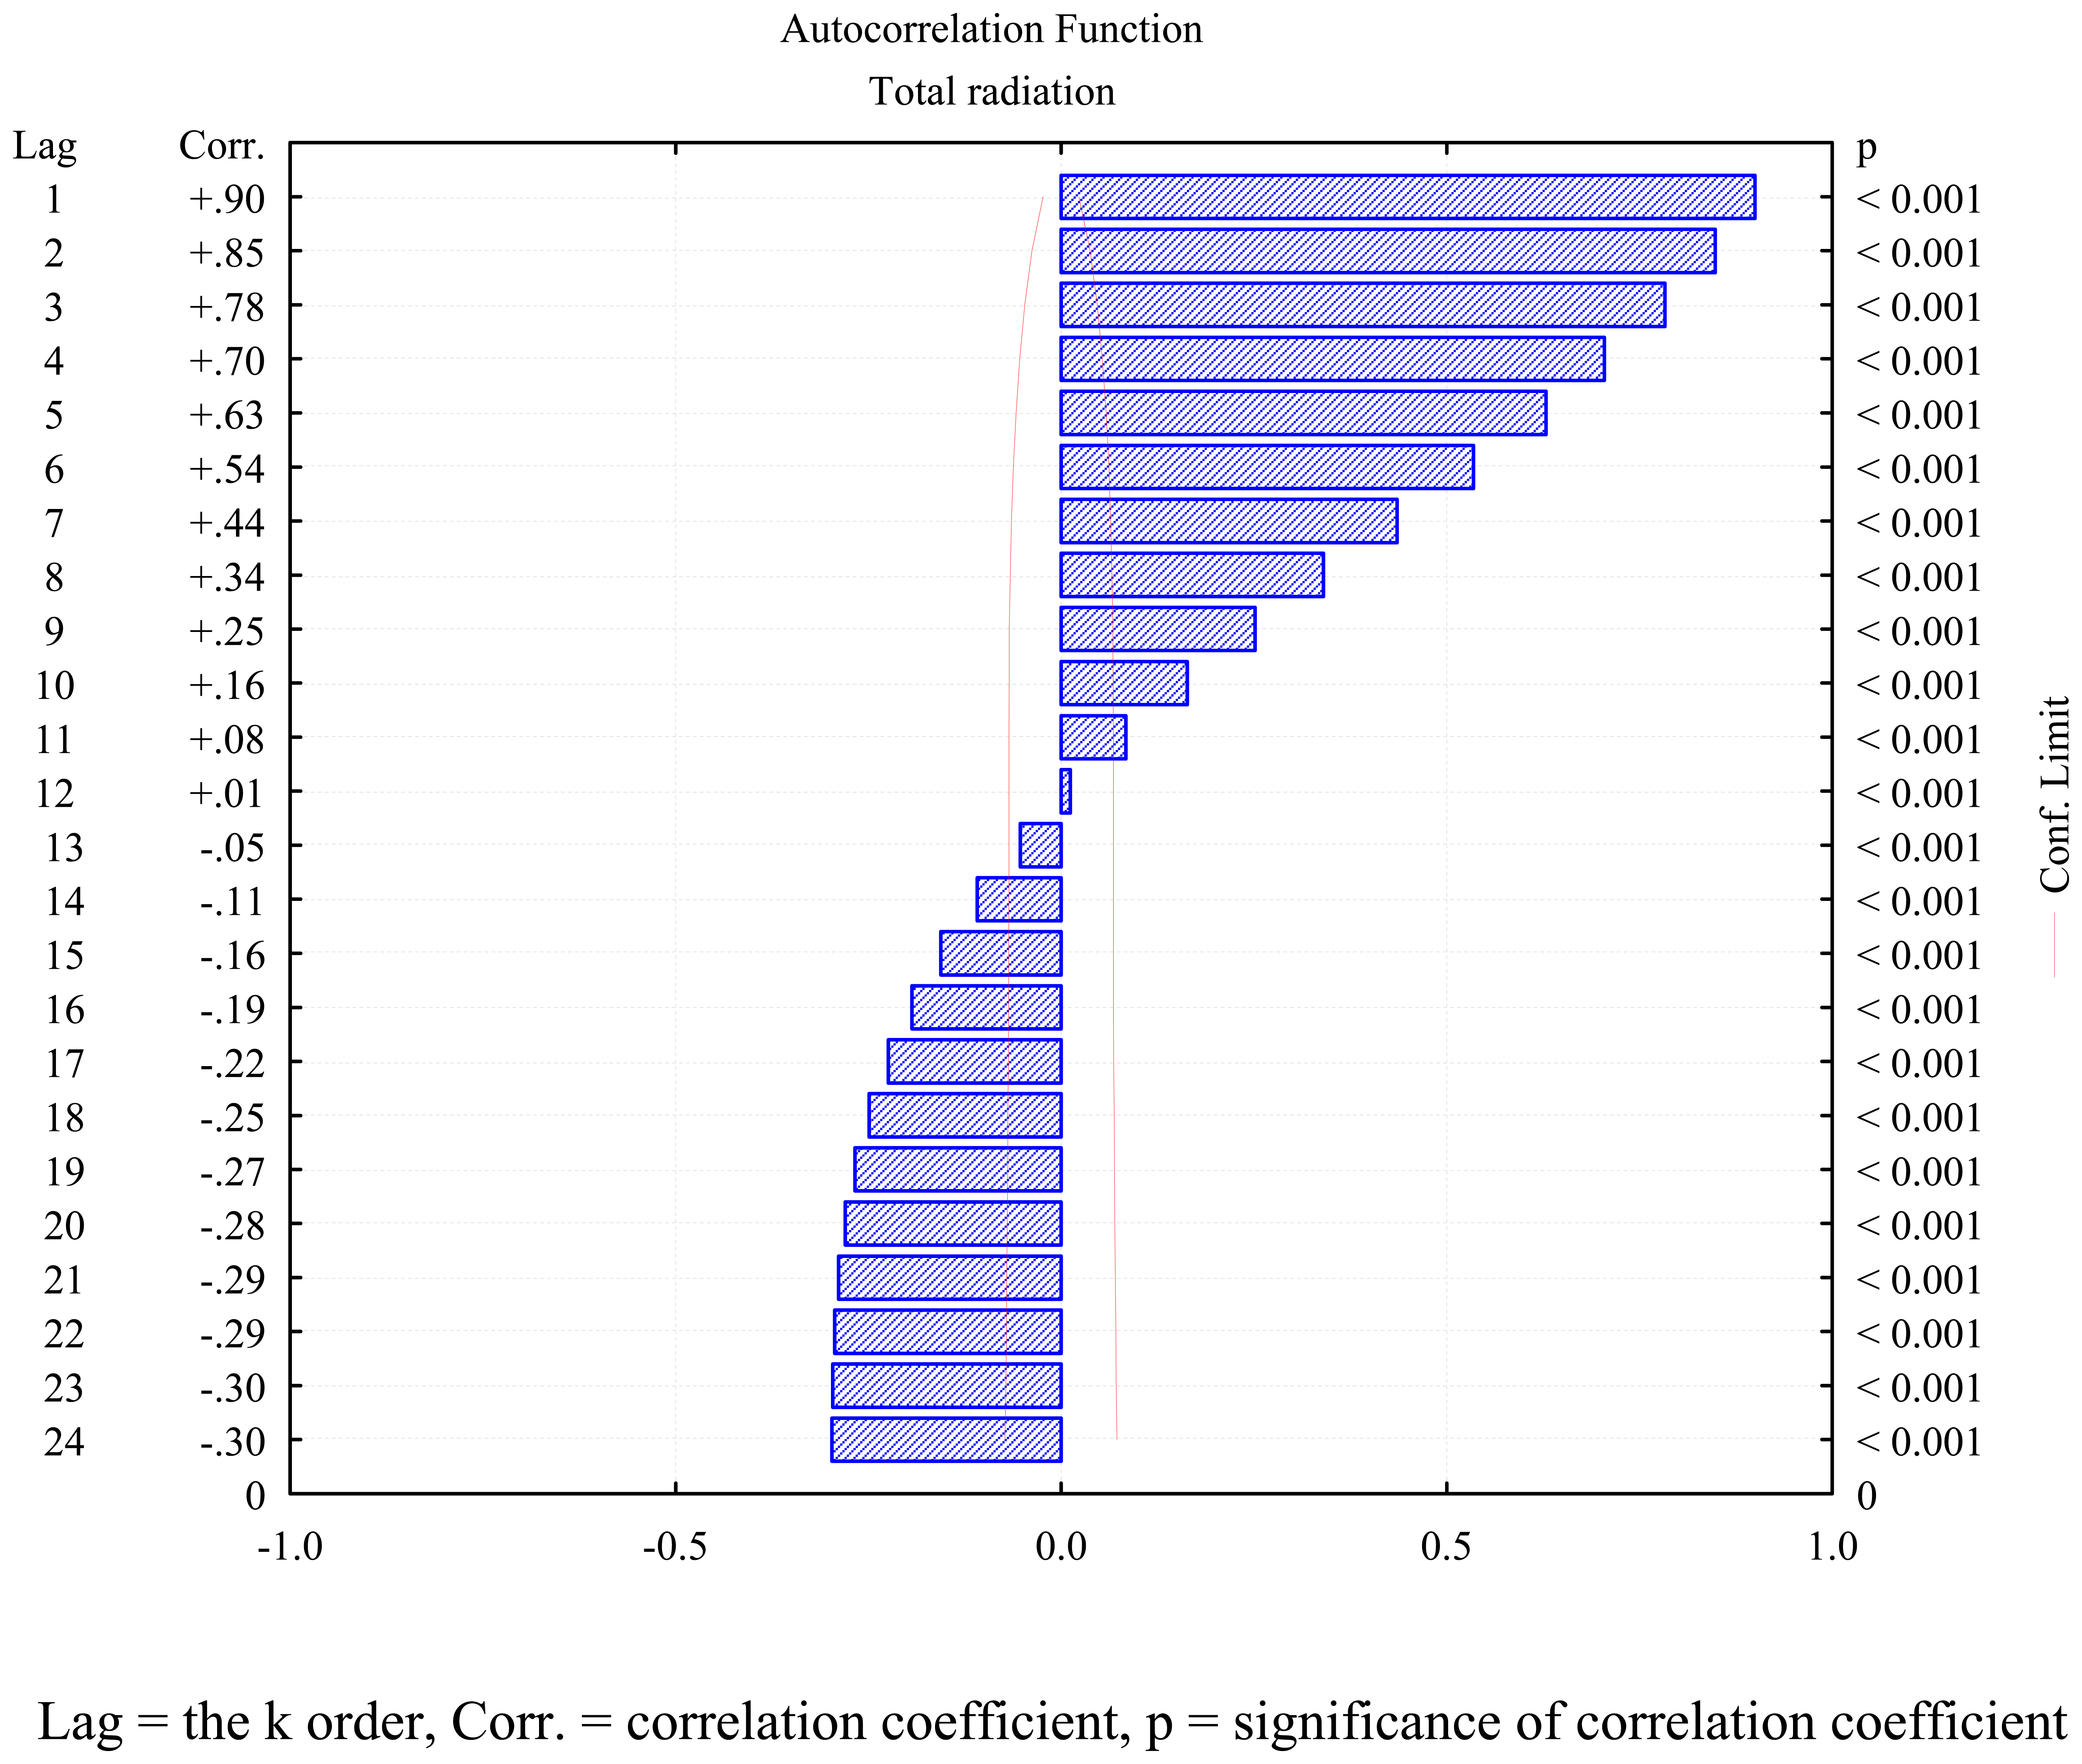
As it can be observed in figure 9, from the correlogram (made with Statistica Software, version 6), the autocorrelation decrease linearly, pass through zero and become negative. This result revealed that the series is not stationary, and the data must be differenced one or more times before it may be modeled with an autoregressive process.
Starting with data registered along one year, predictive models could be created and analyzed (this is the aim of a future investigation). Flux ranges can be computed from the series depending on month. Table 4 present the calculation for five months. The absolute errors (in Table 4) for sunshine duration are our precision multiplied with the number of sunshine durations in the selected period. It results an average of maximum one hour per one month. For solar radiation intensities, the precision depends with the precision of the monitoring system (being 1 unit per any measurement). By averaging this random error, precision are divided by squared number of measurements. A simple calculation gives an absolute error below 5‰ for a month.
The solar monitoring system is recording the values of the total and the diffuse radiation, and is calculating the values of the direct radiation. Figure 10 presents the values of the three types of solar radiation for the date of October 17.
The shape of this curves, seems to obey with the predicted model for the solar radiation, as “ASHRAE Clear Day Solar Flux Model” [11]. The experimental curves will be compared with the predicted once, when enough data (such as at least one entire year) will be recorded.
Comparative values for the total solar radiation intensity, in different days of different month, are presented in figure 11.
For each month of August, September and October, was chosen the day of 17, because it were completely sunny days. For the month of November and December were chosen also most sunny days, around the date of 17, in order to obtain an interval of almost one month between the represented curves. The choice of sunny days in November and December was difficult because the two month were very cloudy. On figure 11, it can be observed that the curves corresponding to the selected days of November and December are translated to the left, comparing to the other three curves. This fact is due to the local winter time which started on October 28. On the figure it was kept the local time, as it was recorded in the database. It can be easily observed that the total solar radiation intensity and the length of the day are continuously decreasing in the period August - December, as expected.
Figure 12, presents the evolution of the total solar radiation intensities, in three consecutives days of August, September and November.
Figure 13 is highlighting how in three days of September, were reached high values of the total solar radiation intensity (more than 1000 W/m2). It can be observed that in each of the selected days, the morning was cloudy, and with probable rain periods, which could clean the atmosphere. In these conditions, if sun appeared at noon, the values of the total solar radiation intensity were high. Figures 14 and 15 are presenting the evolution of the total solar radiation intensity, for a succession of 10 most sunny days in the month of August respectively September.
It can be observed, that the maximum values of the total solar radiation intensity, in the sunny days of August are situated in the range of 800…950 W/m2, and in September, the same values are situated in the range of 700…850 W/m2.
The different values of the total solar radiation intensities, registered in successive sunny days can be explained by different reasons such as different level of solar activity, different level of pollution in the local atmosphere, etc. In both figures, short time cloudy periods can be identified by the lower values of the total solar radiation intensity.
Conclusions
The presented solar monitoring system is representing an original, complex and useful hardware and software tool, able to offer all the needed information, to evaluate the local potential of the solar energy, to be used in thermal collectors or in PV panels.
The preliminary results obtained with the presented solar radiation monitoring system, proves that important and relevant information can be obtained by its use. For instance the averaged values of global, diffuse and direct solar radiation can be computed for any selected period of time, together with the value of the sunshine durations.
By applying a Wilcoxon Matched Pairs Test between our measurements, and the measurements provided by a local meteorological station, it was proved, that there are no significant differences between the two measurements. It means that the data provided by our solar radiation monitoring system can be used in future investigations with a high level of trust.
The recorded data are correlated with the expected trend of the total, diffuse and direct solar radiation intensity.
By applying specific instruments of statistical analysis, to the data obtained for a five months period, it was highlighted that the time series is not stationary, and the data must be differenced one or more times before it may be modeled with an autoregressive process.
A long time monitoring, will provide very useful data for log term local strategies for the use of the solar energy. Equally it will allow the developing of a simulation software tool to predict the solar radiation intensities, for the city of Cluj-Napoca.
Acknowledgments
This work was partly supported by the UEFISCSU Romania through research grants (ET108/2006 and ID0458/2007).
References and Notes
- Kreith, F.; Kreider, J.F. Principles of solar Engineering; Mc Graw-Hill: New York, 1978. [Google Scholar]
- Jain, P. Estimation of monthly hourly global and diffuse radiation. Solar and Wind Technol 1988, 5(1), 7–14. [Google Scholar]
- Kaplanis, S.; Kaplani, E. A model to predict expected mean and stochastic hourly global solar radiation I(h;nj) values. Renew Energ 2007, 32(8), 1414–1425. [Google Scholar]
- Miroslav, T.; Eitzinger, J.; Kapler, P.; Dubrovsky, M.; Semeradova, D.; Zalud, V.; Formayer, H. Effect of Estimated Daily Global Solar Radiation Data on the Results of Crop Growth Models. Sensors 2007, 7(10), 2330–2362. [Google Scholar]
- Bălan, M.; Damian, M. Software application for monitoring a small air conditioning unit. IEEE International Conference on Automation, Quality and Testing, Robotics Proceedings, Cluj-Napoca, Romania, May 25-28 2006; 2006; pp. 183–186. [Google Scholar]
- Bălan, M.; Damian, M.; Ion, I. Considerations about the potential use of the geothermal energy for domestic heating in Romania. International Congress: Automotive, Environment and Farm Machinery. AMMA Proceedings, Cluj-Napoca, Romania, October 11-13 2007; 2007; pp. 219–224. [Google Scholar]
- Jäntschi, L. Installing and Testing a Server Operating System, Leonardo Electronic Journal of Practices and Technologies; AcademicDirect; ISSN 1583-1078, www, Internet; Volume 2, 3, pp. 1–30. 2003. [Google Scholar]
- Jäntschi, L. I386-Based Computer Architecture and Elementary Data Operations, Leonardo Journal of Sciences; AcademicDirect; ISSN 1583-0233, www, Internet; Volume 2, 3, pp. 9–23. 2003. [Google Scholar]
- Hofierka, J.; Sury, M. The solar radiation model for Open Source GIS: implementation and applications. Open Source GIS - GRASS Users Conference 2002 Proceedings, Trento, Italy, September 11-13, 2002; 2002. [Google Scholar]
- Jäntschi, L.; Bălan, M.; Podar, E.; Bolboacă, S. Thermal Energy Efficiency Analysis for Residential Buildings. IEEE Region 8 Eurocon 2007 Conference Proceedings, Warsaw, Poland, September 9-12 2007; 2007; pp. 2009–2014. [Google Scholar]
- ASHRAE. Handbook - Fundamentals; Ch. 29; ASHRAE: Atlanta, 2001. [Google Scholar]
- Spitters, C.J.T.; Toussaint, H.A.J.M.; Goudriaan, J. Separating the diffuse and direct component of global radiation and its implications for modelling canopy photosynthesis. Part I. Components of incoming radiation. Agr Forest Meteorol 1986, 38(1-3), 217–229. [Google Scholar]
- Dutton, E.G.; Michalsky, J.J.; Stoffel, T.; Forgan, B.W.; Hickey, J.; Nelson, D.W.; Alberta, T.L.; Reda, I. Measurement of the broadband diffuse solar irradiance using current commercial instrumentation with a correction for thermal offset errors. J Atmos Ocean Tech 2001, 18(3), 297–314. [Google Scholar]
- Myers, D.R. Solar radiation modeling and measurements for renewable energy applications: Data and model quality. Energy 2005, 30(9 SPEC. ISS.), 1517–1531. [Google Scholar]
- World Meteorological Organization. Manual on the Global Observing System; Secretariat of the World Meteorological Organization: Geneva - Switzerland, 2002; Volume 544, 1. [Google Scholar]
- Wilcoxon, F. Individual comparisons by ranking methods. Biometrics 1945, 1, 80–83. [Google Scholar]
- Client-server application online availability: http://l.academicdirect.org/Engineering/environment/solar/
Figure 1.
Working principle scheme of a pyranometer.

Figure 2.
Working principle scheme of the data acquisition and monitoring system.

Figure 3.
Principle scheme of the data acquisition system using a microcontroller.

Figure 4.
(A) Principle flow chart of the “Acquisition software” component; (B) Principle flow chart of the “Database interrogation” component.
Figure 4.
(A) Principle flow chart of the “Acquisition software” component; (B) Principle flow chart of the “Database interrogation” component.

Figure 5.
Snapshoot of the monitoring panel.

Figure 6.
Snapshot: Values of the solar radiation intensity, recorded in august 17, 2007, between 13:00…14:00 EET, with a time step of 10 minutes.
Figure 6.
Snapshot: Values of the solar radiation intensity, recorded in august 17, 2007, between 13:00…14:00 EET, with a time step of 10 minutes.

Figure 7.
Comparison of two measurements located near one to each other (see text)

Figure 8.
Variation of the total solar radiation intensity, in the period August - December 2007

Figure 9.
Autocorrelation Correlogram on Total Radiation. Lag = the k order, Corr. = correlation coefficient, p = significance of correlation coefficient
Figure 9.
Autocorrelation Correlogram on Total Radiation. Lag = the k order, Corr. = correlation coefficient, p = significance of correlation coefficient

Figure 10.
Values of the total, diffuse, and direct solar radiation intensities for October 17.

Figure 11.
Comparative values for the total solar radiation intensities

Figure 12.
Evolution of the total solar radiation intensities, in three consecutives days.

Figure 13.
Three days in September, with high values of the total solar radiation intensity.

Figure 14.
Evolution of the total solar radiation intensity, for a succession of 10 days in August.

Figure 15.
Evolution of the total solar radiation intensity, for a succession of 10 days in September.
Figure 15.
Evolution of the total solar radiation intensity, for a succession of 10 days in September.


| Specification | Value |
|---|---|
| Response time (95%) | 18s |
| Zero offsets | |
| thermal radiation (200W/m2) | ±15W/m2 |
| temperature change (5K) | ±5W/m2 |
| Non stability change / year | ±1% |
| Non linearity (0..1000W/m2) | ±2.5% |
| Directional error (at 80° with 1000W/m2) | ±20W/m2 |
| Temperature dependence of sensitivity | ±5% (-10..+40°C) |
| Tilt error at 1000W/m2 | ±2% |
| Sensitivity | 5…15μV/W/m2 |
| Operating temperature | -40..+80°C |
| Spectral range | 310..2800nm |
| Maximum irradiance | 2000W/m2 |
| Expected daily accuracy | ±10% |
| Field | Type | Extra | Comments |
|---|---|---|---|
| id | Integer | auto increment | Also primary key |
| data | DateTime | Date-time composite field | |
| pyr0 | Integer | Numeric value | |
| pyr1 | Integer | Numeric value |
| Time | Radiation [W/m2] | ||
|---|---|---|---|
| [hh:mm:ss] | Total | Diffuse | Direct |
| … | 0 | 0 | 0 |
| 7:00:21 | 0 | 0 | 0 |
| 8:00:44 | 32 | 9 | 23 |
| 9:00:50 | 186 | 28 | 158 |
| 10:00:22 | 338 | 37 | 301 |
| 11:00:45 | 492 | 42 | 450 |
| 12:00:17 | 584 | 44 | 540 |
| 13:00:40 | 614 | 44 | 570 |
| 14:00:12 | 583 | 42 | 541 |
| 15:00:38 | 493 | 37 | 456 |
| 16:00:11 | 354 | 33 | 321 |
| 17:00:34 | 189 | 25 | 164 |
| 18:00:06 | 27 | 6 | 21 |
| 19:00:29 | 0 | 0 | 0 |
| … | 0 | 0 | 0 |
| Month | Sunshine duration [hours] | Solar radiation intensity | Solar radiation [kWh/m-2] | |||||||
|---|---|---|---|---|---|---|---|---|---|---|
| all period [W/m2] | Sunshine [W/m2] | |||||||||
| Total | Diffuse | Direct | Total | Diffuse | Direct | Total | Diffuse | Direct | ||
| 8 | 214±1 | 209 | 50 | 159 | 566 | 106 | 460 | 138 | 33 | 105 |
| 9 | 198±1 | 158 | 32 | 126 | 504 | 80 | 424 | 113 | 23 | 91 |
| 10 | 152±1 | 102 | 24 | 78 | 401 | 71 | 331 | 76 | 18 | 58 |
| 11 | 82±1 | 58 | 16 | 42 | 317 | 59 | 258 | 39 | 11 | 28 |
| 12 | 21±1 | 29 | 14 | 15 | 287 | 52 | 235 | 21 | 10 | 11 |
© 2008 by MDPI Reproduction is permitted for noncommercial purposes.
Share and Cite
MDPI and ACS Style
Balan, M.C.; Damian, M.; Jäntschi, L. Preliminary Results on Design and Implementation of a Solar Radiation Monitoring System. Sensors 2008, 8, 963-978. https://doi.org/10.3390/s8020963
AMA Style
Balan MC, Damian M, Jäntschi L. Preliminary Results on Design and Implementation of a Solar Radiation Monitoring System. Sensors. 2008; 8(2):963-978. https://doi.org/10.3390/s8020963
Chicago/Turabian StyleBalan, Mugur C., Mihai Damian, and Lorentz Jäntschi. 2008. "Preliminary Results on Design and Implementation of a Solar Radiation Monitoring System" Sensors 8, no. 2: 963-978. https://doi.org/10.3390/s8020963