Article

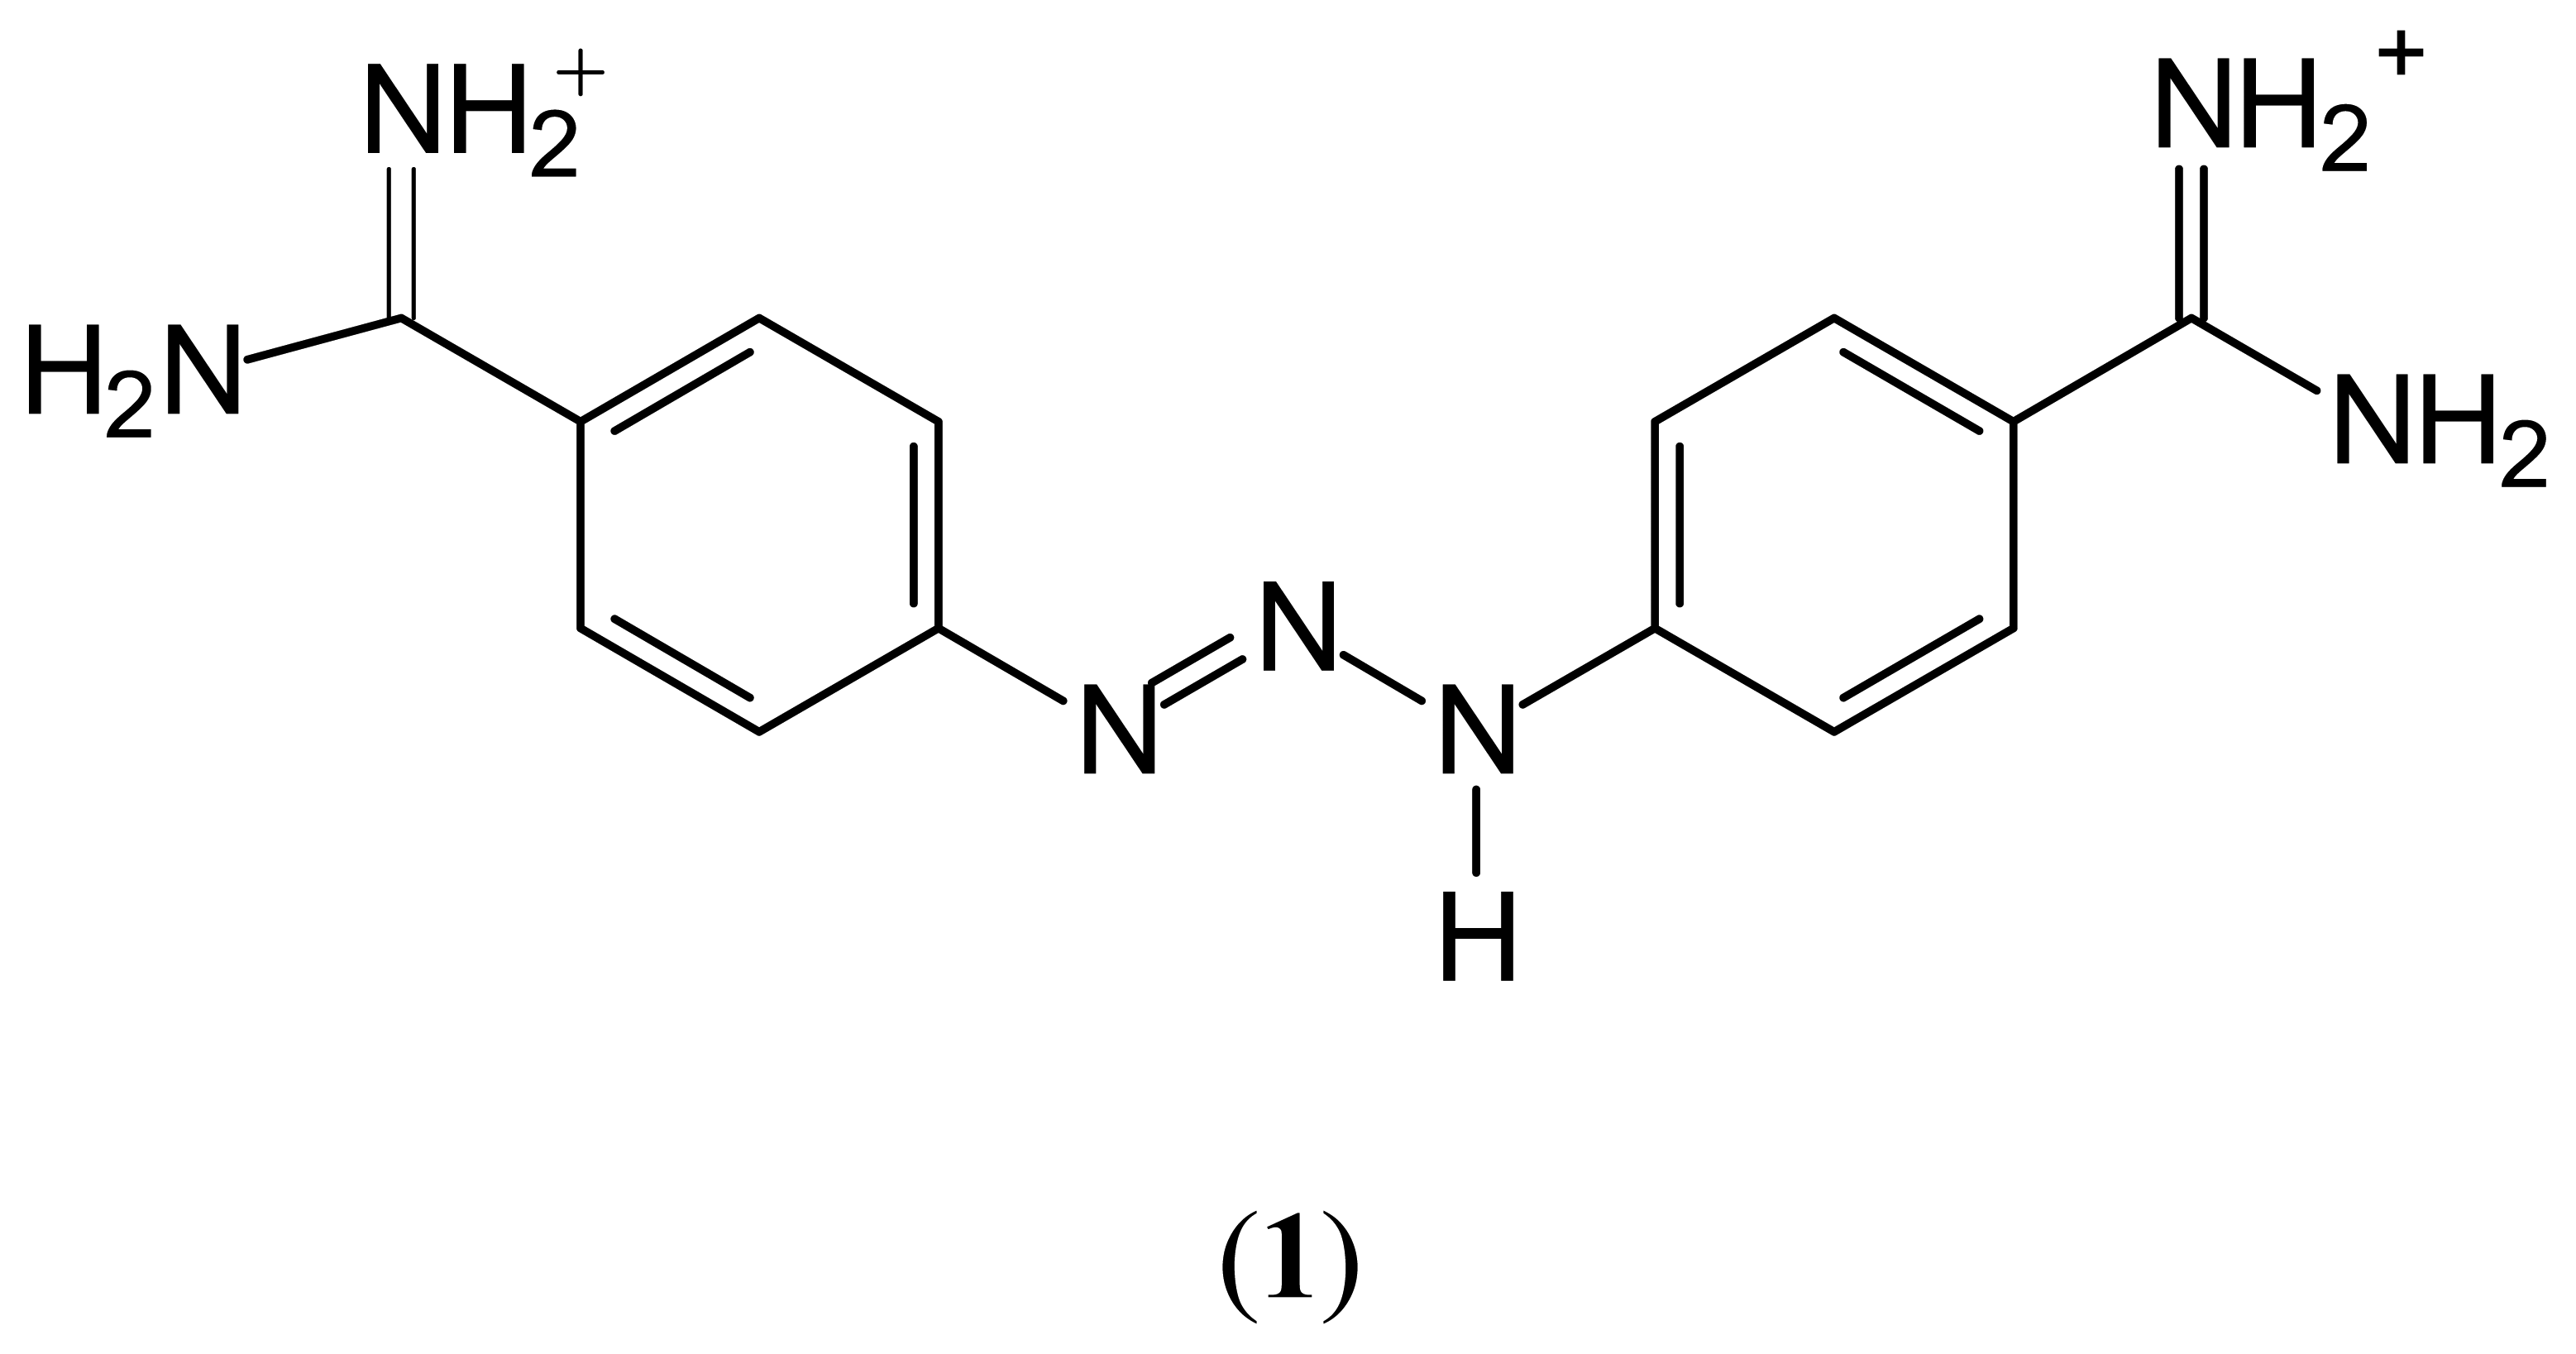
The Application of DNA-Biosensors and Differential Scanning Calorimetry to the Study of the DNA-Binding Agent Berenil

by
Fabiane C. De Abreu
1,*,
Francine S. De Paula
1,
Danielle C. M. Ferreira
1,
Valberes B. Nascimento
2,
Julio C. D. Lopes
3,*,
Alexandre M. C. Santos
4,
Marcelo M. Santoro
4,
Carlos E. Salas
4 and
Marília O. F. Goulart
4,*
1
Instituto de Química e Biotecnologia, Universidade Federal de Alagoas, Maceió, AL, Brazil
2
Departamento de Química, Universidade Federal Rural de Pernambuco, Recife, PE, Brazil
3
Departamento de Química, Universidade Federal de Minas Gerais, Belo Horizonte, MG, Brazil
4
Departamento de Bioquímica e Imunologia, Universidade Federal de Minas Gerais, Belo Horizonte, MG, Brazil
*
Authors to whom correspondence should be addressed.
Sensors 2008, 8(3), 1519-1538; https://doi.org/10.3390/s8031519
Submission received: 29 January 2008 / Accepted: 14 February 2008 / Published: 3 March 2008

Abstract

:
The in situ DNA-damaging capacity of berenil (1) has been investigated using an electrochemical approach employing double stranded (ds) DNA-modified glassy carbon electrode biosensors. Electrochemical voltammetric sensing of damage caused by 1 to dsDNA was monitored by the appearance of peaks diagnostic of the oxidation of guanine and adenine. When 1 was incorporated directly onto the biosensor surface, DNA damage could be observed at concentrations of additive as low as 10 μM. In contrast, when the dsDNA-modified biosensor was exposed to 1, in acetate buffer solution, the method was much less sensitive and DNA damage could be detected only in the presence of 100 μM berenil. When mixed solutions of 1 and single stranded (ss) DNA, polyguanylic acid or polyadenylic acid were submitted to voltammetric study, the oxidation signals of the respective bases decreased in a concentration-dependent manner and the major variation of the adenine current peak indicated preferential binding of 1 to adenine. The electrochemical results were in close agreement with those deriving from a differential scanning calorimetric study of the DNA-berenil complex.

1. Introduction

Many compounds bind and interact with DNA causing changes in structure and/or base sequence. Moreover, ligand binding at a specific site on the DNA can induce long range effects on both DNA structure and stability [1]. Whilst DNA binding may disrupt the mechanism of DNA replication and give rise to cancerous conditions, in a number of cases such binding can also engender beneficial effects. For example, the anti-parasitic activity of a molecule may be correlated with its DNA binding characteristics [2,3].
Intercalation and groove-binding are the two most common modes by which small molecules bind directly and selectively to DNA [1]. Intercalation, which is an enthalpically driven process, results from the insertion of a planar aromatic ring system between DNA base pairs with concomitant unwinding and lengthening of the DNA helix [4]. In contrast, groove-binding, which is predominantly entropically driven, involves covalent or non-covalent (electrostatic) interactions that do not perturb the duplex structure to any great extent [5]. Groove-binders are typically crescent-shaped, and fit snugly into the minor groove with little distortion of the DNA structure. It has been suggested, however, that some DNA-binding drugs, especially those classified as minor groove-binders, may exhibit mixed binding modes [6-9], and that the anticancer efficacy of such drugs may be linked to this ability [10,11].
It is clearly of fundamental importance to explore the factors that determine the affinity and selectivity of DNA-binding compounds in order to ascertain the nature and potency of such molecules, particularly with respect to their potential to cause DNA damage. In this context, the need for stable, low cost, and readily adaptable analytical tools for the detection of DNA damage has been the driving force in the development of DNA-biosensor technology [12,13].
An electrochemical DNA-biosensor is a receptor-transducer that employs double stranded DNA (dsDNA) immobilized onto the surface of an electrochemical transducer as the molecular recognition element through which specific DNA-binding processes may be assessed [14,15]. The interaction of an analyte (drug, pro-drug or in situ-generated intermediate) with dsDNA may lead to the rupture of hydrogen bonds and consequential opening of the double helix resulting in increased accessibility to the constituent bases. The extent of DNA damage may be determined by monitoring the oxidation of the exposed bases by voltammetric methods [14,15]. The electrochemical characteristics of such dsDNA-biosensors have been evaluated and it is clear that this approach can provide greater understanding of the mechanism of interaction between drugs and DNA and can also offer new insights in rational drug design [12-19].
The aromatic symmetric diamidine 4,4′-(1-triazene-1,3-diyl)bis(benzamidine) (berenil, 1) has a significant anti-microbial activity and is used in veterinary medicine as a trypanocidal agent against Trypanosoma and/or Leishmania[20,21]. Berenil is a paradigmatic minor-groove binder that interacts with DNA at AT-rich sites [22-30], through the establishment of specific hydrogen bonds between the drug and adjacent A or T residues on the DNA, thus interfering in fundamental DNA processes such as transcription and replication [24]. The design of dications, such as 1, that target the minor groove of DNA has become a productive strategy in the discovery of new anti-parasitic drugs [30].
With this in mind, electrochemical dsDNA-glassy carbon (GC) biosensors have been developed with which to investigate the damaging effects of 1 toward dsDNA, whilst possible interactions between 1 and single stranded-DNA (ssDNA), polyguanylic acid (polyG) and polyadenylic acid (polyA) have been studied in solution using voltammetric techniques. Differential scanning calorimetry (DSC), which represents a rapid, accurate and straightforward method for the detection of damage to DNA, has also been employed in order to study the interaction between 1 and dsDNA. The combined results strongly suggest that 1 undergoes mixed-mode binding to dsDNA. The described techniques are simple and easy to perform and should be of value in qualitative investigations in this field of research.
Sensors 08 01519u1

2. Results and Discussion

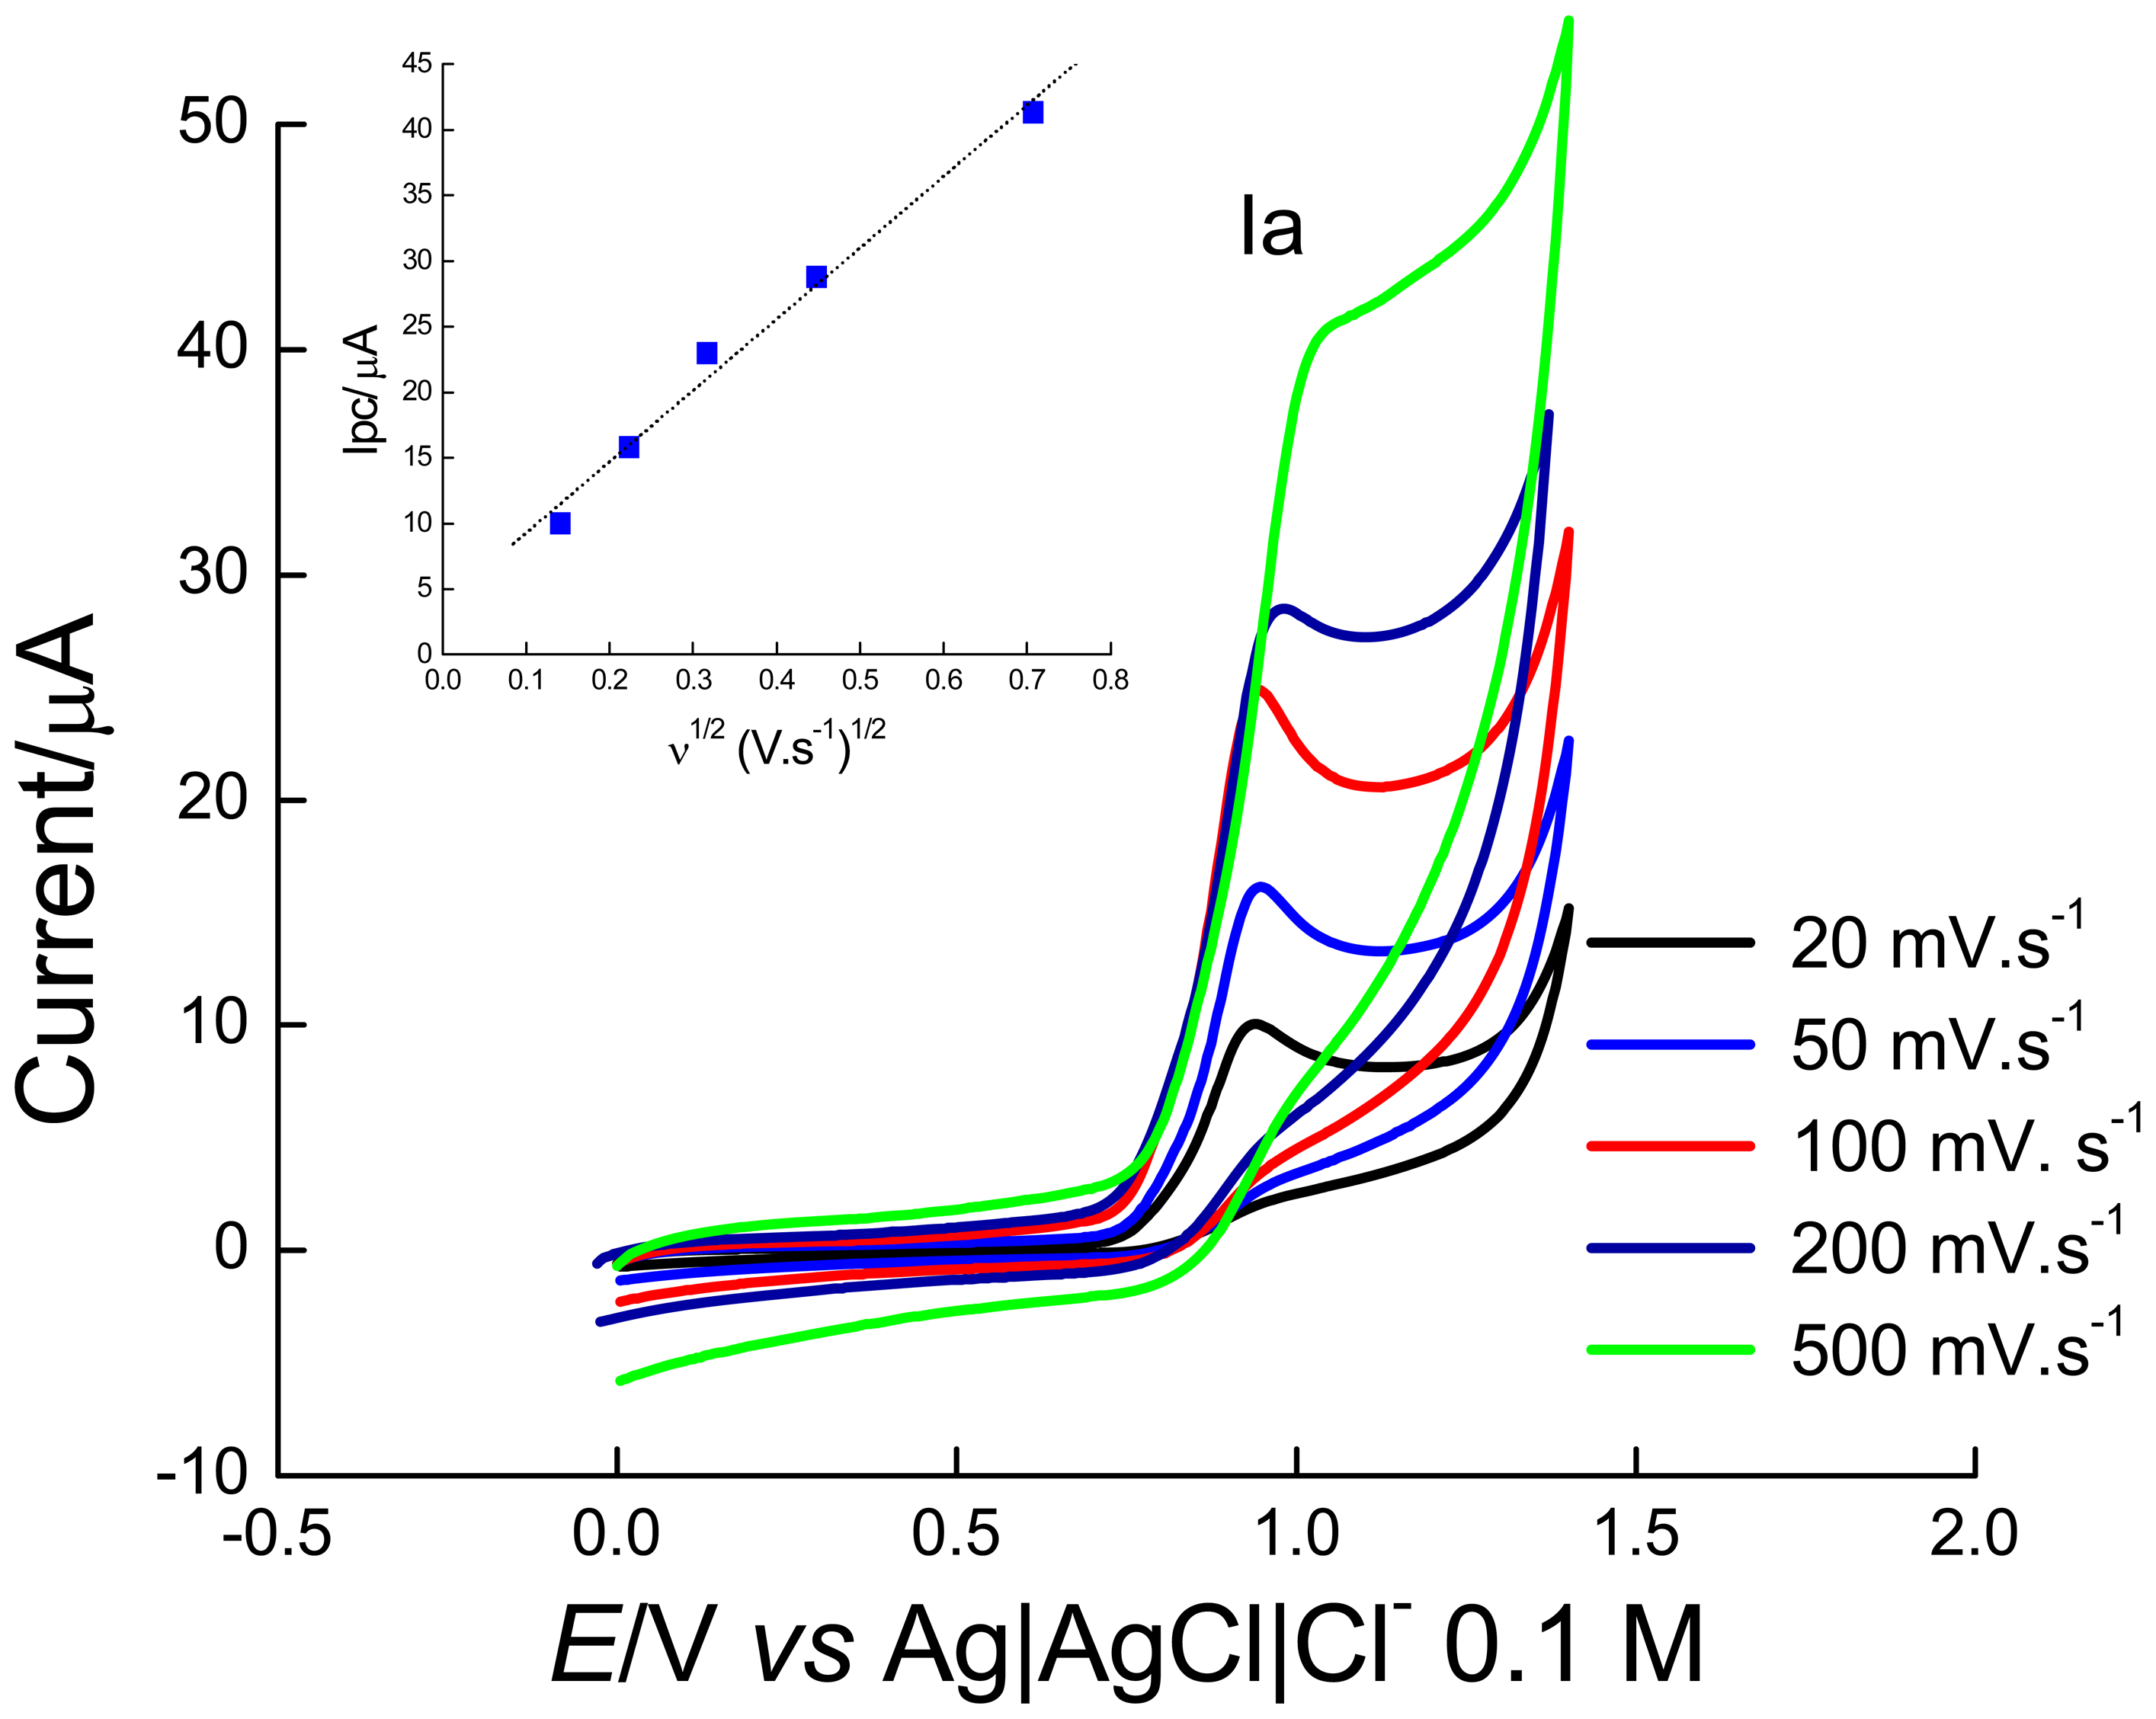
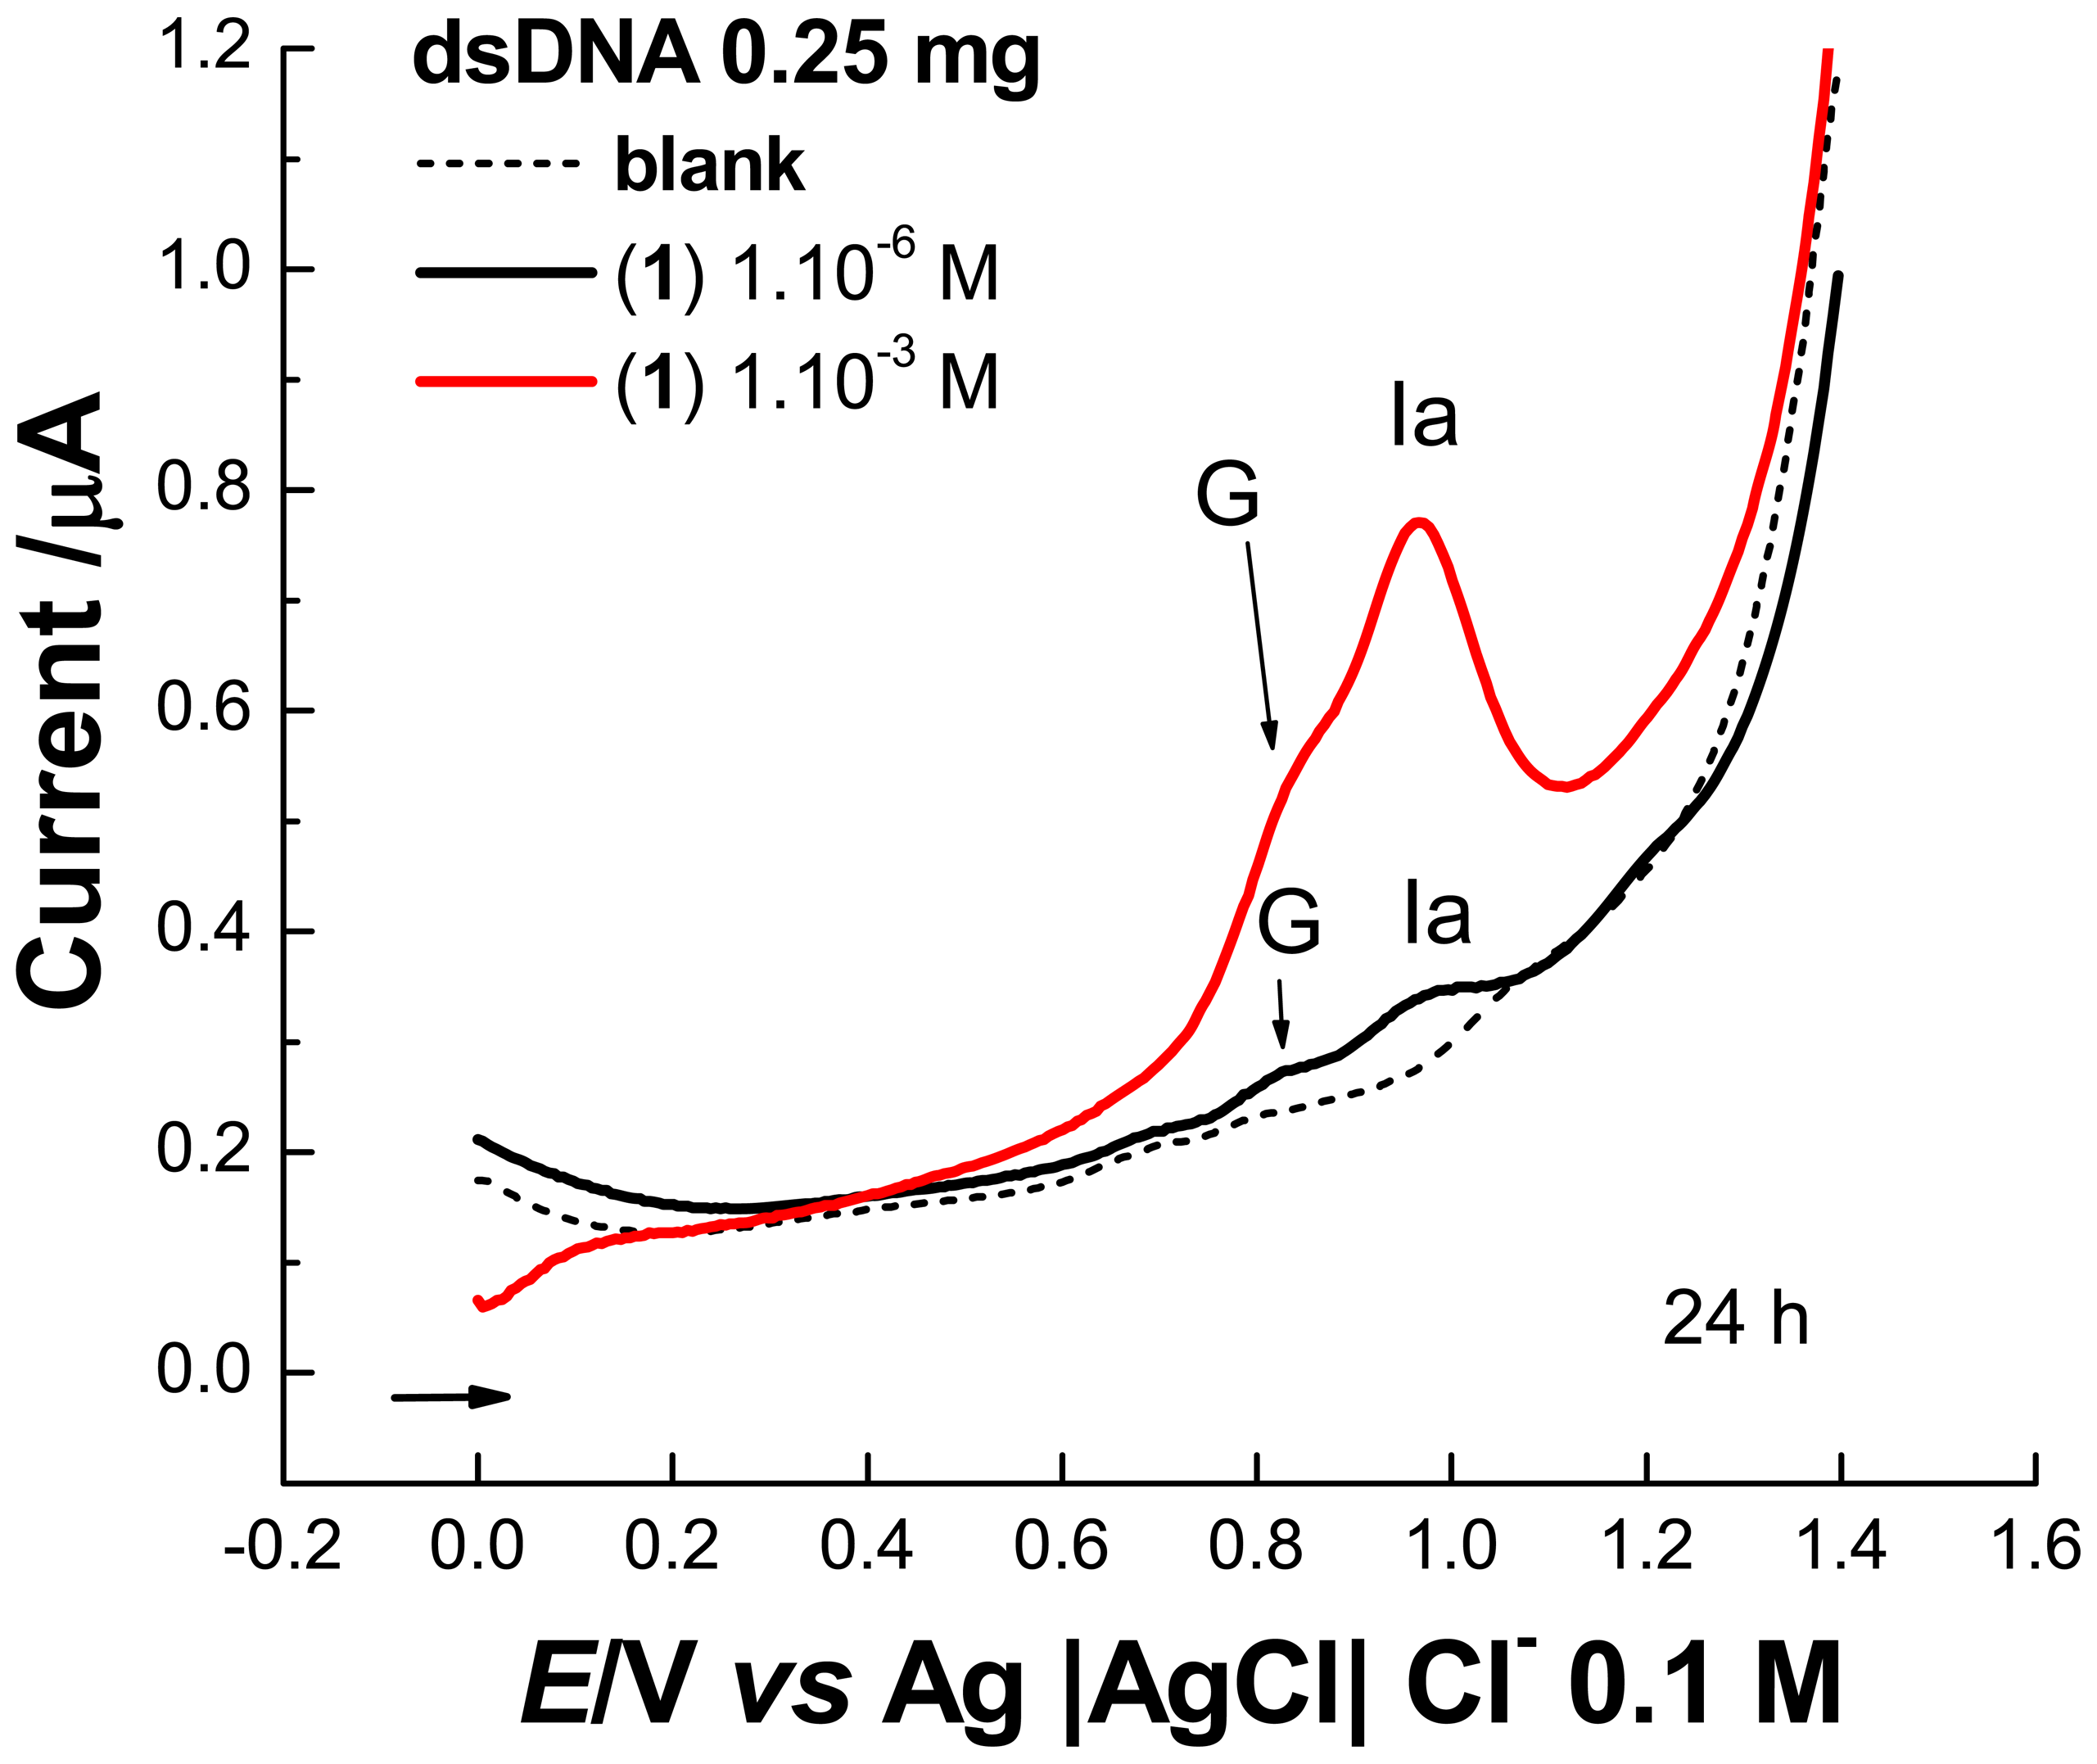
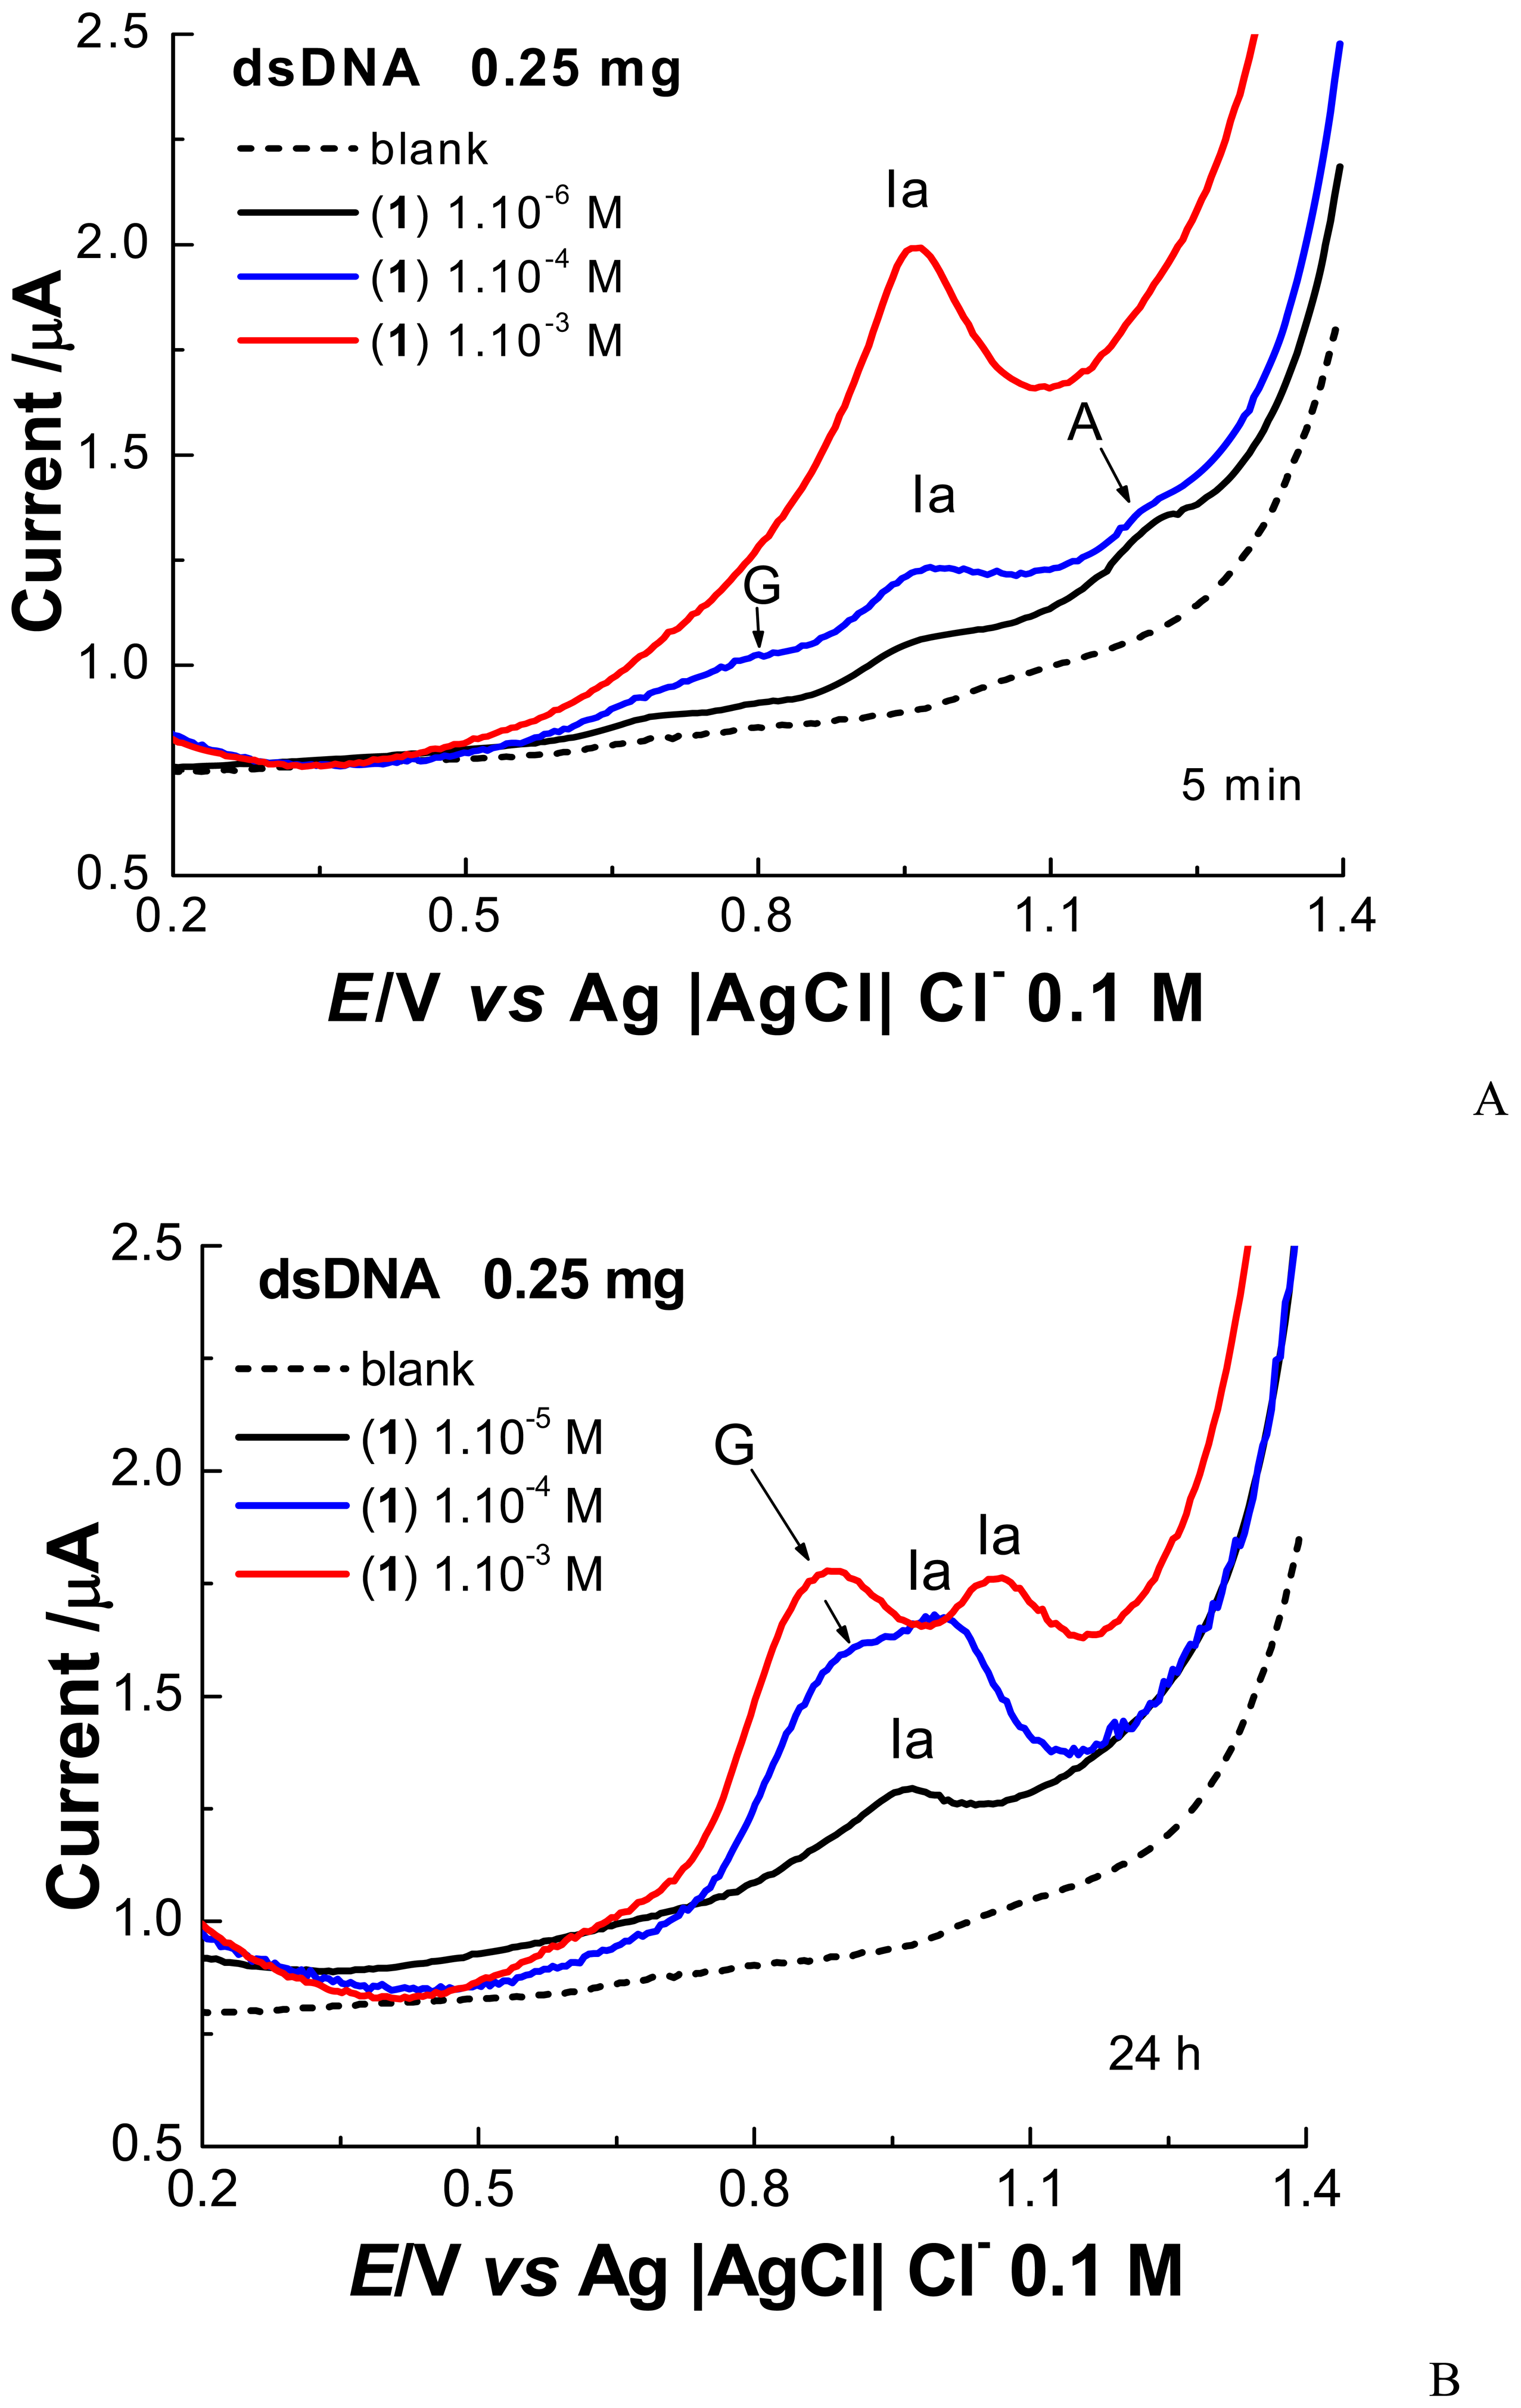
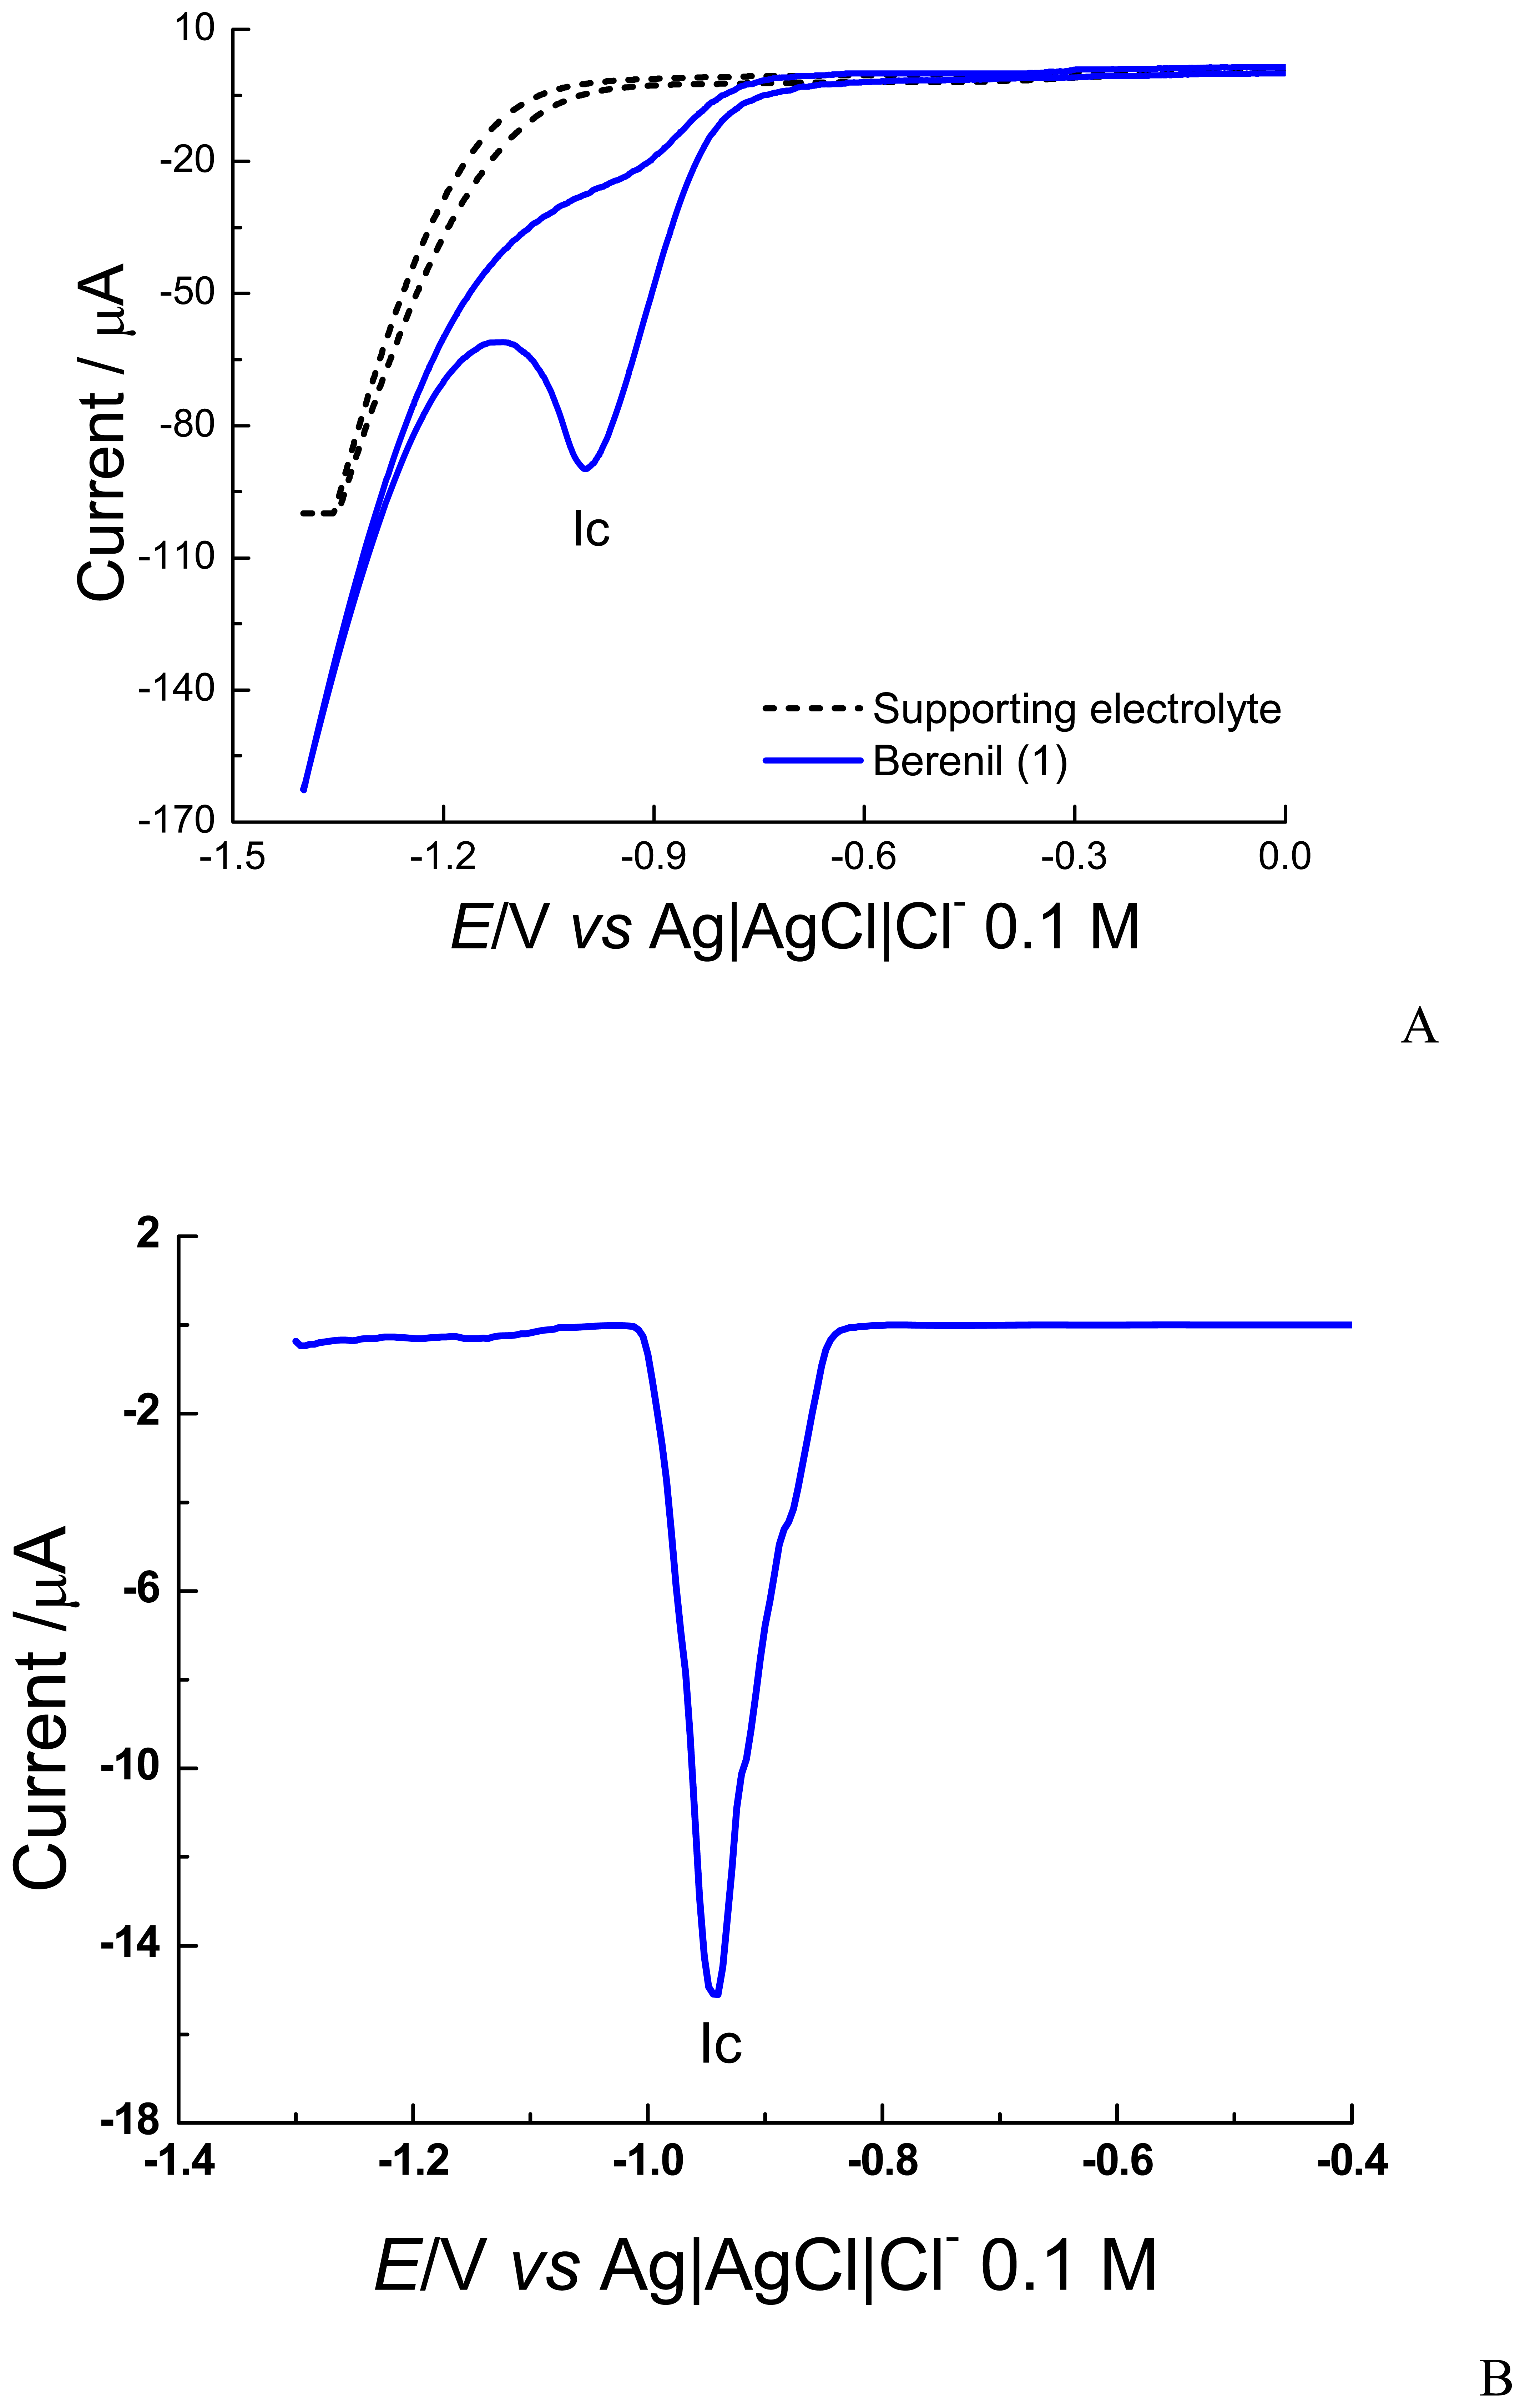
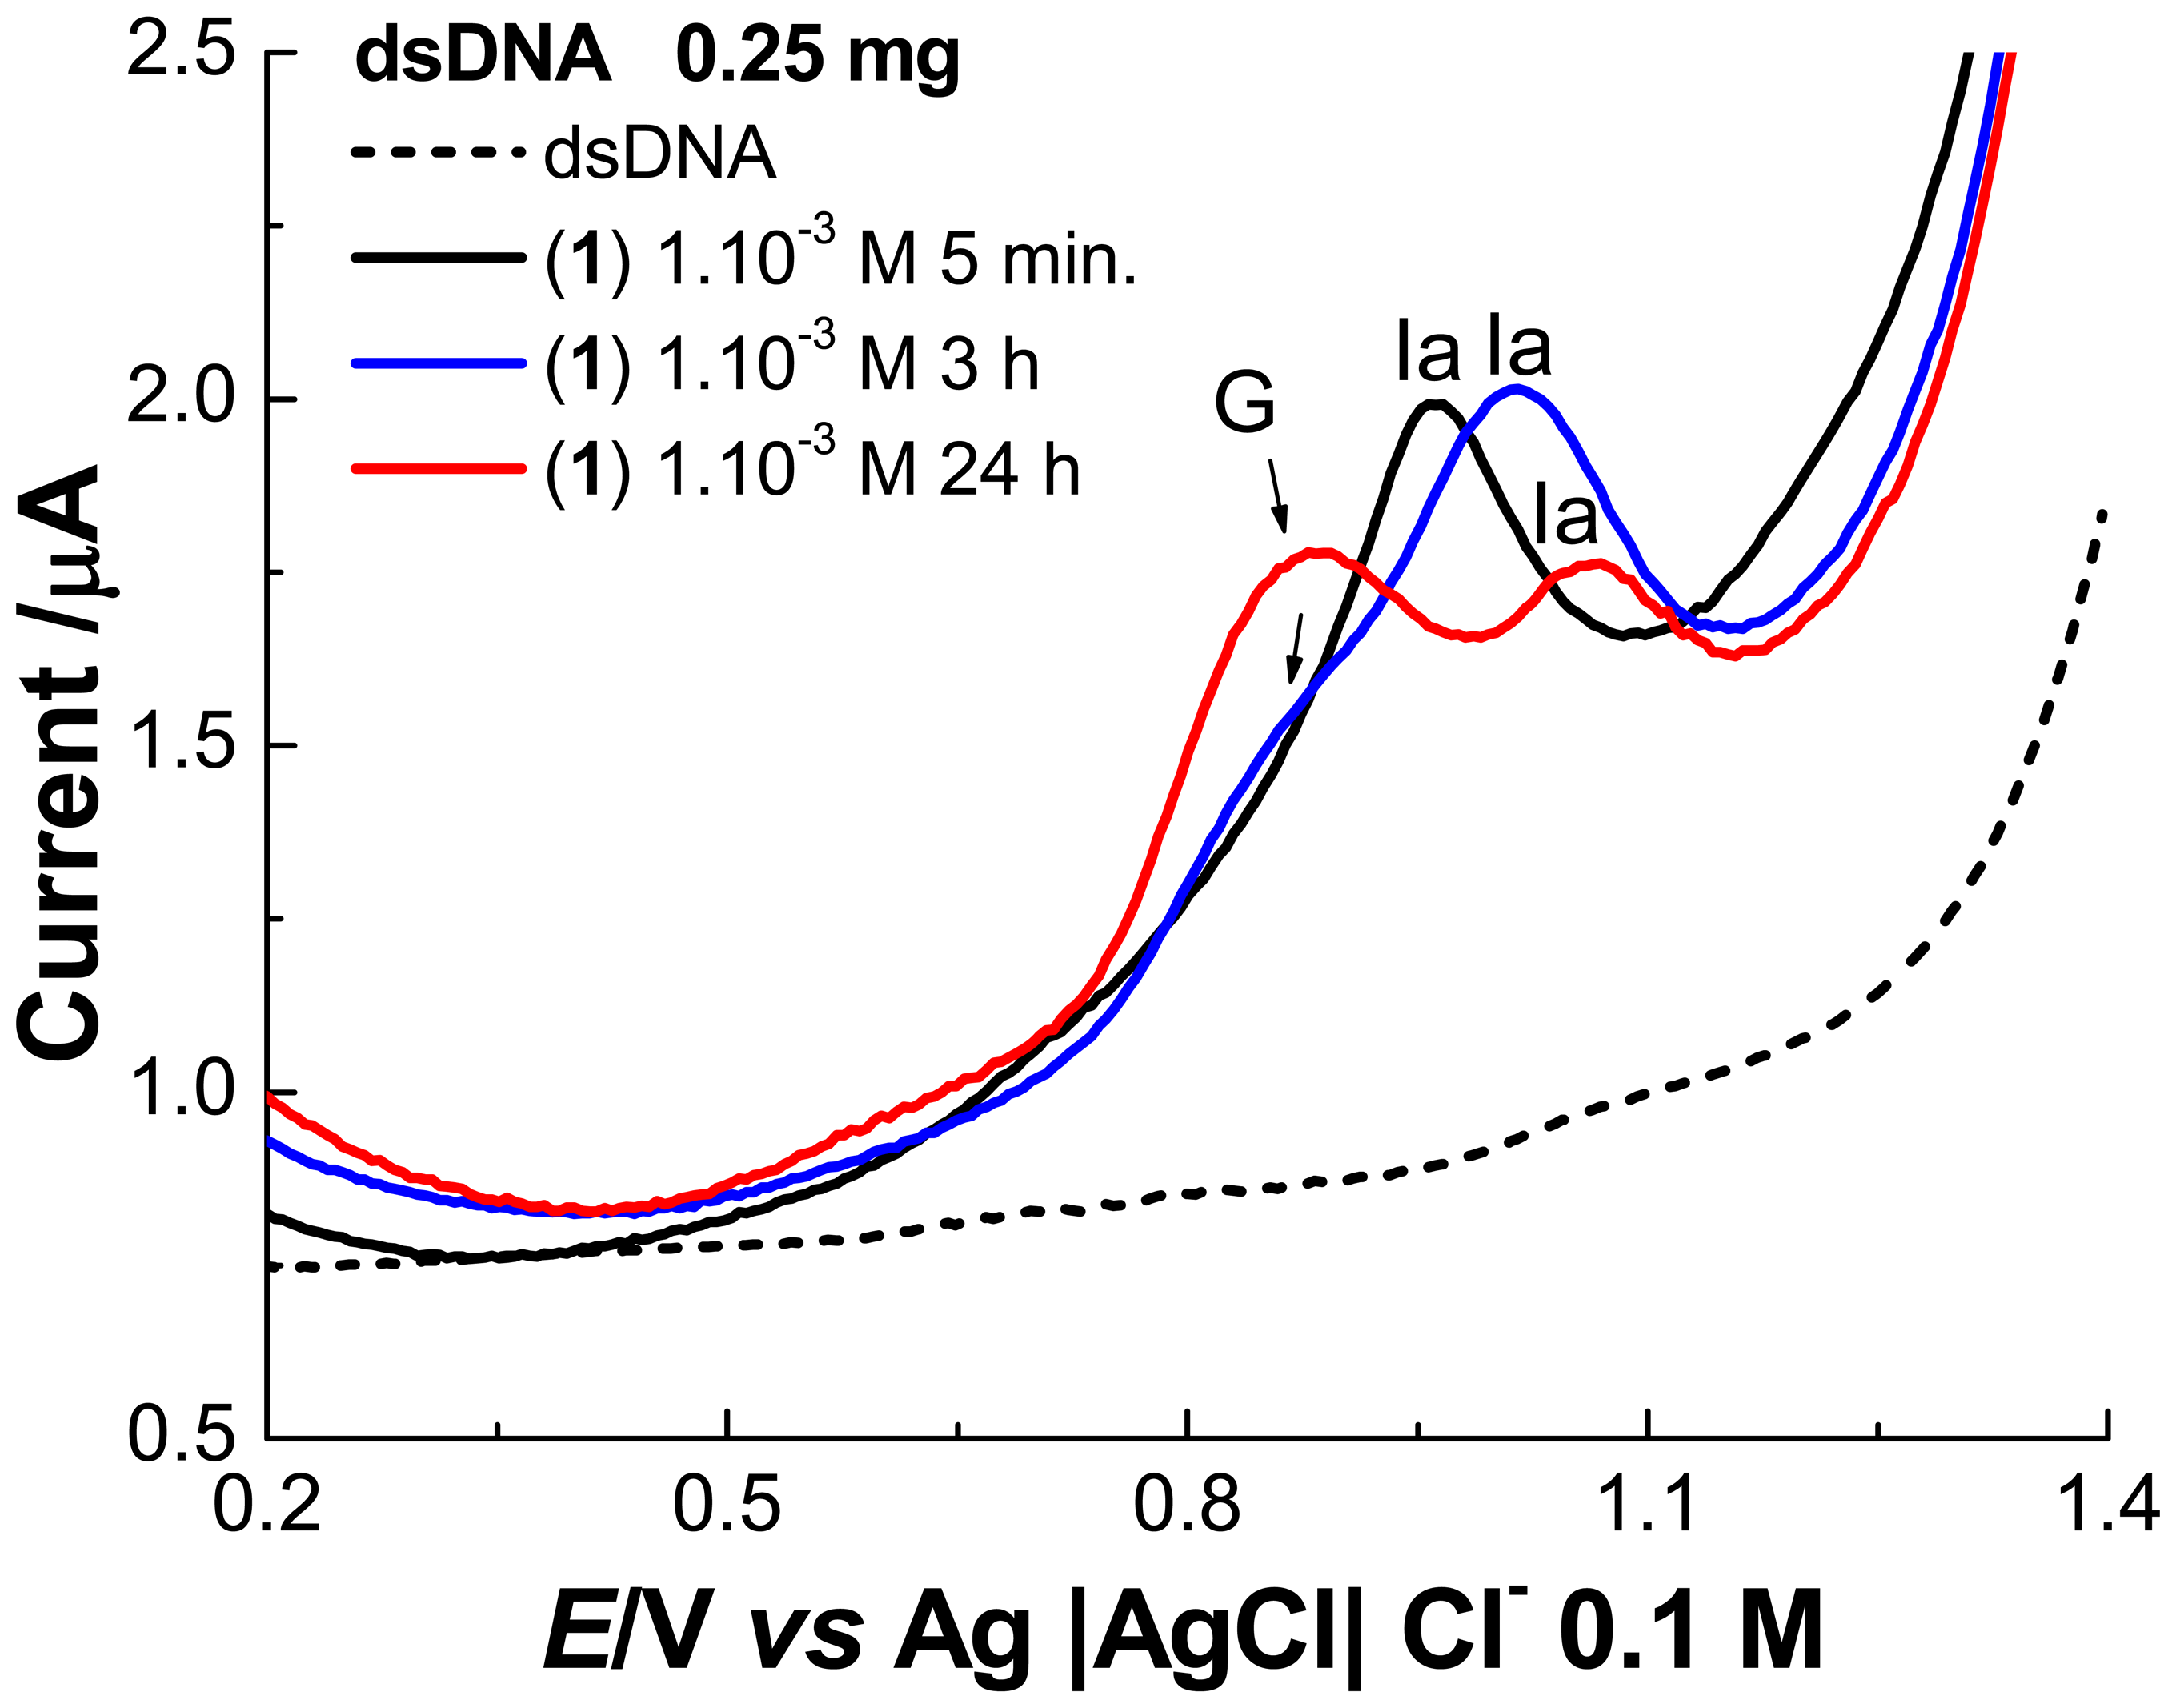
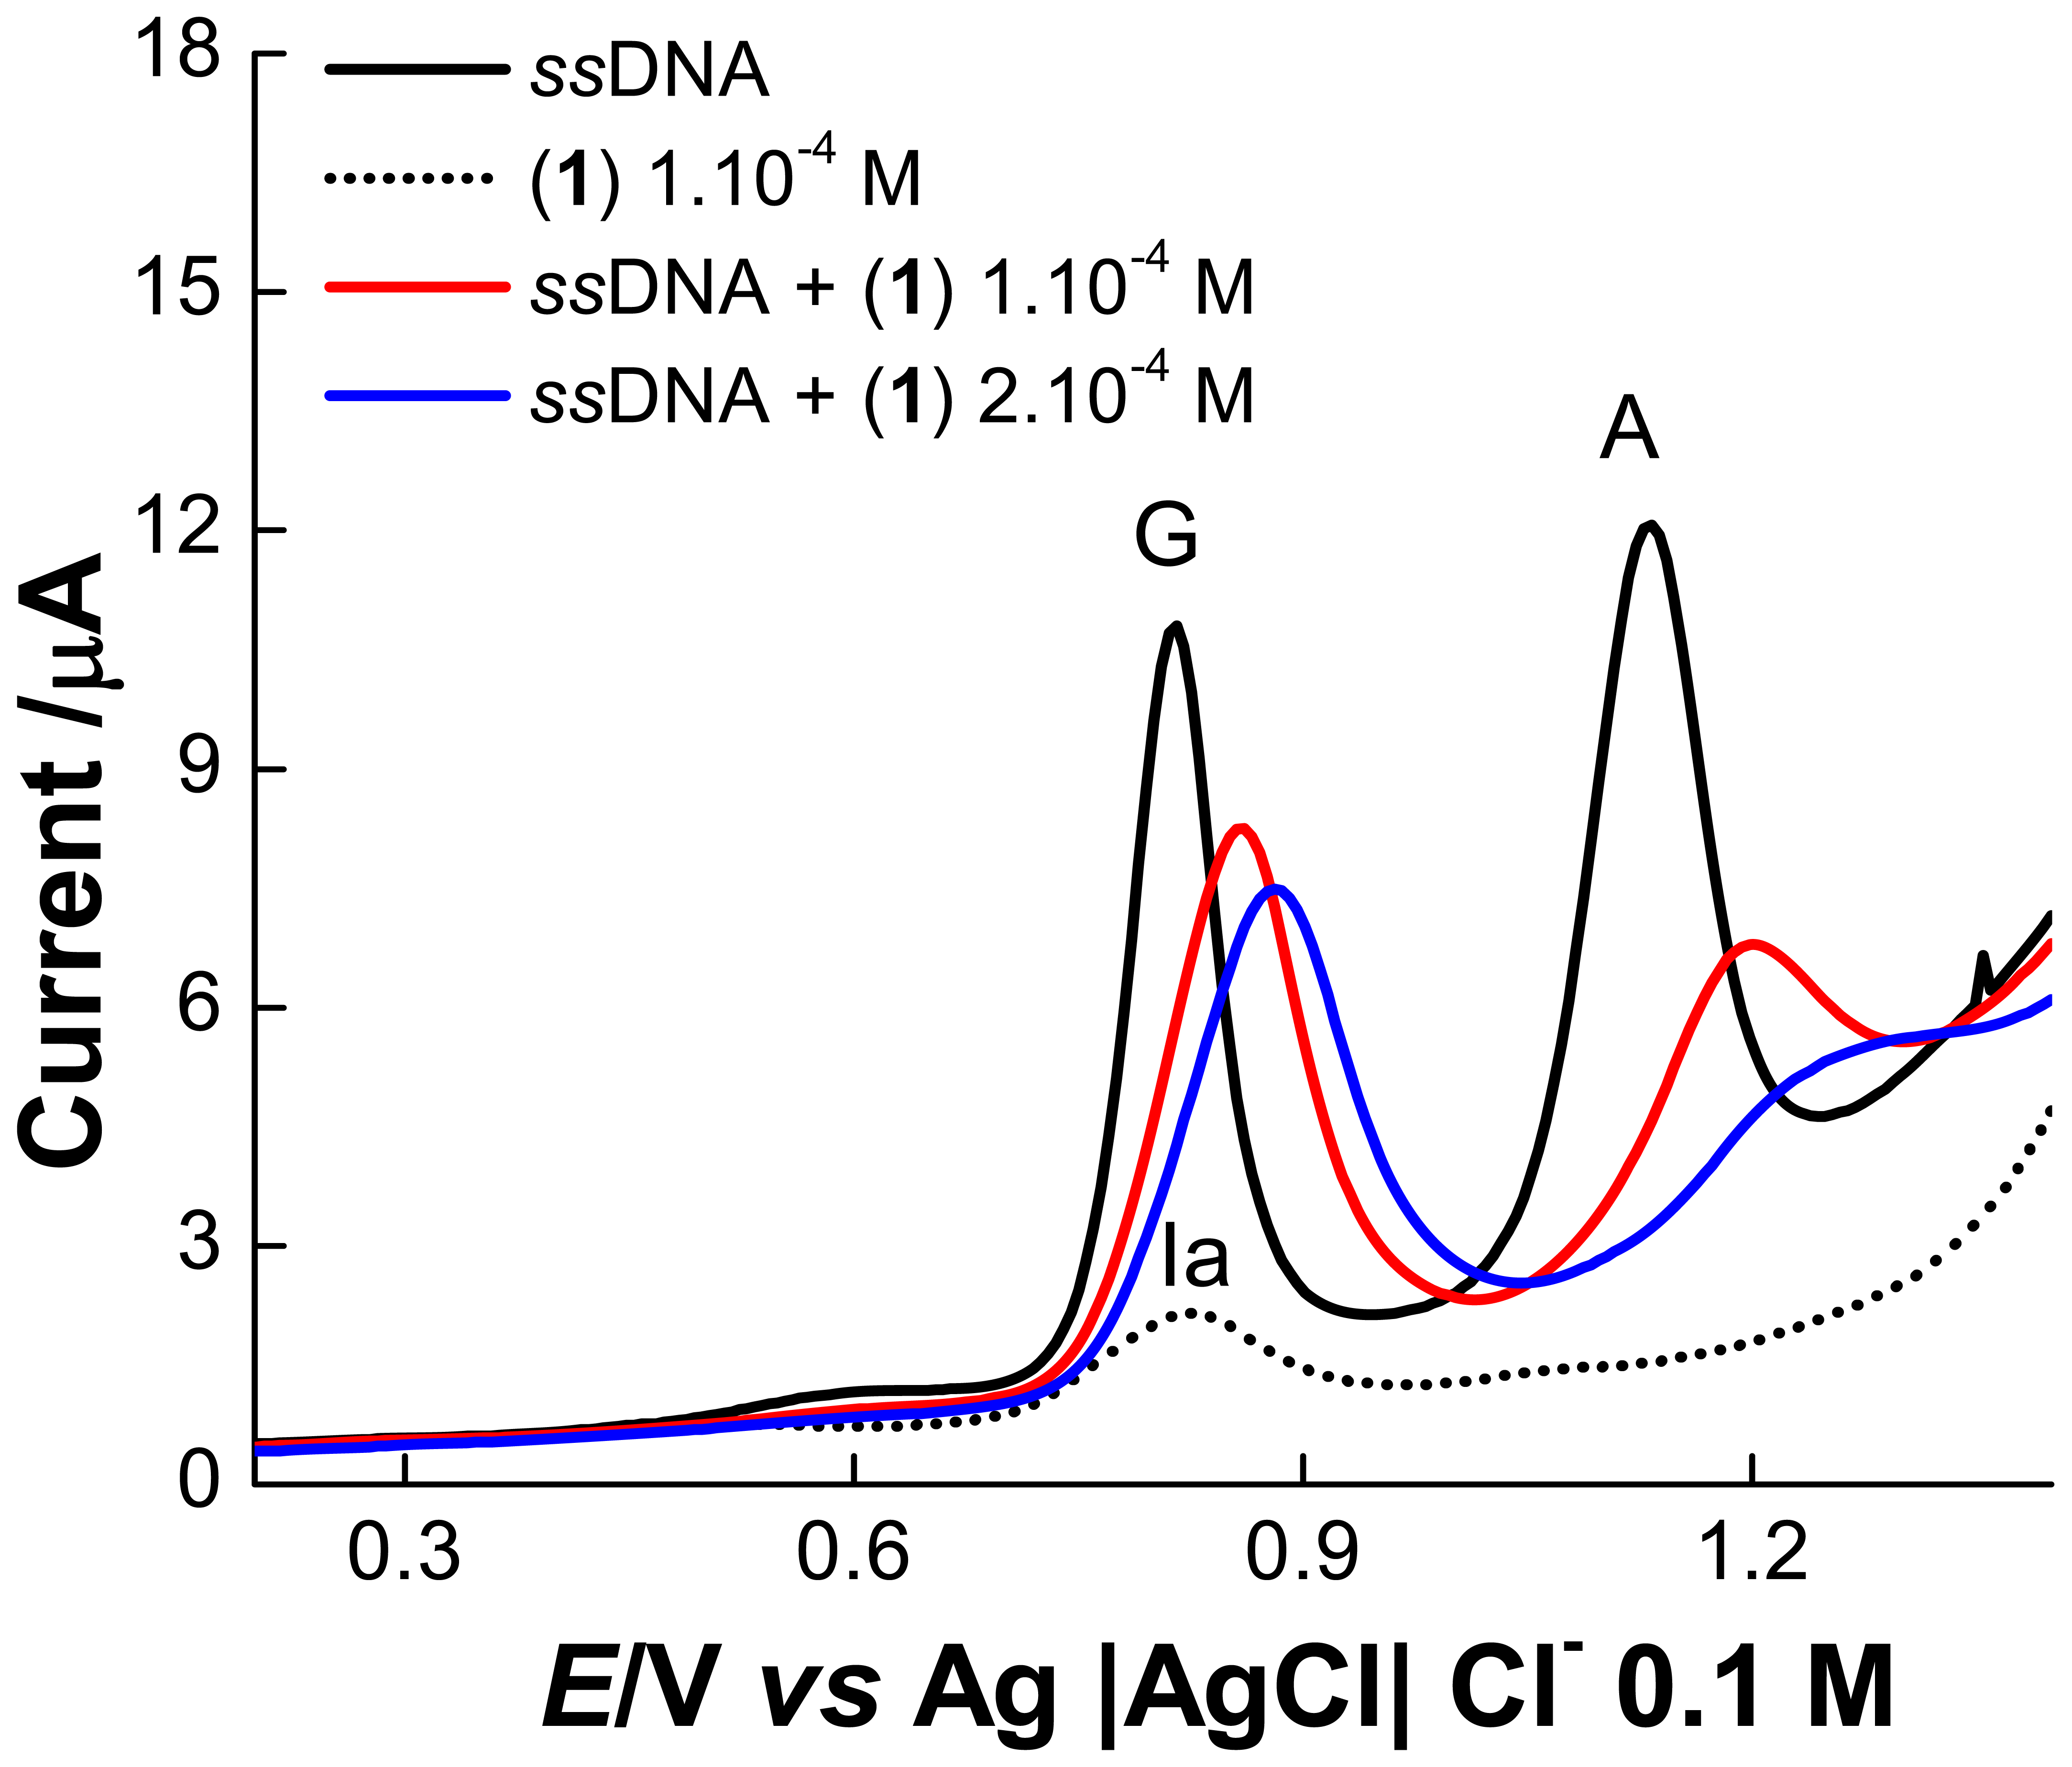
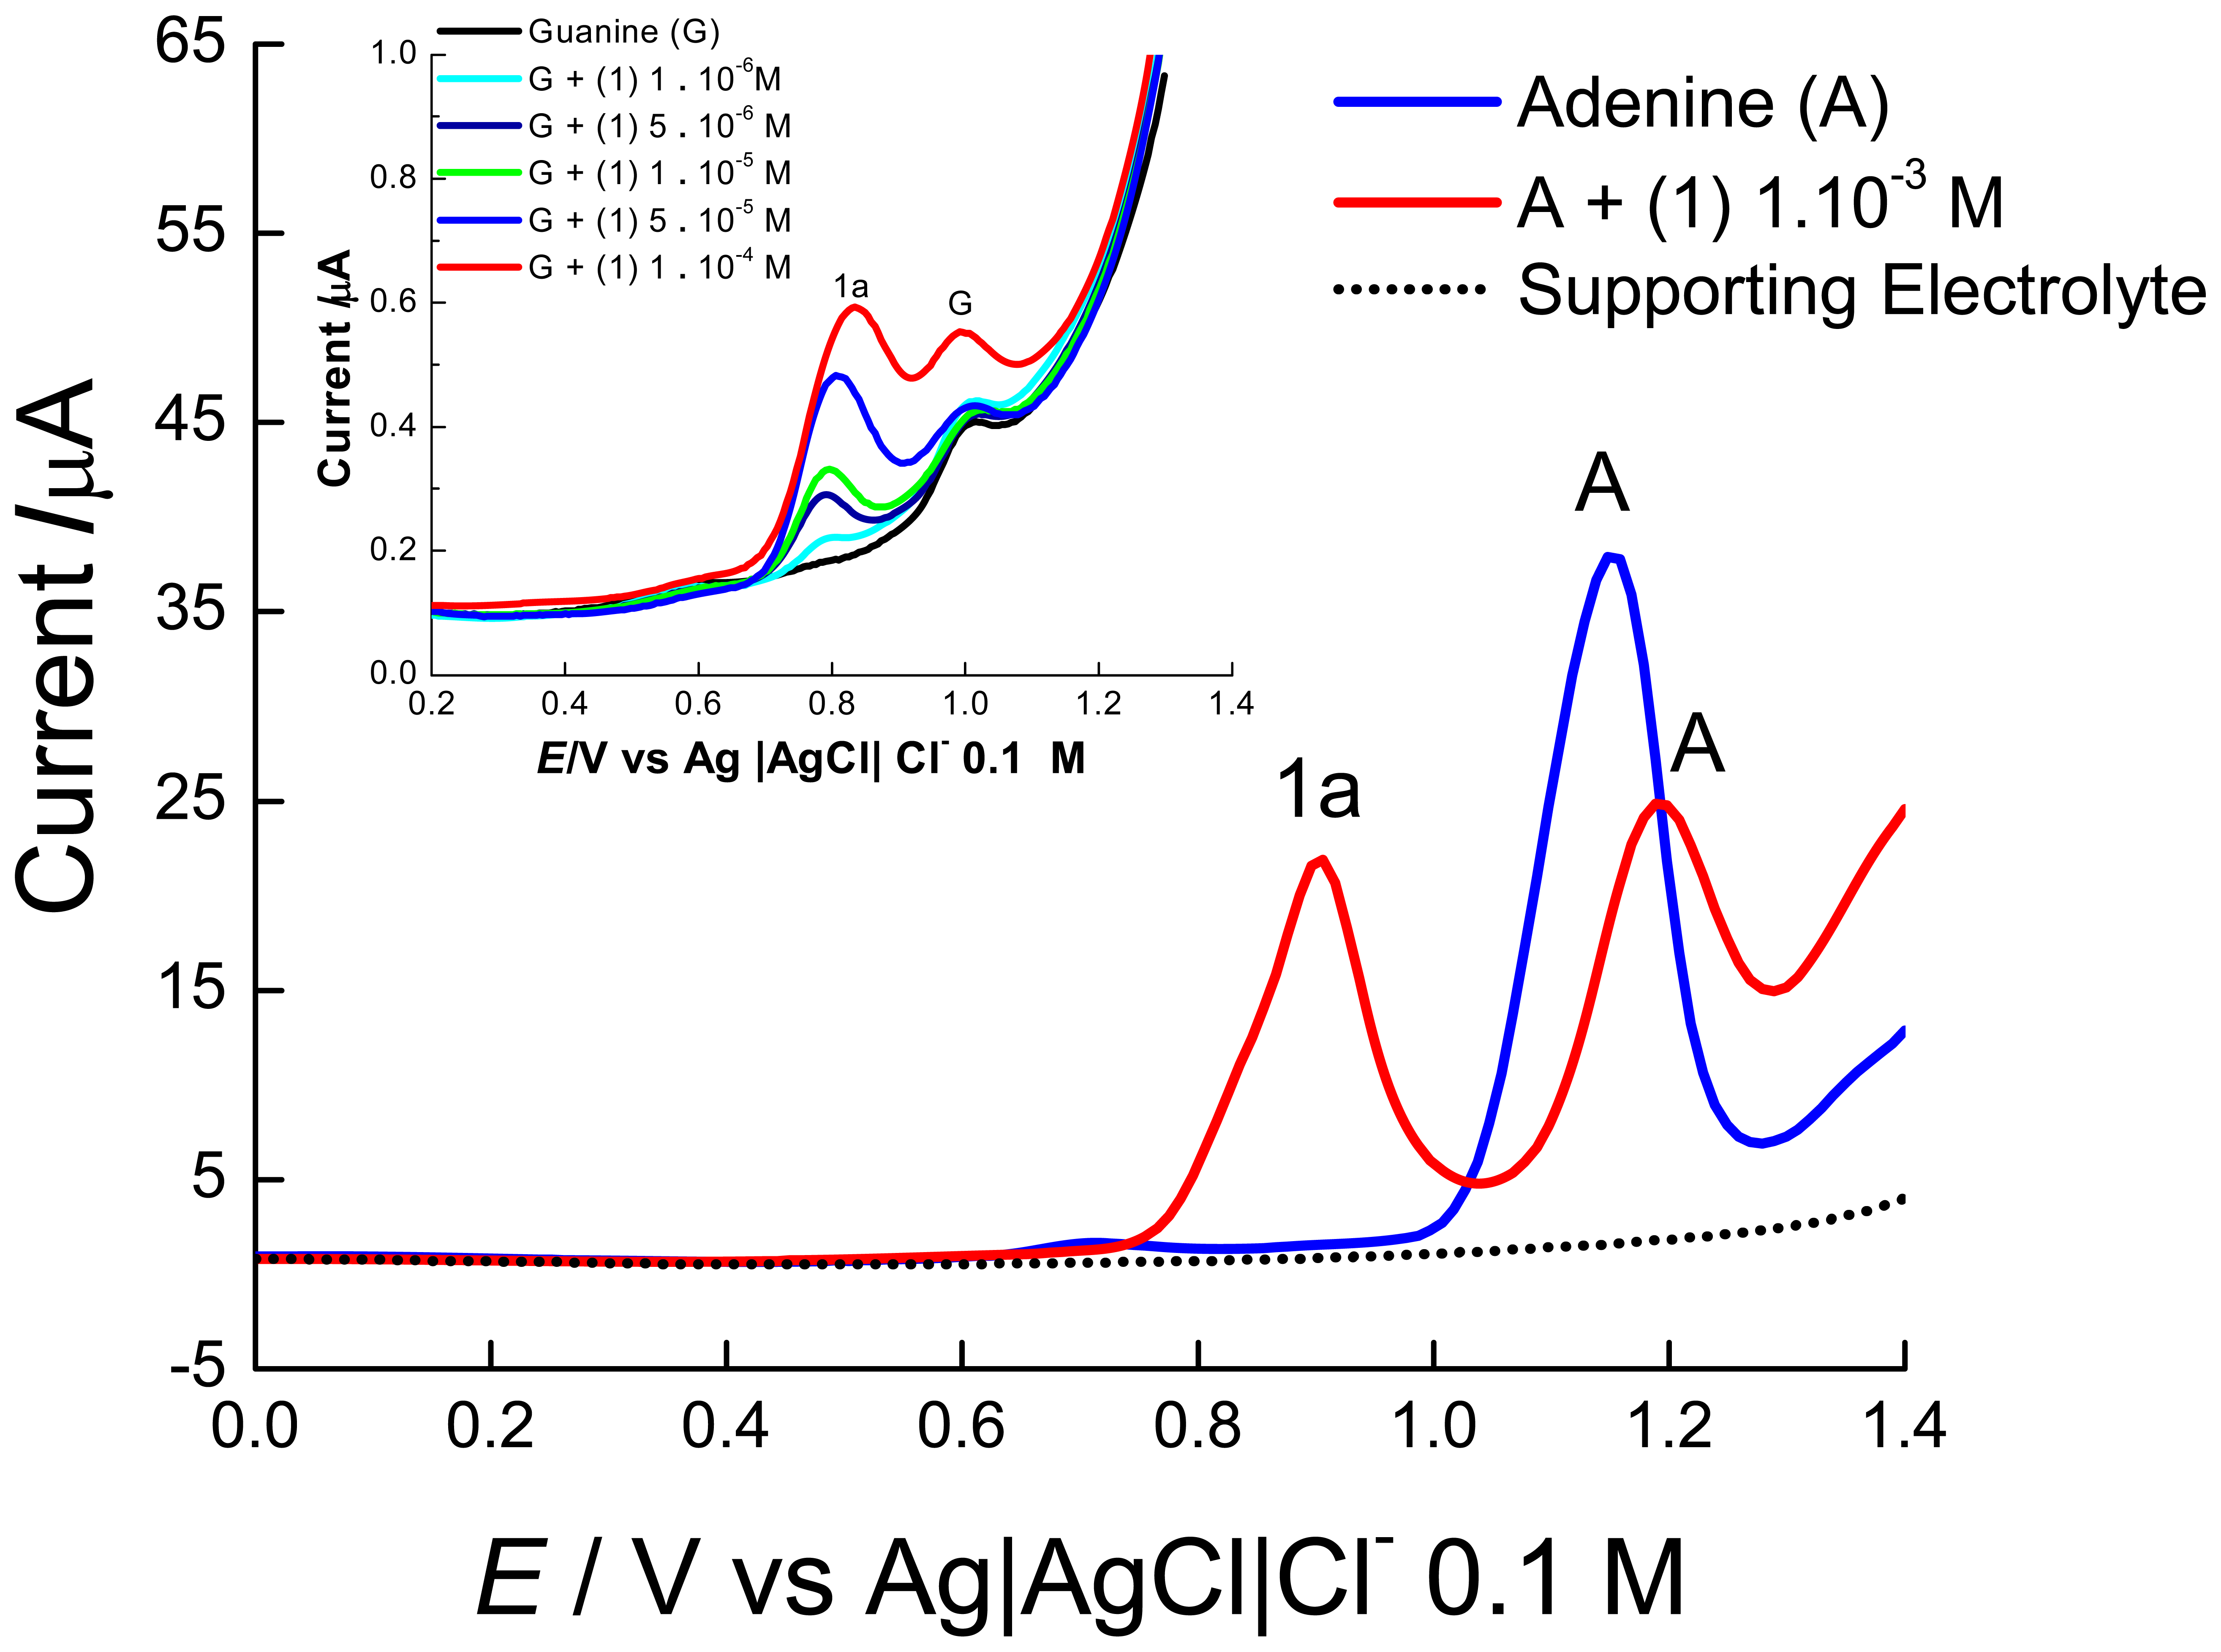
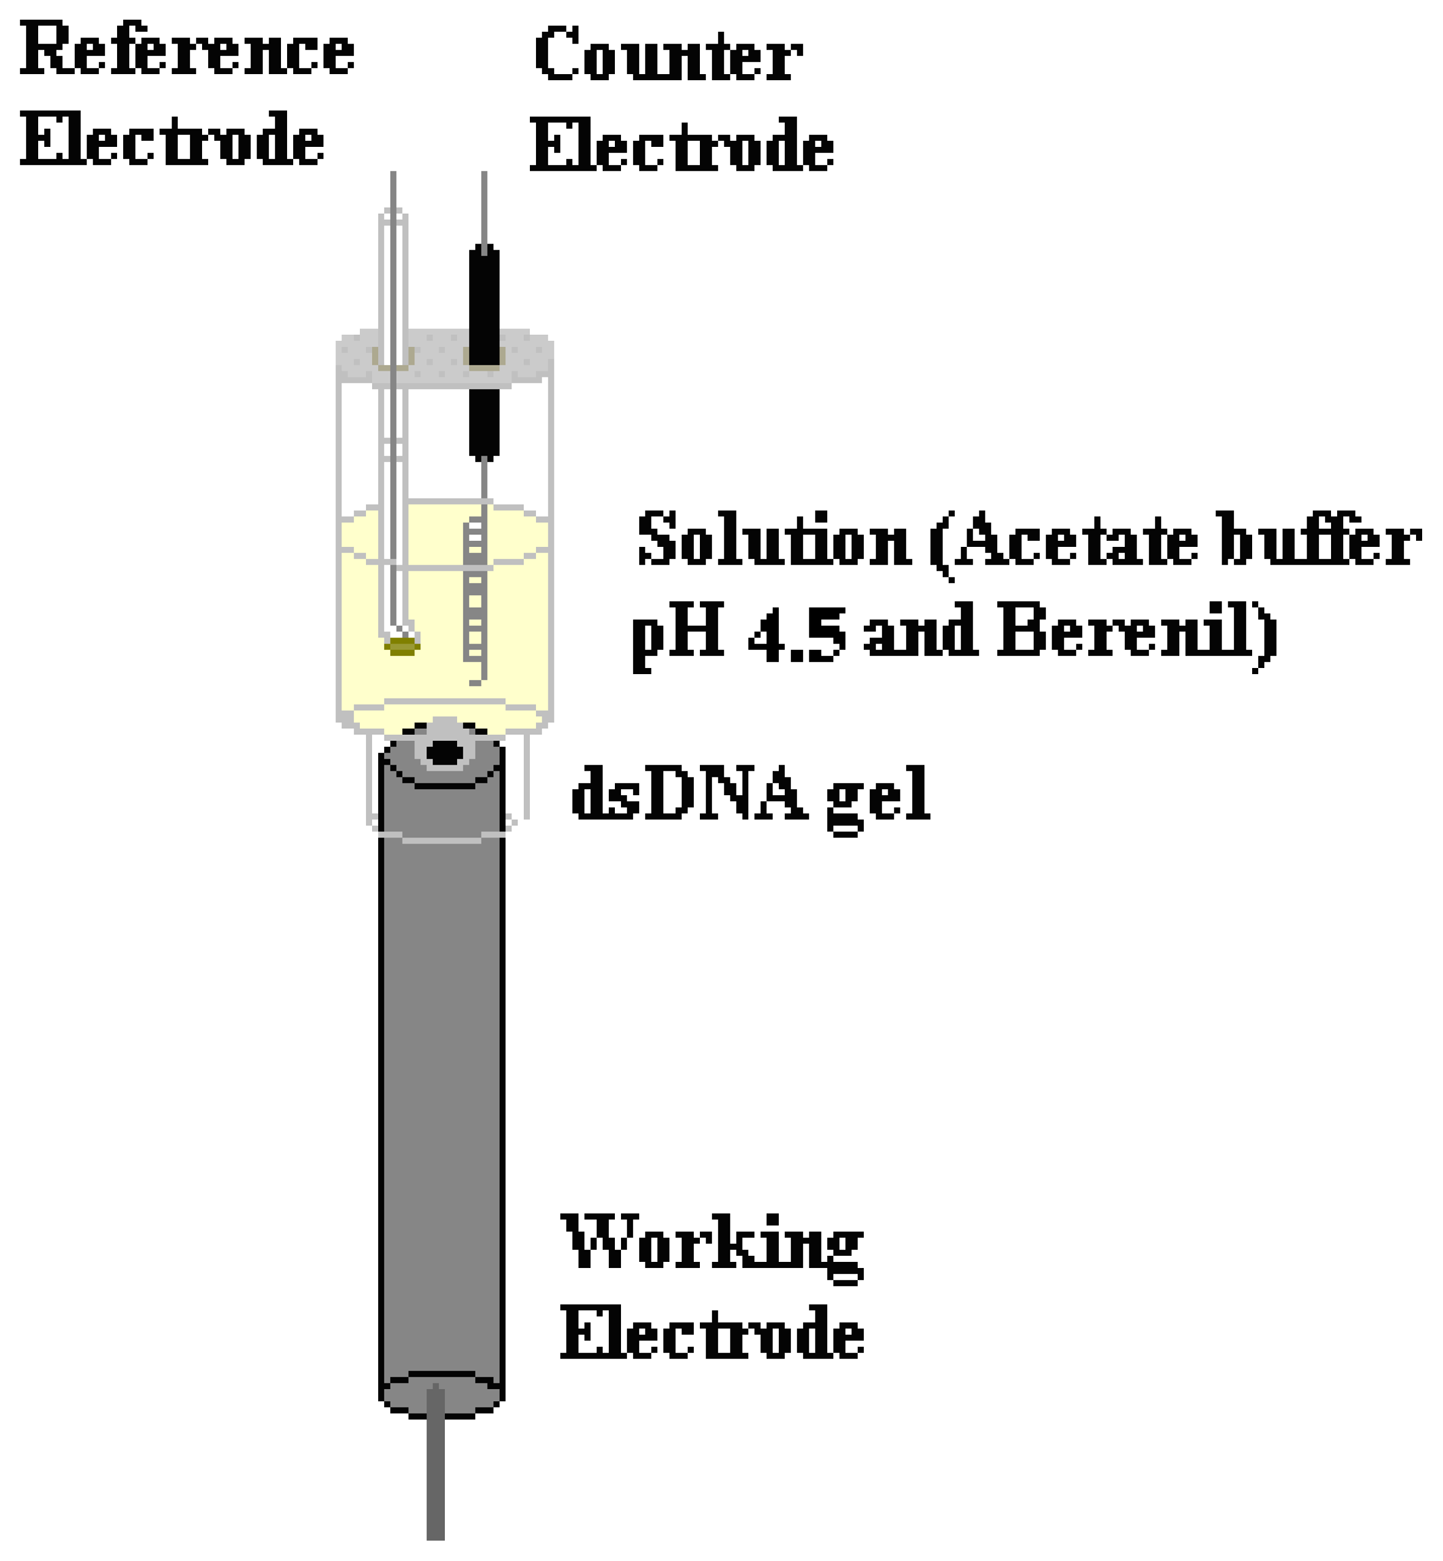
2.1 Electrochemical experiments

In all of the experiments reported, the results obtained with electrodes in the presence of berenil (1) were compared with those obtained with reference blank electrodes operated under the same conditions.
The reduction of 1 on a glassy carbon (GC) electrode in aqueous acetate buffer (0.2 M; pH 4.5) was examined by cyclic voltammetry (CV), which showed a unique 2e/2H+ irreversible reduction with an EpIc of -0.996 V at 0.100 V s−1 (Figure 1A). The differential pulse voltammogram (DPV) of 1 was also performed, and revealed a peak at -0.945 V (Figure 1B). Comparable results have been reported for the CV of 1 recorded using a mercury electrode [31]. The mechanism of reduction of 1 on GC and mercury electrodes appears similar and is related to electron uptake by the triazene function.
In CV performed on a GC electrode, the oxidation of 1 was represented in the anodic sweep by a well-defined, diffusion-controlled and irreversible (absence of the reducing counterpart; EpIa shifts with scan rate) peak Ia located at an EpIa of +0.942 V (Figure 2). The triazene moiety would be the most likely organic function for oxidation in 1. In fact, the oxidation of triazenes has been previously reported but only in aprotic medium, under which conditions cation radicals are formed that cleave to generate diazonium ions [32]. The coulometry of the oxidation of 1 performed at an Eapp of +1.10 V, led to the consumption of 2 mol electron/mol.
The analysis of the interaction between 1 and dsDNA was conducted using thick film dsDNA-biosensors in which the undesired binding of drug molecules to the electrode surface was avoided by virtue of the complete coverage of the electrode surface by DNA [12]. Figure 3 shows the effect of different concentrations of 1 determined 24 h after the additive had been coated onto the dsDNA-GC electrode. Slight evidence of DNA damage was observed at low concentrations (1 μM; cf. Figure 3). However, when 1 was present at a concentration of 1 mM, a large peak (Ia, EpIa = +0.968 V) associated with the oxidation of 1 was observed which, together with an additional shoulder at an Epa around +0.84 V (arrow in Figure 3) related to the oxidation of guanine, was indicative of DNA damage.
Figure 4 displays the interactions between the dsDNA-GC electrode and solutions of 1 of different concentrations in acetate buffer. After a contact time of 5 min (Figure 4A), the peak related to the oxidation of 1 was clearly observable and concentration-dependent. However, at large concentrations (1 mM) of additive, peak Ia obscured the signals of the bases and no information concerning DNA damage could be obtained. After 24 h of exposure of the dsDNA-GC electrode to low concentrations (10 μM) of 1, only one anodic peak (Ia) was evident and no evidence of DNA damage could be observed (Figure 4B). As the concentration of 1 was increased, however, its associated oxidation peak Ia was subjected to anodic shifts and increased in amplitude. When 1 reached a concentration of 100 μM, a shoulder was observed at an Epa of +0.863 V (arrow in Figure 4B), which was related to the oxidation of guanine and thus indicative of DNA damage. In the presence of 1 mM berenil, the diagnostic peak of guanine oxidation increased in amplitude and was clearly resolved from peak Ia.
Figure 5 presents the interaction between the dsDNA-GC electrode and a 1 mM solution of 1 in acetate buffer as a function of time (5 min – 24 h). The presence of the guanine oxidation peak became more evident with increased exposure time indicating that DNA damage was a time limited process. Moreover, concomitant with the increase in the guanine oxidation peak, the oxidation potential of 1 inside the dsDNA gel shifted to more positive values compared with 1 on a GC electrode. The current intensity of the berenil oxidation peak Ia was almost constant between 5 min and 3 h, whereupon it decreased sharply as the exposure time reached 24 h.
The results obtained indicate that the binding between 1 and dsDNA involves mixed mechanisms. Thus, at low concentrations and short contact times, 1 interacts with the minor groove of dsDNA but does not perturb the duplex structure to any large extent. As the concentration of 1 increases, however, the conformation of dsDNA is altered, probably through intercalation, such that the bases are exposed and become accessible for oxidation. The anodic potential shift of peak Ia, indicative of a more difficult electron capture, could be related to the repulsion between the positive charge of 1 and the oxidation product of the bases.
The interactions between 1 and ssDNA in solution are depicted in Figure 6. Signals associated with the oxidation of the bases guanine (G) and adenine (A) in ssDNA are very intense, but in the presence of 1, the current intensity of the oxidation peaks decreases in a concentration-dependent manner.
In comparison with guanine, the larger variation of the adenine current peak suggests that this base is the preferential binding site of 1 [22-30]. This hypothesis is supported by the results derived from a DPV study of solutions of polyA and polyG in the absence and presence of 1. Following digestion in hydrochloric acid, polyA showed one oxidation peak (Epa = +1.15 V), which is characteristic of the oxidation of adenine base (Fig. 7). In the presence of 1, this peak shifted towards a more positive potential (Epa= +1.19 V) and the current peak decreased by 50% indicating interaction between substrates. In contrast, guanine oxidation remained substantially unaltered in the presence of 1, whilst the amplitude of the berenil oxidation peak Ia was directly proportional to the concentration of 1 (Figure 7 inset).

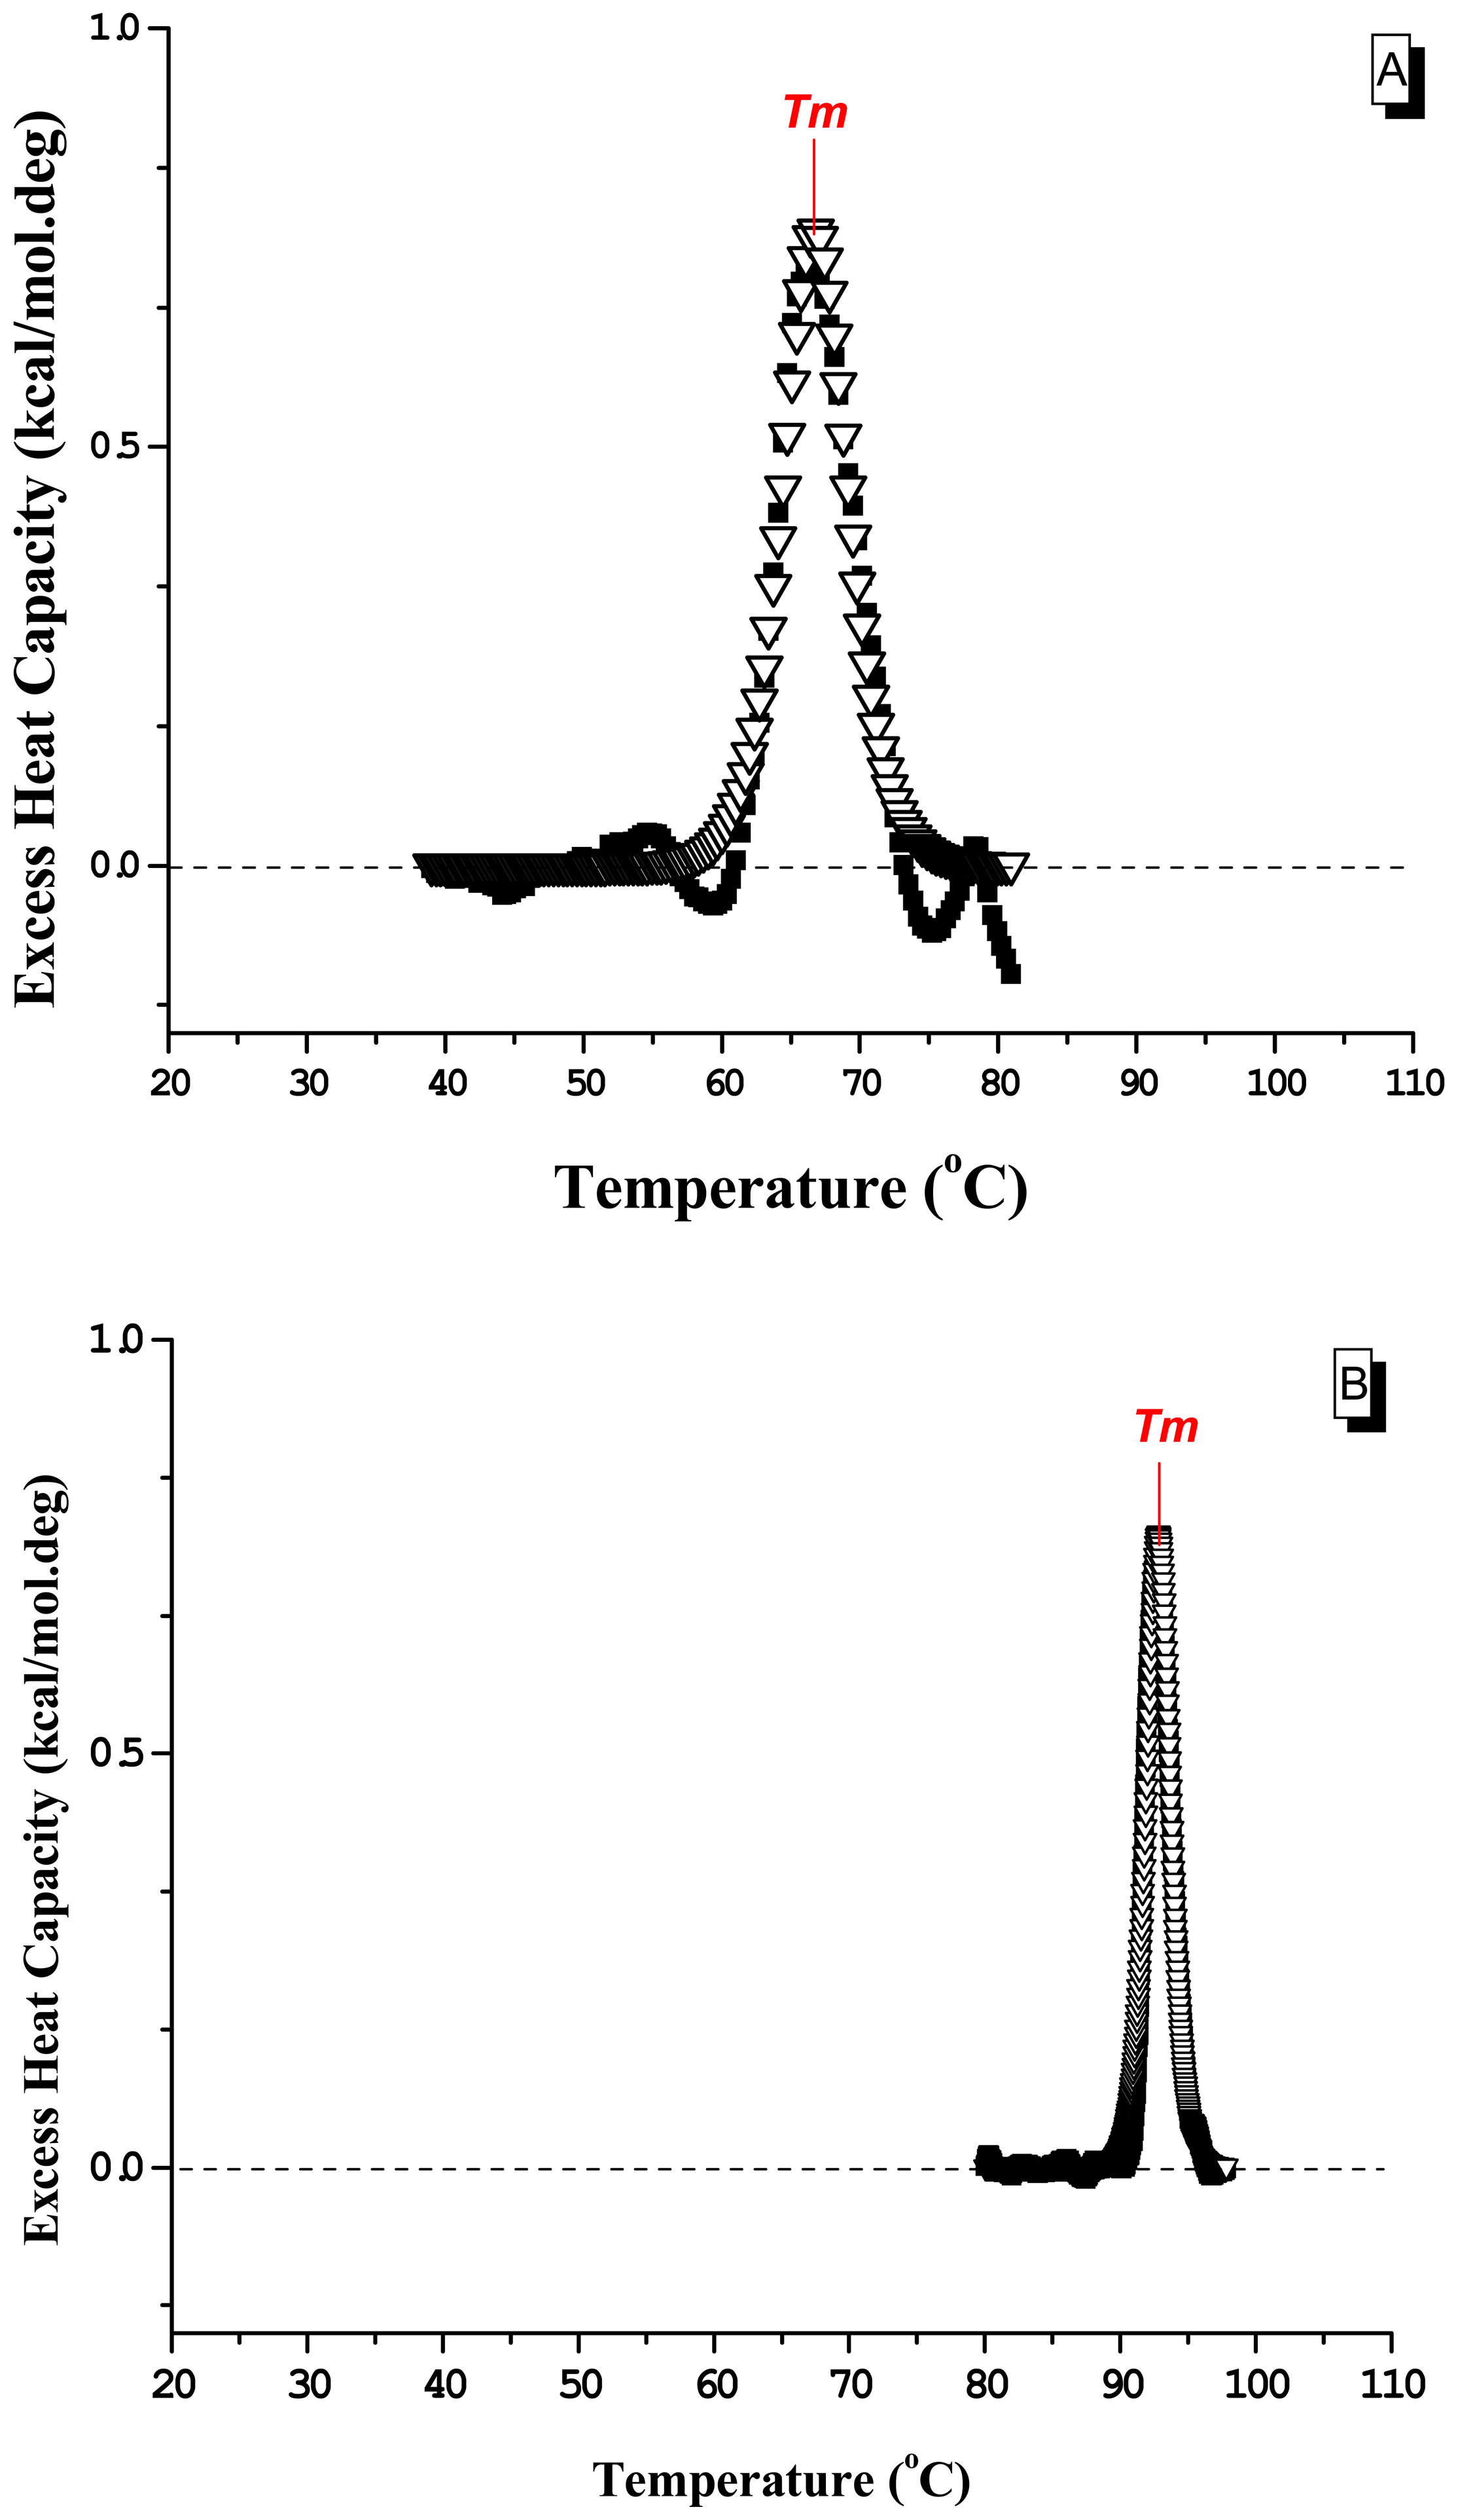
2.2 Differential Scanning Calorimetry

Thermographic profiles (determined in 10 mM sodium cacodylate) for denaturation of calf thymus DNA in the absence and presence of saturating amounts of 1 are shown in Figure 8, and the parameters derived therefrom are presented in Table 1. The melting transitions of dsDNA and of the DNA-berenil complex occurred at the temperatures expected, considering the ionic strength employed in the experiment, they were sharp in spite of the heterogeneous base composition of the dsDNA fragments. Neither of the transitions exhibited reversibility during a second consecutive run. The observed increase in Tm of about 32°C for the DNA-berenil complex compared with free dsDNA reflects an increase in the thermal stability of dsDNA in solutions containing 1, and implies a strong interaction between the additive and DNA. It is likely that berenil binds to DNA in its folded state leading to alterations in the tertiary structure of the polymer that generates a more rigid conformation with increased nucleic acid thermal stability [33].
Denaturation is a highly cooperative process in which the conformational state of one base pair exerts an influence on neighbouring nucleotide pairs [34]. From a qualitative viewpoint, it is observed that the cooperativity of thermal denaturation is a function of the steepness in the endothermic portion of the denaturation curve. As observed from Figure 8, the thermal transition of the DNA-berenil complex exhibits better cooperativity than the curve for free DNA. Calculation of Relative Cooperative Index (RCI) values for the transitions of free dsDNA and the DNA-berenil complex (Table 1) revealed that the thermal transition of the latter is 3.4-fold sharper than that of free dsDNA. This finding is confirmed by the ηmelt values, which show that the DNA-berenil complex comprises around 8.1-fold more base pairs in the cooperative unit than free dsDNA. The high ηmelt value of the DNA-berenil complex accounts for the smaller ΔHcal value compared to free dsDNA, since a larger cooperative melting unit per molecule would result in less energy being required for denaturation.
Comparison of van't Hoff and calorimetric enthalpies of transition can provide a deeper insight into the nature of the transition. If ΔHvH is equal to the directly measured ΔHcal, then the transition occurs in an “all-or-none” manner. On the other hand, if “intermediate states” are recurrent then ΔHvH < ΔHcal[35], whilst ΔHvH may be > ΔHcal. if intermolecular effects (e.g., aggregation) are operative [36]. In the present study, the values ΔHvH > ΔHcal for both the free DNA and the complex. This, together with high average number of base pairs in the cooperative melting unit, could explain the smaller value of ΔHcal of the DNA-berenil complex compared with free DNA. However, Tm is less affected by intermolecular effects and, as such, Tm was the major thermodynamic factor contributing to the DSC experiments.
Table 1 shows that ΔSTm of the DNA-berenil complex is about 2.9-fold lower than that of free DNA, indicating that the complex system is better structured. In some cases an increase in ΔS(Tm), arising from the displacement of counter-ions, favours association. Since the observed entropic term for the DNA-berenil complex is smaller than that of free DNA, it is clear that the binding of 1 to DNA is not solely determined by ionic strength. This result suggests that 1 binds to calf thymus DNA by intercalation between base pairs rather than by electrostatic interaction with phosphate residues at the minor groove.

3. Conclusions

The electrochemical voltammetric sensing of oxidative damage to dsDNA caused by berenil was achieved by monitoring the appearance of a peak diagnostic of guanine (G) oxidation. When 1 was incorporated with dsDNA directly on the surface of the biosensor, interaction with and damage to DNA was detectable at concentrations of 1 as low as 10 μM. The method was less sensitive, however, when the dsDNA-GC biosensor was placed in a solution of 1, and in this case diagnostic peaks became detectable only at additive concentrations of 100 μM, but readily discernible at 1 mM. The damage caused to DNA by 1 was both concentration- and time-dependent, but the process was slow and a minimum contact interval of 3 h was required. The interaction of 1 with dsDNA modified at the electrode surface did not differ from that occurring in solution. It is therefore possible that a similar interaction between 1 and dsDNA may take place in vivo.
Previously, the interaction between 1 and DNA has been monitored through the use of a variety of techniques including spectroscopy, calorimetry, and viscometry. Such studies have suggested that 1 can bind to dsDNA through both intercalative and minor groove binding modes [26, 37-40], and that intercalation is directly dependent on the concentration of the additive. The results obtained in the present study using both DNA-biosensors and DSC methods under saturating amounts of 1 agree very well with previous observations. It is suggested, therefore, that the electrochemical approach can be applied as a complement to more commonly-used methods and that it offers the distinct advantages for being simple, easily performed and inexpensive. Moreover, the interaction between 1 and dsDNA at a charged interface probably affords a more realistic model for the in vivo interaction, where it is expected that DNA would be in close contact with charged phospholipid membranes and proteins, rather than when the interaction is in solution.

4. Experimental Section

4.1. Materials

Berenil (1; C14H15N7.2C4H7NO3; molecular mass 515.5 g mol−1), polyadenylic acid potassium salt, polyguanylic acid potassium salt and calf thymus dsDNA (sodium salt; type I) were purchased from Sigma (St. Louis, MO, USA). Aqueous acetate buffer solutions (0.2 M; pH 4.5) were used in all of the experiments and were prepared from analytical grade reagents and purified water (conductivity < 0.1 μS cm−1) obtained from a Millipore (Milford, MA, USA) Milli-Q system. A Marconi (Piracicaba, Brazil) pH-meter with a combined glass electrode (model MAPA200; series 0113992) was used to measure buffer pH.

4.2. Electrochemical methods

The electrochemical experiments including cyclic voltammetry (CV), differential pulse voltammetry (DPV) and potential-controlled coulometry were performed using an Autolab (Echo-Chemie, Utrecht, Netherlands) PGSTAT 20. The working electrode was a BAS (Bioanalytical Systems, West. Lafayette, IN, USA) GC electrode of 3 mm diameter, the counter electrode was a platinum coil, and the reference electrode was Ag|AgCl, Cl (0.1 M), and all were contained in a one-compartment electrochemical cell of capacity 10 mL.
For reduction and oxidation studies, CV and DPV of 1 or 2 mM solutions, respectively, of 1 in acetate buffer were performed using a bare GC electrode. For DPV measurements, the pulse amplitude was 50 mV, the pulse width was 70 ms and the scan rate was 5 mV s−1. In the CV experiments, the scan rate was varied from 0.020 to 2 V s−1, whilst the reported parameters were determined at a rate of 0.100 V s−1. It was only necessary to degas the cell with a nitrogen flux for reduction studies. All experiments were performed at room temperature (25 ± 1°C).
The electrolysis of 1 was carried out in a divided Pyrex cell (30 mL) using carbon felt (2.5 x 2.0 x 0.5 cm) as the working electrode, a sintered glass-separated platinum coil as the auxiliary electrode, and Ag|AgCl, Cl (0.1 M) as the reference electrode. A volume (10 mL) of acetate buffer was pre-electrolysed at an Eapp. of +1.20 V, following which 1 (0.0105 g; 2.03 mM) was added and the resulting solution submitted to electrolysis at an Eapp. of +1.10 V until the cell current attained a low value. The progress of the reaction, during the course of which the solution turned deep brown, was followed by monitoring the current decrease of the oxidation peak in the CV. After the consumption of 2.00 mol electron/mol, the oxidation wave of 1 was no longer apparent by CV (data not shown).

4.3. Preparation of the dsDNA-GC biosensor

The electrochemical procedure for the investigation of the berenil-dsDNA interaction involved three steps: preparation of the electrode surface, immobilisation of dsDNA gel and voltammetric transduction. Initially the GC electrode was polished with alumina, using a BAS polishing felt, until the surface exhibited a mirror-like appearance. The electrode was then electrochemically pre-treated with a sequence of 10 cyclic potential scans from 0 to +1.4 V versus Ag|AgCl, Cl- (0.1 M) in acetate buffer [14, 17-18], washed thoroughly with distilled/deionised water, dried and placed in an upright position in the cell (Figure 9). In order to immobilise the dsDNA, the surface of the electrode was coated with 10 μL of calf thymus DNA solution (containing 12.5 mg of dsDNA in 0.5 mL of acetate buffer), the gel was allowed to dry at room temperature under a stream of nitrogen and the biosensor was subsequently immersed in 10 mL of aqueous acetate buffer [18]. The quantity (0.25 mg) of dsDNA employed was estimated to be sufficient to cover the entire surface of the GC electrode [12]. Smaller quantity (0.75 μg dsDNA/biosensor) did not give very distinct features. For each series of experiments, an identical dsDNA-GC electrode was prepared as a reference blank to serve as a control. This electrode was not treated with substrate but received the same pre- and post-treatments as the test electrode.
The procedure employed produced a thick-layer dsDNA-modified electrode. Since a uniform coverage of the electrode surface had been achieved, any new peaks observed in the presence of additive were due solely to analyte interaction with the DNA film without any contribution from the diffusion process in solution.

4.4. Interaction of dsDNA with berenil

Two different protocols were developed in order to study the interaction of 1 with the biosensor. In the first method, the dsDNA-GC surface was dried under a stream of nitrogen, the electrode was coated with 10 μL of a solution of 1 (1, 10, 100 or 1000 μM) in acetate buffer and left for 24 h to allow the gel to dry completely. After this time, 10 mL of acetate buffer was added to the cell and DPV experiments were conducted. In the second method, the acetate buffer covering the biosensor was exchanged for 10 mL of acetate buffer containing 1 at concentrations of 1, 10, 100 or 1000 μM. In order to verify the effect of various concentrations of 1 on dsDNA following different exposure times, DPVs were performed immediately after the introduction of 1 into the cell, and after 5 min, 3 h and 24 h of contact time with the substrate.

4.5. Preparation of ssDNA

Single stranded-DNA (ssDNA) was prepared by dissolving 3.0 mg of dsDNA in 0.5 mL of 70% perchloric acid, neutralising with 0.5 mL of 9 M sodium hydroxide and finally adding 9 mL of acetate buffer [18].

4.6. Interaction of ssDNA with berenil

Freshly prepared ssDNA solution was added to the cell and single-scan DPV experiments were conducted in the range 0 to +1.4 V versus Ag|AgCl, Cl (0.1 M). Two peaks corresponding to the oxidation of the bases guanine and adenine appeared at potentials of +0.815 V and +1.131 V, respectively. After the first run, the electrode was washed, polished and returned to the ssDNA solution. To look for reproducibility, this assay format was repeated at least three times, and the oxidation current and potential of the bases were very similar (rsd of 5%). After cleaning the surface, the GC electrode was inserted into a solution containing 1 (at a concentration of 100 or 200 μM) and ssDNA, and the DPV experiment repeated [16,18]. A clean GC electrode was also employed in DPV experiments involving a 100 μM solution of 1 alone, and the current of the peak Ia (berenil oxidation) was used for comparison purposes.

4.7. Interaction of polyadenylic and polyguanylic acids with berenil

A freshly prepared solution containing the potassium salt of polyguanylic acid (polyG, 0.0010 g) dissolved in 10 mL of acetate buffer [30] was added to the cell and single-scan DPV experiments were conducted in the range 0 to +1.4 V versus Ag|AgCl, Cl (0.1 M). One peak corresponding to the oxidation of the base guanine appeared at potential of +1.00 V. After the first run, the electrode was washed, polished and returned to the polyG solution. To look for reproducibility, this assay format was repeated at least three times, and the oxidation current and potential of the guanine were compared and showed to be very similar (RSD of 6%). After cleaning the surface, the GC electrode was inserted into a solution of polyG to which 1 was added to attain a final concentration of 1, 5, 10 or 100 μM. Following addition of 1, a new DPV scan was acquired immediately.
Owing to the insufficient solubility of polyadenylic acid (polyA) in acetate buffer, the potassium salt of the analyte (3 mg) was dissolved in 1 mL of 1 M hydrochloric acid by heating in a sealed glass tube in a boiling water bath for 30 min. Following digestion, a process that leads to the removal of adenine bases through the cleavage of purine glycoside bonds [40,41], the solution was neutralised with 1 mL of 1 M sodium hydroxide and diluted to 10 mL with acetate buffer. DPV experiments were conducted as described above.

4.8. Differential scanning calorimetry

DSC measurements on calf-thymus DNA and its complex with 1 were performed using a Microcal (Northampton, MA, USA) model VP-DSC scanning microcalorimeter. Calf thymus-dsDNA (10,000-15,000 bp) was dissolved in 10.0 mM cacodylate buffer (pH 7.5) containing 5.0 mM sodium chloride and 0.1 mM EDTA to yield a final concentration of 0.32 mM, which was verified spectrophotometrically. The test sample was prepared in the same manner but with the addition of 1 at a concentration of 10.0 mM. The samples were degassed at low pressure for 30 min, placed into the microcalorimeter and scanned relative to the reference buffer over the temperature range 10-100°C at a rate of 0.5°C/min and a constant pressure of 30.0 psi. Buffer versus buffer baseline scans were determined and subtracted from transition scans prior to normalisation and analysis of DNA denaturation [43]. Finally, the values of the excess heat capacity function per mole of base pairs were obtained after subtraction of the baseline according to the procedure of Freire and Biltonen [44,45]. Data relating to excess heat capacity versus temperature were acquired using a Microcal VP-Viewer and were subsequently analysed using Microcal Origin DSC 4.0 software. A two-state model was employed to obtain ΔHcal (calorimetric enthalpy of transition) and Tm (melting temperature), and a non two-state model was used to obtain ΔHvH (van't Hoff enthalpy of transition). Entropy at TmSTm), was calculated [45] from
Δ G T m = R T ln [ unfolded ] / [ folded ] .
At Tm, [unfolded]/ [folded] = 1, such that
Δ G T m = R T ln [ 1.0 ] = 0
and since ΔGTm = ΔHTmTm x ΔSTm, then
Δ H T m T m x Δ S T m = 0
whence Δ S T m = Δ H cal T m.
The average number of base pairs, <ηmelt>, in a cooperative melting unit was calculated from the ratio: η melt = Δ H vH Δ H cal.
The relative cooperative index (RCI) was calculated according to the method of [46].

Acknowledgments

The authors wish to thank FAPEAL, CNPq, CNPq/Ministério da Saúde/Neoplasias, PADCT/CNPq/CTINFRA, Banco do Nordeste do Brasil, Instituto do Milênio-INOFAR/CNPq, CAPES and CAPES/COFECUB for fellowships and research grants in support of this work.

References and Notes

  1. Pindur, U.; Jansen, M.; Lemster, T. Advances in DNA-Ligands with Groove Binding, Intercalating and/or Alkylating Activity: Chemistry, DNA-Binding and Biology. Curr. Med. Chem. 2005, 12, 2805–2847. [Google Scholar]
  2. Bell, C. A.; Hall, J. E.; Kyle, D. E.; Grogl, M.; Ohemeng, K. A.; Alln, M.A.; Tidwell, R. R. Structure-activity studies of dicationically substituted bis-benzimidazoles against Giardia lamblia: correlation of antigiardial activity with DNA binding affinity and giardial topoisomerase II inhibition. Antimicrob. Agents Chemother. 1993, 37, 2668–2673. [Google Scholar]
  3. Tidwell, R. R.; Boykin, D.W. Dicationic DNA Minor Groove Binders as Anti-microbial Agents. In DNA and RNA Binders: From Small Molecules to Drugs; Demeunynck, M., Bailly, C., Wilson, W. D., Eds.; Wiley-VCH: Weinheim, 2003; pp. 414–460. [Google Scholar]
  4. Chaires, J. B. A thermodynamic signature for drug-DNA binding mode. Arch. Biochem. Biophys. 2006, 453, 26–31. [Google Scholar]
  5. Waring, M. J. DNA modification and cancer. Annu. Rev. Biochem. 1981, 50, 159–192. [Google Scholar]
  6. Wells, R. D.; Larson, J. E. Studies on the binding of actinomycin D to DNA and DNA model polymers. J. Mol. Biol. 1970, 49, 319–342. [Google Scholar]
  7. Barton, J. K.; Goldberg, J. M.; Kumar, C. V.; Turro, N. J. Binding modes and base specificity of tris(phenanthroline)ruthenium(II) enantiomers with nucleic acids: tuning the stereoselectivity. J. Am. Chem. Soc. 1986, 108, 2081–2088. [Google Scholar]
  8. Zhou, N.; James, T. L.; Shafer, R. H. Binding of actinomycin D to [d(ATCGAT) ]2: NMR evidence of multiple complexes. Biochemistry 1989, 28, 5231–5239. [Google Scholar]
  9. Tanious, F. A.; Veal, J. M.; Buczak, H.; Ratmeyer, L. S.; Wilson, W. D. DAPI (4′,6-diamidino-2-phenylindole) binds differently to DNA and RNA: minor-groove binding at AT sites and intercalation at AU sites. Biochemistry 1992, 31, 3103–3112. [Google Scholar]
  10. Chen, A. Y.; Liu, L. F. DNA Topoisomerases: Essential Enzymes and Lethal Targets. Annu. Rev. Pharmacol. Toxicol. 1994, 34, 191–218. [Google Scholar]
  11. McKnight, R. E.; Gleason, A. B.; Keyes, J. A.; Sahabi, S. Binding mode and affinity studies of DNA-binding agents using topoisomerase I DNA unwinding assay. Bioorg. Med. Chem. Lett. 2007, 17, 1013–1017. [Google Scholar]
  12. Diculescu, V. C.; Barbosa, R. M.; Oliveira-Brett, A. M. In situ sensing of the DNA damage by a nitric oxide - releasing compound. Anal. Letters 2005, 38, 2525–2540. [Google Scholar]
  13. Rauf, S.; Gooding, J. J.; Akhtar, K.; Ghauri, M. A.; Rahman, M.; Anwar, M. A.; Khalid, A. M. Electrochemical approach of anticancer drugs-DNA interaction. J. Pharm. Biomed. Anal. 2005, 37, 205–217. [Google Scholar]
  14. Oliveira-Brett, A. M.; Serrano, S. H. P.; Piedade, J. A. P. Electrochemistry of DNA. In Comprehensive Chemical Kinetics - Applications of Kinetic Modelling; Compton, R.G., Ed.; Elsevier: Amsterdam, 1999; pp. 91–119. [Google Scholar]
  15. Oliveira-Brett, A. M.; da Silva, L. A.; Fujii, H.; Mataka, S.; Thiemann, T. Detection of the damage caused to DNA by a thiophene-S-oxide using an electrochemical DNA-biosensor. J. Electroanal. Chem. 2003, 549, 91–99. [Google Scholar]
  16. Oliveira-Brett, A. M.; Macedo, T. R. A.; Raimundo, D.; Marques, M. H.; Serrano, S. H. P. Voltammetric behaviour of mitoxantrone at a DNA-biosensor. Biosens. Bioelectron. 1998, 13, 861–867. [Google Scholar]
  17. Oliveira-Brett, A. M.; Goulart, M. O. F.; de Abreu, F. C. Detection of the damage caused to DNA by niclosamide using an electrochemical DNA-biosensor. Biosens. Bioelectron. 2002, 17, 913–919. [Google Scholar]
  18. Diculescu, V. C.; Paquim, A-M.C.; Brett, A.M.O. Mini-Review: Electrochemical DNA Sensors for Detection of DNA Damage. Sensors 2005, 5, 377–393. [Google Scholar]
  19. Hillard, E. A.; de Abreu, F. C.; Ferreira, D. C. M.; Jaouen, G.; Goulart, M. O. F.; Amatore, C. Electrochemical parameters and techniques in drug development, with an emphasis on quinones and related compounds. Chem. Comm. in press.
  20. Burri, C.; Bodley, A. L.; Shapiro, T. A. Topoisomerases in kinetoplastids. Parasitol. Today 1996, 12, 226–231. [Google Scholar]
  21. Clausen, P. H.; Waiswa, C.; Katunguka-Rwakishaya, E.; Scahres, G.; Steuber, S.; Mehlitz, D. Polymerase chain reaction and DNA probe hybridization to assess the efficacy of diminazene treatment in Trypanosoma brucei□ - infected cattle. Parasitol. Res. 1999, 85, 206–211. [Google Scholar]
  22. Gresh, N.; Pullman, B. A theoretical study of the non-intercalative binding of berenil and stilbamidine to double-stranded (dA-dT)n oligomers. Mol. Pharmacol. 1984, 25, 452–458. [Google Scholar]
  23. Portugal, J.; Waring, M. J. Comparison of binding sites in DNA for berenil, netropsin and dislamycin. A footprinling study. Eur. J. Biochem. 1987, 167, 281–289. [Google Scholar]
  24. Brown, D. G.; Sanderson, M. R.; Garman, E.; Neidle, S. Crystal structure of a berenil-d(CGCAAATTTGCG) complex: An example of drug-DNA recognition based on sequence-dependent structural features. J. Mol. Biol. 1992, 226, 481–490. [Google Scholar]
  25. Reinert, K. E. DNA multimode interaction with berenil and pentamidine: double helix stiffening, unbending and bending. J. Biomol. Struct. Dyn. 1999, 17, 311–321. [Google Scholar]
  26. Barceló, F.; Ortiz-Lombardia, M.; Portugal, J. Heterogeneous DNA binding modes of berenil. Biochim. Biophys. Acta 2001, 1519, 175–184. [Google Scholar]
  27. Coates, L.; Ikpeazu, E. V.; Chen, Y.; Valenzuela, M. S. Inhibition of DNA Replication by Berenil in Plasmids Containing Poly(dA)poly(dT) Sequences. Plasmid 2002, 47, 120–128. [Google Scholar]
  28. Durand, M.; Seche, E.; Maurizot, J. C. Effect of strand orientation on the interaction of berenil with DNA triple helices. Eur. Biophys. J. 2002, 30, 625–630. [Google Scholar]
  29. Burr, S. J.; Mseslati, A.; Thomas, E. W. Photochemical DNA cleavage by a berenil analog. Tetrahedron Lett. 2003, 44, 7307–7309. [Google Scholar]
  30. Nguyen, B.; Hamelberg, D.; Bailly, C.; Colson, P.; Stanek, J.; Brun, R.; Neidle, S.; Wilson, W. D. Characterization of a novel DNA minor-Groove complex. Biophys. J. 2004, 86, 1028–1041. [Google Scholar]
  31. Roig, A.; Pena, M. P.; Vicente, F.; Stockert, J. C. Voltammetric behavior of berenil. J. Pharm. Sci. 1993, 82, 251–253. [Google Scholar]
  32. Wei, X.; Speiser, B. Electrochemistry of triazenes—Part 4. Reaction of diazonium ions generated electrochemically from 1-aryl-3,3-dimethyltriazenes in acetonitrile. Electrochim. Acta. 1995, 40, 2477–2482. [Google Scholar]
  33. Cooper, A.; Nutley, M. A.; Wadood, A. Differential scanning calorimetry. In Protein-ligand Interactions: Hydrodynamics and Calorimetry; Harding, S.E., Chowdhry, B.Z., Eds.; Oxford University Press: New York, 2001; pp. 287–319. [Google Scholar]
  34. Poland, D.; Scheraga, H. A. Theory of Helix-coil Transitions in Biopolymers; Academic Press: New York, 1970. [Google Scholar]
  35. Marky, L. A.; Breslauer, K. J. Calculating thermodynamic data for transitions of any molecularity from equilibrium melting curves. Biopolymers 1987, 26, 1601–1620. [Google Scholar]
  36. Tsong, T. Y.; Hearn, R. P.; Wrathall, D. P.; Sturtevant, J. M. A calorimetric study of thermally induced conformational transitions of ribonuclease A and certain of its derivatives. Biochemistry 1970, 9, 2666–2677. [Google Scholar]
  37. Colson, P.; Houssier, C.; Bailly, C. Use of electric linear dichroism and competition experiments with intercalating drugs to investigate the mode of binding of Hoechst 32258, berenil and DAPI to GC sequences. J. Biomol. Struct. Dyn. 1995, 13, 351–366. [Google Scholar]
  38. Colson, P.; Bailly, C.; Houssier, C. Electric linear dichroism as a new tool to study sequence preference in drug binding to DNA. Biophys. Chem. 1996, 58, 125–140. [Google Scholar]
  39. Pilch, D. S.; Kirolos, M. A.; Liu, X.; Plum, G. E.; Breslauer, K. J. Berenil [1,3-bis(4′-amidinophenyl)triazene] binding to DNA duplexes and to a RNA duplex: evidence for both intercalative and minor groove binding properties. Biochemistry 1995, 34, 9962–9976. [Google Scholar]
  40. Krautbauer, R.; Pope, L. H.; Schrader, T. E.; Allen, S.; Gaub, H. E. Discriminating small molecule DNA binding modes by single molecule force spectroscopy. FEBS Lett. 2002, 510, 154–158. [Google Scholar]
  41. Meric, B.; Kerman, K.; Ozkan, D.; Kara, P.; Erdem, A.; Kucukogu, O.; Erciyas, E.; Ozsoz, M. Electrochemical biosensor for the interaction of DNA with the alkylating agent 4,4′-dihydroxy chalcone based on guanine and adenine signals. J. Pharm. Biomed. Anal. 2002, 30, 1329–1346. [Google Scholar]
  42. Rich, A.; Davies, D. R.; Crick, F. H. C.; Watson, J. D. The molecular structure of polyadenylic acid. J. Mol. Biol. 1961, 3, 71–86. [Google Scholar]
  43. Pilch, D. S. Calorimetry of nucleic acids. In Current Protocols in Nucleic Acid Chemistry; John Wiley and Sons, Inc.: New York, 2000; Chapter 7, Unit 7.4. [Google Scholar]
  44. Freire, F.; Biltonen, R. L. Statistical mechanical deconvolution of thermal transitions in macromolecules. I. Theory and application to homogeneous systems. Biopolymers. 1978, 17, 436–479. [Google Scholar]
  45. Freire, F.; Biltonen, R. L. Thermodynamic characterization of conformational states of biological macromolecules using differential scanning calorimetry. Crit. Rev. Biochem. 1978, 5, 85–124. [Google Scholar]
  46. Relkin, P. Differential scanning calorimetry: A useful tool for studying protein denaturation. Thermochim. Acta 1994, 246, 371–386. [Google Scholar]
Figure 1. (A) Cyclic voltammogram of berenil (1) measured at a scan rate 0.100 V s−1. (B) Differential pulse voltammogram of 1 measured with a pulse amplitude of 50 mV, a pulse width of 70 ms and scan rate of 5 mV s−1. In both experiments, a glassy carbon electrode was employed and 1 was present at a concentration of 1 mM in aqueous acetate buffer (0.2 M; pH 4.5). The peak Ic is related to the reduction of the triazene function in 1.
Sensors 08 01519f1
Figure 2. Cyclic voltammograms of berenil (1) determined at different scan rates. A glassy carbon electrode versus Ag|AgCl, Cl reference electrode was employed and 1 was present at a concentration of 1 mM in aqueous acetate buffer (0.2 M; pH 4.5). The peak Ia is related to the oxidation of the triazene function in 1 [32].
Sensors 08 01519f2
Figure 3. Differential pulse voltammograms recorded 24 h after berenil (1) had been coated at different concentrations onto a dsDNA-GC electrode. In each case the pulse amplitude was 50 mV, the pulse width was 70 ms, and the scan rate was 5 mV s−1. The peak Ia is related to the oxidation of 1 and the peak associated with the oxidation of guanine is arrowed.
Sensors 08 01519f3
Figure 4. Differential pulse voltammograms recorded following (A) 5 min and (B) 24 h of exposure of a dsDNA biosensor to different concentrations of berenil (1) in aqueous acetate buffer (0.2 M; pH 4.5). In each case the pulse amplitude was 50 mV, the pulse width was 70 ms, and the scan rate was 5 mVs−1. Peak Ia is related to the oxidation of 1 and the peaks associated with the oxidation of guanine and adenine are marked with arrows.
Sensors 08 01519f4
Figure 5. Differential pulse voltammograms recorded following different intervals of exposure of a dsDNA biosensor to a 1 mM solution of berenil (1) in aqueous acetate buffer (0.2 M; pH 4.5).
Sensors 08 01519f5
Figure 6. Differential pulse voltammograms of berenil (1) present in different concentrations in aqueous acetate buffer (0.2 M; pH 4.5) in ssDNA solution. Peak Ia is related to the oxidation of 1, and peaks labelled G and A are related to the oxidation of guanine and adenine, respectively.
Sensors 08 01519f6
Figure 7. Differential pulse voltammograms of berenil (1) present at a concentration of 1 mM in aqueous acetate buffer (0.2 M; pH 4.5) in polyA solution. The inset shows differential pulse voltammograms of 1 present at a concentration of 1 mM in aqueous acetate buffer (0.2 M; pH 4.5) in polyG solution. Peak Ia is related to the oxidation of 1 and the peak associated with the oxidation of guanine (G) is shown.
Sensors 08 01519f7
Figure 8. Differential scanning calorimetry analysis of a berenil and berenil-DNA complex. Melting curves of dsDNA (A) were performed in solution containing 10 mM cacodylate buffer (pH 7.5), 5 mM NaCl, 0.1 mM EDTA, and (B) in the presence of saturating amounts of berenil plus the buffer solution of condition of A. The plots show the excess of heat capacity (kcal/mol.°C) as a function of the temperature. Raw data (-□-) and data fitted using a two-state model transition (-∇-).Tm is the temperature midpoint of transition for the enthalpy change that occurs when the DNA goes from order to disorder form.
Sensors 08 01519f8
Figure 9. Schematic representation of the ds-DNA biosensor.
Sensors 08 01519f9
Table 1. Thermodynamic parameters for the binding of berenil to calf thymus dsDNA as determined by differential scanning calorimetry analysis
ΔHcalaΔHvHbΔSTmcTmd<ηmelt>eRCIf
dsDNA4.7614614.066.8316.5
dsDNA + berenil1.804524.992.82511.9
aCalorimetric enthalpy of transition (kcal/mol of base pairs).
bVan't Hoff enthalpy of transition (kcal/mol of cooperative melting unit).
cEntropy of system at Tm (cal per mol of base pairs/K).
dMelting point (°C) at transition when 50% molecules remain folded.
eAverage number of base pairs in a cooperative melting unit.
fRelative cooperative index (°C).

