Article

Estimation of the Total Atmospheric Water Vapor Content and Land Surface Temperature Based on AATSR Thermal Data

1
Cold and Arid Regions Environmental and Engineering Research Institute, Chinese Academy of Sciences, Lanzhou, P. R. China
2
International Institute for Geo-information Science and Earth Observation (ITC), 7500 AA Enschede, The Netherlands
*
Author to whom correspondence should be addressed.
Sensors 2008, 8(3), 1832-1845; https://doi.org/10.3390/s8031832
Submission received: 7 November 2007 / Accepted: 8 February 2008 / Published: 16 March 2008
(This article belongs to the Special Issue Remote Sensing of Natural Resources and the Environment)

Abstract

:
The total atmospheric water vapor content (TAWV) and land surface temperature (LST) play important roles in meteorology, hydrology, ecology and some other disciplines. In this paper, the ENVISAT/AATSR (The Advanced Along-Track Scanning Radiometer) thermal data are used to estimate the TAWV and LST over the Loess Plateau in China by using a practical split window algorithm. The distribution of the TAWV is accord with that of the MODIS TAWV products, which indicates that the estimation of the total atmospheric water vapor content is reliable. Validations of the LST by comparing with the ground measurements indicate that the maximum absolute derivation, the maximum relative error and the average relative error is 4.0K, 11.8% and 5.0% respectively, which shows that the retrievals are believable; this algorithm can provide a new way to estimate the LST from AATSR data.

1. Introduction

Land surface temperature (LST) plays an important role in land-surface processes on a regional as well as on a global scale. It combines the results of all surface-atmosphere interactions and energy fluxes between the ground and the atmosphere and is, therefore, a good indicator of the energy balance at the Earth's surface [1]. It is also a good indicator of both the greenhouse effect and the energy flux between the atmosphere and the ground [2]. As such, LST is used as a parameter for a wide variety of scientific studies [3] as well as having forest fire detection and agricultural applications. Furthermore, satellite-derived LST can be assimilated to climate, mesoscale and land surface models to estimate the sensible heat flux and latent heat flux from the Earth's surface.
The atmospheric water, which is the total atmospheric precipitable water vapor contained in a vertical air column, is a key parameter for climate study. It is one of the most important factors which cause the atmospheric effect on the thermal band. By getting the total atmospheric water vapor to diminish the atmospheric effects and obtaining the knowledge of effective surface emissivities, LST can be calculated. Different approaches have been published in the past years in order to retrieve LST by using the thermal remote sensing. In the literature review, normally researchers use split window method which is considered as the most popular and successful estimation method for LST retrieval. This algorithm utilizes the differential absorption in adjacent thermal band to correct the atmospheric effects [4-9]. Sobrino et al. [5] developed a methodology for atmospheric and emissivity correction. In this algorithm, ground emissivity, atmospheric transmittance and two further parameters (water content of atmosphere and parameter stating atmospheric absorption) were considered as the key parameters. Franca and Cracknell [6] established two atmospheric correction models for retrieving LST. The water content and an atmospheric parameter are also needed in this algorithm. Wan and Dozier [1] proposed a general split-window algorithm, which considered the viewing angle and got high accuracy of LST retrieval, this algorithm still needed the prior knowledge of the water content of atmosphere. Stroeve et al. [7] developed a split-window technique which was only sensitive to the effect of the atmospheric water vapor, and not to other atmospheric gases or aerosols. Key et al. [8] modified the simple split-window technique and added a correction term to the variation of the view angle along a scan line and its effect of the atmospheric path length. Wan and Li [9] proposed a multi-band algorithm to retrieve land-surface emissivity and LST from EOS/MODIS data, which was only influenced by the surface optical properties and the ranges of atmospheric condition.
Until now, many scientists use different thermal data to retrieve land surface temperature and total atmospheric water vapor content. Gillespie et al. [10] proposed an algorithm to retrieve temperature and emissivity from ASTER data. Qin et al. [11] made some reasonable simplifications for the radiation transfer equation and developed a split-window algorithm, which needed only two parameters (emissivity and transmittance) and the accuracy was less than 2°C. Mao et al. [12] fully utilized the advantage of Qin et al's algorithm and proposed a practical split window to retrieve LST from MODIS data. They found the accuracy of this algorithm was about 0.37°C and 0.49°C respectively when the transmittance was computed from the simulation water content by exponent fit and linear fit respectively. To sum up, data with different spectral and spatial resolution sensors are currently available, with several thermal bands such as ASTER, MODIS, AVHRR or the SEVIRI data. Yet less work has been done on retrieving LST and TAWV from AATSR data especially its use in Chinese region. In this paper, the total atmospheric water vapor content will be obtained first, then it will be used to retrieve LST over the Loess Plateau in China based on the algorithm developed by Qin et al. and Mao et al. described above, the goal of this work is to check the feasibility of this algorithm for AATSR LST retrieval on one hand and the application of AATSR data in Chinese Loess Plateau region on the other hand.

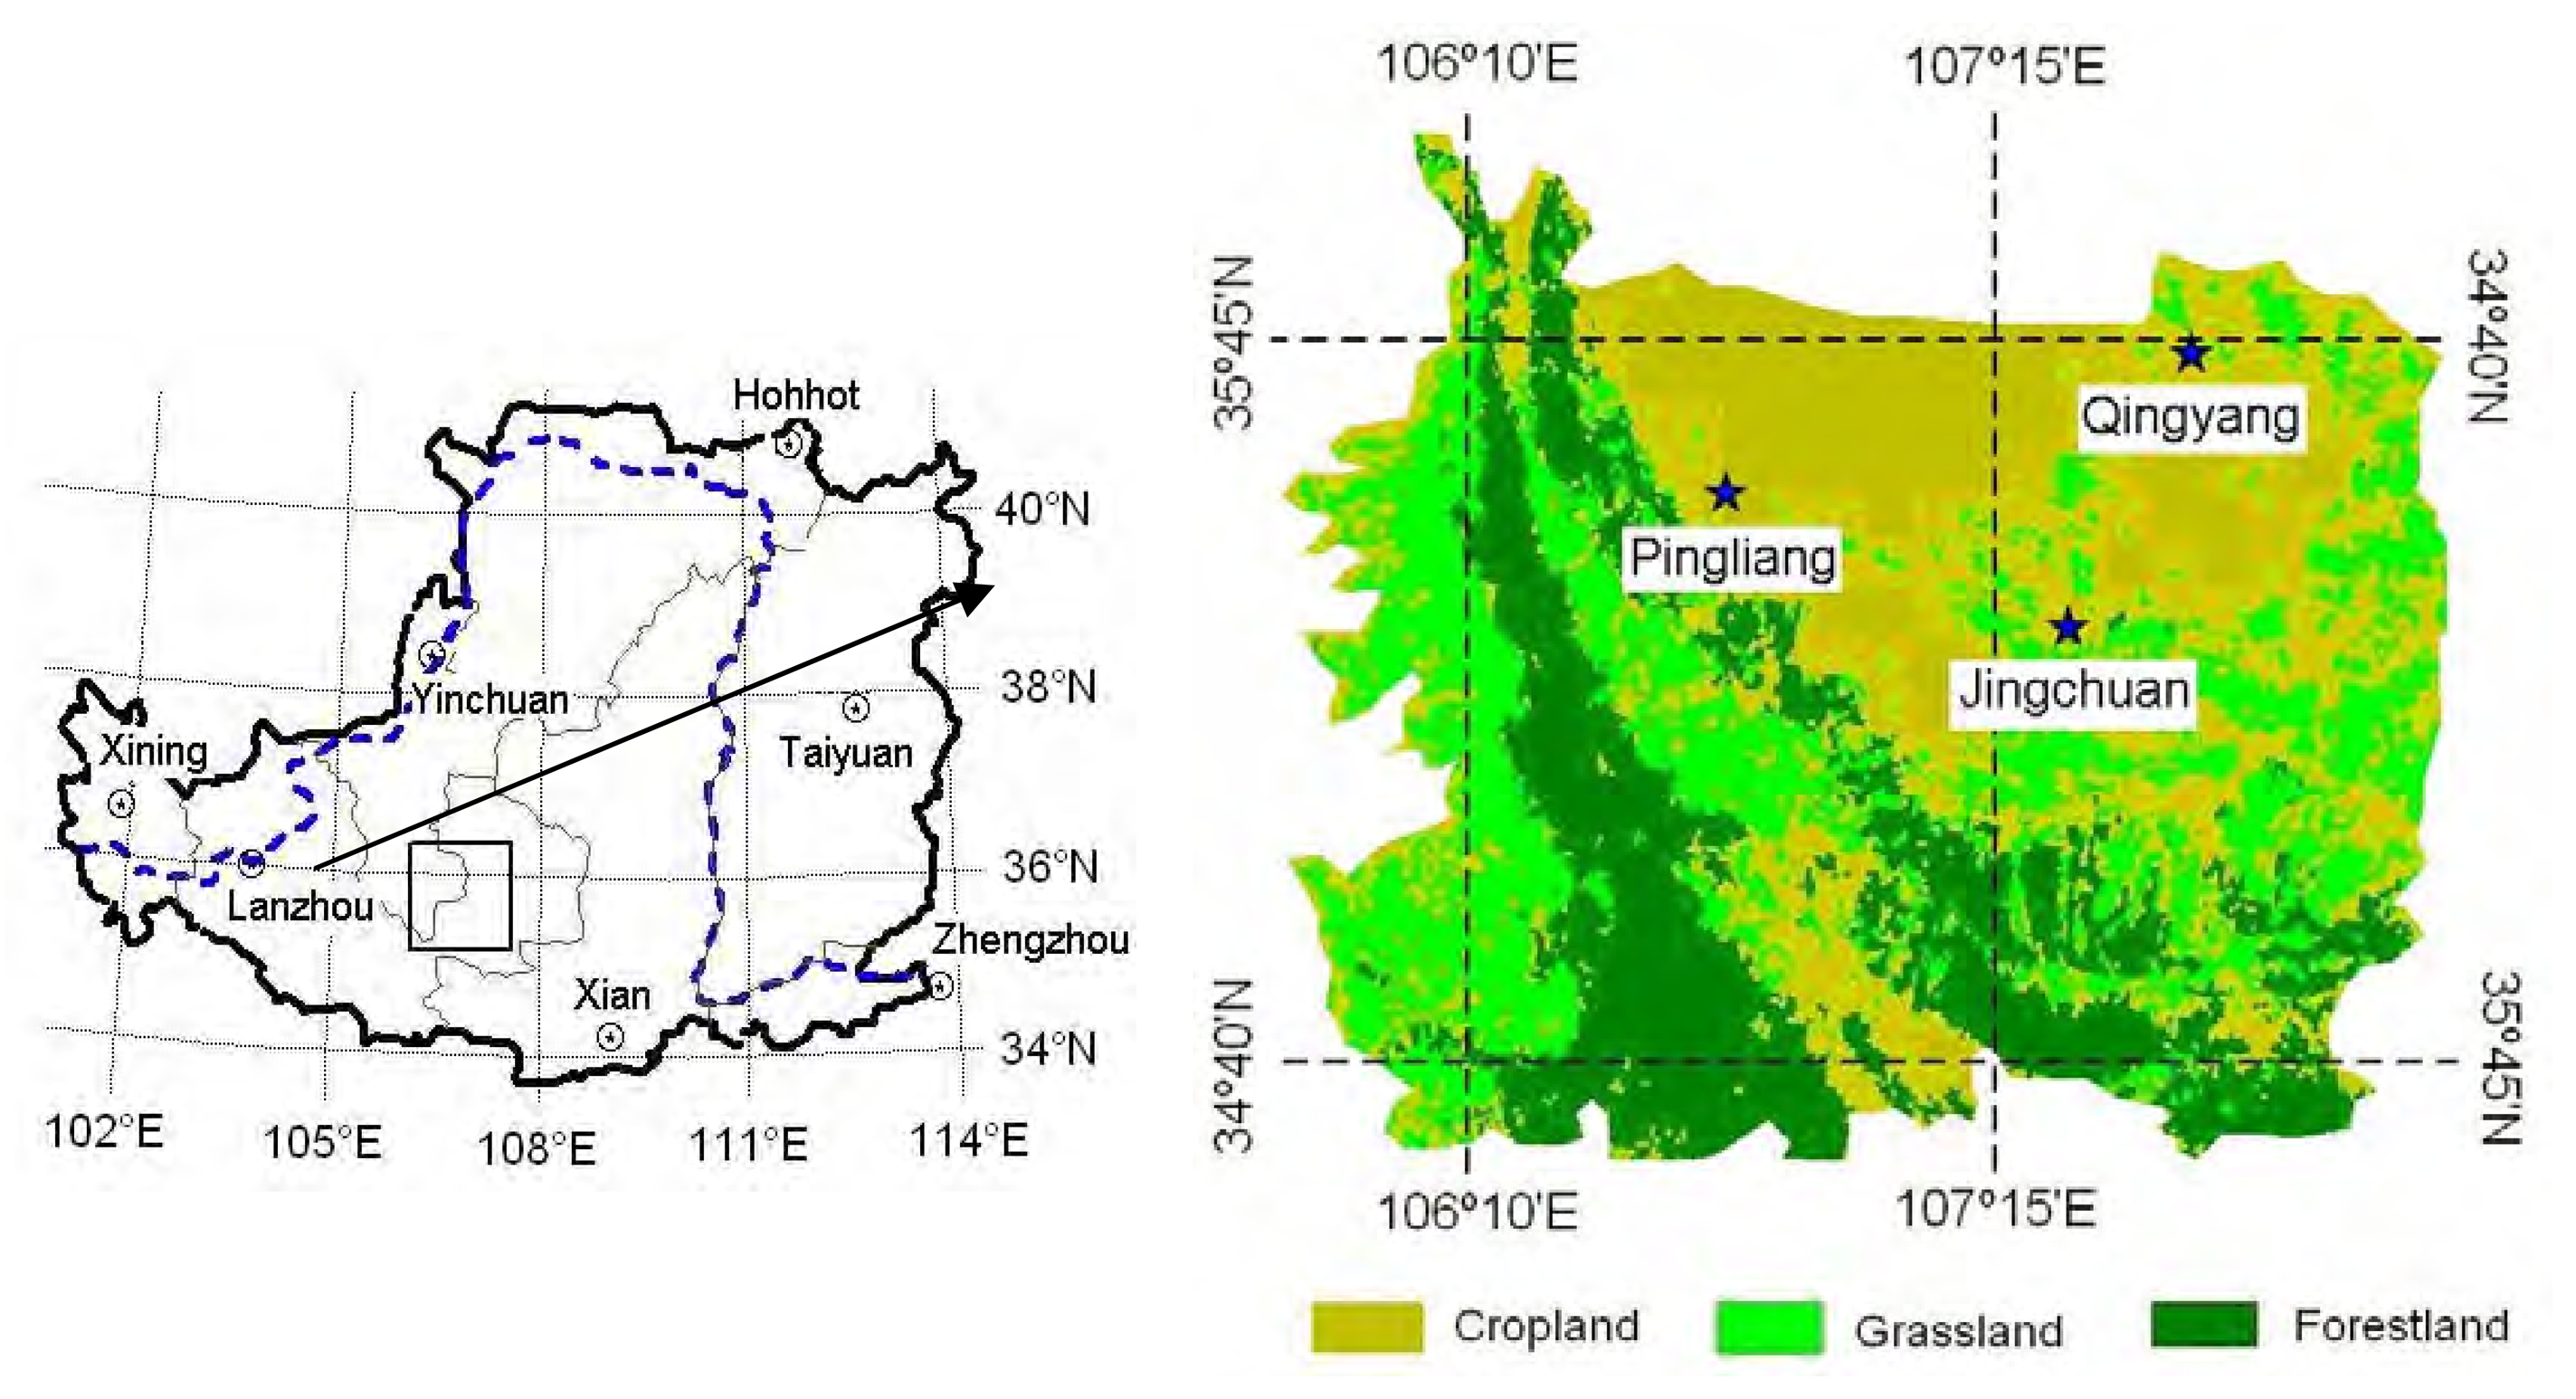
2. The Loess Plateau and the field campaigns

2.1 The Loess Plateau

The Loess Plateau, located in the upper and middle courses of the Yellow River, is the largest region with serious land degradation caused by disturbance and is known for suffering from drought and soil erosion, as well as for its poorly developed economy [14, 15]. Loess is the name for the silty soil that has been deposited by wind storms on the plateau over the ages. Loess is a highly erosion-prone soil that is susceptible to the forces of wind and water. The Loess Plateau was formed over long geologic times, and scientists have derived valuable information about global climate change from samples taken from the deep layer of its silty soil. Hundreds of years of deforestation and over-grazing, exacerbated by China's population increase, have resulted in degenerated ecosystems, desertification, and poor local economies.
The study area in this paper, the Eastern Gansu Province is located at 106°20′-108°45′E, 35°15′-37°10′N. This is one of the most severely eroded regions of the Loess Plateau. With an annual mean precipitation 400-700mm and the monthly mean temperatures in January and July are 261 and 290 K, respectively. The soil types are loess and loess-cinnamon, which developed from loess parent materials [16]. Based on the system of national vegetation regionalization, this area is classified into cropland, grassland and forestland three types displayed in Figure 1. The area of forest is the Liupan Mountain.

2.2 The field campaigns

In 2005, the field campaign LOess Plateau Mesa Region Land Surface Process Field EXperiment 2005 (LOPEX05) was conducted on the top of the loess plateau (mesa area) near the city of Pingliang of Gansu province, China [17,18]. The selected area (left) is characteristic for the Chinese Loess Plateau, which is a typical terrace landscape formed through fluvial erosion. Corn, millet and winter wheat are the dominant crop types. During the two-month Intensive Observation Period (IOP), a large amount of data has been collected, which is the best data for the study of energy and water cycle over the Loess Plateau. The LST measurements were obtained under cloud-free conditions by the thermal infrared sensors; the overpass value is from the average of the values at the time close to the satellite pastime. The accuracy of the observations was checked regularly during the field campaigns using a calibration blackbody. According to the calibration measurements, an absolute accuracy of ±0.2°C was obtained. Meanwhile, soil water contents and soil temperature were recorded with the TDR probes (Model CS616-L, Campbell Scientific) at depths of 5 cm.
Also, multiple remote sensing data such as Advanced Synthetic Aperture Radar (ASAR), Advanced Along Track Scanning Radiometer (AATSR) and Medium Resolution Imaging Spectrometer (MERIS) scenes have been collected too.

2.3 The AATSR data

The AATSR onboard ESA's Envisat Satellite, is the third in a series of precision radiometers designed to measure Sea Surface Temperature (SST). The AATSR instrument has exceptional radiometric accuracy and precision, achieved by Stirling-cycle cooled detectors and an extremely stable on board calibration system and for its infrared channels at 3.7, 11 and 12 μm. Pre-launch calibration indicates the radiometric accuracy of these channels for most terrestrial temperatures is better than 0.05K [13]. Unique to the AATSR instrument design is an additional forward view along track to enable a better atmospheric correction to be made for SST retrievals. However, only the nadir view (zenith range: 0-21.5°) is currently used for LST retrieval due to complications arising from the variation of infrared emissivity of land surfaces at high zenith angles and the effects of topography. In this paper, the nadir view data are used to retrieve LST over the Loess Plateau in China.

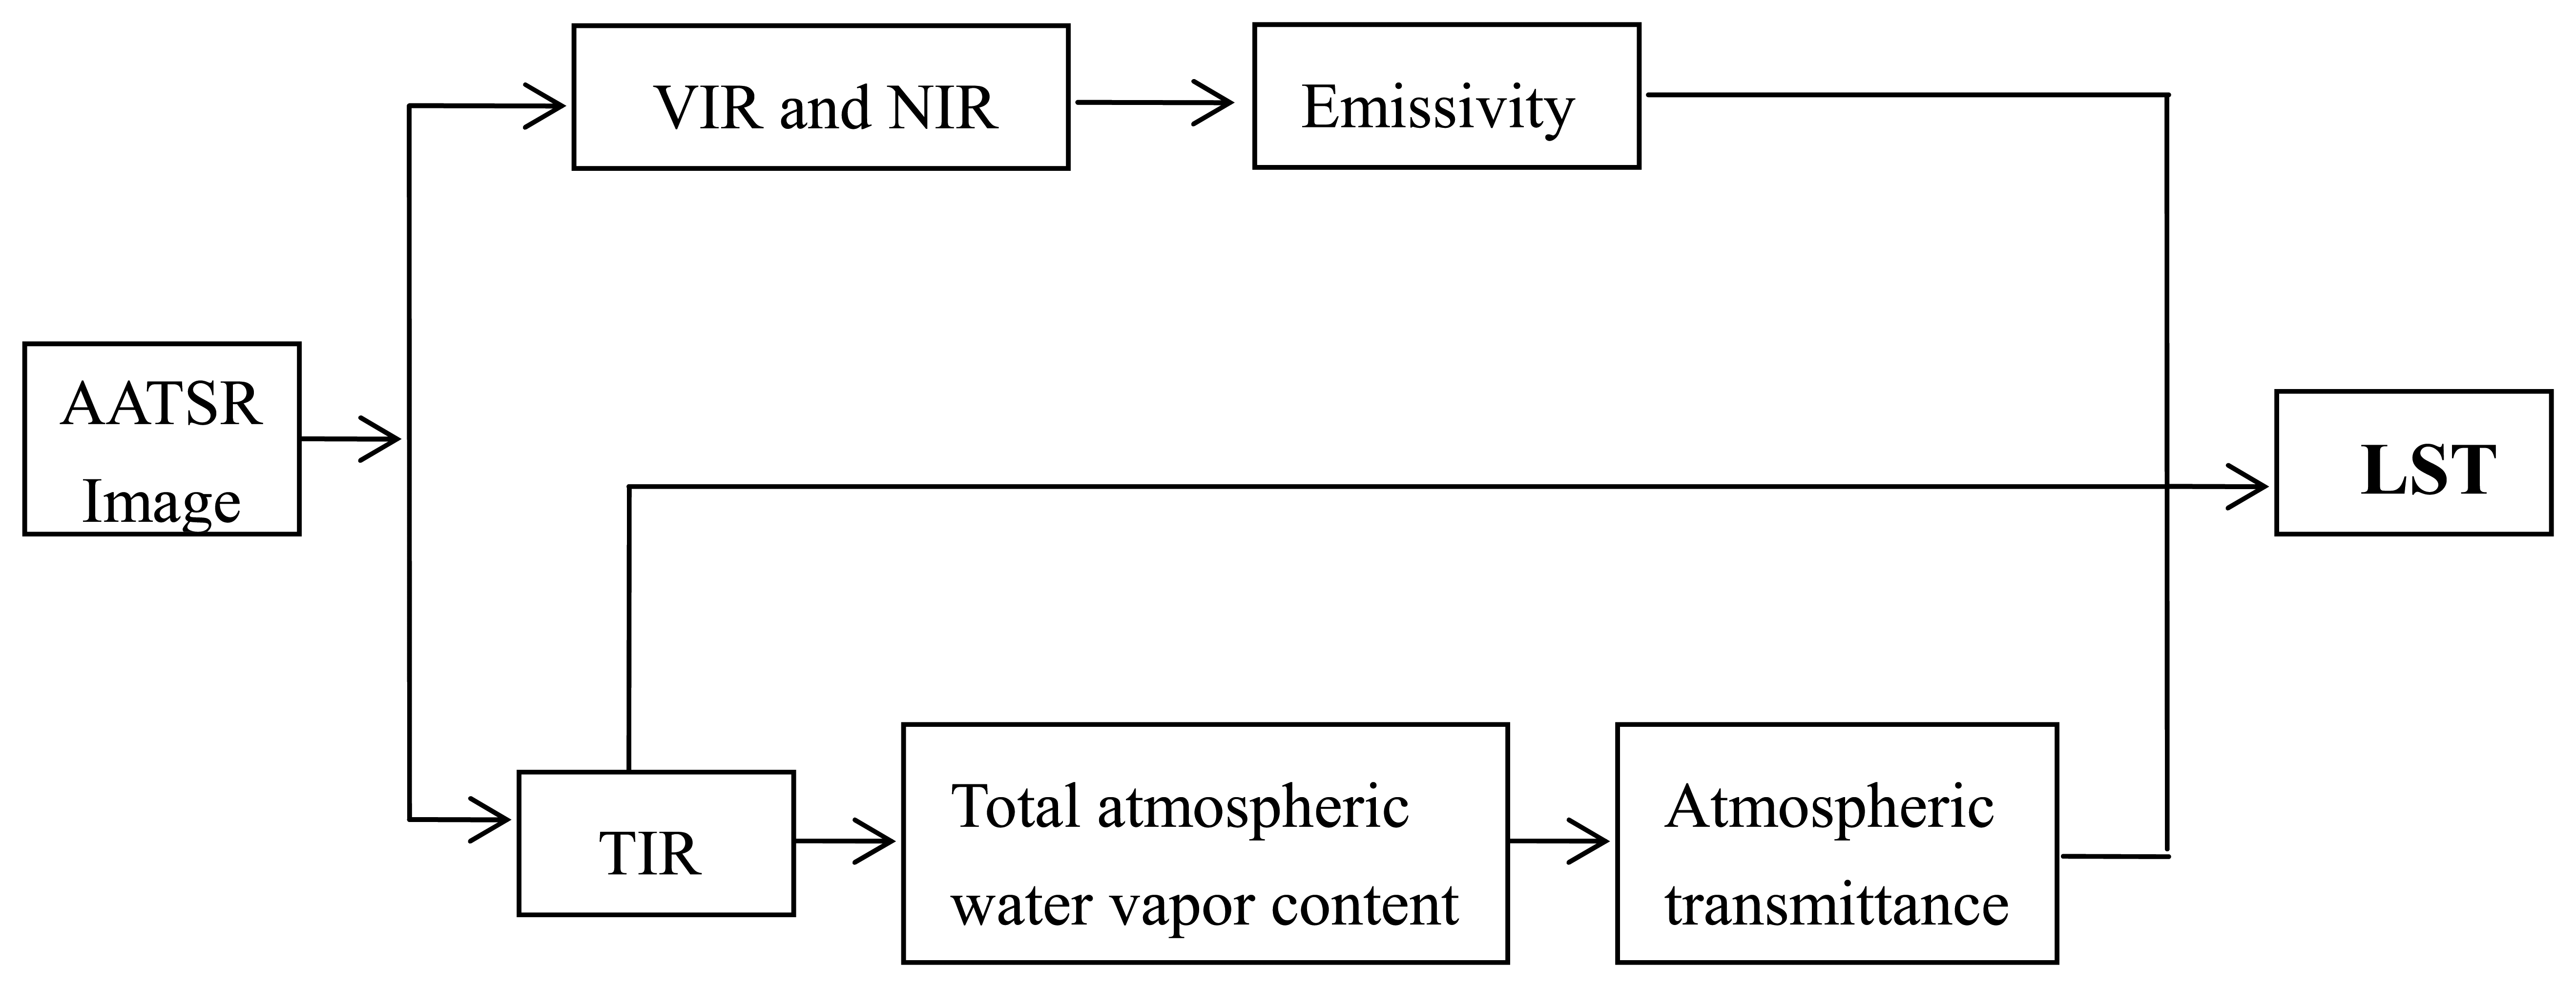
3. Algorithm for TAWV and LST retrievals

3.1 Determination of the total atmospheric water vapor content

Atmospheric water vapor plays a major role in the atmosphere's energy budget. In order to improve the accuracy of the estimation of water content in the atmosphere, many researchers [19-24] have done a lot of jobs for the retrieval of water content of atmosphere. Many algorithms based on TIR (Thermal-Infrared Reflectance) and NIR (Near-Infrared Reflectance) are developed to retrieve water content of atmosphere. Because AATSR has not the absorption and atmosphere window band as MODIS, in this paper, the TAWV will be estimated by using the TIR according to SWCVR (Split-window covariance ratio technique). Based on Li et al. [25], for AATSR nadir data:
w v = 13.73 13.622 τ 12 / τ 11 , R 2 = 0.987
where , τ j τ i = ɛ i ɛ j R j i with R j i = k = 1 N ( T i , k T ¯ i ) ( T j , k T ¯ j ) / k = 1 N ( T i , k T ¯ i ) 2
Where wv is atmospheric water vapor content, τ and ε are atmosphere transmittance and land surface emissivity in the respective band. For most blend surface types, it is reasonable to suppose εi/εj ≈ 1, then the above equations can be expressed as:
w v = 13.73 13.622 R 12 / R 11
In order to get Rji in pixel, the original image will be divided into many pixels of n*n, for each new pixel, the median will be calculated as i, j, Ti,k and Tj,k are the brightness temperatures for each template box(k) in the two split-window (i, j)., then the TAWV can be obtained consequently. In this paper, n is selected as 5.

3.2 The thermal radiative transfer equation

For the thermal remote sensing process, the basic rule is called as Radiative Transfer Equation (RTE), and the LST is obtained from the following expression of the RTE applied to the thermal infrared band:
B i ( T i ) = τ i ( θ ) [ ɛ i B i ( T s ) + ( 1 ɛ i ) I i ] + I i
where Bi(Ti) is the at-sensor radiance or Top of Atmospheric (TOA) radiance, i.e., the radiance measured by the sensor,εi is the land surface emissivity in band i, Bi(Ts) is the blackbody radiance given by the Planck's law and Ts is the LST, I i and I i are the downwelling and upwelling atmospheric radiance respectively, τi(θ) is the total atmospheric transmissivity between the surface and the sensor under the observational angle θ. According to Qin et al. and Mao et al., (4) can be expressed as:
B i ( T i ) = ɛ i τ i ( θ ) B i ( T s ) + [ 1 τ i ( θ ) ] [ 1 + ( 1 ɛ i ) τ i ( θ ) ] B i ( T a )
where Ta represents the mean atmospheric temperature given by
T a = 16.0110 + 0.92621 T 0
T0 being the near-surface air temperature.
For AATSR data, (5) can be expressed as:
B 11 ( T 11 ) = ɛ 11 τ 11 ( θ ) B 11 ( T s ) + [ 1 τ 11 ( θ ) ] [ 1 + ( 1 ɛ 11 ) τ 11 ( θ ) ] B 11 ( T a ) B 12 ( T 12 ) = ɛ 12 τ 12 ( θ ) B 12 ( T s ) + [ 1 τ 12 ( θ ) ] [ 1 + ( 1 ɛ 12 ) τ 12 ( θ ) ] B 12 ( T a )
as a result, Ts can be obtained by solve the above equations.
According to Mao, the Planck function can be simplified in linear equation, i.e.,
B i ( T φ ) = α i + β i T φ
where Tφ is temperature. Qin et al. give a statistical linear fit expression of radiance with the change of temperature through the simulation by the MODerate resolution TRANsmittance (MODTRAN) radiation model [26]. In this paper, the relationship between the radiance and temperature are modeled by MODTRAN and the similar relationship has been modeled as followed (shown in Figure 2):
B 11 ( T φ ) = 0.0782 T φ 13.48 , R 2 = 0.9973 B 12 ( T φ ) = 0.0477 T φ 4.9638 , R 2 = 0.9981

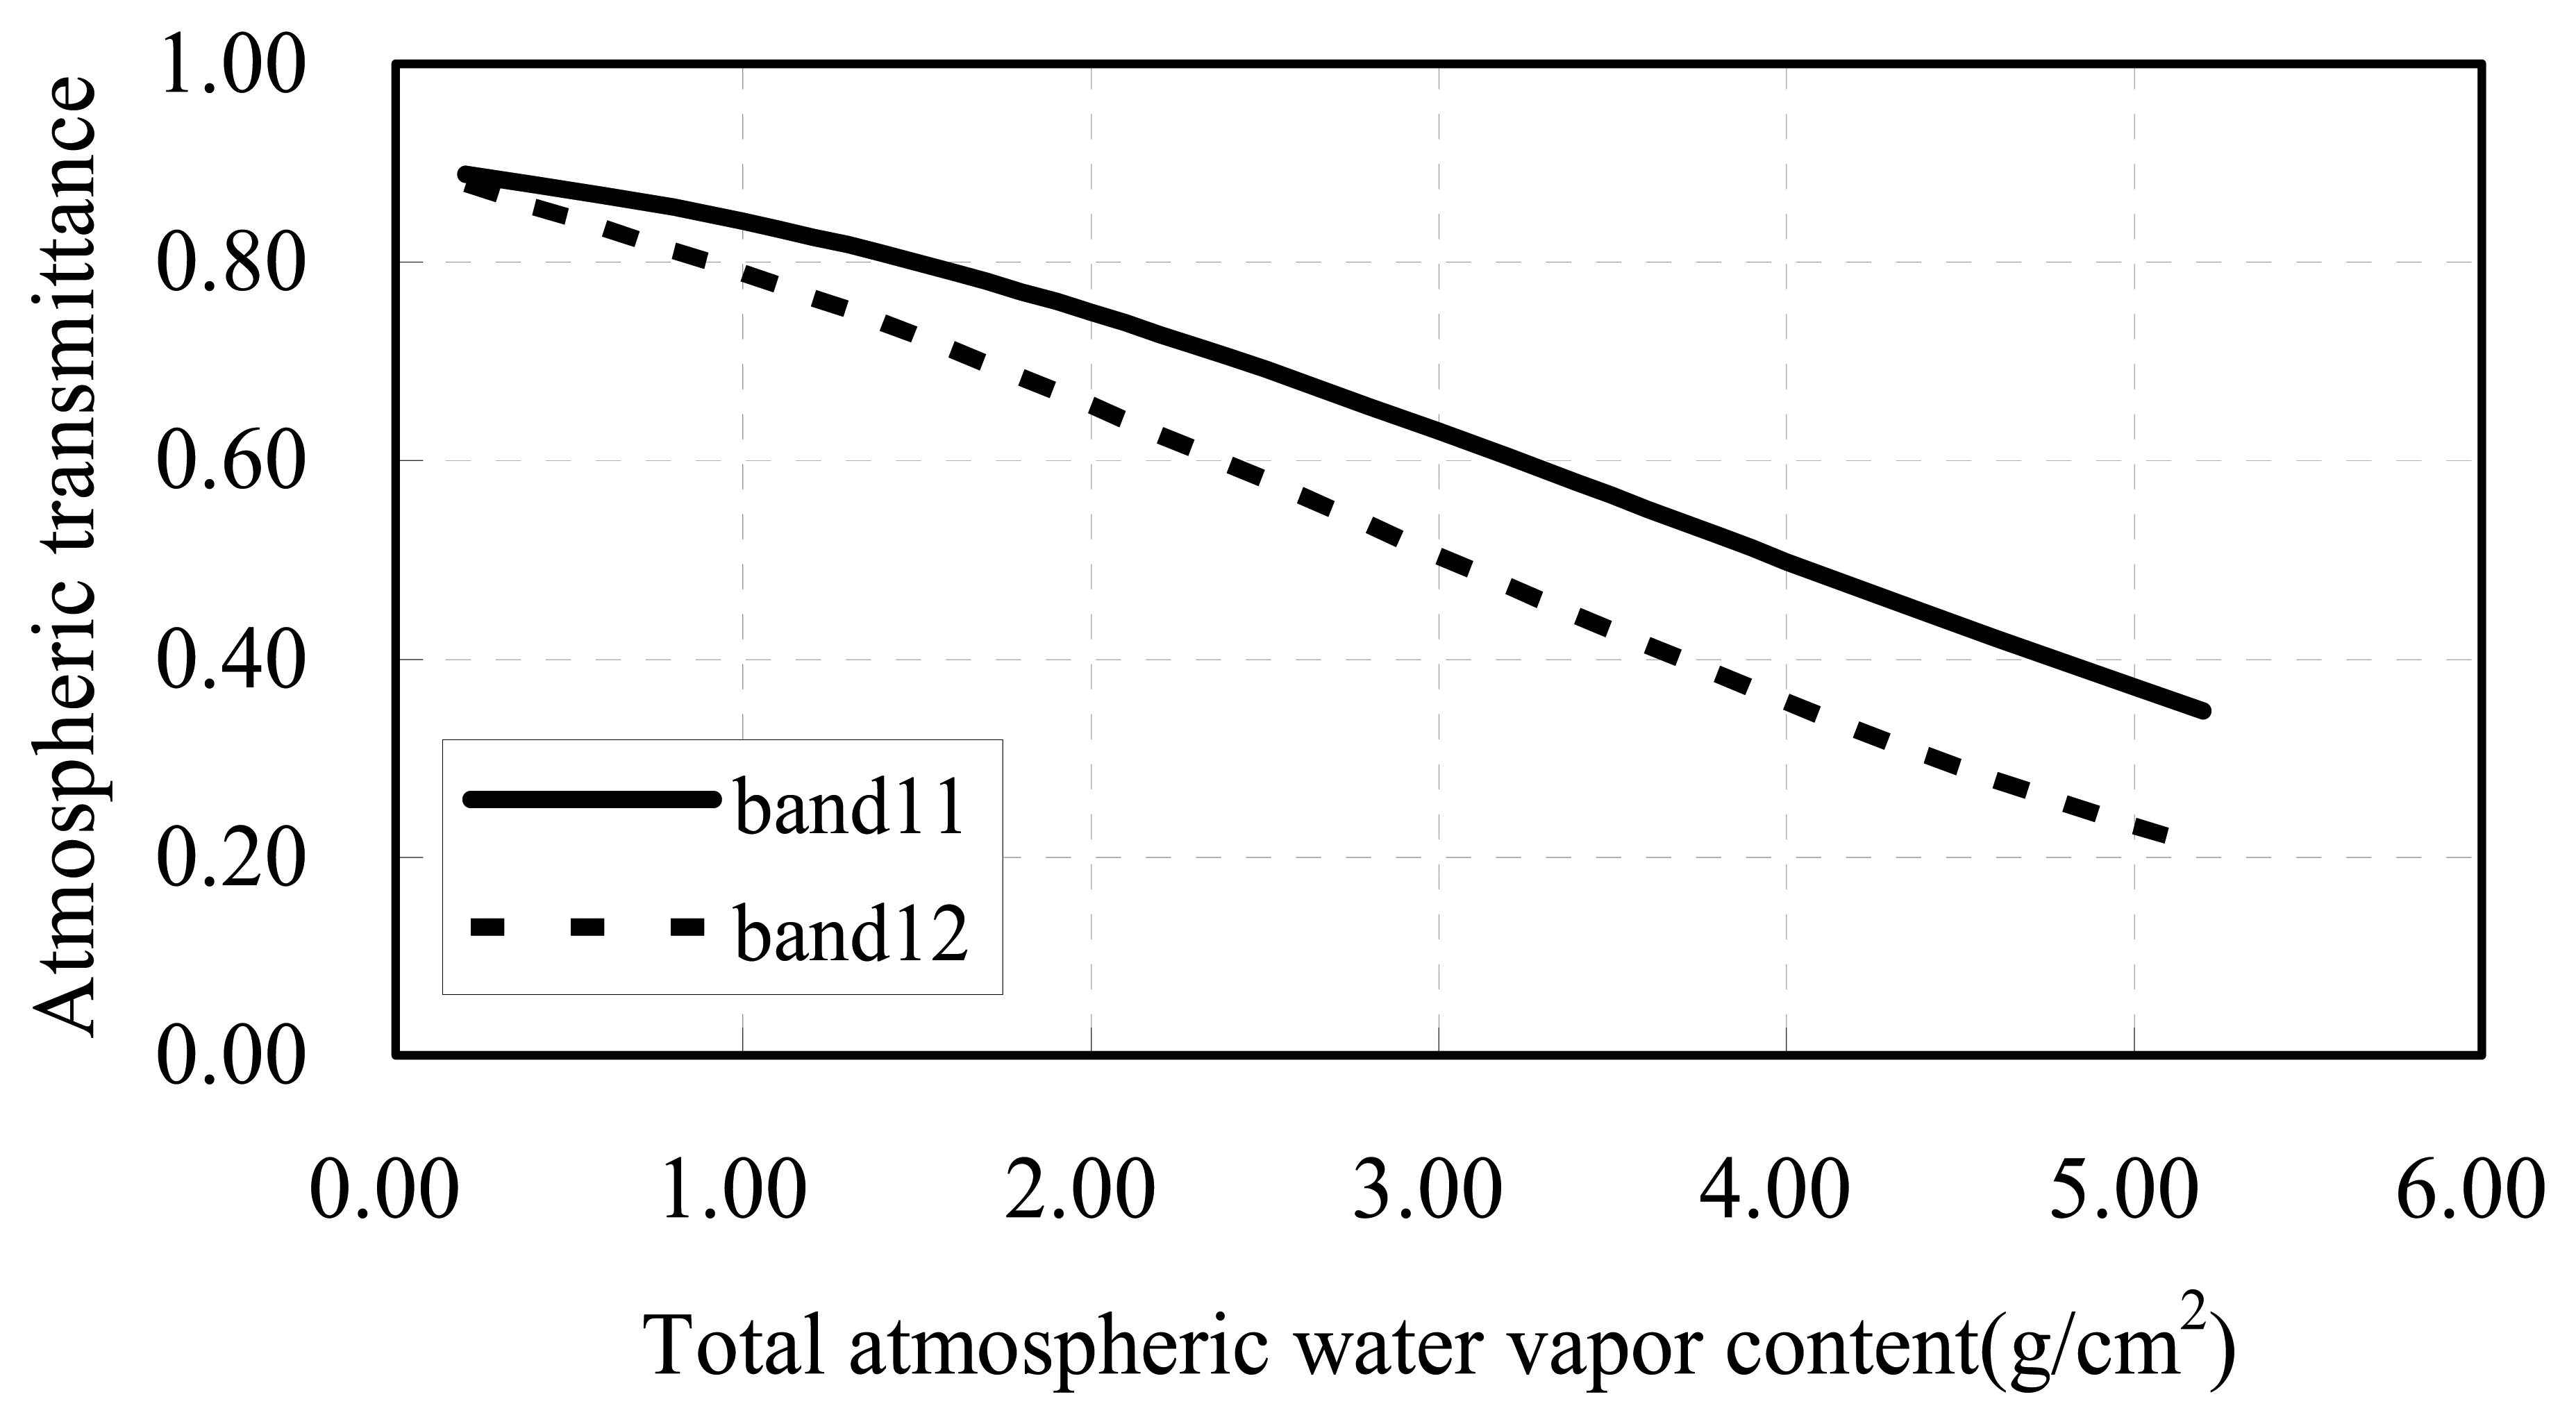
3.3 Calculation of atmospheric transmittance

Atmospheric transmittance is not only an important physical parameter which affects radiation of ground, but also the main study object in remote sensing, atmosphere physics and radiation transfer. It is a critical parameter that affects the accuracy of LST retrieval using the split-window algorithm. The thermal radiance is attenuated on its way to the remote sensor. Because of many technical difficulties, atmospheric transmittance is usually not available at in situ satellite passes; the most practical way to determine the atmospheric transmittance is through simulation with local atmospheric conditions, especially water vapour content. Qin et al. give a statistical linear fit expression of transmittance with the change of water vapour content in mid-latitude through the simulation by the LOW resolution TRANsmittance radiation model LOWTRAN. Mao et al. found that the transmittances of MODIS31/32 are prominently different at the same water content by simulation with MODTRAN and the transmittance of MODIS31/32 decreases exponentially with the increase of the water content of atmosphere. In this paper, we will use MODTRAN to model the relationship of the transmittance of AATSR11/12 and TAWV. During the model, the input atmosphere condition referenced the local weather station. The relationship between the transmittance of AATSR11/12 and TAWV (shown in Figure 3) are described as follows:
τ 11 = 0.1134 w v + 0.9553 , R 2 = 0.9898 τ 12 = 0.1397 w v + 0.24 , R 2 = 0.9985
where τi is the transmittance in band i, wv is water vapor content, R2 is squared correlation coefficients.

3.4 Estimation of land surface emissivity

Land surface emissivity (LSE) is an absolutely necessary parameter for LST retrieval from thermal remote sensing data. At present, laboratory or field spectral measurements can only give broadband (8-14 um) integrated emissivities. Based on Qin et al's and Mao et al's work, the pixel of remote sensing image is composed of three components (vegetation, soil, water) under the thermal band at nadir, which can be expressed as:
ɛ i = ɛ i w * f w + ɛ i v * f v * R v + ɛ i s * ( 1 f v f w ) * R s
where wv、 s represents water, vegetation and soil, f represents fraction coverage of different surface types, Rv and Rs are the radiance ratio which can be estimated as follows:
R v = 0.9332 + 0.0585 f v , R s = 0.9902 + 0.1068 f v
where fv is vegetation coverage fraction which can be estimated by NDVI i.e.,
f v = [ ( NDVI NDVI min ) / ( NDVI max NDVI min ) ] 2
NDVI = (rNIRrR)/(rNIR + rR), rNIR and rR represent the reflectance value of NIR and RED of AATSR data. ε represents emissivity of different surface types which can be calculated by combining spectral responsible function with spectral emissivity as follows:
ɛ ¯ i = λ i l λ i u ψ i ( λ ) ɛ i ( λ ) d λ / λ i l λ i u ψ i ( λ ) d λ
where ε̄i is average emissivity in band i, ψi(λ) is the spectral response function of the sensor in band i, εi(λ) is the emissivity function with the change of spectral wavelength. We get the emissivity function from the spectral database of the ground supplied by the ATSR project.

3.5 Land surface temperature retrieval

Qin et al. identify a detailed derivation for the downwelling and upwelling atmospheric radiance which can be depicted as follows:
I i = ( 1 τ i ) B i ( T a ) ; I i = ( 1 τ i ) B i ( T a )
Ta is the average temperature of upward radiance of atmosphere. T a is the average temperature of the downward radiance of atmosphere which can be replaced with Ta by considering the difference between them is little. As a result, Equation (4) can be expressed as:
B i ( T i ) = τ i ɛ i B i ( T s ) + ( 1 τ i ) [ 1 + ( 1 ɛ i ) τ i ] B i ( T a )
for AATSR data, it can be depicted as:
B 11 ( T 11 ) = τ 11 ɛ 11 B 11 ( T s ) + ( 1 τ 11 ) [ 1 + ( 1 ɛ 11 ) τ 11 ] B 11 ( T a ) B 12 ( T 12 ) = τ 12 ɛ 12 B 12 ( T s ) + ( 1 τ 12 ) [ 1 + ( 1 ɛ 12 ) τ 12 ] B 12 ( T a )
According to the previous research, we use the method proposed in Equation (9) to simplify the Planck function instead of Taylor expansion, then:
0.0782 ɛ 11 τ 11 T s = 0.0782 T 11 + 13.48 ɛ 11 τ 11 ( 1 τ 11 ) [ 1 + ( 1 ɛ 11 ) τ 11 ] ( 0.0782 T a 13.48 ) 13.48 0.0477 ɛ 12 τ 12 T s = 0.0477 T 12 + 4.96 ɛ 12 τ 12 ( 1 τ 12 ) [ 1 + ( 1 ɛ 12 ) τ 12 ] ( 0.0477 T a 4.96 ) 4.96
by solving the equations, LST can be retrieved by:
T s = ( C 12 ( b 11 + D 11 ) C 11 ( b 12 + D 12 ) ) / ( C 12 A 11 C 11 A 12 )
Where, A 11 = 0.0782 ɛ 11 τ 11 B 11 = 0.0782 T 11 + 13.48 ɛ 11 τ 11 13.48 C 11 = ( 1 τ 11 ) ( 1 + ( 1 ɛ 11 ) τ 11 ) 0.0782 D 11 = ( 1 τ 11 ) ( 1 + ( 1 ɛ 11 ) τ 11 ) 13.48 A 12 = 0.0477 ɛ 12 τ 12 B 12 = 0.0477 T 12 + 4.96 ɛ 12 τ 12 4.96 C 12 = ( 1 τ 12 ) ( 1 + ( 1 ɛ 12 ) τ 12 ) 0.0477 D 12 = ( 1 τ 12 ) ( 1 + ( 1 ɛ 12 ) τ 12 ) 4.96
From above, LST can be estimated by using AATSR and meteorological data following the general concept shown in a diagram (Figure 4).

4. Results and Validation

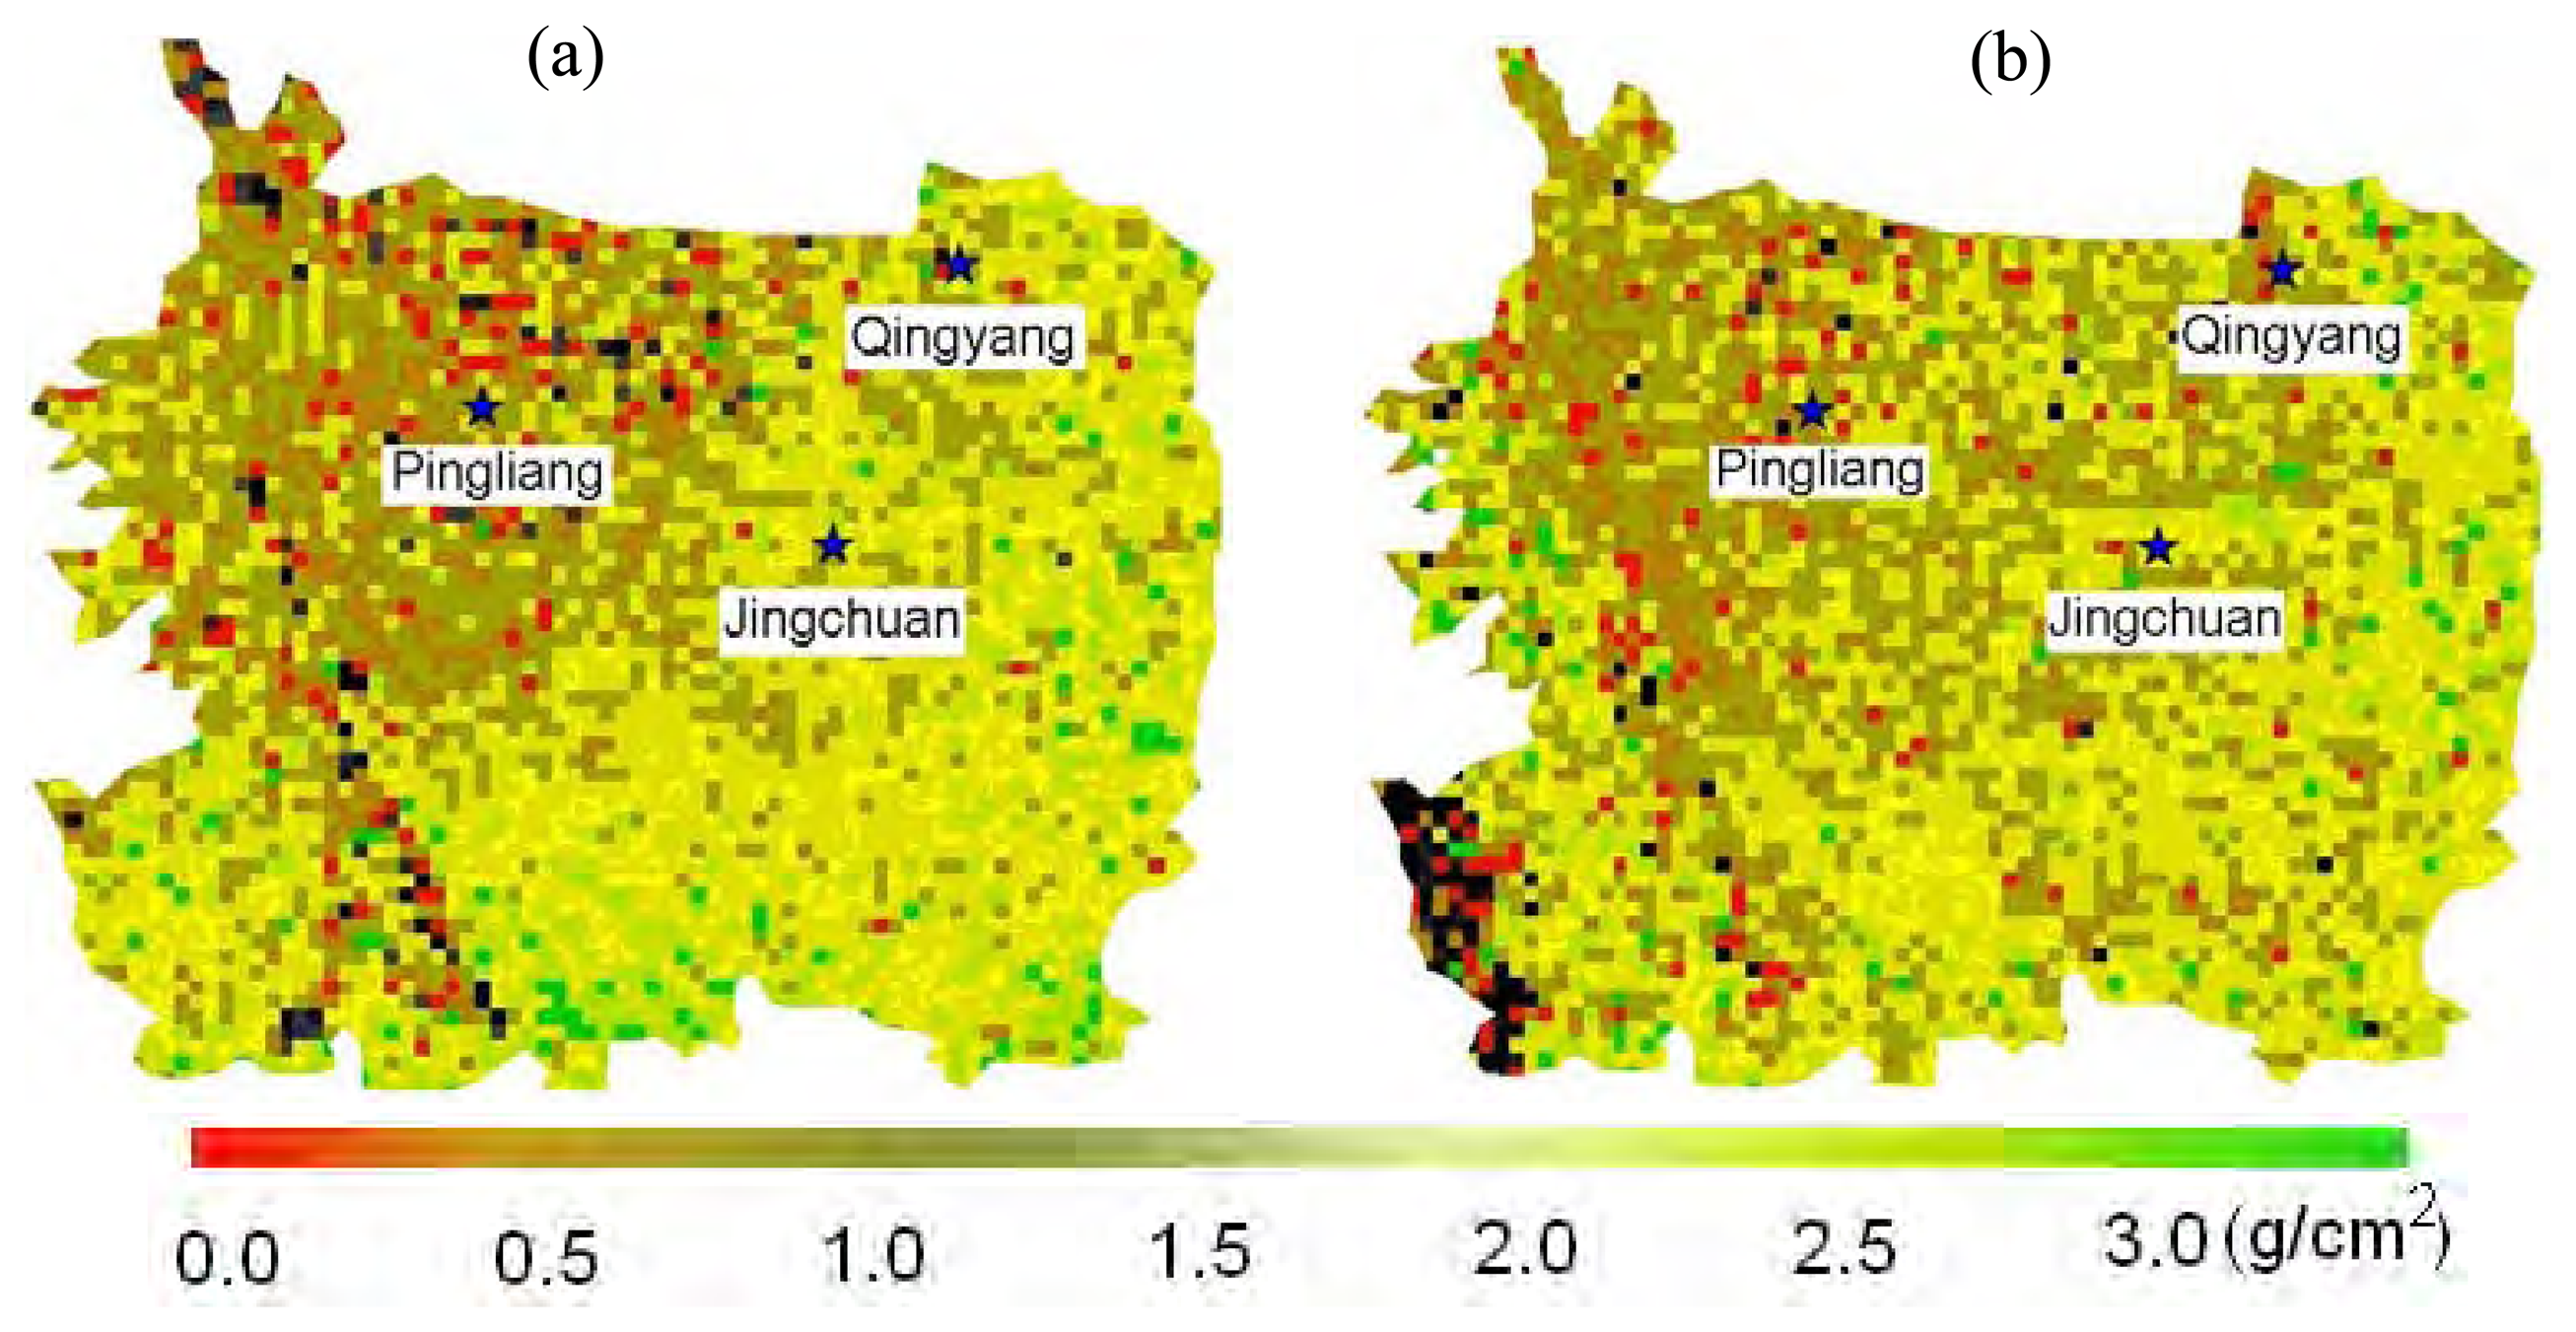
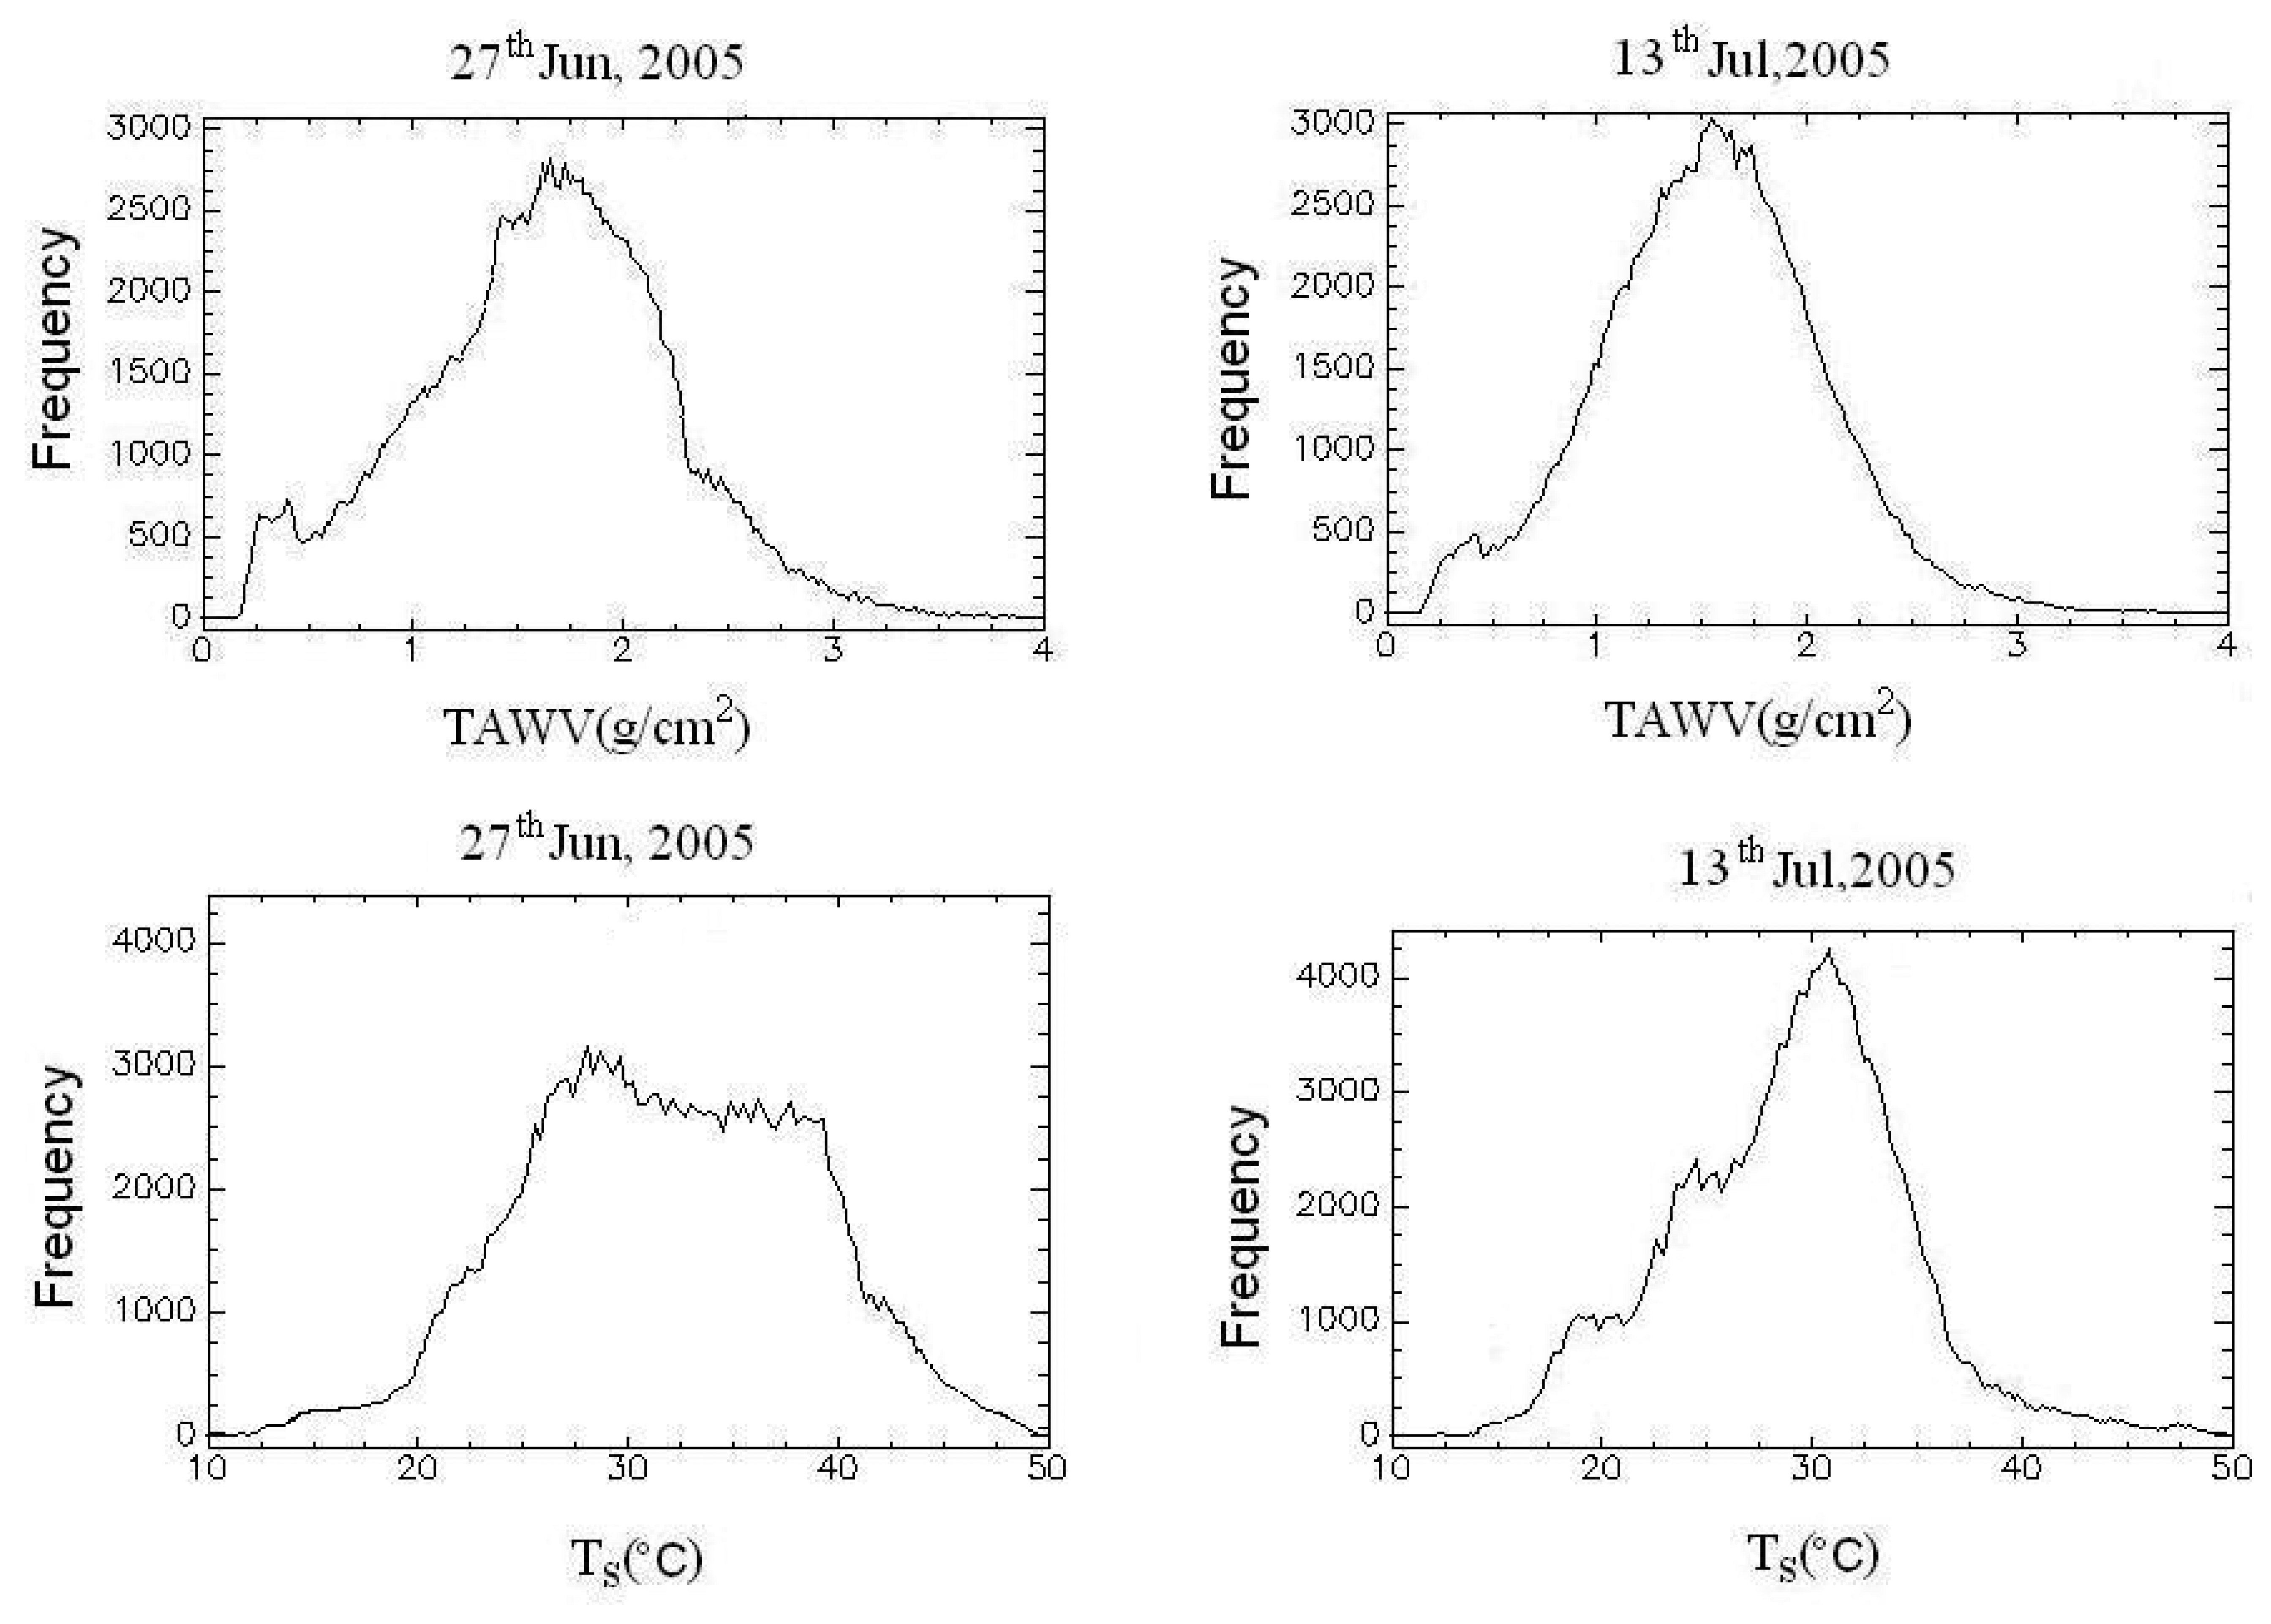
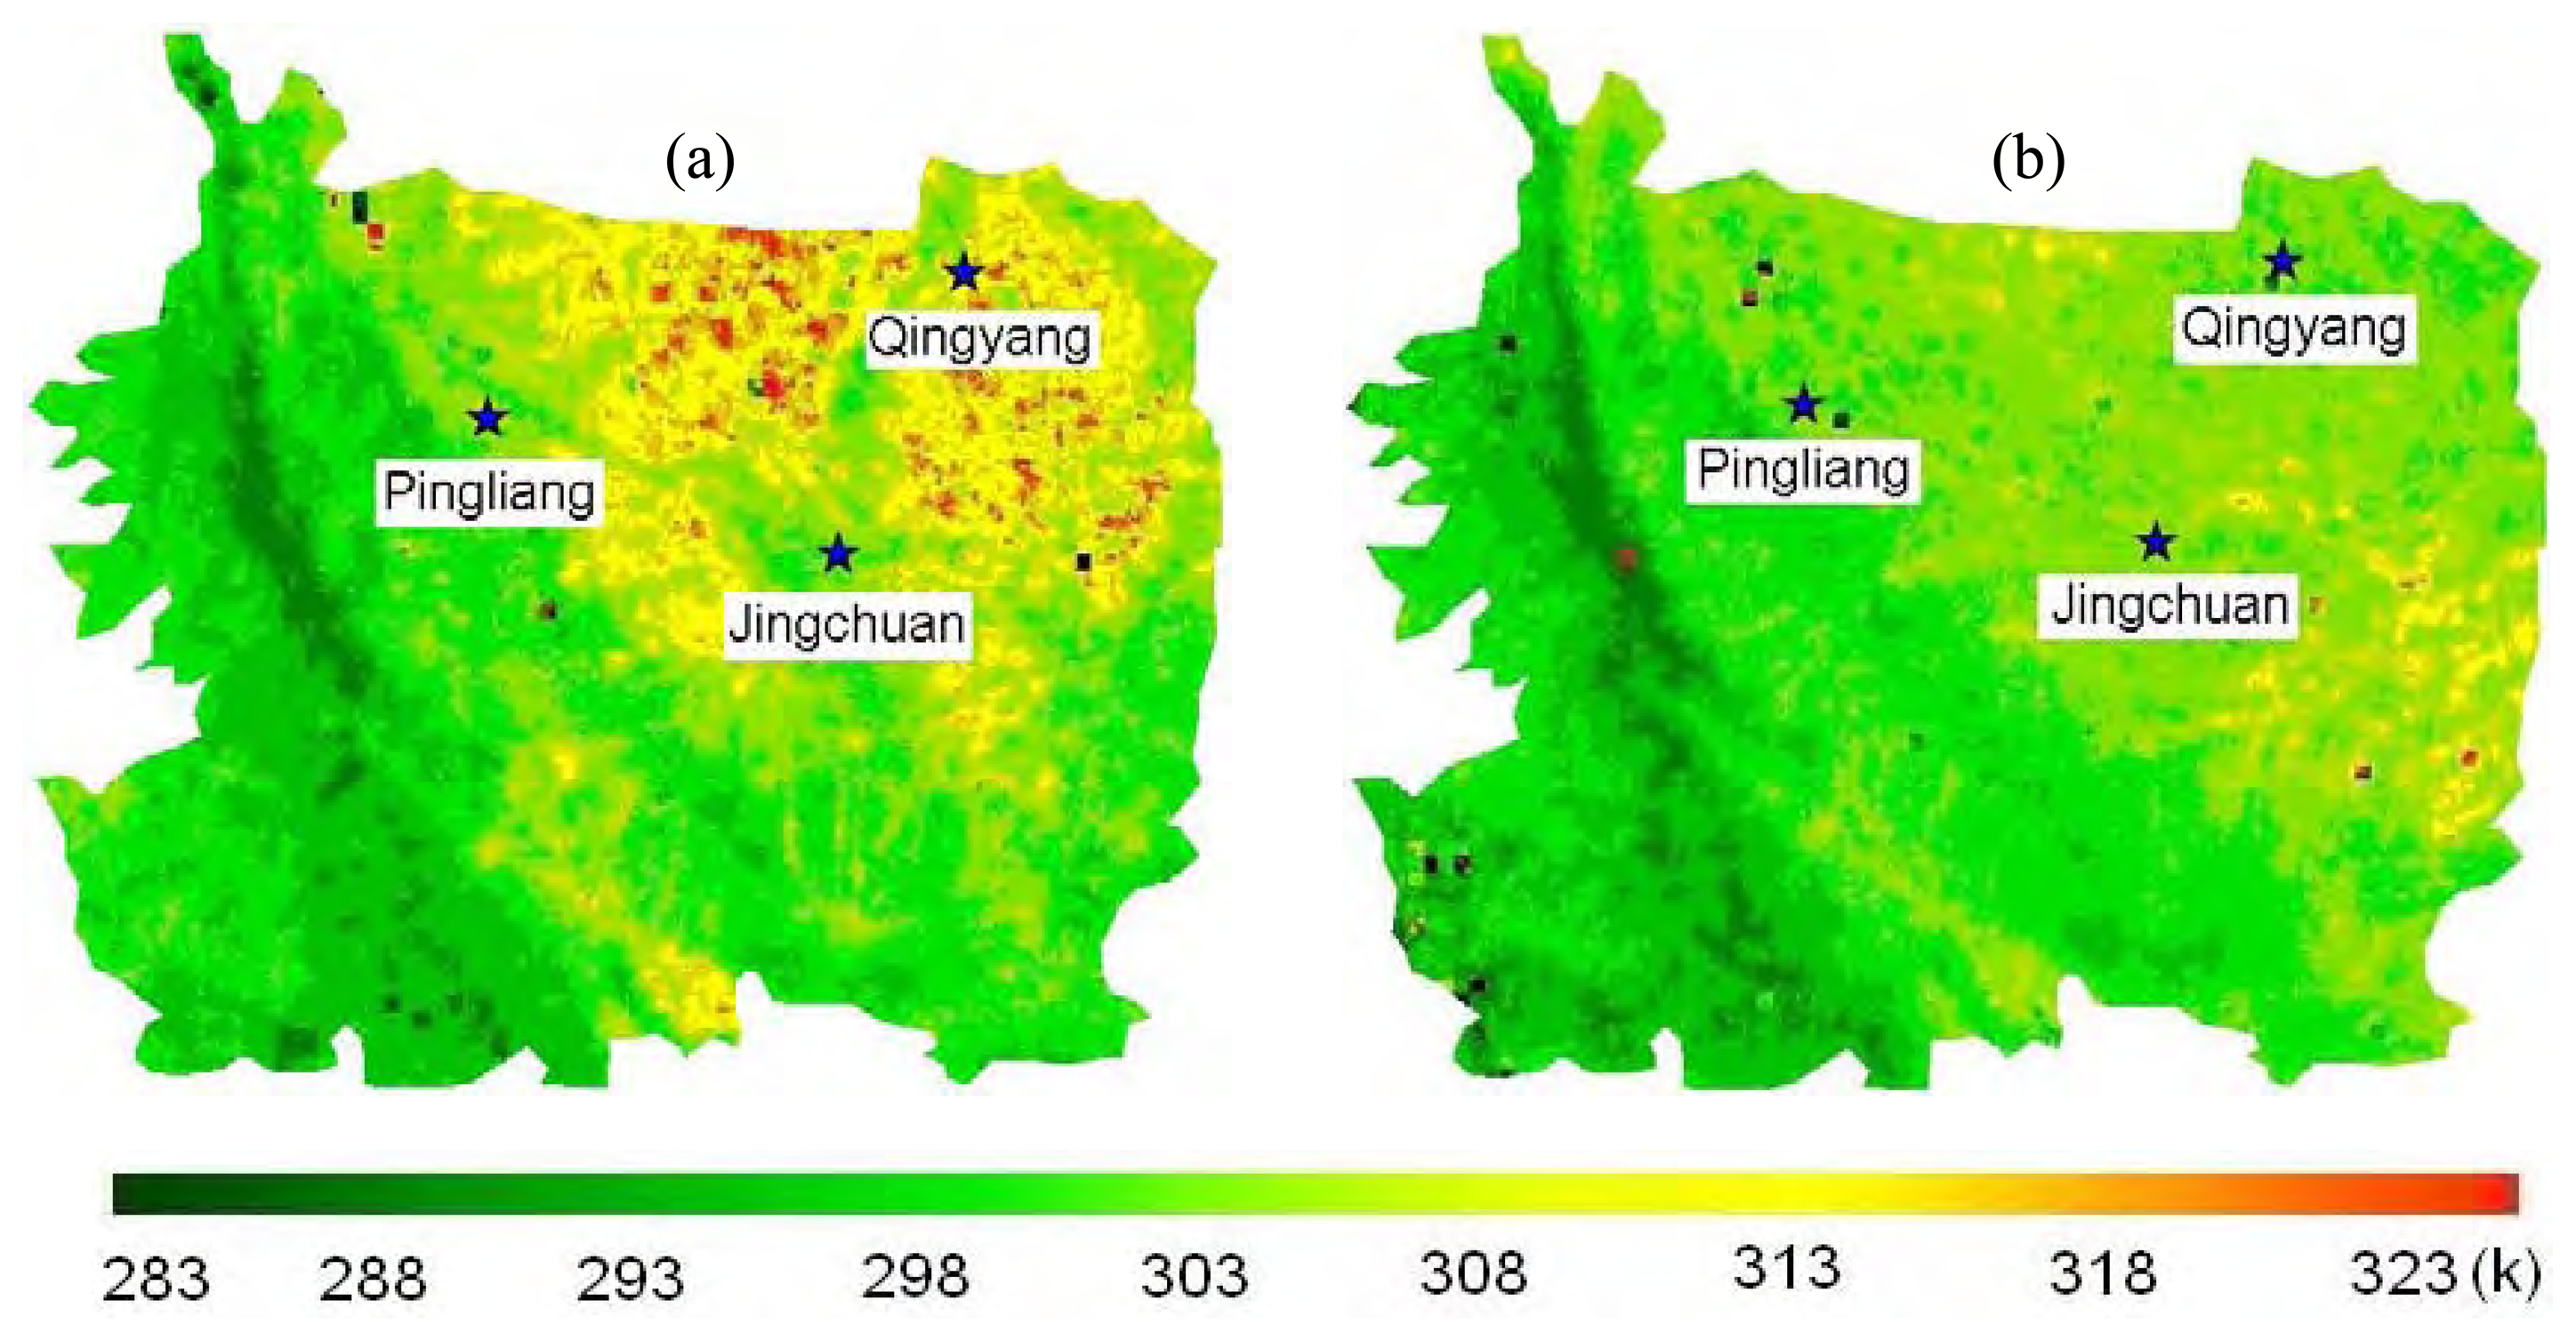
4.1 Mapping of total atmospheric water vapor content

Figure 5 shows the distribution of TAWV over the Loess Plateau in the eastern Gansu province. It shows that the atmospheric water vapor content here is evidently low, the minimum is about 0.5g/cm2, the maximum is only 3.0g/cm2, which is accord with the practice situation.
The eastern Gansu province locates at the west-north of China, the climate here is semi-arid with less precipitation and more potential evaporation, which resulted less atmospheric water vapor in this region. Because there are no measurements of TAWV and the pass time of the AATSR is not same with the MODIS atmospheric water vapor products, the validation of TAWV can not be performed, but the distribution of the atmospheric water vapor content is less in north region than that in the south region and the value is between 1.0∼3.0 g/cm2 which is consistence with the distribution of TAWV form MODIS atmospheric water vapor products. As a result, it can be regarded that the retrievals of the total atmospheric water vapor content is believable, and TAWV can be used for other investigation.

4.2 Validation of land surface temperature

The LST is retrieved by using the developed algorithm. Since the coarse resolution of the AATSR data, a 5*5 pixels rectangle is compared with the field measurements in table 1. Validation indicates that the maximum absolute derivation is 4.0 K, the corresponding relative error is 11.8%, and the average relative error is 5.0%, which shows that the retrievals are in a satisfactory agreement with the ground measurements.
Figure 6 shows the distribution of LST over the Loess Plateau in the eastern Gansu province. Combining with land surface types, LST over the Liupan Mountain is lower than that in the surroundings, the value is between 283∼293K because that the vegetation here are forests. The LST in the following grass region is between 293∼303K, lower than that over the cropland which is between 293∼313K, this is accord with the actual situation here. The crop here is wheat, which has been reaped and the temperature over this region is obviously close to that over the bare soil. From the distribution map and the comparison, the retrievals are reasonable and the LST is estimated successfully here.

4.3 Analysis on the TAWV and the LST

Figure 7 shows the difference of the TAWV and the LST of the two days. Small differences exist in the TAWV distributions and some differences exist in the LST distributions. It can be considered that both of the differences are caused by the growth and the harvestry to the crops.

5. Discussions

The developed algorithm that used for the LST retrieval from the AVHRR and MODIS data is attempted to calculate the LST from the AATSR data over the Loess Plateau in China. The results show that the estimation is successful. Comparing with the ground measurements, the maximum absolute derivation, the maximum relative error and the average relative error is 4.0K, 11.8% and 5.0% respectively, which shows that the retrievals are in a satisfactory agreement with the ground measurements, and can be used to estimate land surface heat flux in future. Comparing with the soil and foliage component temperatures retrievals from Jia et al. [27], this algorithm is quite quickly and easily to obtain the LST; only the nadir data from AATSR are used to estimate the LST can lead to less error comparing to use the six channels. However, the selection of the nadir data can not take advantage of the forward band of the AATSR and can not distinguish the soil and foliage component temperatures, this algorithm needs to be developed for the retrieval of the component temperatures in future.
The total atmospheric water vapor content over this region is calculated, but the validation is not available for lack of the actual measurements. The results are discussed only through the analysis on the distribution of the TAWV. Because the pass time of AATSR and MODIS is not same but close, the TAWV retrieved from AATSR data is checked by the MODIS TAWV products, comparisons show that the distribution of the TAWV from AATSR data is similar with the MODIS TAWV products. Meantime, the analysis on the value of the TAWV can also indicate that the retrieval is reliable. Of course, further work should be done for the observations of the sounding balloons for the best validation to the retrievals.
The application of this algorithm provides a new simple method to retrieve the LST from AATSR data. But because the resolution of AATSR is 1km, and there are no atmosphere absorption and window band, the calculation of WV is relatively complicated, and the original image are divided into many pixels of 5×5 which mixed bare soil, town and cropland together and introduced much sub-pixel information which resulted in overestimate the LST here.
Of course, it is necessary to validate more retrieval to increase the soundness and the quality of the presentation, but many images during the field experiments are cloudy, only two days presented in this paper are clear, consequently, validations have to be restricted in the two days. More validation will be considered in the future field experiments. Furthermore, we will focus on the work to understand the effect of scaling up the measurements to the 1km-resolution AATSR data.
The presented algorithm is sensible to land surface emissivity, the method calculates the emissivity used in this paper is physical based, but the ASTER emissivity library does not represent land use types over the Loess Plateau, this will cause error for the retrievals too.

Acknowledgments

This work was supported by the Centurial Program sponsored by the Chinese Academy of Sciences (2004406) and the Field Station Foundation of the Chinese Academy of Sciences. We would like to express our thanks to the people who participated the LOPEX05 field experiment.

References

  1. Wan, Z.; Dozier, J. A generalized split-window algorithm for retrieving land-surface temperature from space. IEEE Trans. Geosci. Remote Sens. 1996, 34, 892–905. [Google Scholar]
  2. Sellers, P. J.; Hall, F. G.; Asrar, G.; Strebel, D. E.; Murphy, R. E. The first ISLSCP Field Experiment (FIFE). B. Am. Meteorol. Soc. 1988, 69, 22–27. [Google Scholar]
  3. Running, S.W.; Justice, C.; Salomonson, V.; Hall, D.; Braker, J.; Kaufman, Y.; Strahler, A.; Huete, A.; Muller, J. P.; Vanderbilt, V.; Wan, Z.; Teillet, P. Terrestrial remote sensing science and algorithms planned for EOS/MODIS. Int. J. Remote Sensing 1994, 15, 3587–2620. [Google Scholar]
  4. Becker, F. L.; Li, Z. L. Towards a local split window method over land surface. Int. J. Remote Sensing 1990, 11, 369–393. [Google Scholar]
  5. Sobrino, J. A.; Coll, C.; Caselles, V. Atmospheric corrections for land surface temperature using AVHRR channel 4 and 5. Remote Sens. Environ. 1991, 38, 19–34. [Google Scholar]
  6. Franca, G. B.; Cracknell, A. P. Retrieval of land and sea surface temperature using NOAA-11 AVHRR data in northeastern Brazil. Int. J. Remote Sensing 1994, 15, 1695–1712. [Google Scholar]
  7. Stroeve, J.; Haefliger, M.; Steffen, K. Surface temperature from ERS-1 ATSR infrared thermal satellite data in polar regions. J. Appl. Meteor. 1996, 35(8), 1231–1239. [Google Scholar]
  8. Key, J. R.; Collins, J. B.; Fowler, C.; Stone, R. S. High-latitude surface temperature estimates from thermal satellite data. Remote Sens. Environ. 1997, 61(2), 302–309. [Google Scholar]
  9. Wan, Z.; Li, Z. L. A Physics-based algorithm for retrieving land-surface emissivity and temperature from EOS/MODIS data. IEEE Trans. Geosci. Remote Sensing 1997, 35, 980–996. [Google Scholar]
  10. Gillespie, A. R.; Rokugawa, S.; Matsunaga, T.; Cothern, J. S.; Hook, S.; Kahle, A. B. A temperature and emissivity separation algorithm for Advanced Spaceborne Thermal Emission and Reflection Radiometer (ASTER) images. IEEE Trans. Geosci. Remote Sensing 1998, 36, 1113–1126. [Google Scholar]
  11. Qin, Z. H.; Giorgio, D. O.; Arnon, K. Derivation of split window algorithm and its sensitivity analysis for retrieving land surface temperature from NOAA-advanced very high resolution radiometer data. J. Geophys. Res. 2001, 105, 22655–22670. [Google Scholar]
  12. Mao, K.B.; Qin, Z.H.; Shi, J.C.; Gong, P. A practical split-window algorithm for retrieving land surface temperature from MODIS data. Int. J. Remote Sensing 2004, 26(15), 3181–3204. [Google Scholar]
  13. Smith, D. L.; Delderfield, J.; Drummond, D.; Edwards, T.; Mutlow, C. T.; Read, P. D.; Toplis, G. M. Calibration of the AATSR Instrument. Adv. Space Res. 2001, 28(1), 31–39. [Google Scholar]
  14. Kimura, R.; Bai, L.; Fan, J.; Takayama, N.; Hinokidani, O. Evapo-transpiration estimation over the river basin of the Loess Plateau of China based on remote sensing. J. Arid Environ. 2006, 68, 53–65. [Google Scholar]
  15. Chen, L.D.; Huang, Z. L.; Gong, J.; Fu, B.J.; Huang, Y.L. The effect of land cover/vegetation on soil water dynamic in the hilly area of the loess plateau, China. Catena 2007, 70, 200–208. [Google Scholar]
  16. Liu, J.G. Advances in Modern Ecology; China Science and Technology Press: Beijing, 1992; pp. 69–76. [Google Scholar]
  17. Wen, J. An overview of the Loess Plateau mesa region land surface process field experiment 2005 (LOPEX05). ISPMSRS Conference Proceeding 2005, 402–404. [Google Scholar]
  18. Wen, J.; Wei, Z.G.; Lu, S.H.; Chen, S.Q.; Ao, Y.H.; Liang, L. The Characteristics of Land Surface Energy and Water Exchange over the Loess Plateau Mesa in China. Adv. Atmos. Sci. 2007, 24(2), 301–310. [Google Scholar]
  19. Chesters, D.; Uccellini, L.W.; Robinson, W.D. Low level water vapor fields from the VISSR atmospheric sounder (VAS) split window channels. J. Clim. Appl. Meteor. 1983, 22, 725–743. [Google Scholar]
  20. Fraser, R. S.; Kaufman, Y. F. The relative importance of aerosol scattering and absorption in remote sensing. IEEE Trans. Geosci. Remote Sens. 1985, 23, 625–633. [Google Scholar]
  21. Grant, W.B. Water vapor absorption coefficient in the 8-13 mm spectral region: a critical review. Appl Optics. 1990, 29, 451–462. [Google Scholar]
  22. Kaufman, Y. J.; Gao, B.C. Remote sensing of water vapor in the near IR from EOS/MODIS. IEEE Trans. Geosci. Remote Sens. 1992, 30, 871–884. [Google Scholar]
  23. King, M. D.; Kaufman, Y. J.; Menzel, W. P.; Tanre, D. Remote sensing of cloud, aerosol and water vapor. properties from the Moderate Resolution Imaging. Spectrometer (MODIS). IEEE Trans. Geosci. Remote. Sens. 1992, 30(1), 2–27. [Google Scholar]
  24. Czajkowski, K. P.; Goward, S. N.; Shirey, D.; Walz, A. Thermal remote sensing of near surface water vapor. Remote Sens. Environ. 2002, 79, 253–265. [Google Scholar]
  25. Li, Z. L.; Jia, L.; Su, Z.; Wan, Z.; Zhang, R.; H. A new approach for retrieving precipitable water from ATSR2 split-window channel data over land area. Int. J. Remote Sensing 2003, 24, 5059–5117. [Google Scholar]
  26. Berk, A.; Bernstein, L.S.; Robertson, D.C. Modtran: A Moderate Resolution Model for LOWTRAN 7. In Technical Report GL-TR-89-0122; Geophys. Lab: Bedford, MA, 1989. [Google Scholar]
  27. Jia, L.; Li, Z. L.; Menenti, M.; Su, Z.; Verhoef, W.; Wan, Z. A practical algorithm to infer soil and foliage component temperatures from bi-angular ATSR-2 data. Int. J. Remote Sensing 2003, 24, 4739–4760. [Google Scholar]
Figure 1. Location and land-use classification of the Loess Plateau in the Eastern Gansu Province.
Sensors 08 01832f1
Figure 2. MODTRAN simulated radiance at the AATSR thermal bands.
Sensors 08 01832f2
Figure 3. Atmospheric transmittance of the AATSR thermal bands with total atmospheric water vapor content simulated by MODTRAN.
Sensors 08 01832f3
Figure 4. Flow chart for retrieving land surface temperature from AATSR data.
Sensors 08 01832f4
Figure 5. Distribution of the total atmospheric water vapor content over the eastern Gansu province of the Loess Plateau (a: 27th Jun, 2005; b: 13th Jul, 2005).
Sensors 08 01832f5
Figure 6. Distribution of land surface temperature over the eastern Gansu of the Loess Plateau (a: 27th Jun, 2005; b: 13th Jul, 2005).
Sensors 08 01832f6
Figure 7. Histograms of the TAWV and the LST of the two days.
Sensors 08 01832f7
Table 1. comparison of land surface temperature between retrievals and measurements. (Retr: retrievals; Meas: measurements; RD: relative derivation; AD: absolute derivation).
DateRetr(K)Meas(K)RD(%)AD(K)
27th Jun, 2005306.03305.023.171.01
305.99304.843.631.15
305.09303.375.691.72
13th Jul, 2005311.05307.0611.804.0
304.06304.671.930.61
305.5304.283.921.22

