Article

Airborne Laser Scanning Quantification of Disturbances from Hurricanes and Lightning Strikes to Mangrove Forests in Everglades National Park, USA

by
Keqi Zhang
1,*,
Marc Simard
2,
Michael Ross
3,
Victor H. Rivera-Monroy
4,
Patricia Houle
1,
Pablo Ruiz
3,
Robert R. Twilley
4 and
Kevin Whelan
5
1
Department of Environmental Studies & International Hurricane Research Center, Florida International University, Miami, FL 33199, USA
2
Caltech-Jet Propulsion Laboratory, MS 300-319D, 4800 Oak Grove Drive, Pasadena, CA 91109, USA
3
Department of Environmental Studies & Southeast Environmental Research Center, Florida International University, Miami, FL 33199, USA
4
Wetland Biogeochemistry Institute, Department of Oceanography and Coastal Science, Louisiana State University, Baton Rouge, LA 70803, USA
5
South Florida & Caribbean Network, Inventory and Monitoring Program, National Park Service , 18001 Old Cutler Rd. Suite 419, Miami, FL 33157, USA
*
Author to whom correspondence should be addressed.
Sensors 2008, 8(4), 2262-2292; https://doi.org/10.3390/s8042262
Submission received: 5 February 2008 / Accepted: 25 March 2008 / Published: 1 April 2008
(This article belongs to the Special Issue Remote Sensing of Natural Resources and the Environment)

Abstract

:
Airborne light detection and ranging (LIDAR) measurements derived before and after Hurricanes Katrina and Wilma (2005) were used to quantify the impact of hurricanes and lightning strikes on the mangrove forest at two sites in Everglades National Park (ENP). Analysis of LIDAR measurements covering 61 and 68 ha areas of mangrove forest at the Shark River and Broad River sites showed that the proportion of high tree canopy detected by the LIDAR after the 2005 hurricane season decreased significantly due to defoliation and breakage of branches and trunks, while the proportion of low canopy and the ground increased drastically. Tall mangrove forests distant from tidal creeks suffered more damage than lower mangrove forests adjacent to the tidal creeks. The hurricanes created numerous canopy gaps, and the number of gaps per square kilometer increased from about 400∼500 to 4000 after Katrina and Wilma. The total area of gaps in the forest increased from about 1∼2% of the total forest area to 12%. The relative contribution of hurricanes to mangrove forest disturbance in ENP is at least 2 times more than that from lightning strikes. However, hurricanes and lightning strikes disturb the mangrove forest in a related way. Most seedlings in lightning gaps survived the hurricane impact due to the protection of trees surrounding the gaps, and therefore provide an important resource for forest recovery after the hurricane. This research demonstrated that LIDAR is an effective remote sensing tool to quantify the effects of disturbances such as hurricanes and lightning strikes in the mangrove forest.

1. Introduction

Mangrove forests along tropical and subtropical coasts are frequently altered by disturbances from hurricanes, frost, lightning, and insects [1-3]. These disturbances can produce various sizes of openings or gaps by causing the death of individuals or groups of trees. The disturbance process, by damaging and killing trees, followed by recruitment and competition, can shape mangrove forest structure and rearrange the distribution of species within the forest. At the landscape level, mangrove forests that are frequently disturbed show characteristic patches in various stages of stand development. Hurricanes in particular can greatly influence mangrove forest structure at the landscape level through large scale disturbances affecting hundreds to thousands of km2 [3-8]. Lugo and Snedaker [9] argued that the maximum biomass and structural dimension that mangrove forests can develop in a hurricane zone are limited by storm activity, because mangrove forests usually reach maturity in 20-25 years, a period that coincides with the frequency of hurricanes. Mangrove forests in these regions are cyclically replaced by young forests of similar structural properties through hurricane disturbances and subsequent regeneration, rather than by proceeding to another vegetation community through succession; therefore, they can be considered as a steady-state system at the landscape scale [10].
Compared to pervasive and irregular openings produced by hurricanes, gaps caused by lightning strikes are small, circular, and discrete, ranging from 50-700 m2 [11, 12]. However, formation of lightning gaps takes place more frequently because of the high occurrence of lightning strikes in tropical zones. For example, the rate of annual average lightning strikes reaches about 5-9 times per square kilometer per year in south Florida [13]. Several field studies have demonstrated that gaps are critical sites of regeneration in mangrove forests [1, 8, 12, 14]. Duke [11] hypothesized that the death and regeneration of trees in gaps caused by lightning strikes are the major process driving the turnover of mangrove forests. However, conclusions about the role of gaps in forest dynamics are mostly reached on the basis of field measurements at a limited set of individual plots [1, 14, 15]. A broader census of gaps is needed in order to better understand the large scale effect of gap dynamics on environmental and biological processes controlling mangrove forest structure and productivity. Furthermore, to our knowledge, no research has been published that quantitatively compares the roles played by large scale (e.g., hurricanes) and small scale (e.g., lightning strikes) disturbances in shaping the structure of mangrove forests. A major factor impeding this type of comparison is the difficulty in capturing the necessary large-scale view solely through plot-survey methods.
Remote sensing technology provides an alternative for investigating large scale responses of mangrove forests to disturbances from hurricanes and lightning strikes. Sherman et al. [12] utilized aerial photographs to determine the number of gaps in a mangrove forest in the Dominican Republic. However, the effectiveness of remote sensing imagery from passive optical sensors is limited in identifying mangrove gaps, due to sun shadows from the surrounding canopy merging with the openings, as well as spectral variation associated with the composition and structure of the gaps. As such, Sherman et al. [12] were not able to quantify the sizes of individual gaps in the mangrove forest from aerial photographs. Gaps are easier to identify and delineate by comparing the heights of trees within and surrounding a gap. Unfortunately, most remote sensing images from optical sensors do not provide vegetation height information. Although tree heights can be derived through stereo analysis of overlapping aerial photographs, the process is time-consuming for delineation of gaps over large areas. Airborne light detection and ranging (LIDAR) technology overcomes the drawbacks of optical imagery by providing direct measurements of ground and canopy elevations. Boutet and Weishampel [16] quantified the impact of Hurricane Fran in 1996 to the forest structure in North Carolina, USA by comparing ground and large footprint waveform LIDAR measurements before and after the hurricane. Weishampel et al. [17] documented the forest recovery status in central Massachusetts, USA after a devastating disturbance by the 1938 Hurricane using LIDAR measurements. However, the effectiveness of airborne LIDAR technology in identifying mangrove gaps has not been examined in detail.
Mangrove forests along the coasts of Everglades National Park (ENP), which are impacted both by hurricanes and lightning strikes, provide ideal sites to test the LIDAR technology for gap and opening detection. The objective of our research was therefore (1) to quantify the large scale impact of Hurricanes Katrina and Wilma in 2005 on the mangrove forest in ENP using airborne LIDAR measurements, (2) to analyze the impacts of historical hurricanes on the mangrove forest, and (3) to compare the roles of gaps formed by hurricanes and lightning strikes in shaping the structure of mangrove forests.

2. Settings and Methods

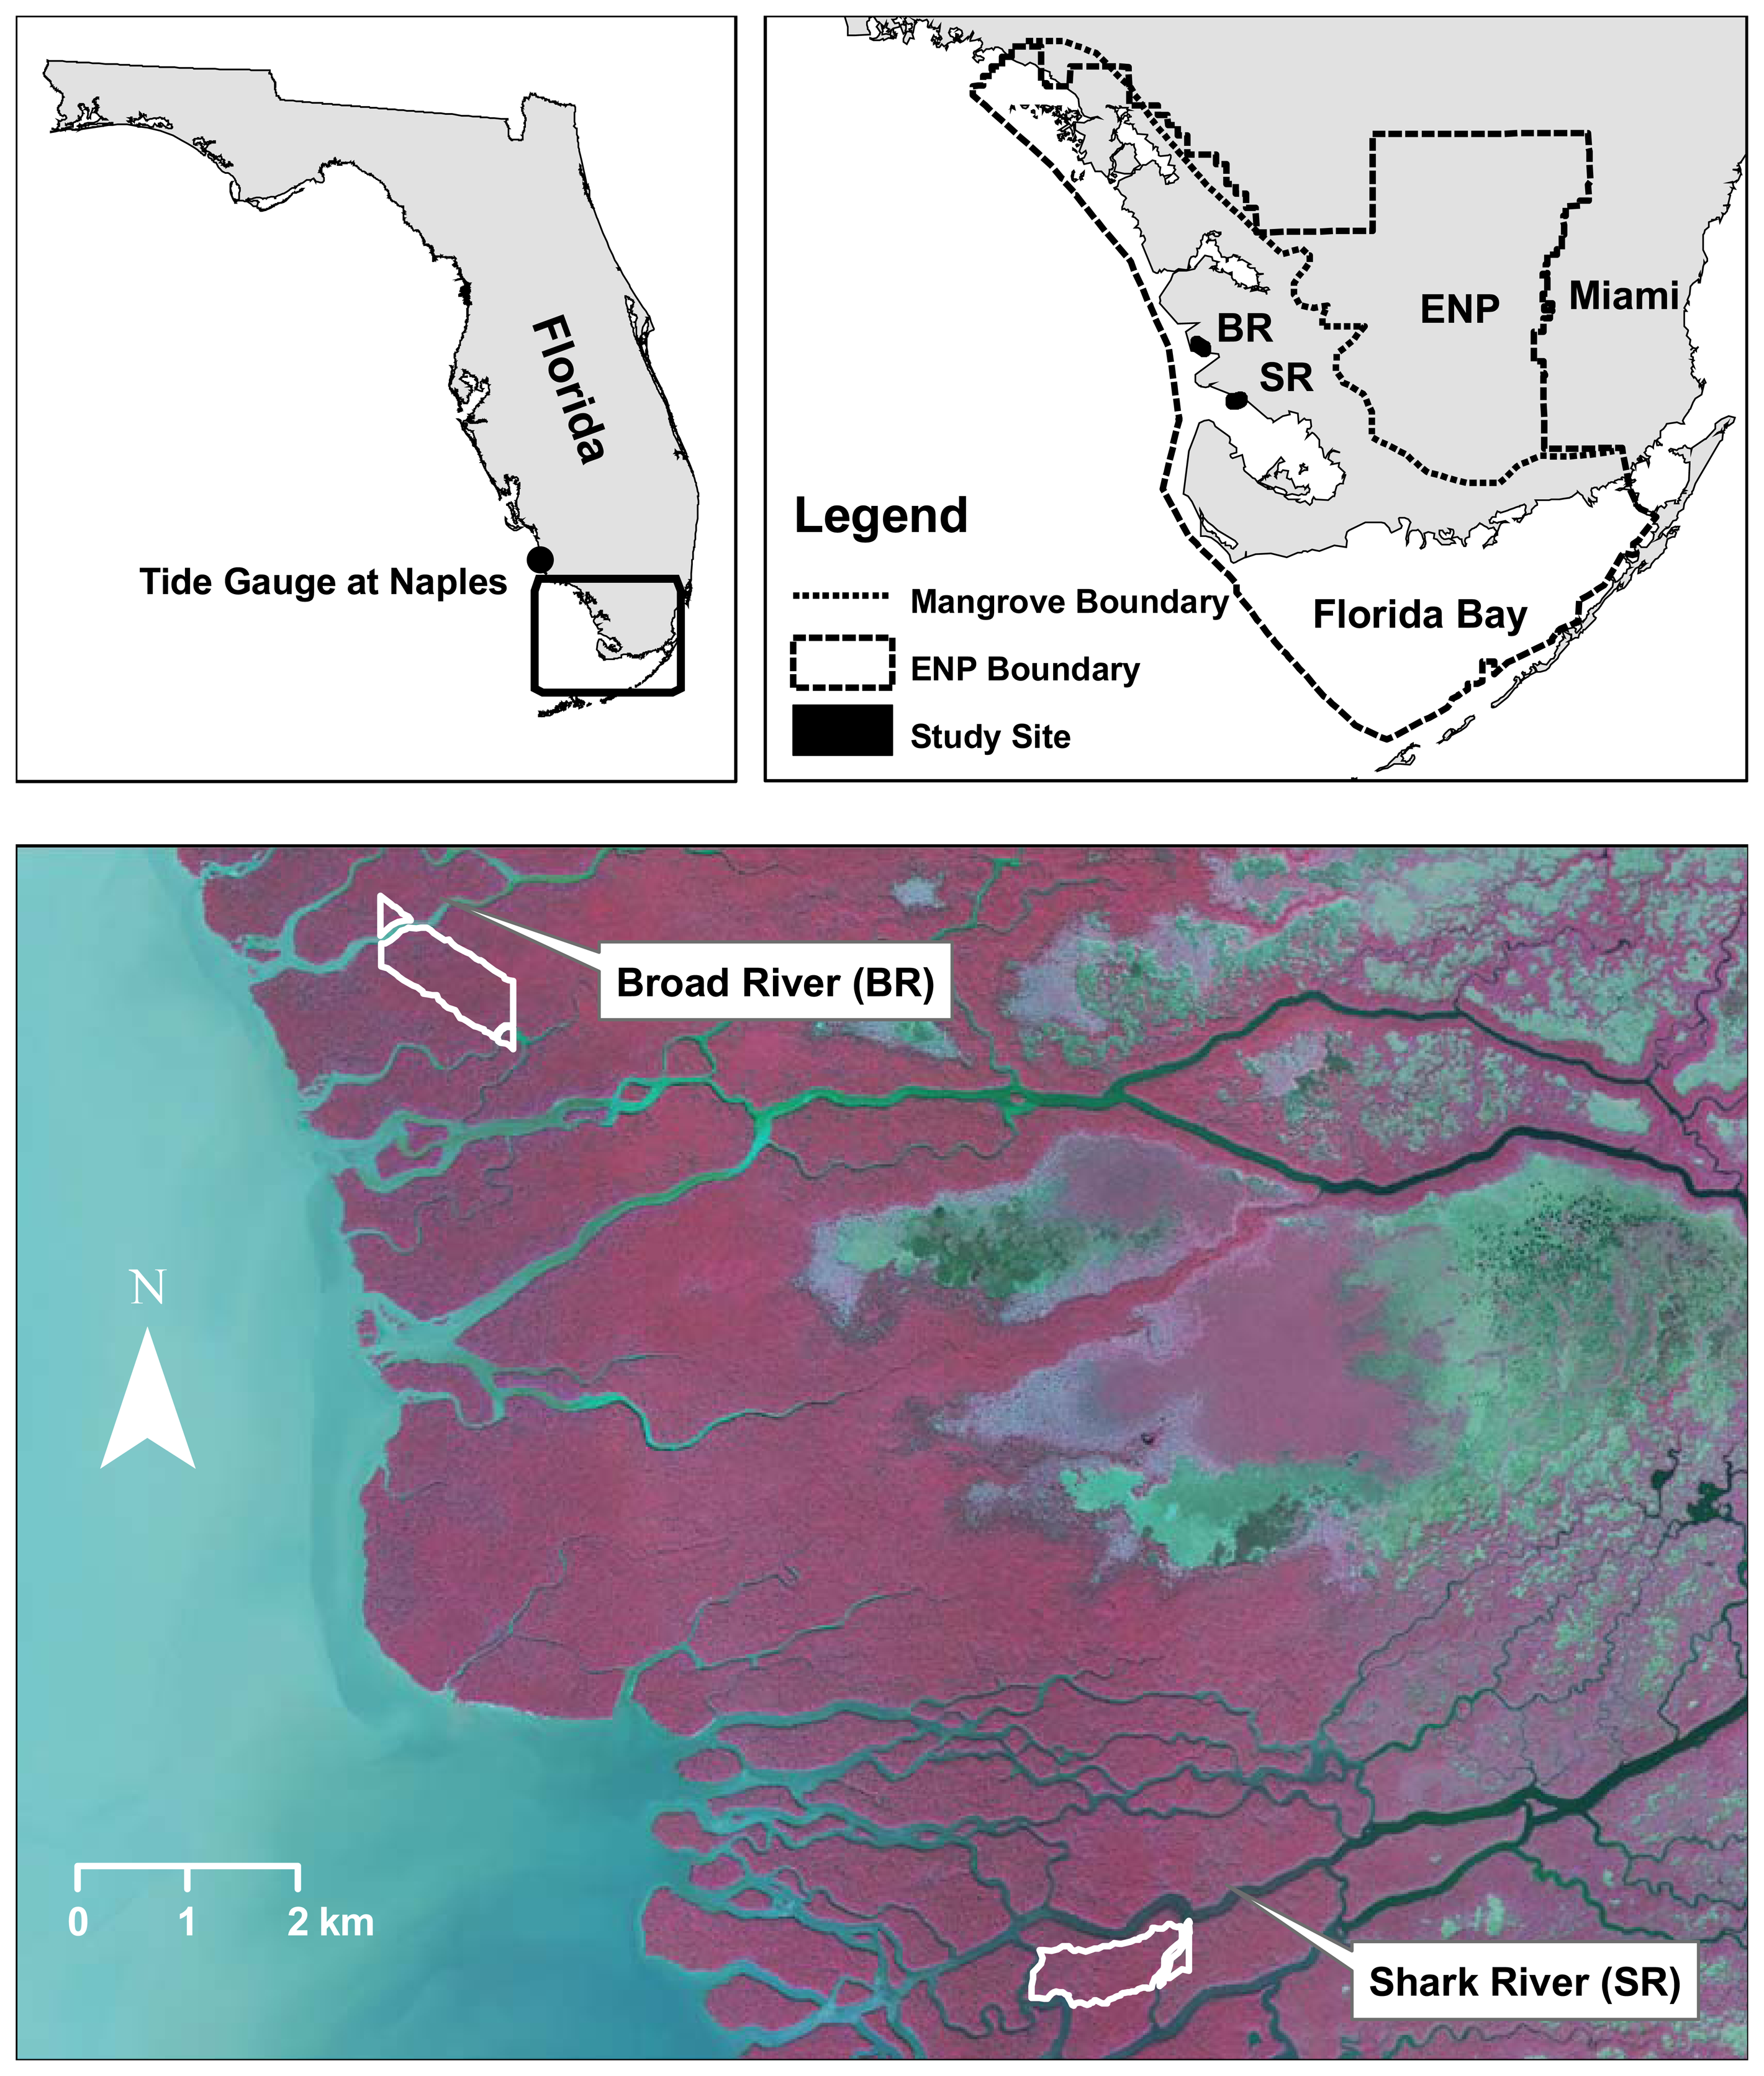
2.1. Mangrove forest in ENP

The mangrove forest in ENP is distributed along the southwest coast of Florida next to the Gulf of Mexico and the south coast adjacent to Florida Bay (Figure 1). The dominant species of the forest are Rhizophora mangle (red mangrove), Laguncularia racemosa (white mangrove), and Avicennia geminans (black mangrove). A warm subtropical climate, nearly flat topography, low wave energy, and slow sea level rise (about 2.0 mm/yr) provide favorable conditions for mangrove growth. Numerous interconnected tidal creeks and small lakes weave through the mangrove forest. The width of the mangrove zone varies from 5-20 km along the coast, depending upon topography, the range of tidal flooding, and the amount of freshwater from the Everglades [18]. The average daily tidal range at Naples, 100 km north of the study area, is about 0.6 m ( www.noaa.gov). The mangrove forest is frequently impacted by hurricanes because south Florida is subject to tropical storms from both the Atlantic Ocean and Gulf of Mexico. Prior to 2005, the most recent storms to catastrophically impact the mangrove zone of ENP were Hurricanes Donna in 1960 and Andrew in 1992 [5, 6].
The mangrove forest in ENP is not directly impacted by the recent urbanization of south Florida because of the protection offered by the Park. However, canals and levees built in the last 100 years for agricultural purposes and flood control have segmented the watershed north of ENP, reduced the amount of freshwater entering ENP, and altered the flow pattern through the Everglades [19]. The freshwater reduction combined with sea level rise has resulted in a 1.5 km average landward migration of mangrove zones over the southeastern Everglades since the 1940s [20].

2.2. Hurricanes Katrina and Wilma

Hurricane Katrina, approaching from the Atlantic Ocean, made landfall as a Category 1 hurricane near the border of Miami-Dade County and Broward County in Florida at 22:30 Coordinated Universal Time (UTC) on August 25, 2005 [21]. Katrina crossed South Florida along a west-southwest direction and entered the Gulf of Mexico about six hours later, impacting the mangrove zone in western ENP (Figure 1). Surface wind speeds, produced by integrating wind measurements from various observation platforms by the Hurricane Research Division of the National Weather Service [22], reached about 28 m/s and 33 m/s at the Broad River and Shark River sites, respectively, at 06:00 UTC on August 26.
Hurricane Wilma, coming from the Gulf of Mexico, made landfall as a Category 3 hurricane on the southwest Florida coast between Everglades City and Cape Romano around 10:30 UTC on October 24, 2005. Wilma then crossed the south Florida Peninsula and entered the Atlantic Ocean. Wilma had an extraordinarily wide eye, with a diameter of 89-105 km (55-65 miles) at landfall. Wilma's eye wall, having the hurricane's strongest winds, impacted virtually all portions of the two study sites (Figure 1) as the hurricane moved inland. The surface wind data at 10:30 UTC showed wind speeds of about 43 m/s at the Broad River site and 46 m/s at the Shark River site. The study sites were impacted twice by high winds because the winds on the trailing (southwest) side of the eye wall were as strong as those on the leading (northeast) side [23]. Since Wilma was a much stronger hurricane (category 3) than Katrina (category 1) when it made landfall, Wilma produced most of the damage to the mangrove forests at the study sites.

2.3. Historical hurricanes impacting the mangrove in ENP

Hurricanes frequently make landfall in the study area. The impact of a hurricane on the mangrove forest is usually due to its high winds, though high storm tide and the accompanying deposition of sediments can also be lethal to mangroves close to the shoreline [5]. The hurricane wind is calm at the center of the eye, increases rapidly and reaches the maximum at the eye wall, and decreases toward the outside of the storm. The radius of maximum wind is the distance from the center of the eye to the point with maximum wind speed. There is the following relationship between the radius of maximum wind Rmax, to maximum wind speed Vmax, and latitude φ for most hurricanes [24]:
R max = 46.29 exp ( 0.0153 V max + 0.0166 φ )
The relationship expressed in Equation (1) indicates that intense hurricanes typically have a large Vmax, a small Rmax, and tight eye, while the weak hurricanes have a small Vmax, large Rmax, and a more diffuse eye. Rmax typically ranges from 40 to 24 km for category 1, 2, 3, 4, and 5 hurricanes (Table 1).
One way to understand the effect of hurricanes on the mangrove forest in ENP is to analyze the consequences of past events. Track data for historical hurricanes throughout the North Atlantic basin are available from the National Hurricane Center (NHC) of the National Oceanic and Atmospheric Administration ( www.nhc.noaa.gov). In extracting historical hurricanes likely to have influenced the mangrove zone of ENP from the NHC database, we assumed a radius of 50 km for damaging winds (Table 1) because winds drop rapidly outside the point of maximum wind speed and Rmax is typically less than 50 km. Therefore, a polygon which represents the mangrove zone in ENP was digitized, and a 50 km buffer around the polygon was added. Hurricane tracks intersecting the buffer polygon were extracted in a geographic information system along with associated parameters including maximum wind speed and pressure.

2.4. LIDAR data collection

LIDAR data were collected on May 13-15, 2004 and June 2-3, 2006 using an Optech ALTM 1233 system mounted in a Cessna 337 aircraft. The LIDAR system utilized a 33 kHz pulsed near infrared (1.1 μm) laser and recorded both first and last returns of an emitted laser pulse. An average flight height of 500 meters produced a 360 m wide swath of 0.13 m wide laser footprints, spaced 0.6 m in the cross-track direction and 2 m maximum spacing in the along-track direction. Four transects with lengths of 8-25 km were flown in opposite directions with approximately a 50% overlap. Data from overlapping portions between swaths were checked for internal consistency of LIDAR surveys. The uncertainty in the elevations was estimated by comparison of the LIDAR data with a GPS ground survey that measured a road surface in the park. The result shows that the root mean square (RMS) error of LIDAR measurements is about 0.14 m. Two 1400 m by 500 m strips along the Broad River and Shark River at the west coast of ENP (Figure 1) were selected for detailed analysis. The Shark River site is about 2.7 km landward from the mouth of Shark River, and the Broad River site is about 1.3 km landward from the mouth of Broad River (Figure 1).

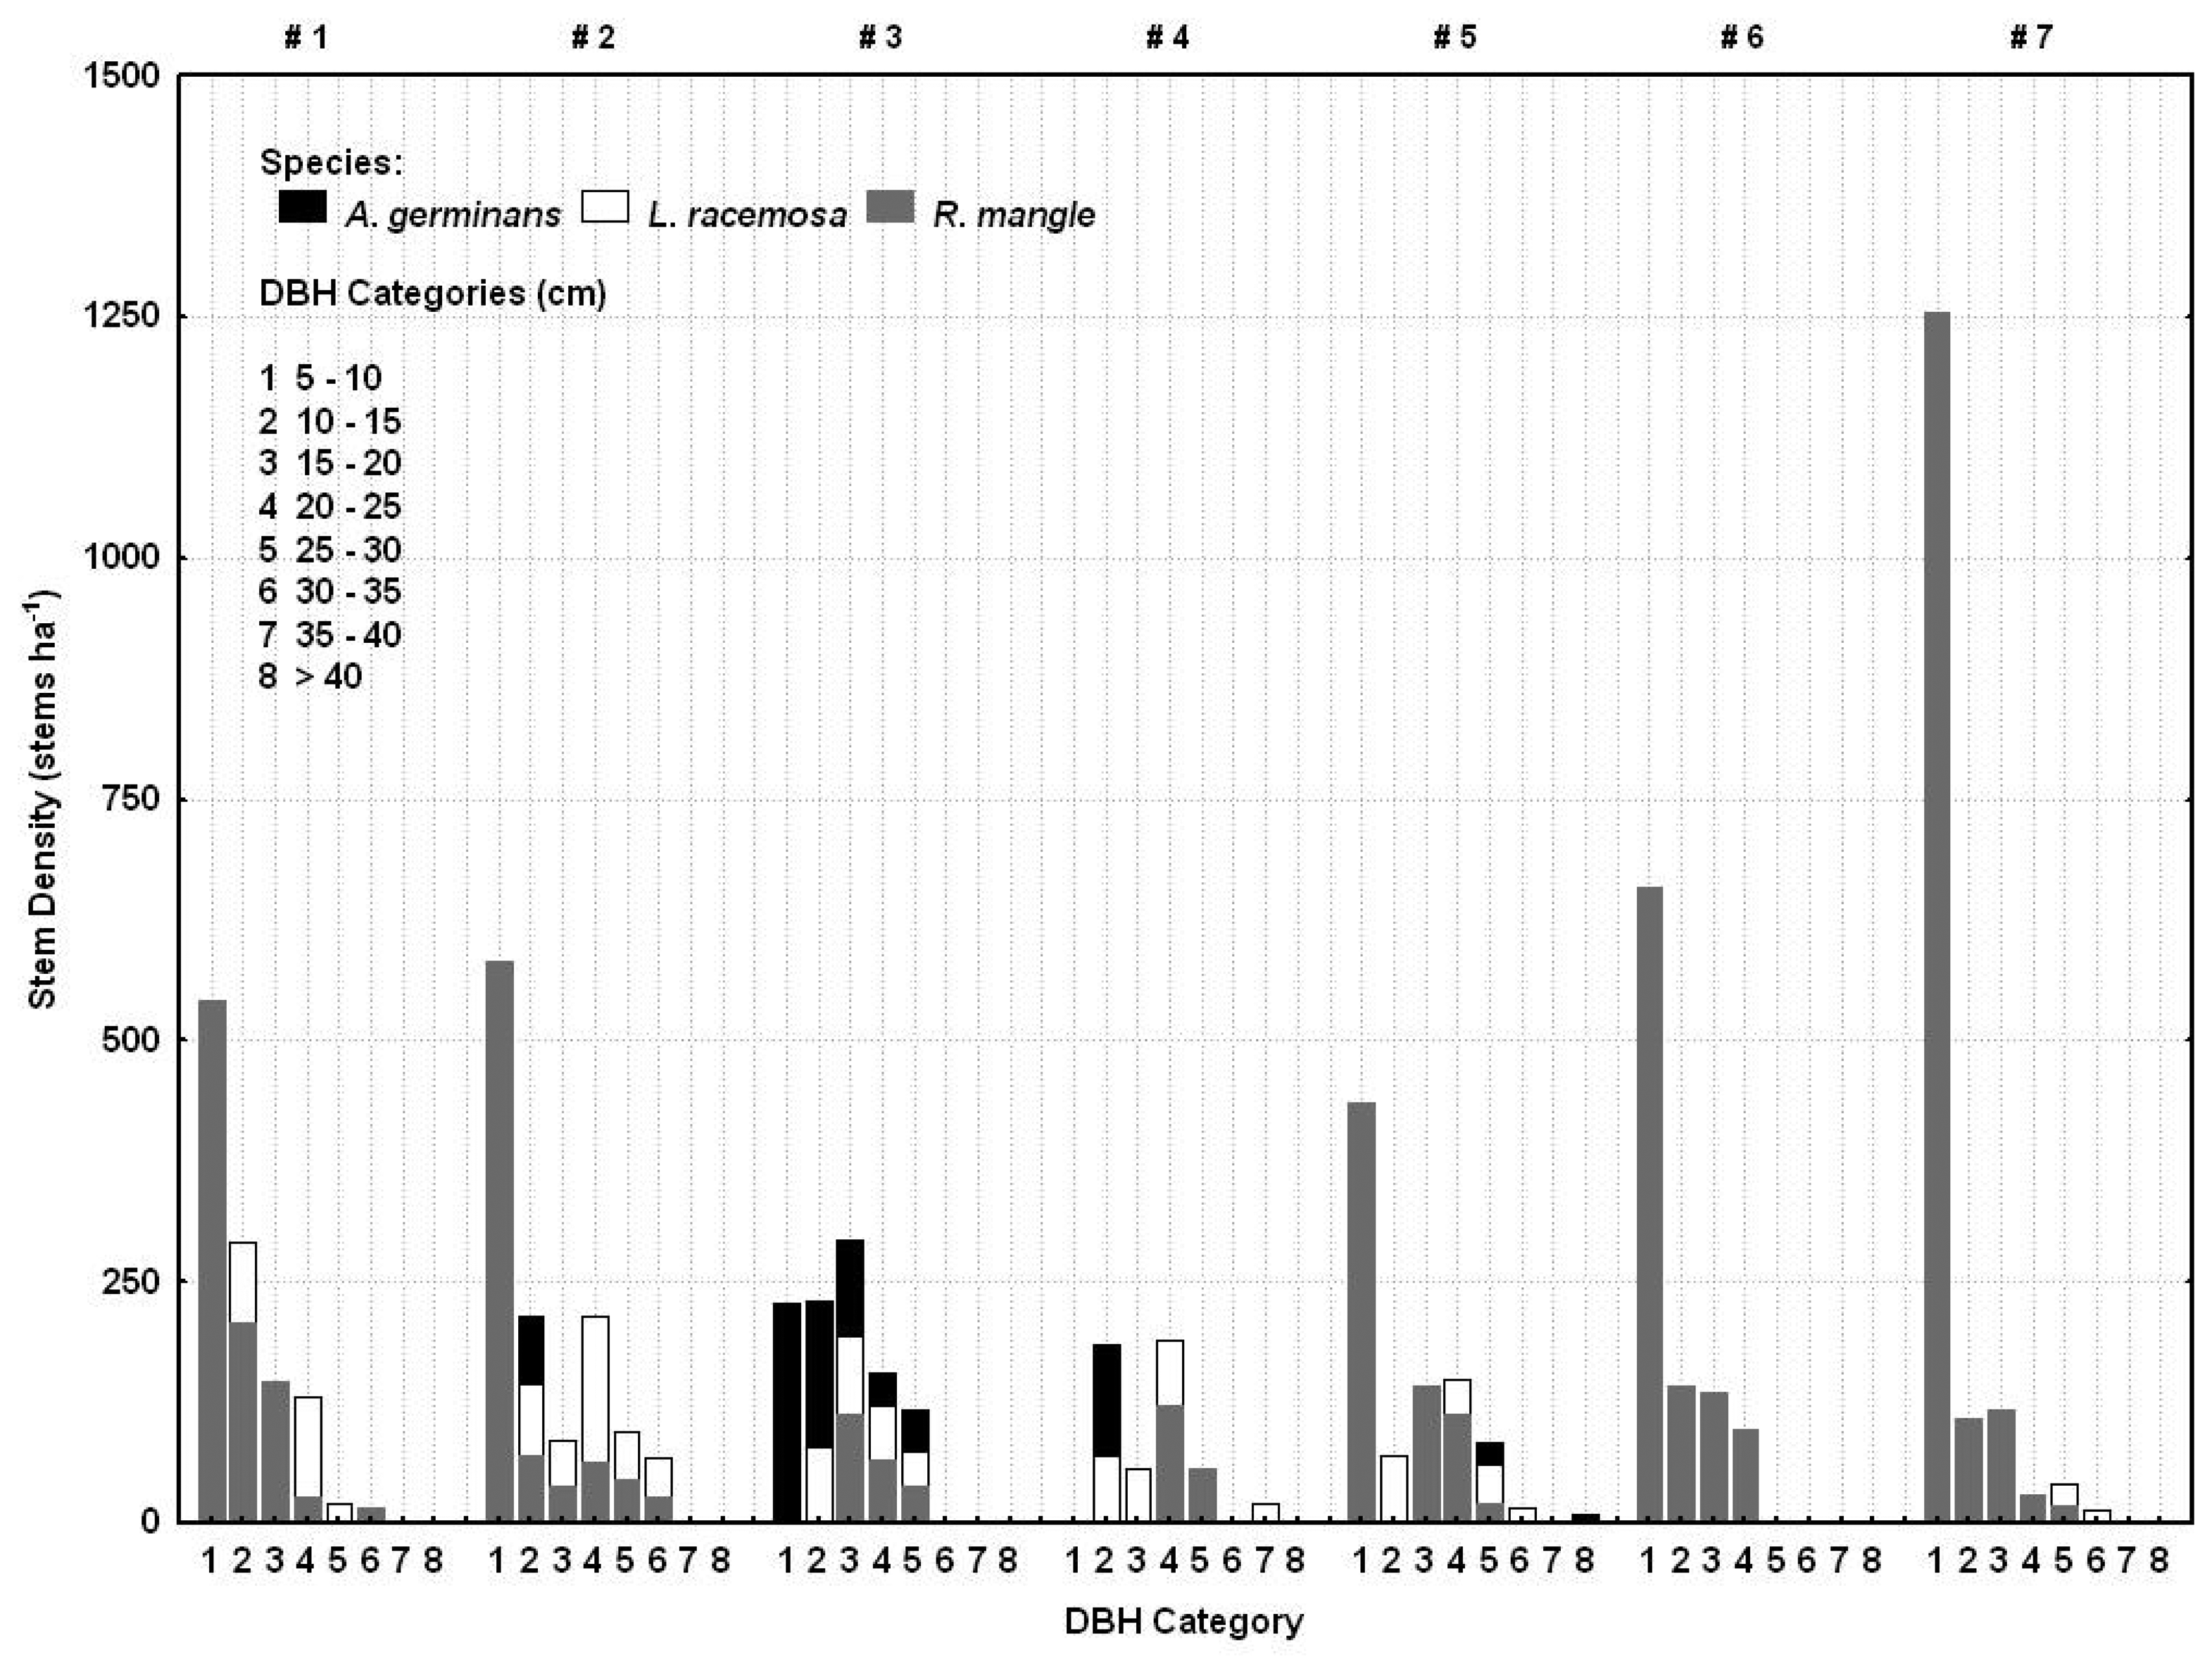
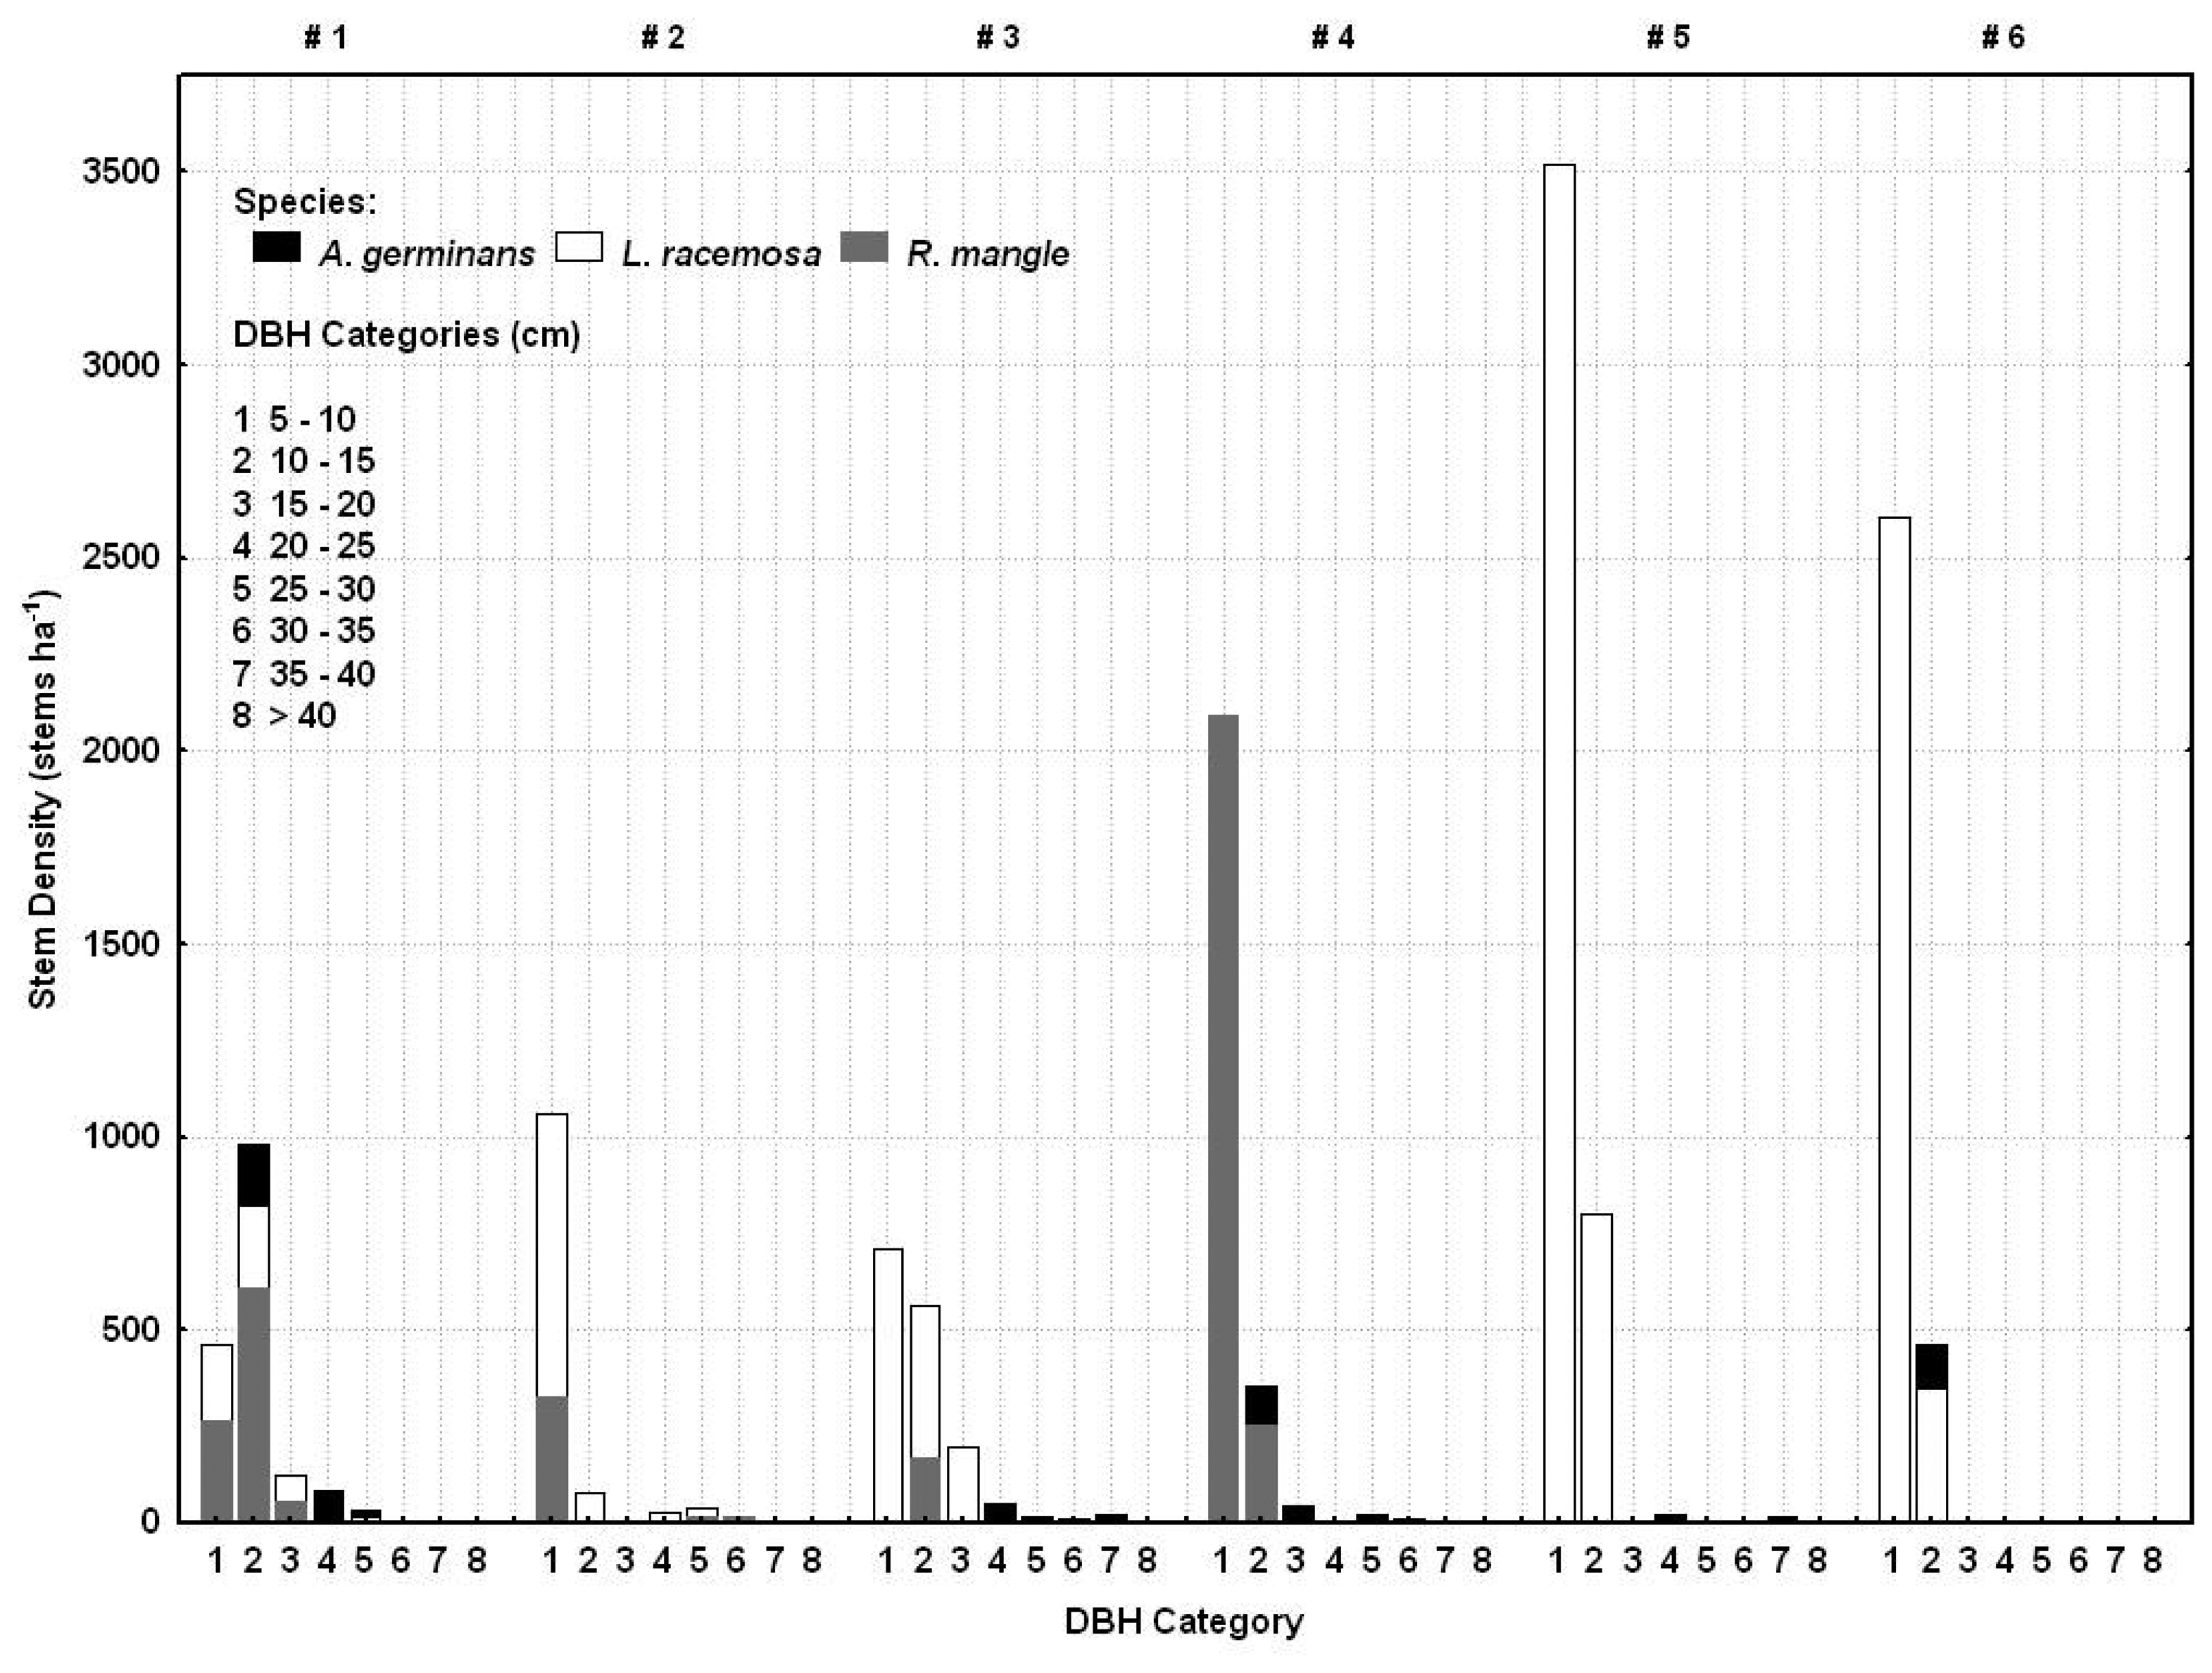
2.5. Ground survey of trees

Trees were surveyed on the ground along two transects within the Broad River and Shark River study sites on November 2-4, 2004. Sampling points for all three size classes were established at variable distances along each transect, with locations pre-determined to sample canopy variation evident in the LIDAR data from the area (Figure 2). We employed a nested circular plot for saplings (>1 m height, ≤5 cm DBH) and seedlings (<1 m height), and a plotless technique to sample trees > 5 cm diameter at breast height (DBH). The radii of the sapling and seedling plots were 2 m and 1 m, respectively. Our tree sampling method was an “angle count sampling (ACS)” technique first proposed by Bitterlich [25] and introduced into the U.S. by Grosenbaugh [26]. We noted the species, measured trunk diameter at breast height using a scale, measured the total height and height to base of crown (point of attachment of lowest branch) of each tree using a laser hypsometer, and the height and lateral extent of prop roots of R. mangle individuals.

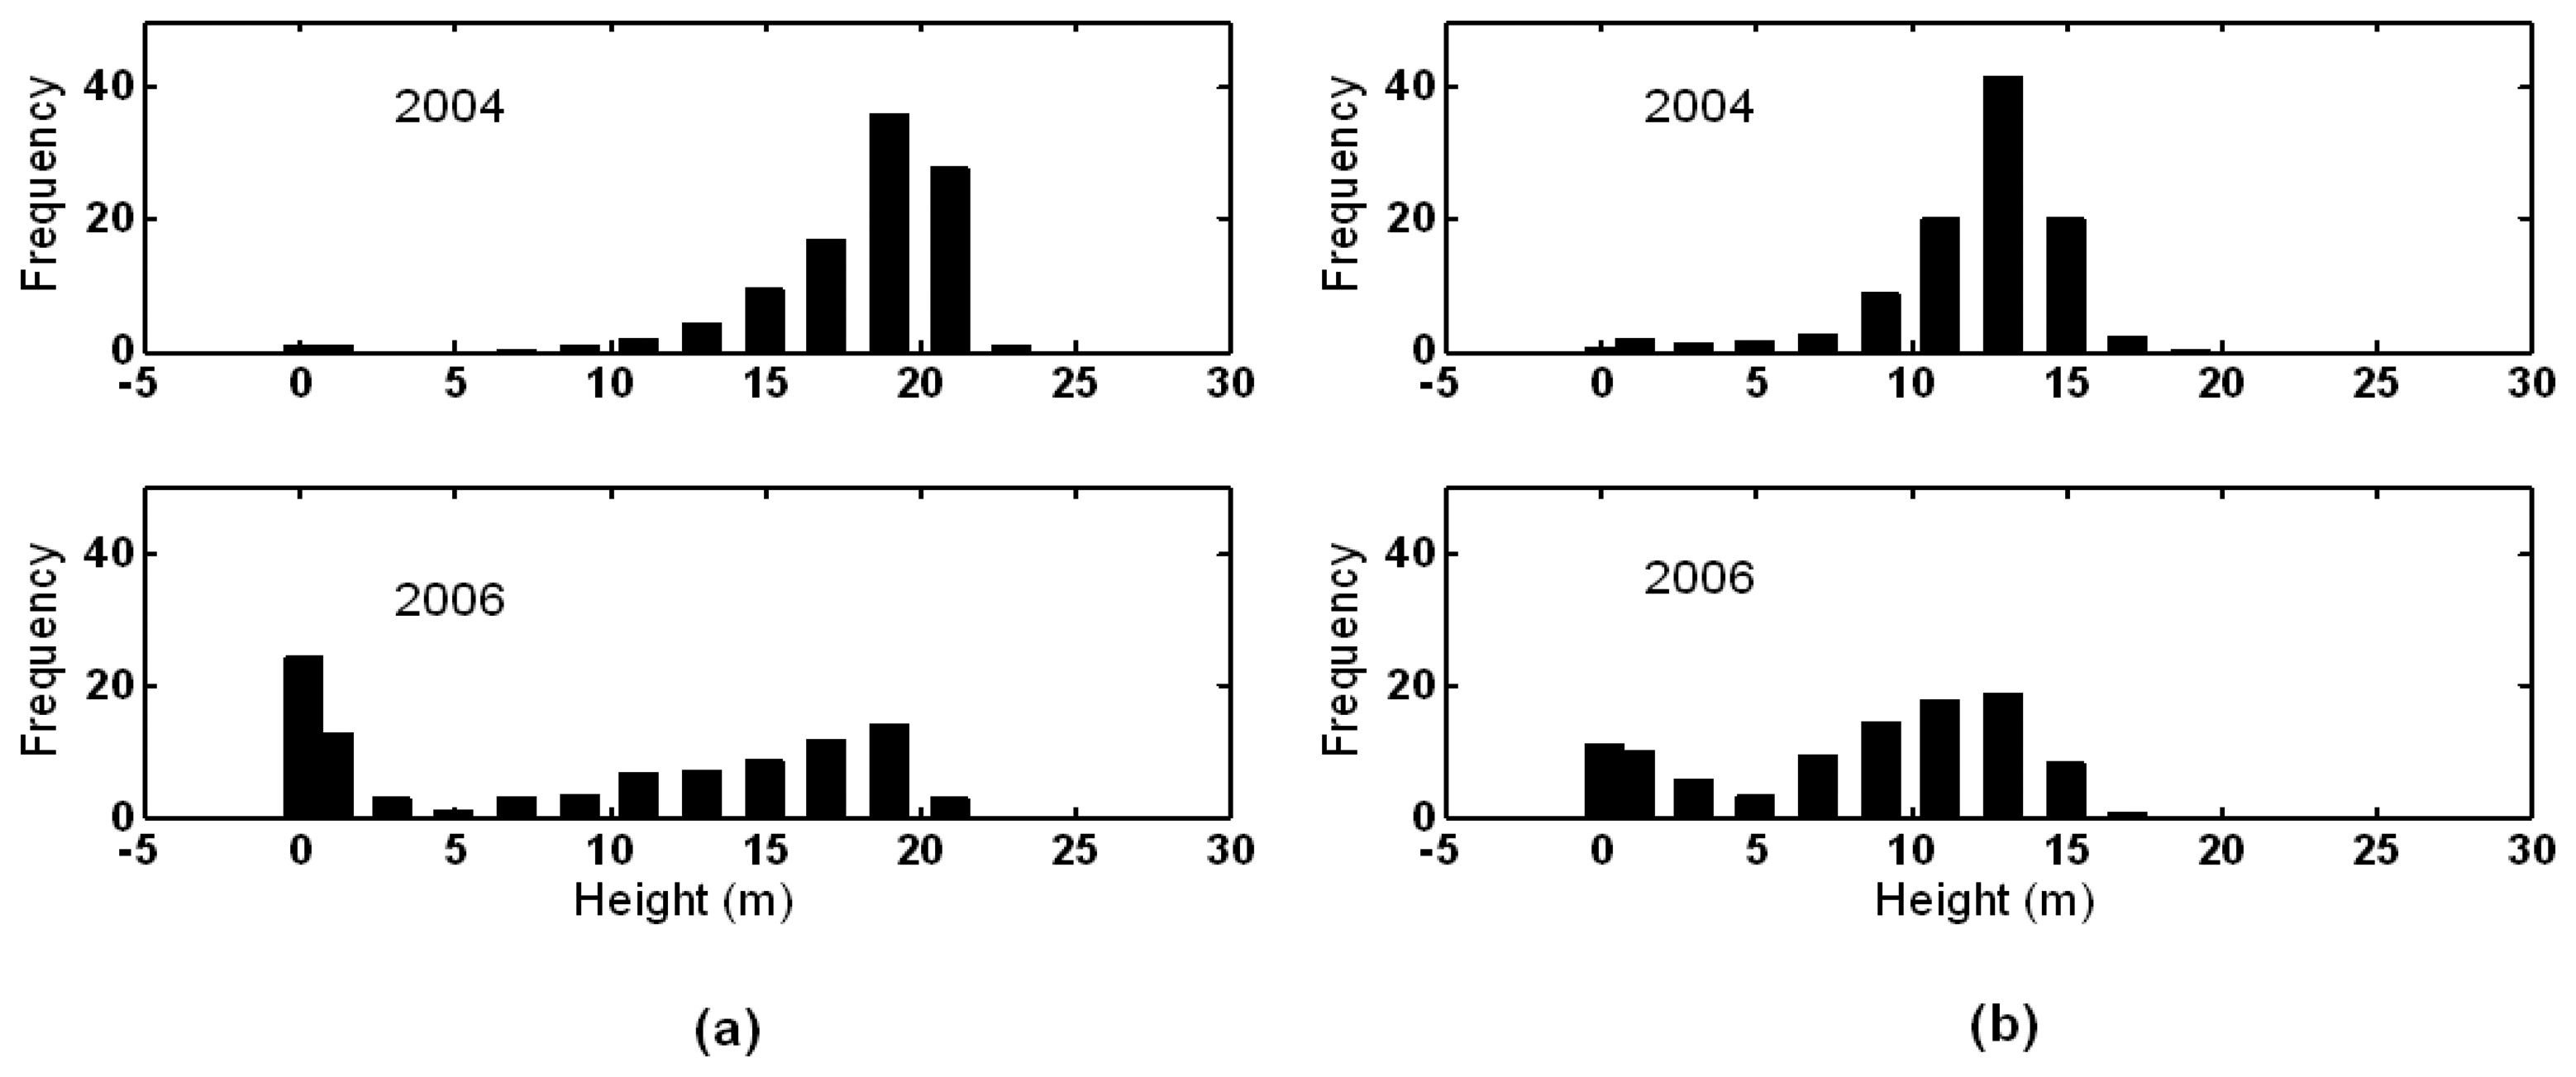
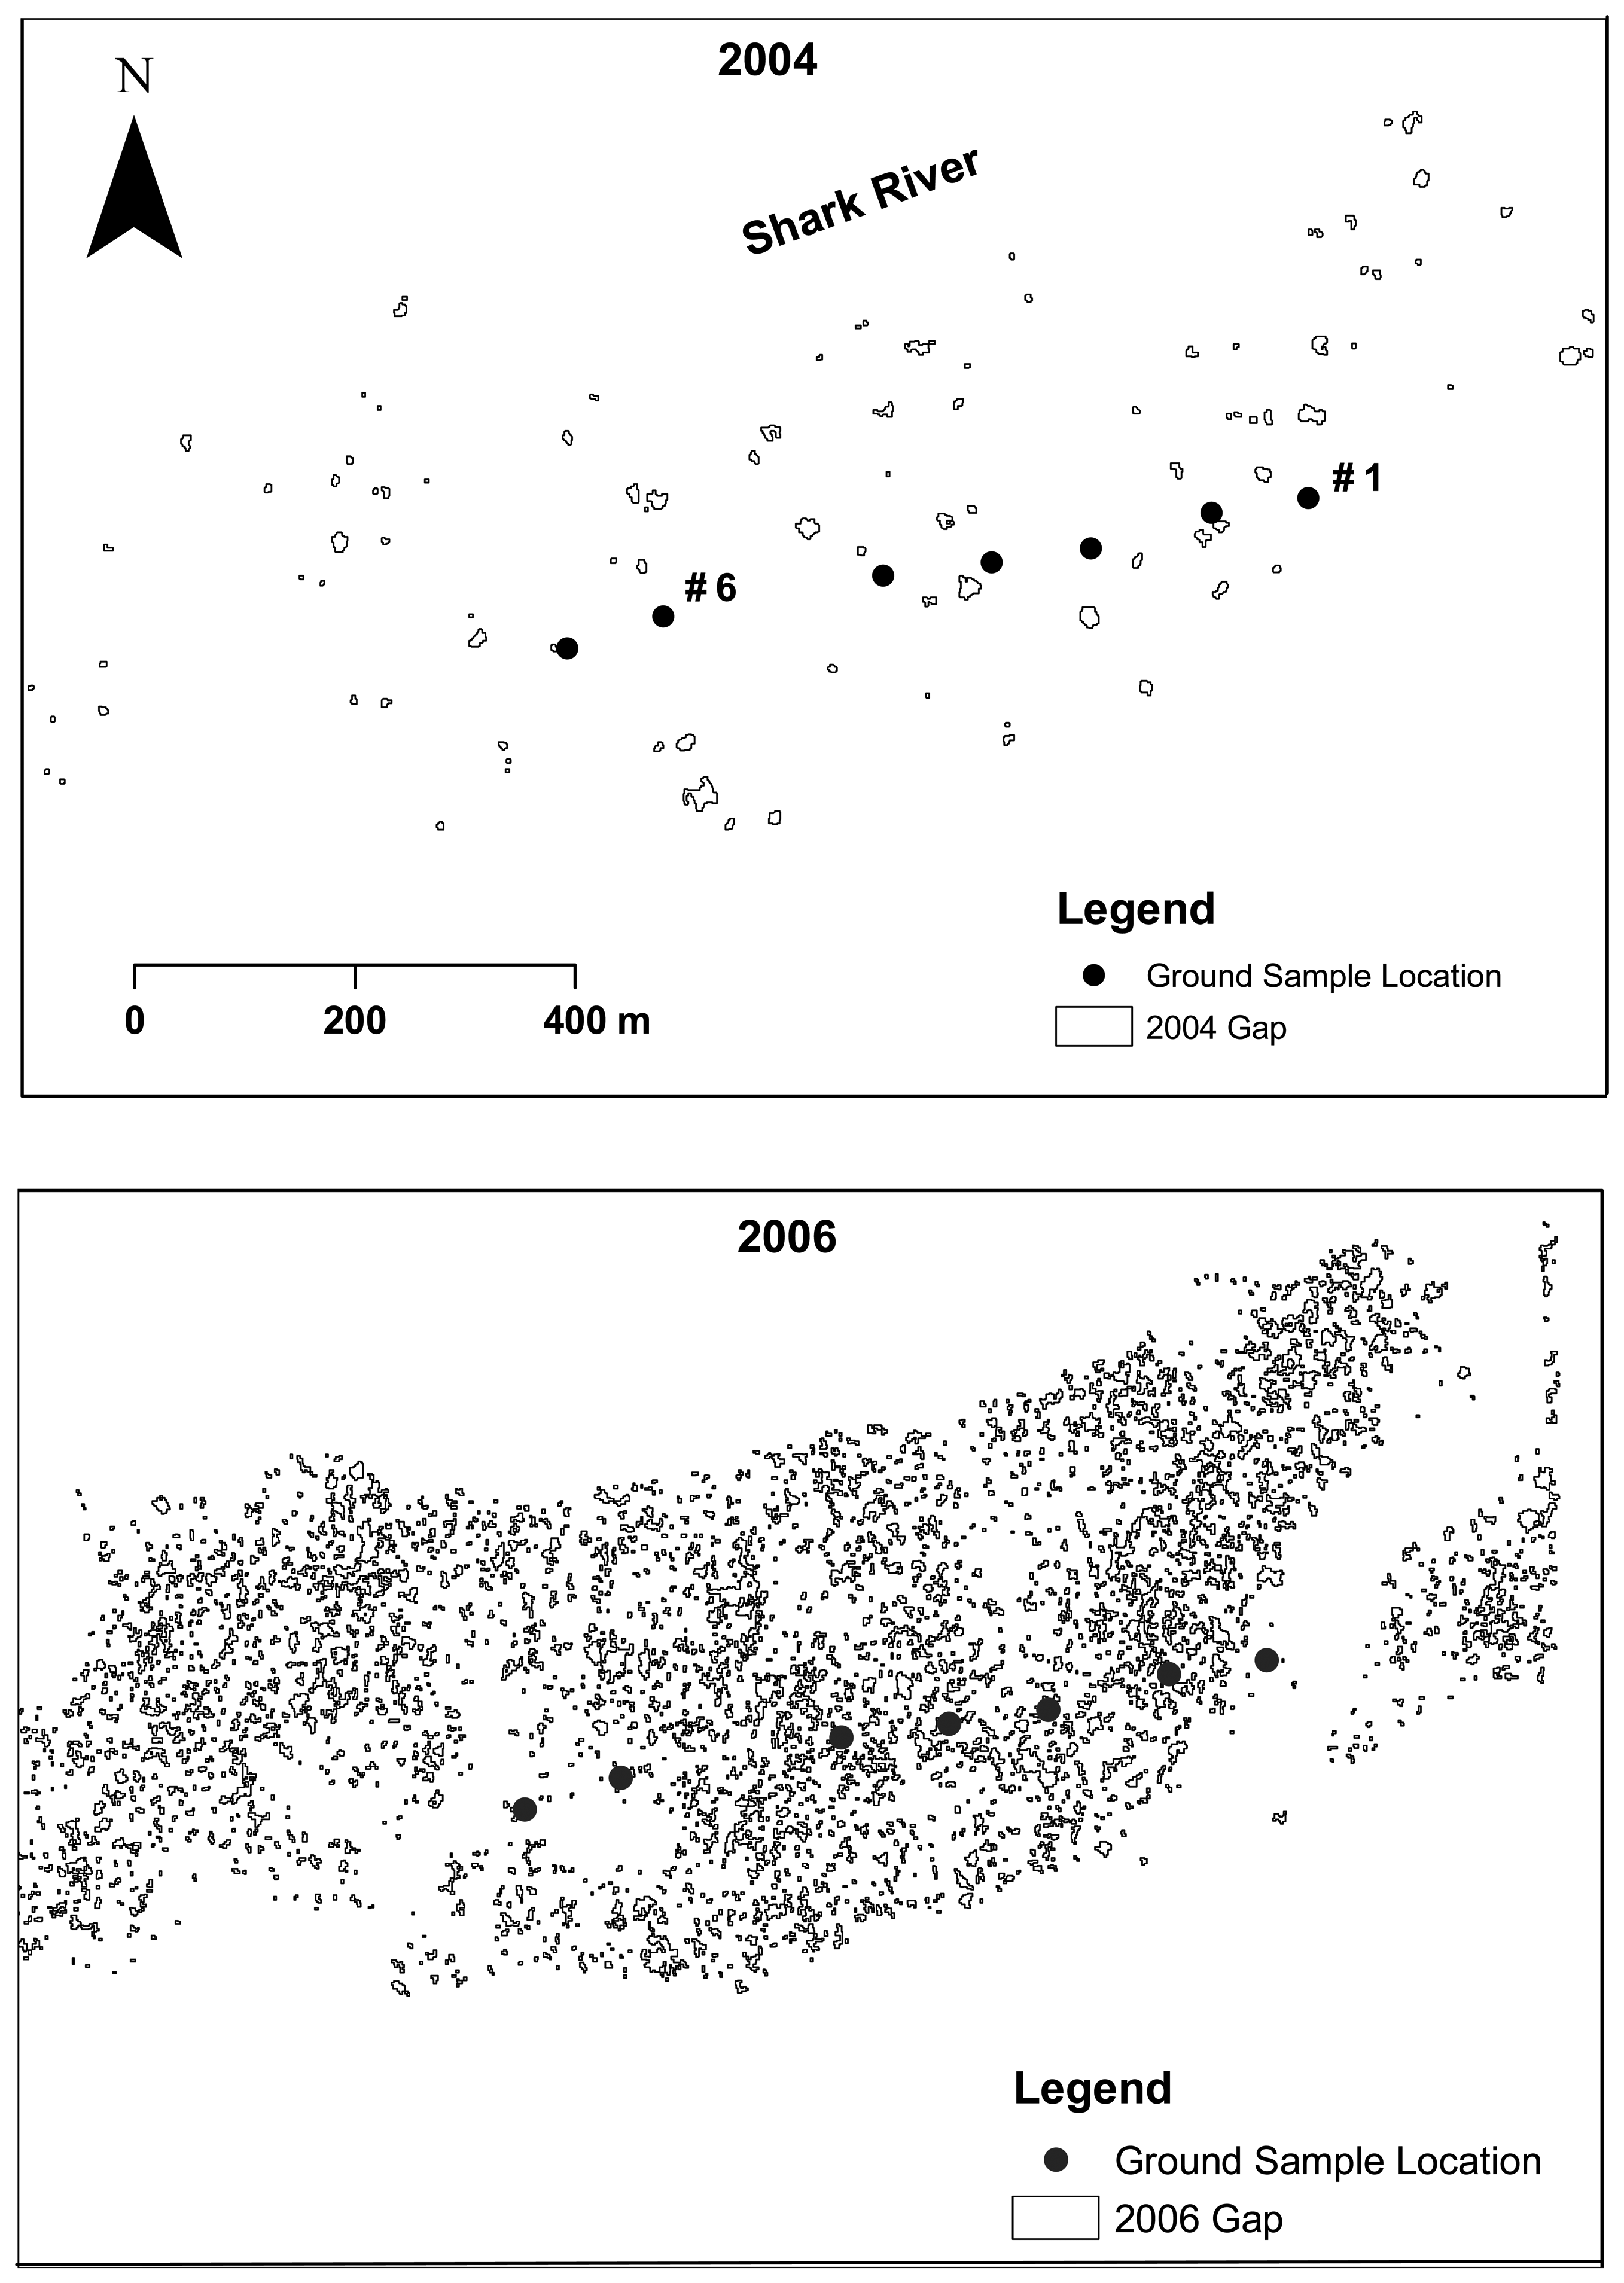
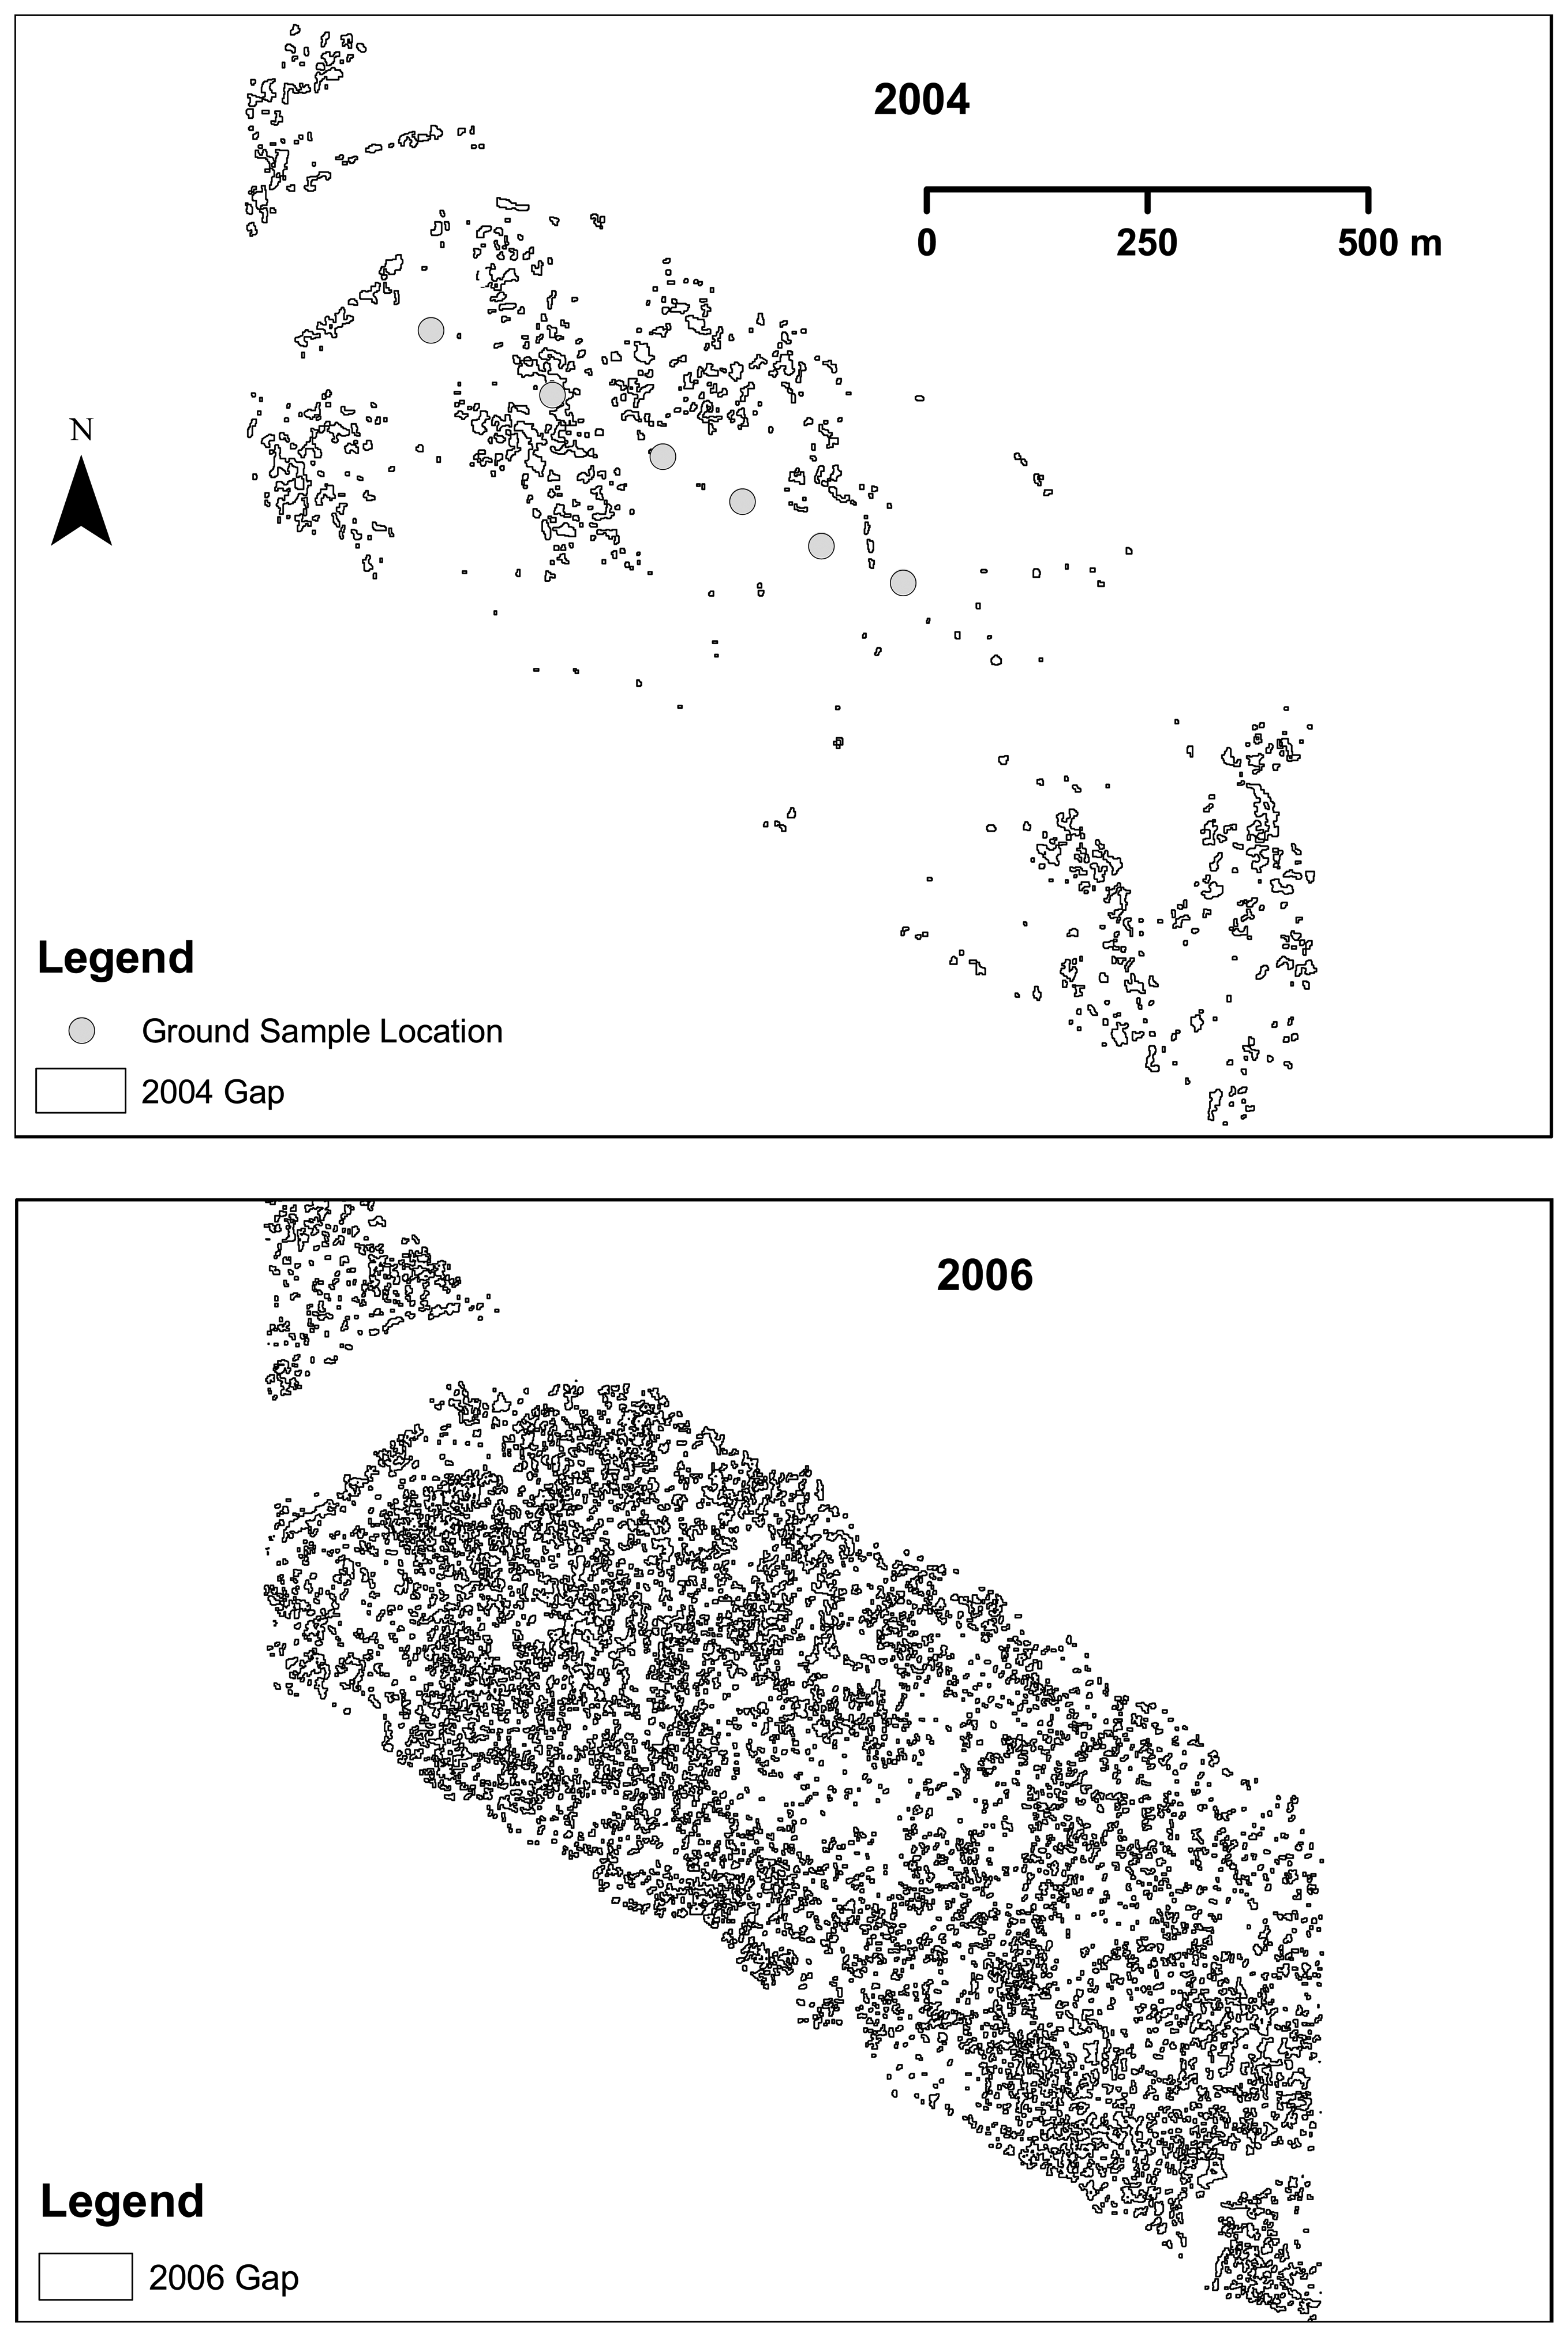
2.6. Gap and opening detection

Besides the general decreasing trend of wind speed from the center of the hurricane toward the outside, many micro-scale wind bursts are present in the hurricane wind field. By snapping or blowing down groups of trees, these wind bursts often lead to irregular and diffuse gaps (openings) in the mangrove forest. Aside from these diffuse openings, the mangrove forest contains many small and discrete lightning gaps that are created during weather events other than hurricanes. In order to separate the impact of these two disturbances on the mangrove forest, both gap types must be quantified. A method based on a sequential alternative filter and black-hat transformation is employed in this study to extract gap information from LIDAR data [27].
The first step was to classify last return LIDAR measurements into two categories: ground and vegetation using a progressive morphological filter [28]. A digital terrain model (DTM) was generated by interpolating identified ground measurements using block kriging with a cell size of 5 m to reduce the noise in ground LIDAR points. Then a digital surface model (DSM) was generated by interpolating raw first return LIDAR measurements using point kriging with a cell size of 1 m to represent canopy top elevation. First return LIDAR measurements were used for the DSM because they have more chances to be reflected back from the canopy top and therefore represent the canopy better. A digital canopy model (DCM) with a resolution of 1 m was derived by subtracting the DTM from DSM. The values of some pixels in the DCM are negative because different points were used for the interpolation at the same locations when the DSM and DTM were generated. Analysis of the DCM indicates that the magnitudes of most negative values are small and less than 0.3 m. Therefore, these negative values were set to zero to facilitate gap detection. Second, a filtered canopy surface which is an approximation to the mid point of a fluctuating top canopy surface was generated by applying an alternative sequential filter (ASF) to the DCM. Third, the elements of a gap pixel set (G) in a DCM were selected by comparing the height of a pixel with that of the filtered canopy surface at the same location:
G = { z [ i , j ] | B [ i , j ] > λ A S F N [ i , j ] & A S F N [ i , j ] > h min } B [ i , j ] = A S F N [ i , j ] z [ i , j ]
where z[i, j] is the height of DCM pixel at row i and column j which are determined by horizontal coordinates of a pixel. ASFN[i, j] is the filtered canopy surface height at i and j, N is the number of windows used by ASF, λ is a pre-defined constant with a value less than one, and hmin is the minimum height of the canopy surface. The parameter λ determines the relative location below the filtered canopy surface to delineate the gap boundary, and hmin was introduced to prevent open spaces in grass or brush areas of low canopy heights from being detected as gaps.
The LIDAR data indicated that at many locations within the study area Hurricanes Katrina and Wilma caused severe defoliation and damage to mangrove trees, and lowered the canopy top surface (Figure 2). In order to make the derived gaps or openings from the 2004 and 2006 DCMs comparable, the filtered canopy surface from the 2004 DCM was used as a reference surface for identifying openings from the 2006 DCM. It is assumed that the canopy surface from the 2004 DCM would also represent the canopy surface in 2006 if Hurricanes Katrina and Wilma had not impacted the study area. This assumption is reasonable because changes in the canopy top from 2004 to 2006 due to vegetation growth or other natural processes are small. In addition, Katrina and Wilma caused severe defoliation of mangrove trees, which led to an apparent decrease in canopy heights in many places and numerous small openings in the canopy. In this situation, a large λ value is needed to reliably detect gaps from the 2006 DCM. Thus, the λ values for the 2004 and 2006 DCM were set to 0.6 (Table 2). Moreover, a step used to fill holes within gap pixels using a binary morphological closing operation [27] was eliminated in the gap detection process for the 2006 DCM to prevent adjacent gaps from being connected into a gigantic and unrealistic gap. After gap pixels were identified, a procedure proposed by Zhang [27] was utilized to derive gap polygons. A minimum gap area threshold 10 m2 (Table 2) was used to remove tiny and unreliable patches from the detected gap set.

2.7. Gap shape and size

Both gap size and shape control light availability within a gap, which can influence seedling establishment. It appears that the shade tolerant R. mangle species dominates the initial colonization in small lightning gaps [3, 14], while shade intolerant L. racemosa dominates the initial colonization of large openings (>1000 m2) in the forest [29]. Therefore, it is important to derive quantitative information on sizes and shapes of gaps in the mangrove forest to understand the colonization process. In this study, gap size was quantified using the gap area, and gap shape was measured using a gap shape complexity index (GSCI) suggested by Patton [30]
GSCI = P 2 A π
where P is the gap perimeter and A is the gap area. GSCI reaches a minimum value of 1 when a gap shape is a circle and increases as gap shape becomes more irregular.

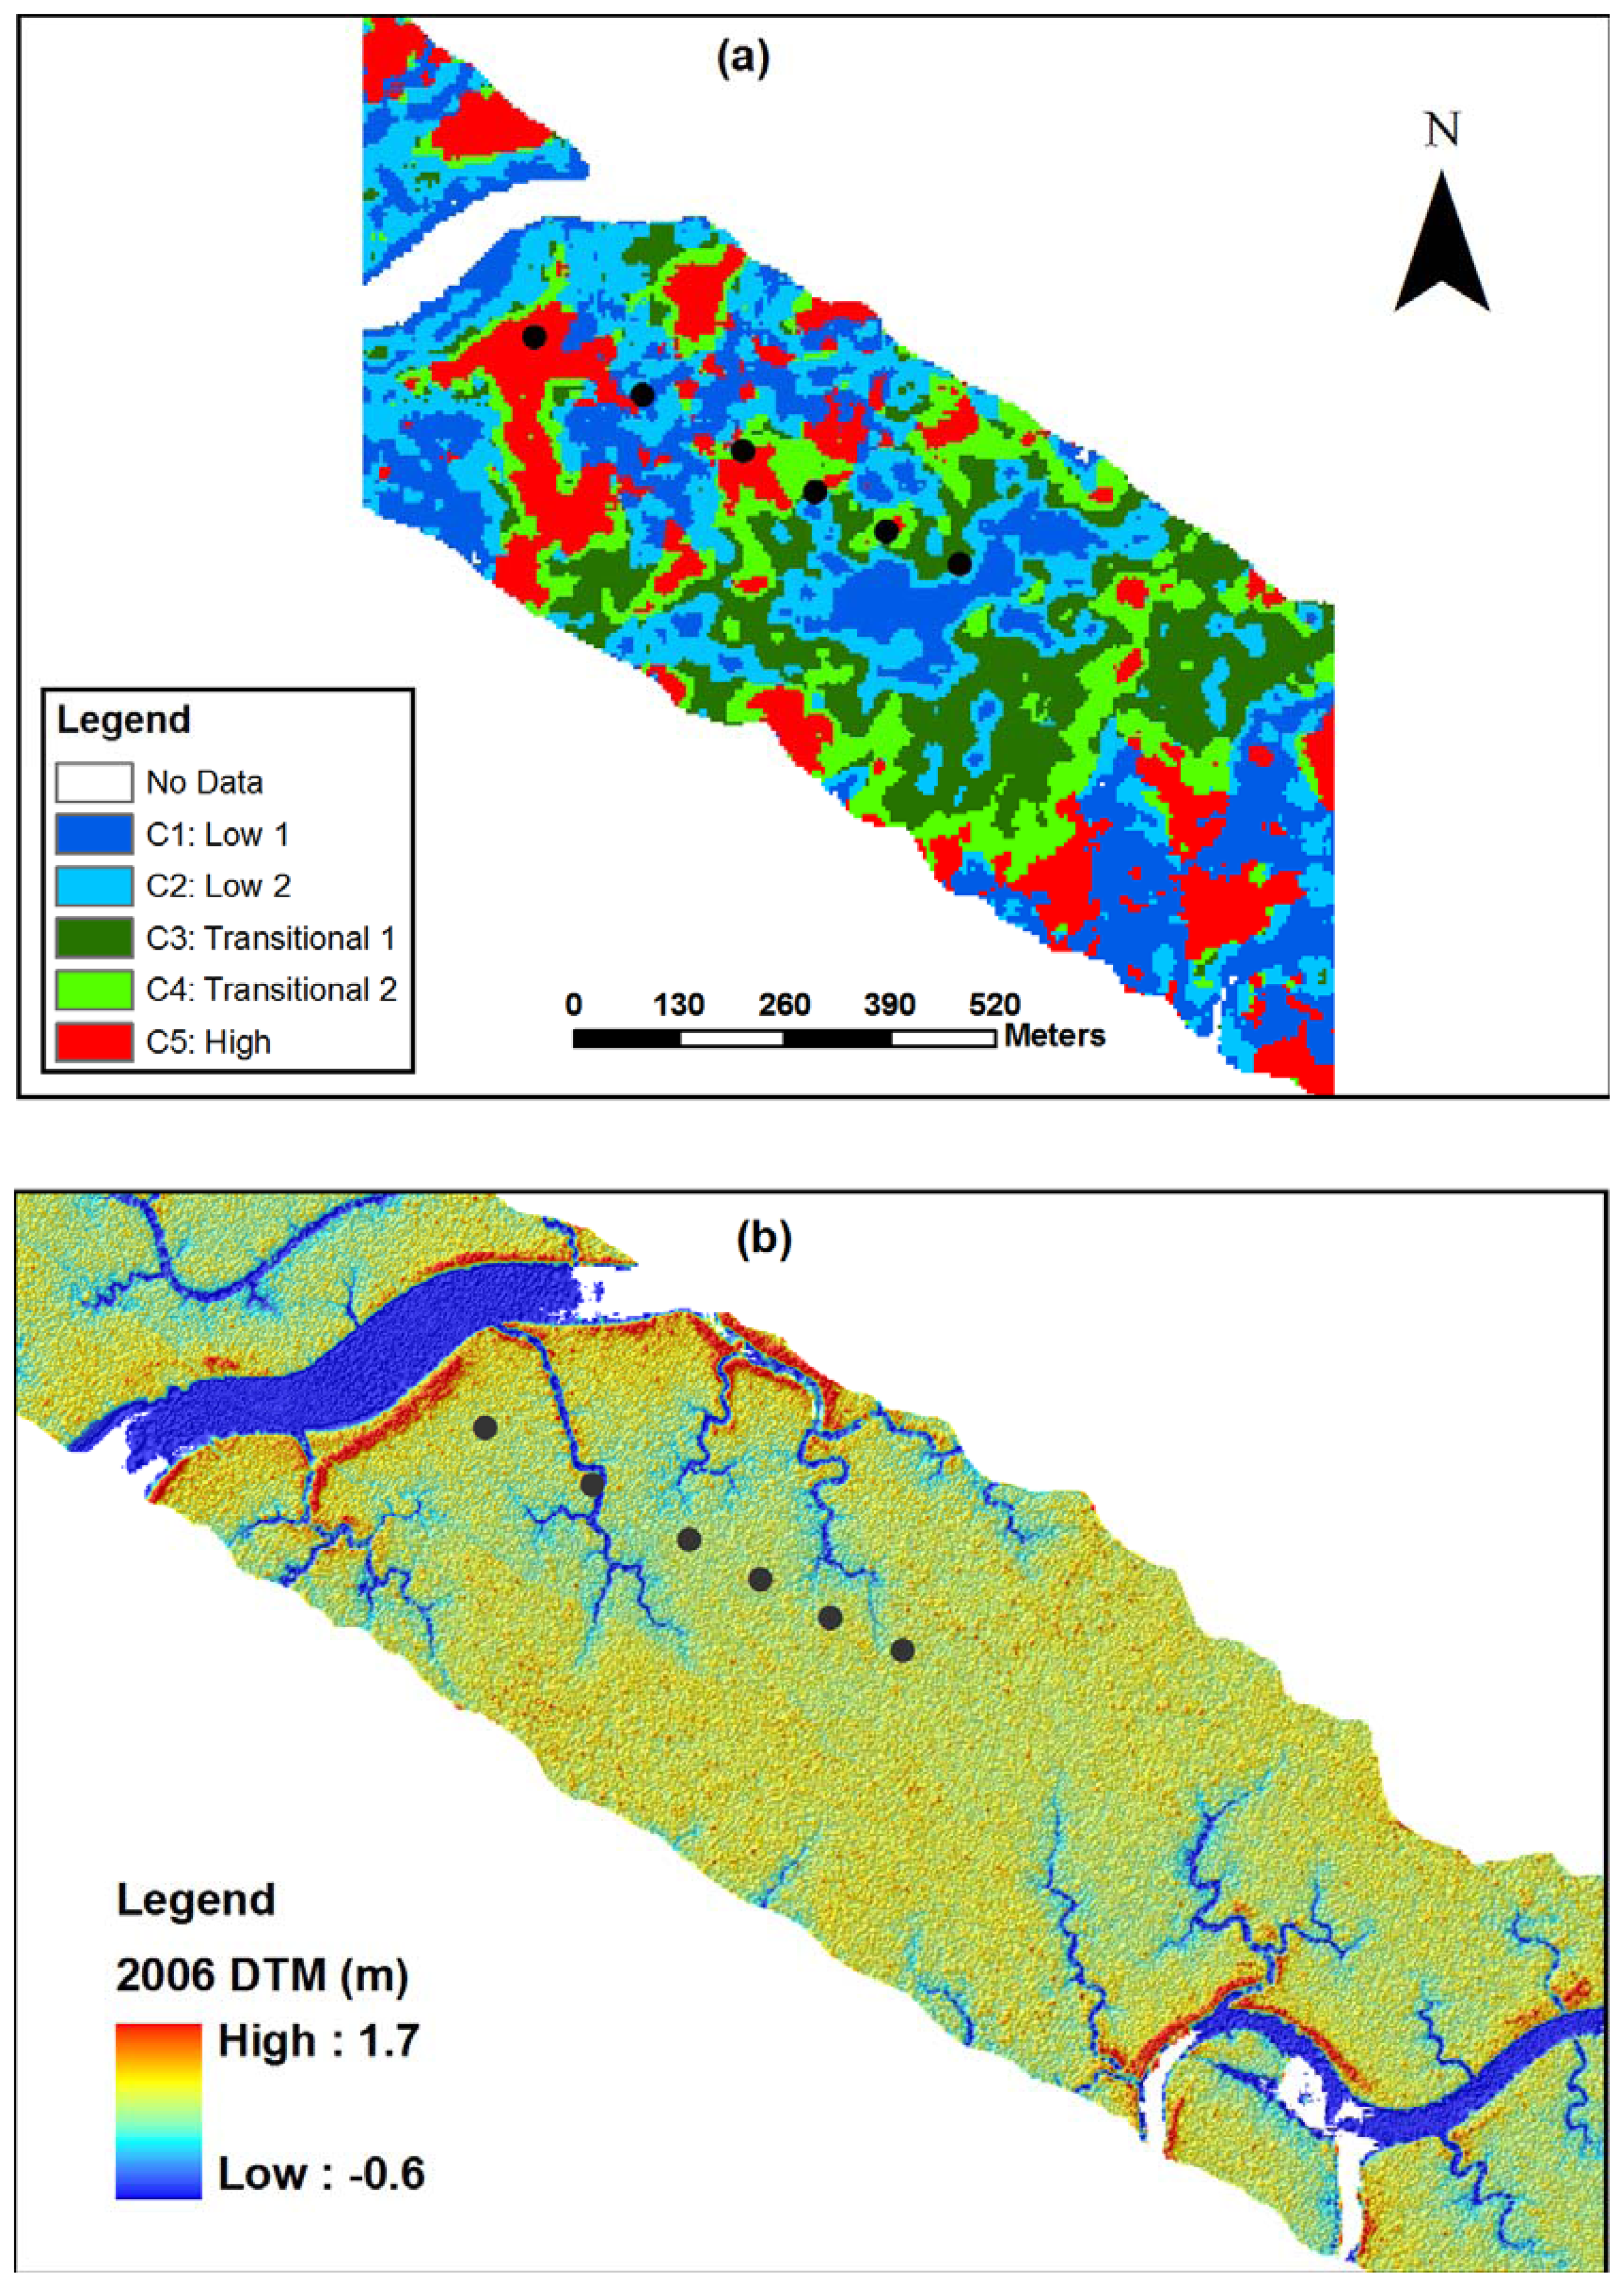
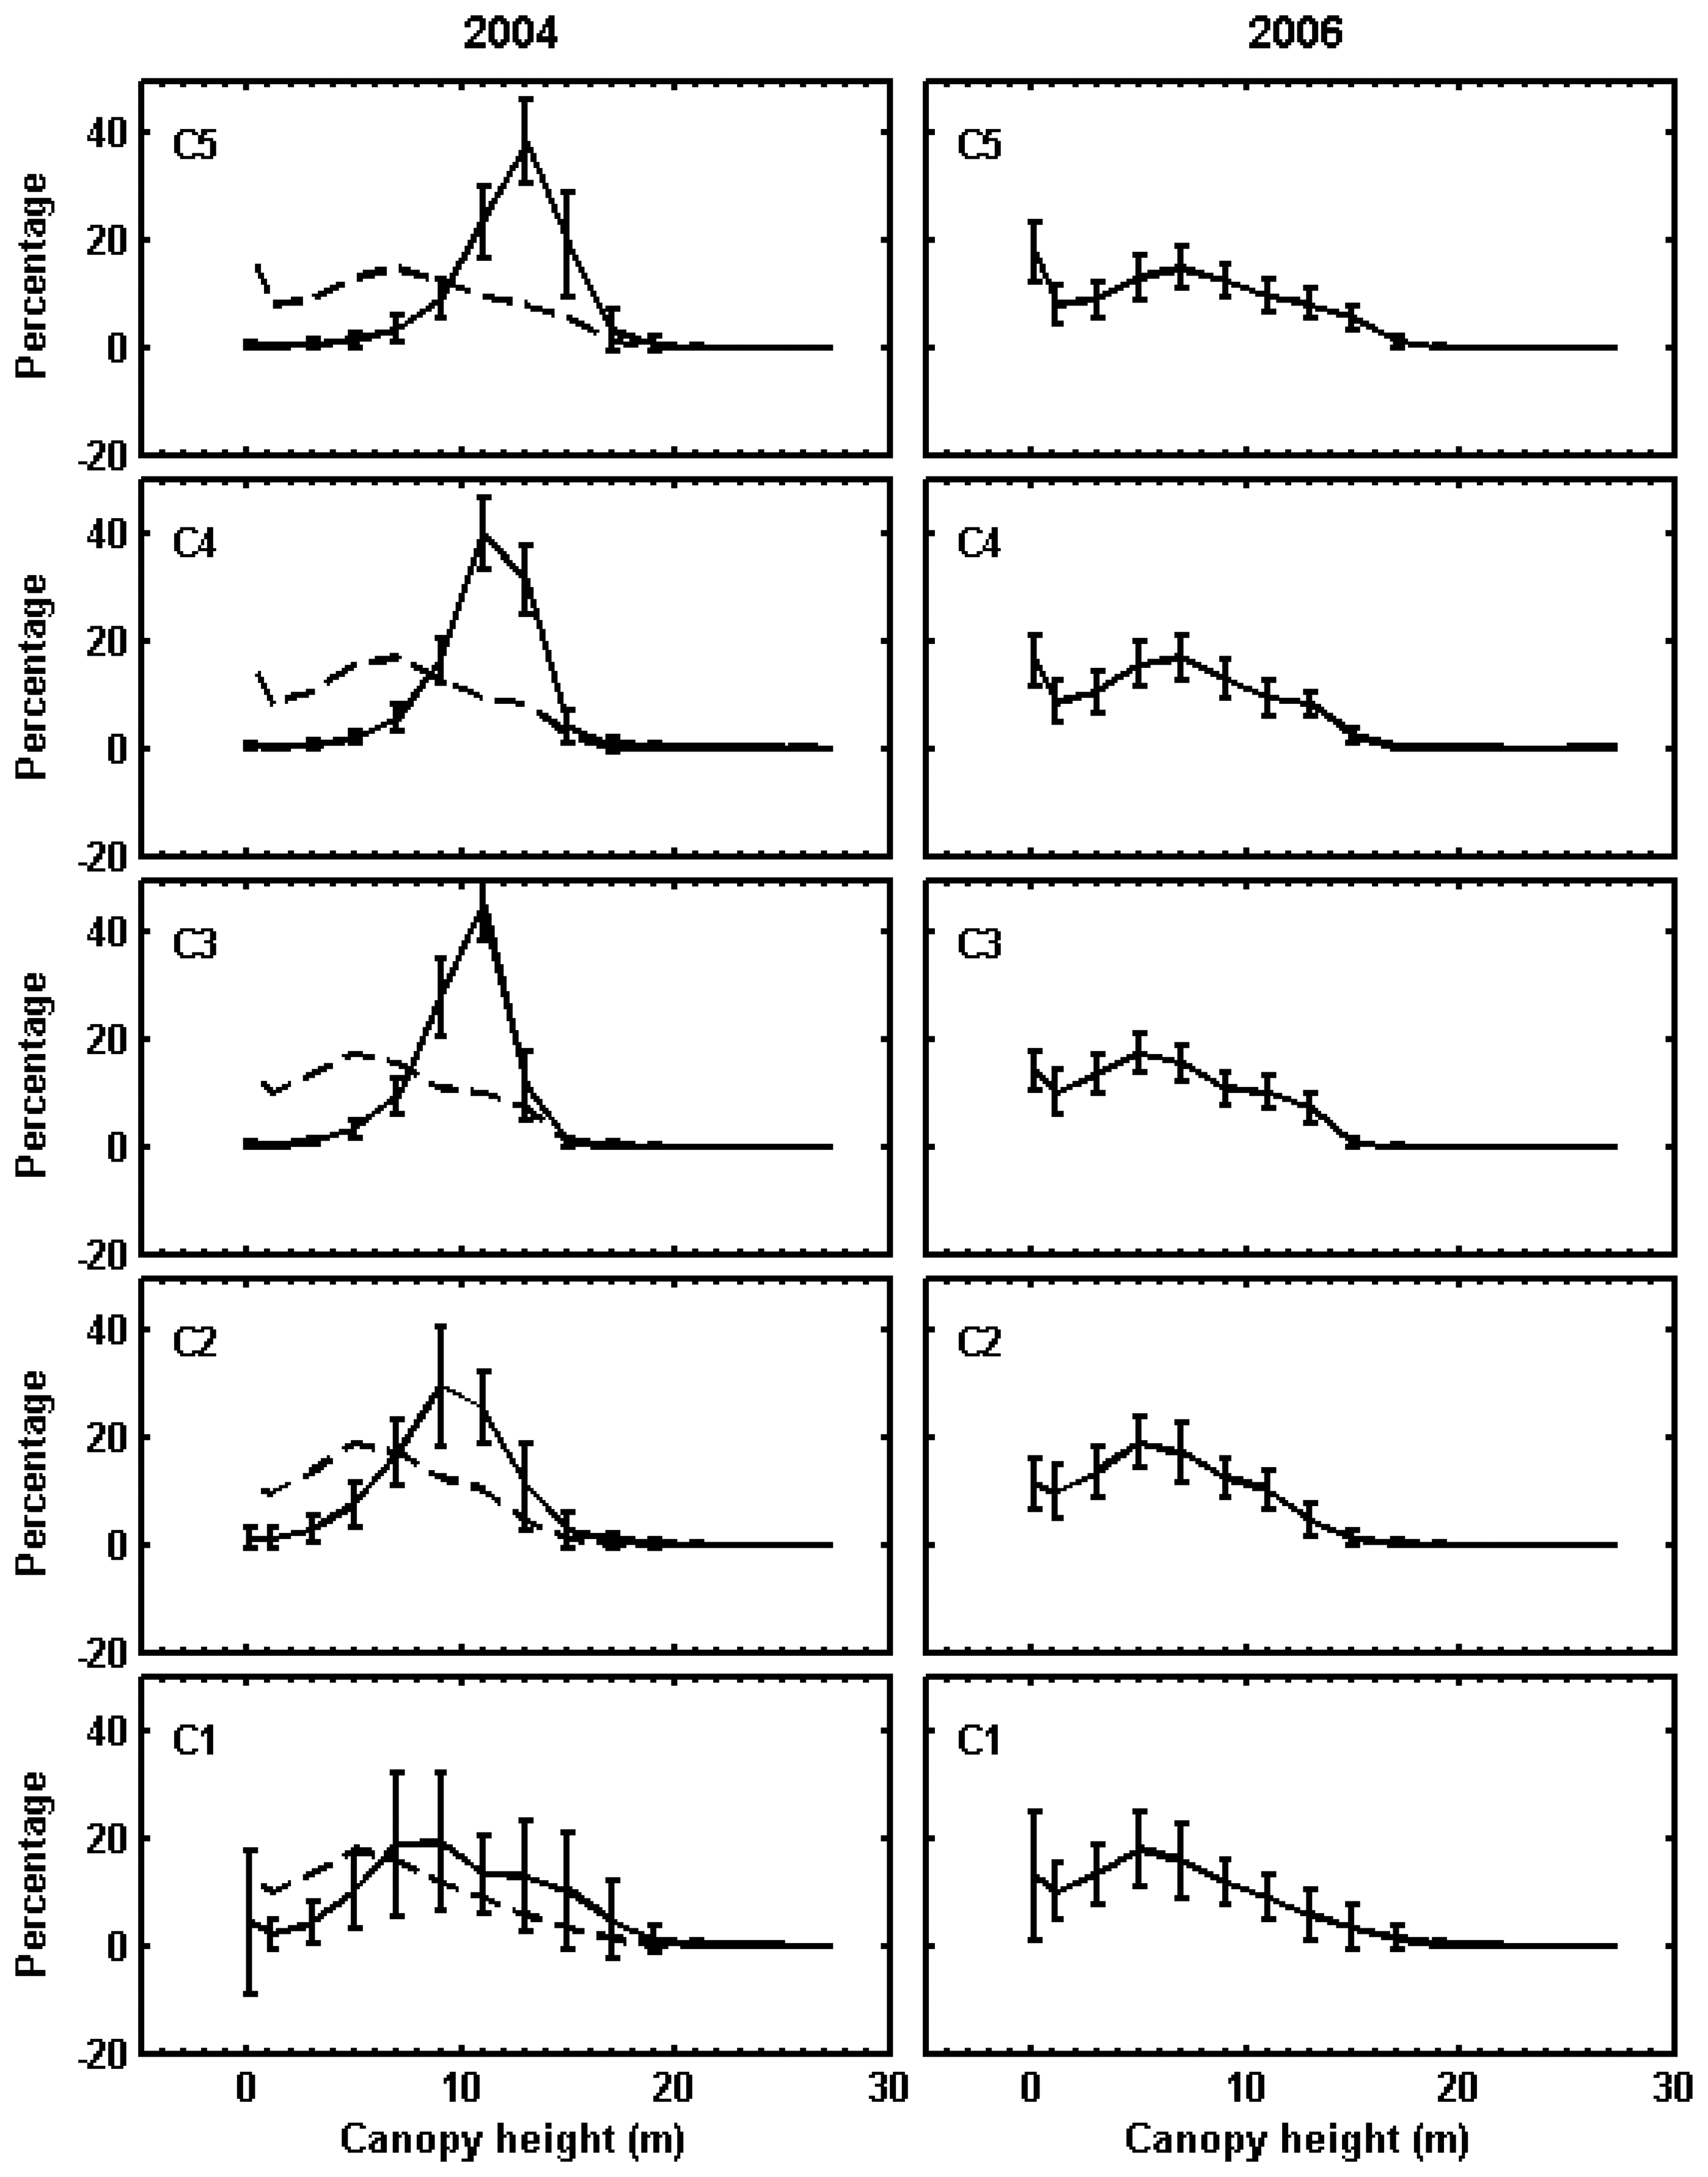
2.8. Classification of canopy changes

The point density of the LIDAR dataset is not sufficient to distinguish individual mangrove trees because overlapping tree crowns have similar heights. We characterized the mangrove forests based on the distribution of neighboring heights from the DCMs [27, 31]. First, the study area was divided into an array of square cells with a size of 5×5 m. Second, a 20×20 m window was generated for each cell. Third, the number of pixels within the window whose heights fall in a given height interval was counted. Since mangrove tree heights are usually less than 30 m in the study area, fourteen height intervals, 0-0.3, 0.3-2, 2-4, 4-6, 6-8, 8-10, 10-12, 12-14, 14-16, 16-18, 18-20, 20-22, 22-24, 24-30 m were used for counting. The value of 0.3 m, which is about two times of the vertical RMS errors of LIDAR measurements, was selected as a threshold between the ground and vegetation pixels. Finally, these counts for each cell were normalized by dividing by the total number of pixels contained in the 20×20 m window. In such a way, canopy height distributions in terms of the percentage for each cell were derived.
In order to analyze canopy changes due to hurricane impacts, grids for percentage occupancy within fourteen height intervals were first generated separately using LIDAR measurements derived before and after the 2005 hurricane season. Fourteen grids of height percentage differences were then derived by subtracting pre-hurricane grids from post-hurricane grids. Then, principal component analysis (PCA) was applied to the difference grids to detect the dominant modes of canopy change and to reduce the number of variables [32]. Finally, a five band image was created in ERDAS Imagine ( www.leica-geosystems.com) by stacking the first five principal components of the difference grids. Five classes of forest change were derived by applying an unsupervised classification method (ISODATA) to the five band image [32].

3. Results

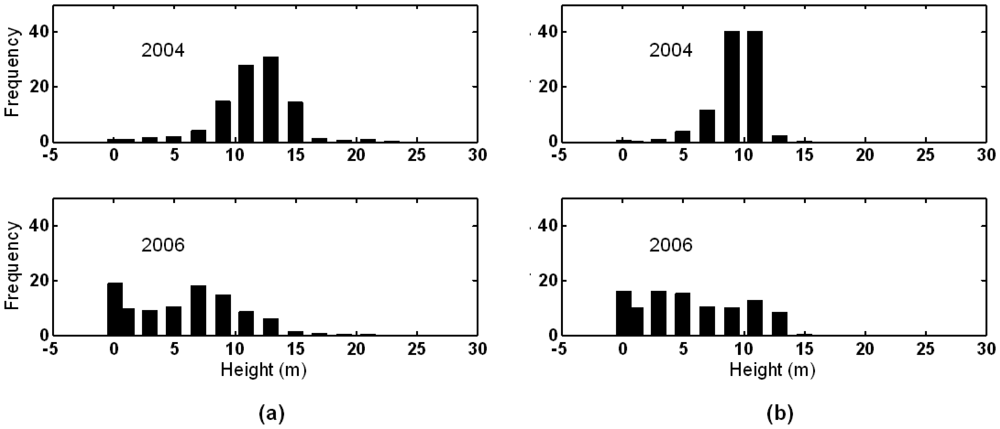
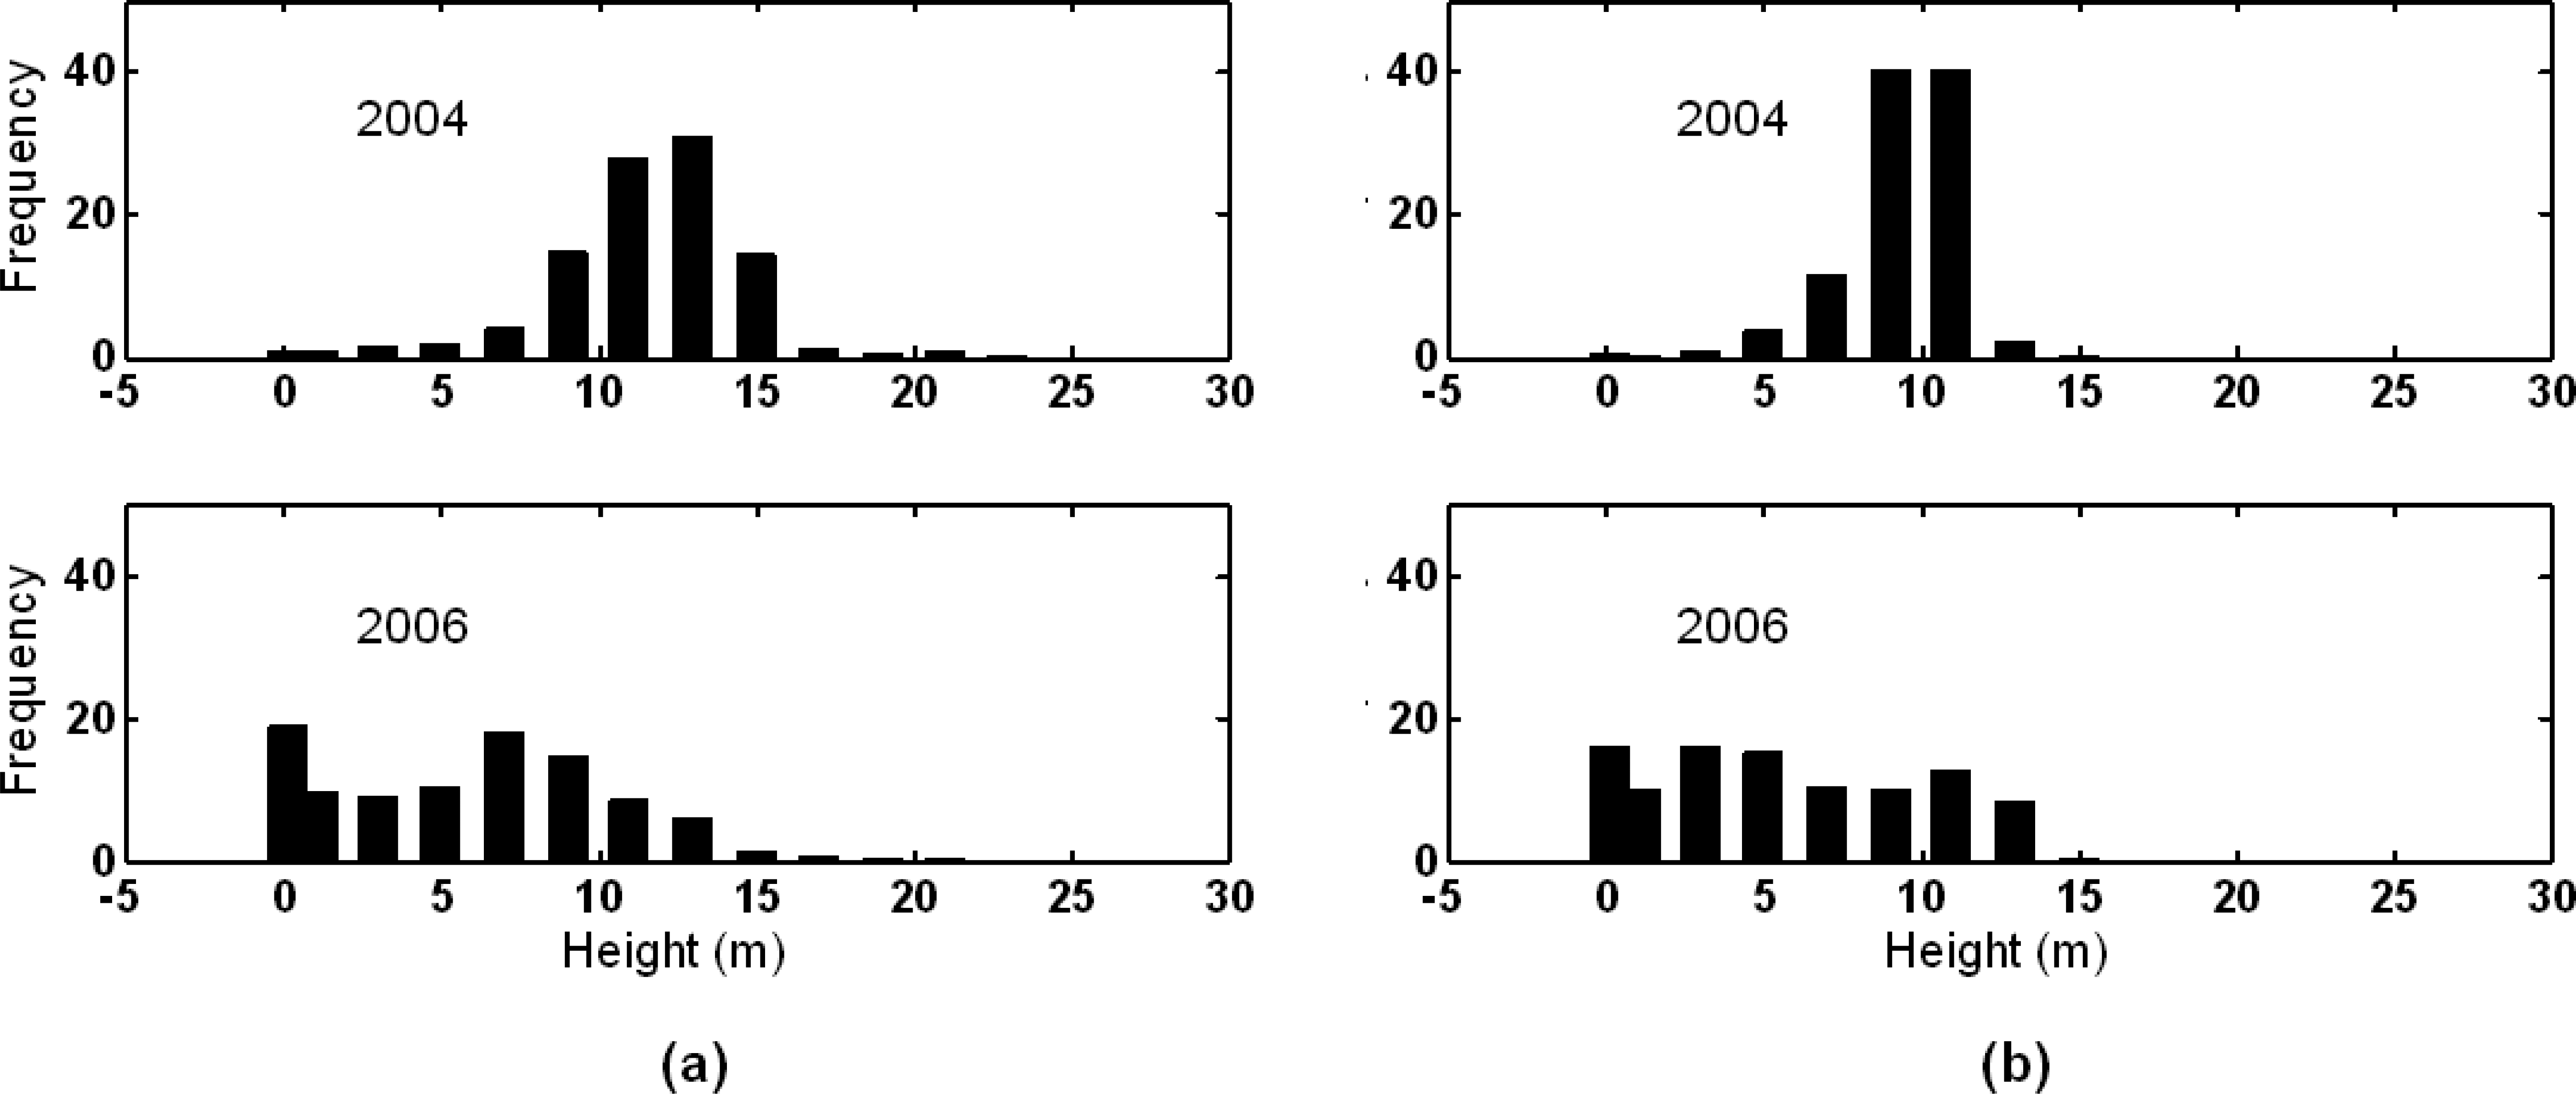
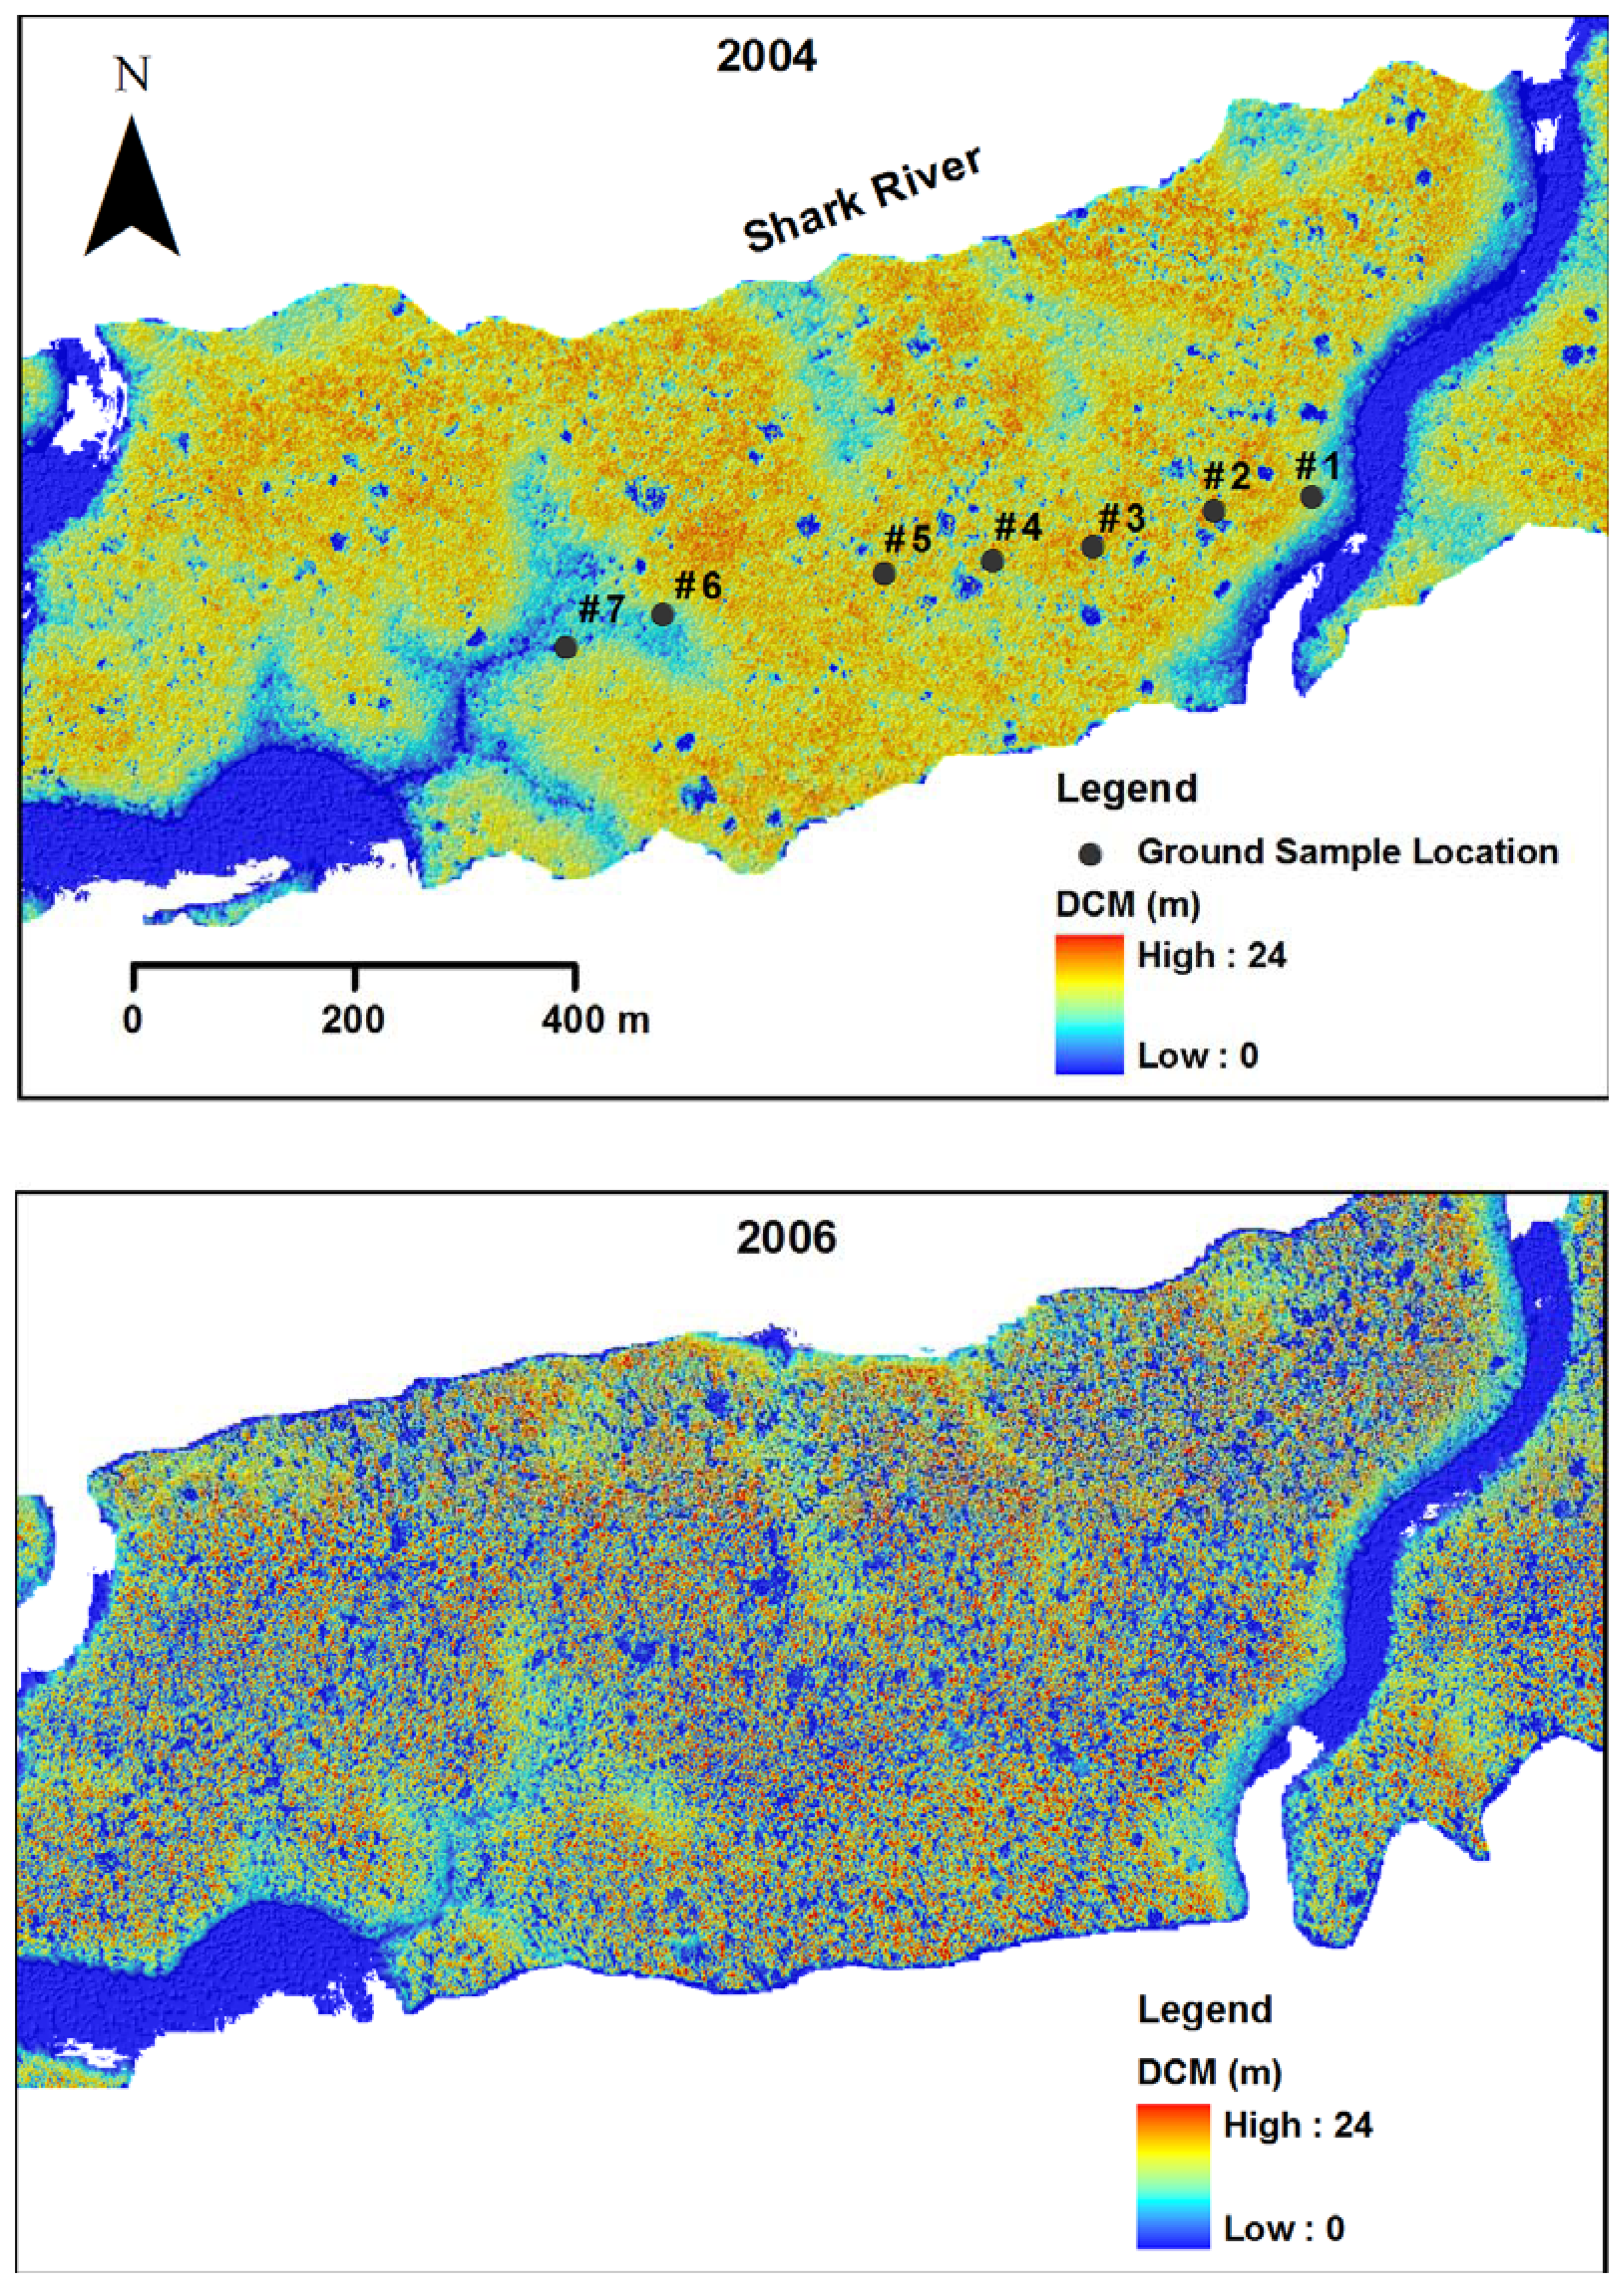
3.1. Shark River site

This study site is about 2.7 km away from the mouth of Shark River and is located at the south side of the Shark River (Figure 1). The area of 0.61 km2 was covered by 8-24 m high mangrove trees with dense leaf coverage before the 2005 hurricane season. Mangrove trees were usually lower next to the tidal creeks and taller between the tidal creeks. Figures 3a and 3b show that a 16-22 m canopy dominated the area not influenced by tidal creeks, while a 10-16 m canopy occupied the area adjacent to tidal creeks. Only a few first return measurements reached the ground due to a dense canopy. Field surveys indicate that R. mangle was the most abundant species in most size classes at the sampled locations (Figure 4). The forest was characterized by the absence of a significant sapling-size cohort, except in lightning gap areas which were not directly sampled. There were more small trees than large ones, but the long tail on the diameter distribution curve indicates the presence of a considerable number of large trees in the study site (Figure 4). Tree density in the Shark River site was relatively low compared to the Broad River site.
Before the 2005 hurricane season there were 311 gaps with areas larger than 10 m2 in the Shark River site (Table 3), most presumably generated by lightning strikes (Figure 5). Several “gaps” detected over tidal creeks actually represented uncovered water surfaces, and were removed from the gap data. These “gaps” are distinctive from lightning gaps because they coincide with the locations of tidal creeks and have exceptionally elongated shapes. The gap density which represents the number of gaps per unit area is about 510 per square kilometer. Gap sizes varied from 10 to 500 m2 with the largest count in the class with sizes less than 25 m2, but a considerable number in the range of 75-175 m2. The total area of gaps is about 1.1% of the study area. This number is a conservative estimate of the total gap area in 2004 because a large relative depth threshold (λ =0.6) was used in this study in order to ensure the consistency in gap detection from pre- and post-hurricane LIDAR data (Section 2.5). A large number of gaps in the late regeneration stages were therefore not detected because high saplings in these gaps are closer to the canopy top surface than the relative depth threshold. The GSCI indices of gaps ranged from 1.10 to 1.84 with a mean value of 1.20, indicating that gap shapes are not far from circular.
The LIDAR data allowed us to quantify obvious damage to the crowns of individual trees and severe defoliation of the forest canopy due to Hurricanes Katrina and Wilma (Figure 6). The 14 height percentage difference grids obtained by subtracting pre-hurricane grids from post-hurricane grids were processed using PCA. The cumulative contribution of the first five components to the variance of the data set was 89% (Table 4).
The classification of canopy structure changes based on these five components using the ISODATA method yielded five classes (Figure 7), whose distribution within the Shark River study area are displayed in Figure 8. Classes 1 and 2 are generally areas close to tidal creeks with relatively low trees, whose height distributions before and after the hurricanes are typified in Figure 3b. Impact within these areas is relatively small, with the percentages of canopy above 8-10 m decreasing after the hurricanes, while canopy percentages below 8-10 m and percentages of ground points increase (Figure 8). This pattern is expected because more LIDAR pulses can pass through the canopy top and hit the trunks of trees due to severe defoliation. Leaning trees that were blown down by the hurricane winds also contribute some portion to the increase in “canopy” below 8-10 m.
Class 5 represents canopy height changes for the majority of the areas covered by tall trees at the Shark River site (Figure 7). Compared to lower trees adjacent to tidal creeks, tall trees away from the tidal creeks suffered more severe defoliation and crown damage, resulting in a drastic reduction in the percentage of canopy heights above 14 m and an increase in the percentage of canopy heights below 14 m (Figure 8). The percentage of LIDAR returns from the ground rises more than 20 percent because there are many open spaces in the defoliated forest with a relatively low density of trees. Classes 3 and 4 with dominant canopy heights of 12-20 m and 14-22 m are transitional categories between classes 2 and 5. The percentages of classes 3 and 4 also exhibit a decrease in the upper portion of canopy heights and an increase for the lower portion of canopy heights and LIDAR returns from the ground.
Hurricanes Katrina and Wilma produced a large number of openings in the forest. The number of gaps in the forest after the hurricanes reached 2661, about 4362 per square kilometer and 8.6 times more than before the hurricanes (Table 3). The total area of gaps is about 12.1% of the study area. The total area of gaps detected from the 2006 LIDAR measurements is about 11 times the total area of gaps detected from the 2004 LIDAR measurements. The increased number is mostly in the smallest gap sizes, but all sizes show increases. The GSCI indices range from 1.13 to 4.64 with a mean value of 1.42 which indicates that more irregular gaps were created by hurricane winds. Examination of gaps identified using LIDAR measurements that were ground-truthed on March 21, 2007 showed that the two hurricanes opened the forest canopy by generating new gaps or expanding existing lightning gaps by damaging trees surrounding the gap. New gaps were created by the loss of small numbers of neighboring individuals rather than the widespread wholesale loss of trees.

3.2. Broad River site

This study site is about 1.3 km away from the mouth of Broad River. Canopy height at this site before the 2005 hurricane season ranged from 8 to 20 m, which is somewhat lower than at the Shark River site. As at Shark River, trees immediately adjacent to the tidal creeks were usually shorter than trees between the creeks (Figures 9 and 10). Trees were also shorter in the middle of the study site where there are no tidal creeks. The mangrove forest had a dense canopy and only a few first return measurements reached the ground. Tree diameter distributions were skewed most strongly toward the smaller size classes (Figure 11). Species composition varied dramatically along the transect surveyed in the field. L. racemosa was overwhelmingly dominant toward the interior of the transect, but was less important nearer to the river, where R. mangle is most abundant. A. geminans comprised many of the largest trees. Nevertheless, none of the three species was confined to a single canopy layer, and each dominated sapling species at one or more sampling points. The ground layer at plot 1 was dominated by L. racemosa individuals less than 50 cm in height, with larger A. geminans seedlings becoming prominent beyond plot 3. Seedlings were largely absent at plot 2.
About 290 gaps were detected from the LIDAR measurements acquired in 2004 (Table 3). The distribution of gap areas for the Broad River site in 2004 appeared to follow an exponential function with higher counts for small size gaps. The total area of gaps was about 1.9% of the study area. The GSCI indices ranged from 1.06 to 2.20 with a mean value of 1.21, indicating that gap shapes at the Broad River site, like those at Shark River, were mostly circular before the 2005 hurricane season.
The locations of many apparent gaps coincide with the paths of tidal creeks (Figures 12 and 13). These gaps were not caused by lightning strikes, but rather by the occurrence of covered and uncovered sections of tidal creeks by tree canopies. Since it was difficult to distinguish these gaps from lightning gaps based on only LIDAR measurements, these gaps were not removed from either pre- or post-hurricane gap data sets at this study site. Thus, gap data from LIDAR measurements overestimated the number and areas of gaps at the Broad River sites. In contrast, only a few gaps over tidal creeks were detected at the Shark River site in the 2004 data set (Figures 2 and 5), rendering the gap data from Shark River more reliable than for the Broad River site. Based on a comparison of areas not influenced by tidal creeks, there were considerably more gaps at the Shark River site than at the Broad River site before the 2005 hurricane season.
Canopy changes caused by hurricanes were categorized into 5 classes (Figure 13). The cumulative contribution of the first five principal components to the variance of the data set is about 92% (Table 4). Similar to the Shark River site, classes 1 and 2 represent low tree areas next to tidal creeks and the middle portion of this site. The percentages of canopy heights above 6-8 m were reduced significantly by defoliation and branch losses, while the percentages of canopy heights below 6-8 m increased (Figure 14). The percentage of ground measurements after the hurricanes also increased, but less so than at the Shark River site. The major reason for this relatively small increase is the high tree density at the Broad River site, which increases the likelihood that a laser pulse will hit tree trunks and branches after defoliation, and decreases the chance that the pulse will reach the ground.
Class 5 represents the canopy change in the tall forest located between the tidal creeks. The percentages of canopy heights above 8-10 m were reduced drastically because of defoliation and crown damage, while the percentages of canopy heights below 8-10 m increased correspondingly. The number of ground measurements in the 2006 data set increased by more than 15% over those in the 2004 data set. The distribution of canopy heights at plot 3 is similar to the distribution of mean canopy heights for class 5, indicating that the sample site represents class 5 well (Figure 10a). Classes 3 and 4 with intermediate canopy heights are transitional classes with tree heights between classes 2 and 5. The patterns of change in canopy height distributions for Classes 3 and 4 due to the hurricanes fall between those of classes 2 and 5.
The number of gaps detected using the 2006 LIDAR measurements is 2527, about 8.7 times more than those detected using the 2004 LIDAR measurements (Table 3). The majority of hurricane induced gaps have small sizes. The total area of gaps in the 2006 data set is 12.2% of the study area and is about 6.4 times the gap area in the 2004 data set. The CGSI indices of gap shapes range from 1.03 to 4.03, with a mean value of 1.22, indicating that some irregular gaps were produced by the hurricanes, but small circular gaps still prevail.

4. Discussion

The mangrove forests at the Broad River and Shark River sites are different in species composition, tree heights, and number of lightning gaps, although the two sites are only 11 km apart and have similar climatic and geomorphologic conditions. L. racemosa dominates the Broad River site, while R. mangle dominates the Shark River site. Mangrove trees at the Shark River site are tall and large in diameter, while trees at the Broad River site are relatively low and small. There are fewer lightning gaps at the Broad River site than at the Shark River site based on LIDAR measurements in 2004. We believe that these differences are due to the cyclical death and regeneration of mangrove trees related to hurricanes and lightning strikes.
Three category 4 hurricanes have impacted the mangrove zone in ENP since 1851; however no category 5 hurricanes have yet influenced the mangrove zone (Figure 15). Both the Labor Day hurricane (1935) and Donna (1960) impacted the mangrove forest on the lower portion of the west coast in ENP, while Andrew (1992) impacted the mangrove forest at the upper portion of the west coast. These hurricanes caused catastrophic destruction of mangroves surrounding the eye wall [3, 6, 15, 33], with more than 75% of trees fallen or broken based on a classification proposed by Smith et al [3].
In addition, seven category 3 and three category 2 hurricanes have affected the mangrove zone in ENP since 1851. While not considered “catastrophic”, these hurricanes caused severe damage to the mangrove forest with defoliation of the majority of trees (more than 75%) and some fallen trees [3], and the creation of numerous small openings. Therefore, the pattern of increased small gaps in mangrove forests after Hurricanes Wilma and Katrina is not surprising. Areas of severe damage caused by a category 2 or 3 hurricane are often wider than areas of catastrophic damage caused by a category 4 and 5 hurricane because of the large eye wall radius (Rmax). In addition, wind field conditions in a broad area next to the eye wall of a category 4 or 5 hurricane can be similar to those around the eye wall of a category 2 and 3 hurricane. Therefore, the severe damage caused by hurricanes occurs more frequently in ENP and covers much larger areas than the areas of catastrophic damage.
Historical hurricanes influencing the mangrove zone in ENP show remarkable decadal change with a period of 20-30 years (Figure 16), which coincides with decadal fluctuations in hurricane activity in the entire North Atlantic basin [34]. More major hurricanes, which are defined as category 2 and up in this paper, occurred in the ENP mangrove zone during the 1860s, 1870s, 1920s, 1930s, 1940s, 1960s, 1990s and 2000s. Few hurricanes occurred between these active periods. The alternation of active and calm hurricane periods first causes the destruction and then allows for the recovery of mangrove forests. The ages and heights of mangrove trees in ENP are therefore determined in large part by the cyclical activity of hurricanes based on the historical records since the 1850s.
The relative contribution (β) of hurricanes versus that of lightning strikes to mangrove forest gaps for a specific location can be estimated by
β = ( A H / T H A L / T L ) A L / T L
where AH is the gap area after the 2005 hurricane season, TH is the recurrence period of major hurricanes, AL is the gap area before the 2005 hurricane season, and TL is the average life span of lightning gaps. Only gap data from the Shark River site (Table 3) were used to calculate β because gap parameters from the Broad River site were less reliable due to the influence of tidal creeks. The recurrence period of major hurricanes influencing the mangrove zone in ENP is about 12 years based on 13 major hurricanes influencing the study area during a period of 155 years. The average gap life span is assumed to be 15 years [11]. Therefore, major hurricanes can produce about 12.8 times more gaps in severely impacted areas than lightning strikes can produce within this same period in terms of Equation (4) and Table 3. However, the contribution of lightning strikes was underestimated because the current AL value does not fully represent the gap area formed by lightning strikes during the gap life span for several reasons. First, a large relative depth threshold (λ=0.6) reduced the number of gaps in regeneration stages from being detected. Second, not all gaps in initiation and regeneration stages can be detected by LIDAR measurements [27]. The lightning gap area is estimated to be 4.5% of the total forest area of the Shark River site if a small relative depth threshold (λ=0.35) is used and gaps in initiation and regeneration stages are considered [27]. Based on this value, major hurricanes can produce about 2.4 times (β=2.4) more gaps in severely impacted areas than lightning strikes can produce. However, the hurricane contribution was underestimated by this β value because a large λ was used for hurricane gap detection and a small λ for lightning gap detection. It would be difficult to derive accurate β value because of uncertainty in estimating the gap area caused by lightning strikes. Therefore, the above values of β are rough estimations, and represent the low and high bands of the relative contributions of hurricanes and lightning strikes to mangrove disturbances.
Tree size and height differences between the Broad River and Shark River sites reflect a gradient of decreasing influence from Hurricane Andrew (1992), the most recent major storm event to pass near the study area before the 2005 hurricane season. With a tight eye and a small radius of maximum wind, Hurricane Andrew was a category 5 storm when it made landfall at the Atlantic coast of Miami in August 1992. Andrew crossed south Florida on a west-northwest track, entering the Gulf of Mexico as a category 4 hurricane about 17 km north of the Broad River site which fell inside the eye wall (Figure 15). Aerial surveys after Andrew indicated that more than 75% of trees had fallen and were broken by the strong winds [3]. A ground photograph taken six months after Andrew shows catastrophic damage along the Broad River [4]. As a result, the majority of trees seen at the Broad River site today are about 15 years old and are shorter than 14 m in height. In contrast, tree damage from Hurricane Andrew at the Shark River site was severe but not catastrophic, with more than 75% defoliation and some fallen trees, but many surviving individuals [3]. The most recent intense hurricane impacting the Shark River site before 2005 was Hurricane Donna in 1960. As shown in the ground photographs and described by Craighead and others [5, 33], Donna caused catastrophic damage to these mangrove trees. Hurricane Betsy, which passed by the Shark River site as a category 3 storm in 1965, caused further damage to mangrove forests which were still in recovery. No storms capable of producing catastrophic damage had passed near the Shark River site from 1961 to 2005, resulting in a period of 45 years of tree growth and canopy development. In part, this may explain why mangrove trees at the Shark River site are taller and larger than those at the Broad River site.
There are several potential explanations for the lower density of gaps seen in 2004 at the Broad River site than at the Shark River site. This pattern may be due to the older age of the forest at Shark River, allowing it to be disturbed by lightning strikes for a longer period. Another possible reason is that the lower, younger and smaller trees in the Broad River site have suffered fewer lightning strikes due to a relative low electrical conductivity and recovered faster after lightning strikes. The reason for the difference in gap density at these two sites deserves further study.
The role of natural disturbances in changing the species composition of the mangrove forest is complicated. Interpretations of field studies on the impact of lightning gaps on species demographics are controversial. Some studies [12, 35] demonstrated that the destruction and regeneration processes in lightning gaps do not change the species composition, while others [3, 14] found that R. mangle is the dominant species in lightning gaps in the Shark River site, regardless of overstory composition, indicating that the original species composition is not critical, at least at a local scale.
Baldwin et al. [15] showed that a shift in species composition occurred in the Biscayne Bay coastal mangrove forest in South Florida following the catastrophic destruction from Hurricane Andrew, depending on the condition of seedlings in the forest after the disturbance. At two field sites, they found that the R. mangle dominated forest with few R. mangle seedlings surviving from Andrew was replaced by a mixed mangrove forest after the hurricane, while a mixed mangrove forest with dense R. mangle seedlings surviving the hurricane was replaced by an R. mangle dominated forest. Working elsewhere in the Biscayne Bay watershed after Hurricane Andrew, Ross et al. [36] found that the trajectory of species composition was largely determined by recruits or advance regeneration that became well-established by the third year after the storm. These recruitment patterns could lead to major species shifts. Craighead [5, 33] also reported such a species replacement after the catastrophic destruction of the Labor Day Hurricane at Flamingo in ENP, where a forest composed of large A. geminans individuals was replaced by a R. mangle dominated forest.
We speculate that the difference in species composition between the Broad River and Shark River sites is related in a complex way to the regeneration process after hurricane and lightning disturbances. In the large openings (>1000 m2) produced by catastrophic hurricanes, L. racemosa seedlings are more competitive at high levels of light [37]. In contrast, in the smaller openings created by severe hurricanes (category 2 and 3) and lightning strikes, R. mangle recruitment appears to be favored across a broad range of settings in ENP [14]. The dominance of the shade-intolerant L. racemosa at the Broad River site may therefore be attributed to the catastrophic impact of the recent Hurricane Andrew which released the light limiting condition imposed by the closed mangrove canopies, while the high abundance of R. mangle in the mixed forest at Shark River may be indicative of a more complex and longer disturbance and recovery history since Hurricane Donna in 1960–a history which includes numerous gap-forming lightning strikes and the impact from Hurricane Betsy in 1965. Of course, in addition to the characteristics of gaps and openings, factors such as the conditions of forest structure following disturbance, surviving seed sources, hydroperiod, salinity, nutrient availability, extent and orientation of debris piles all can influence seedling establishment and tree growth after a disturbance [15, 29, 38, 39]. We cannot currently ascertain whether, in its developmental sequence, the Shark River site passed through a L. racemosa-dominated developmental stage similar to the current Broad River forest due to lack of historical records on the species composition of the forests at these two sites.
There is a linkage between lightning and hurricane disturbances. Smith et al. [3] found that seedlings and saplings in lightning gaps created before Hurricane Andrew in ENP were the major survivors after the catastrophic impact. A field examination on March 21, 2007 indicated that most seedlings observed in lightning gaps detected from the 2004 LIDAR measurements suffered little damage during the 2005 hurricane season, except for a few killed by falling trees at the edge of a gap (Figure 17). R. mangle dominated the seedling population, and seedling density and height was highest in the gap centers. In contrast, mangrove seedlings are sparse in the newly created hurricane produced gaps. Since lightning gaps favor R. mangle seedlings and saplings [14], the question remains whether regeneration of mangrove trees in gaps created by severe hurricanes follows the same course as that in lightning gaps.
It is important not to equate conditions within gaps formed by severe (non-catastrophic) hurricanes and those formed by lightning. Lightning strikes usually do not change the community structure of the forest surrounding a gap, while hurricane impact can produce dramatic changes in the surrounding forest, which in turn may feed back on processes within the gap itself. R. mangle trees severely impacted by hurricane winds often die because they cannot recover from branch damage and defoliation by resprouting from the roots or axial buds. In contrast, A. geminans or L. racemosa can often recover through resprouting [15]. During our visit to the study area on March 21, 2007, we found resprouting A. geminans or L. racemosa around hurricane-induced gaps although many branches of the trees were snapped by hurricane winds. The higher survival rates of A. geminans or L. racemosa than R. mangle trees are important in maintaining the species composition in the mangrove forest because R. mangle preferentially regenerates in the lightning gaps. Whether the change in surrounding tree community will influence the regeneration in gaps caused by hurricanes needs further research.

5. Conclusion

Hurricanes Katrina and Wilma caused substantial damage to the mangrove forest in Everglades National Park. Pre- and post-hurricane LIDAR measurements and field observations for the Broad River and Shark River sites show severe defoliation and branch damage to the mangrove forest by high winds from hurricanes. The number of laser pulses penetrating through the canopy increased drastically after the hurricanes due to severe defoliation. Comparisons between pre- and post-hurricane canopy height distributions indicate that the dominant percentages of canopy heights shift from upper to lower intervals within the forest canopy, and the percentage of ground returns increased. The low mangrove trees adjacent to tidal creeks suffered less damage than the taller mangrove trees located between the tidal creeks.
There were about 300 lightning gaps in areas of 0.6-0.7 km2 at the Shark River and Broad River sites before the 2005 hurricane season. The number of gaps increased to more than 2500 after the forests were impacted by high winds from Hurricanes Katrina and Wilma at both sites. The impact of a hurricane to the mangrove forest is extensive but occurs less frequently, while the impact of lightning strikes is limited in space but is far more regular in their occurrence. Hurricanes and lightning strikes influence the turnover of the mangrove forest in ENP in a coupled way. Lightning strikes form gaps by killing large trees. Seedlings and saplings recruited into lightning gaps often survive hurricane impacts because of the protection from surrounding trees. These surviving seedlings and saplings become important components for sustaining forest recovery after the hurricane.
Mangrove forests at the Broad River and Shark River study sites are different in structure and composition. R. mangle dominates the Shark River site, while L. racemosa dominates the Broad River site. Mangrove trees at the Shark River site are taller and larger in diameter than those at the Broad River site. More lightning gaps occur at the Shark River site than at the Broad River site. These differences apparently reflect different recovery trajectories from the catastrophic impacts of Hurricane Donna in 1960 (Shark River site) and Andrew in 1992 (Broad River site).
Airborne LIDAR technology is effective in quantifying gaps and describing the extent of hurricane impacts by providing direct measurements of tree heights and ground elevation. By capturing the large-scale change of the forest in a snapshot, LIDAR technology provides a new dimension in monitoring forest changes. As it proved in a difficult-to-access mangrove forest in Everglades National Park, LIDAR can be a very useful tool in the study of the spatial and temporal dynamics of extensive forest systems, when the objective is to scale-up from plot data to the landscape level.

Acknowledgments

This work was funded by NASA's Interdisciplinary Science program (IDS). Part of this work was carried out at the Jet Propulsion Laboratory, California Institute of Technology, under a contract with the National Aeronautics and Space Administration. The Florida Coastal Long-term Ecological Site Program (FCE-LTER) sponsored by the National Science Foundation (Grant No. DEB-9910514) also provided partial financial support. We thank Edward Castaneda-Moya, Jay Sah, Sharon Ewe, Susanna Stoffella, and Michael Kline for participating in the tree survey and collection of ground reference data for gaps detected by LIDAR measurements.

References and Notes

  1. Feller, I.C.; McKee, K.L. Small gap creation in Belizean mangrove forests by wood-boring insect. Biotropica 1999, 31, 607–617. [Google Scholar]
  2. Lugo, A.E.; Patterson-Zucca, C. The impact of low temprature stress on mangrove structure and growth. Tropical Ecology 1977, 18, 149–161. [Google Scholar]
  3. Smith, T.J.I.; Robbles, M.B.; Wanless, H.R.; Doyle, T.W. Mangroves, hurricanes, and lightning strikes. Bioscience 1994, 44, 256–262. [Google Scholar]
  4. Armentano, T.V.; Doren, R.F.; Platt, W.J.; Mullins, T. Effects of Hurricane Andrew on coastal and interior forests of Southern Florida: overview and synthesis. Journal of Coastal Research 1995, 21, 111–144. [Google Scholar]
  5. Craighead, F.C.; Gilbert, V.C. The effects of Hurricane Donna on the vegetation of southern Florida. Quarterly Journal of the Florida Academy of Sciences 1962, 25, 1–28. [Google Scholar]
  6. Doyle, T.W.; Smith, T.J.I.; Robblee, M.B. Wind damage effect of Hurricane Andrew on mangrove communities along the southwest coast of Florida, USA. Journal of Coastal Research 1995, 12, 159–168. [Google Scholar]
  7. Piou, C.; Feller, I.C.; Berger, U.; Chi, F. Zonation patterns of Belizean offshore mangrove forests 41 years after a catastrophic hurricane. Biotropica 2006, 38, 365–374. [Google Scholar]
  8. Roth, L.C. Hurricanes and mangrove regeneration: effects of Hurricane Joan, October 1988, on the vegetation of Isla del Venado, Bluefields, Nicaragua. Biotropica 1992, 24, 375–384. [Google Scholar]
  9. Lugo, A.E.; Snedaker, S.C. The ecology of mangroves. Annual Review Ecology and Systematics 1974, 5, 39–64. [Google Scholar]
  10. Lugo, A.E. Mangrove ecosystems: successional or steady state? Biotropica 1980, 12, 65–72. [Google Scholar]
  11. Duke, N.C. Gap creation and regenerative processes driving diversity and structure of mangrove ecosystems. Wetlands Ecology and Management 2001, 9, 257–269. [Google Scholar]
  12. Sherman, R.E.; Fahey, T.J.; Battles, J.J. Small-scale disturbance and regeneration dynamics in a neotropical mangrove forest. Journal of Ecology 2000, 88, 165–178. [Google Scholar]
  13. Shafer, P.E.; Fuelberg, H.E. A statistical procedure to forecast warm season lightning over portions of the Florida Peninsula. Weather and Forecasting 2006, 21, 851–868. [Google Scholar]
  14. Whelan, K. The successional dynamics of lightning-initiated canopy gaps in the mangrove forests of Shark River, Everglades National Park, USA; 2005; Biology, Florida International University: Miami; p. 214. [Google Scholar]
  15. Baldwin, A.; Egnotovich, M.; Ford, M.; Platt, W. Regeneration in fringe mangrove forests damaged by Hurricane Andrew. Plant Ecology 2001, 157, 149–162. [Google Scholar]
  16. Boutet, J.C.; Weishampel, J.F. Spatial pattern analysis of pre- and post-hurricane forest canopy strcuture in North Carolina, USA. Landscape Ecology 2003, 18, 553–559. [Google Scholar]
  17. Weishampel, J.F.; Drake, J.B.; Cooper, A.; Blair, J.B.; Hofton, M. Forest canopy recovery from the 1938 hurricane and subsequent salvage damage measured with airborne LiDAR. Remote Sensing of Environment 2007, 109, 142–153. [Google Scholar]
  18. Simard, M.; Zhang, K.; Rivera-Monroy, V.H.; Ross, M.S.; Ruiz, P.L.; Castaneda-Moya, E.; Twilley, R.R.; Rodriguez, E. Mapping height and biomass of mangrove forests in Everglades National Park with SRTM elevation data. Photogrammetric Engineering and Remote Sensing 2006, 72, 299–311. [Google Scholar]
  19. Sklar, F.; McVoy, C.; VanZee, R.; Gawlik, D.E.; Tarboton, K.; Rudnick, D.; Miao, S. The effects of altered hydrology on the ecology of the Everglades. In The Everglades, Florida Bay, and Coral Reefs of the Florida Keys; Porter, J.W., Porter, K.G., Eds.; CRC Press: Boca Raton, Florida, 2002; pp. 39–82. [Google Scholar]
  20. Ross, M.S.; Meeder, J.F.; Sah, J.P.; Ruiz, P.L.; Telesnicki, G.J. The southeast saline Everglades revisited: 50 years of coastal vegetation change. Journal of Vegetation Science 2000, 11, 101–112. [Google Scholar]
  21. Knabb, R.D.; Rhome, J.R.; Brown, D.P. Hurricane Katrina 23- 20 August 2005; Tropical Cyclone Report. Miami, Florida, USA, 2005. http://www.nhc.noaa.gov.
  22. Powell, M.D.; Houston, S.H.; Amat, L.R.; Morisseau-Leroy, N. The HRD real-time hurricane wind analysis system. Journal of Wind Engineering Industrial Aerodynamics 1998, 77&78, 53–64. [Google Scholar]
  23. South Florida Weather Forecast Office. Hurricane Wilma; 2005; National Weather Service: Miami, Florida, USA. [Google Scholar]
  24. Willoughby, H.E.; Rahn, M.E. Parametric representation of the primary hurricane vortex. Part I: Observations and evaluations of the Holland (1980) model. Monthly Weather Review 2004, 132, 3033–3048. [Google Scholar]
  25. Bitterlich, W. Die Winkelzahlprobe. Allgemeine Forst-und Holzwirtschaftliche Zeitang 1948, 59, 4–5. [Google Scholar]
  26. Grosenbaugh, L. Plotless timber estimates – new, fast, and easy. Journal of Forestry 1952, 50, 32–37. [Google Scholar]
  27. Zhang, K. Identification of gaps in mangrove forests with airborne LIDAR. Remote Sensing of Environment 2008, in press. [Google Scholar]
  28. Zhang, K.; Chen, S.C.; Whitman, D.; Shyu, M.L.; Yan, J.; Zhang, C. A progressive morphological filter for removing non-ground measurements from airborne LIDAR data. IEEE Transactions on Geoscience and Remote Sensing 2003, 41, 872–882. [Google Scholar]
  29. Chen, R.; Twilley, R.R. A gap dynamic model of mangrove forest development along gradients of soil salinity and nutrient resources. Journal of Ecology 1998, 86, 37–51. [Google Scholar]
  30. Patton, D.R. A diversity index for quantifying habitat ‘edge’. Wildlife Society Bulletin 1975, 3, 171–173. [Google Scholar]
  31. Zhang, K.; Houle, P.A.; Ross, M.S.; Ruiz, P.L.; Simard, M. Airborne laser mapping of mangroves on the Biscayne Bay coast, Miami, Florida. Proceedings of 2006 IEEE International Geoscience and Remote Sensing Symposium & 27th Canadian Symposium on Remote Sensing, Denver, Colorado, USA; 2006; pp. 3750–3754. [Google Scholar]
  32. Jensen, J.R. Introductory Digital Image Processing, Third Edition ed; Prentice Hall: New Jersey, USA, 2004; p. 544. [Google Scholar]
  33. Craighead, F.C. The trees of South Florida, vol. 1. The natural environments and their succession; University of Miami Press: Miami, Florida, USA, 1971; p. 212. [Google Scholar]
  34. Goldenberg, S.B.; Landsea, C.W.; Mestas-Nuñez, A.M.; Gray, W.M. The recent increase in Atlantic hurricane activity: causes and implications. Science 2001, 293, 474–479. [Google Scholar]
  35. Clarke, P.J.; Kerrigan, R.A. Do forest gaps influence the population structure and species composition of mangrove stands in Northern Australia? Biotropica 2000, 32, 642–652. [Google Scholar]
  36. Ross, M.S.; Ruiz, P.L.; Sah, J.P.; Reed, D.L.; Walters, J.; Meeder, J.F. Early stand development following disturbance along a mangrove forest productivity gradient in South Florida. Plant Ecology 2006, 185, 283–297. [Google Scholar]
  37. McKee, K.L. Interspecific variation in growth, biomass partition, and defensive characteristics of neotropical mangrove seedlings: response to light and nutrient availability. American Journal of Botany 1995, 82, 299–307. [Google Scholar]
  38. Cardona-Olarte, P.; Twilley, R.R.; Krauss, K.W.; Rivera-Monroy, V. Responses of neotropical mangrove seedlings grown in monoculture and mixed culture under treatments of hydroperiod and salinity. Hydrobiologia 2006, 569, 325–341. [Google Scholar]
  39. Krauss, K.W.; Doyle, T.W.; Twilley, R.R.; Smith, T.J.I.; Whelan, K.R.T.; Sullivan, J.K. Woody debris in the mangrove forests of South Florida. Biotropica 2005, 9–15. [Google Scholar]
Figure 1. The study area is located at the southwest tip of the Florida Peninsula. Mangrove forests in ENP are adjacent to the Gulf of Mexico on the west and Florida Bay on the south. Two polygons represent the Broad River (BR) study site and the Shark River (SR) study site.
Sensors 08 02262f1
Figure 2. DCMs for 2004 and 2006 for the Shark River site. Dense canopy covered the study area before the 2005 hurricane season. Lightning gaps scattered in the 2004 digital canopy model (DCM) as blue dots which represent areas with low canopy height values. Plot locations along a ground survey transect are numbered sequentially from east to west and labeled as grey circles. A large number of gaps were created by Hurricanes Katrina and Wilma, and the canopy was severely defoliated as indicated by the 2006 DCM.
Sensors 08 02262f2
Figure 3. LIDAR derived canopy height distributions for plot 3 (a) and plot 7 (b) along the ground survey transect at the Shark River site. Plot 3 represents an area far away from tidal creeks, while plot 7 represents an area adjacent to tidal creeks.
Sensors 08 02262f3
Figure 4. Tree (DBH>5 cm) diameter distributions for R. mangle, L racemosa, and A. geminas at seven plots aligned E-W along the Shark River transect.
Sensors 08 02262f4
Figure 5. Gaps detected from the 2004 and 2006 DCMs. The number of gaps in the Shark River site increased drastically after the 2005 hurricane season.
Sensors 08 02262f5
Figure 6. Ground photographs for the mangrove forest in November 2004 (a) and November 2005 (b) at plot 4 along the ground survey transect at the Shark River site. The Mangrove forest was defoliated by the hurricanes, and several trees were blown down or leaning as a result of the hurricanes.
Sensors 08 02262f6
Figure 7. Five classes of canopy changes derived using the unsupervised ISODATA method in terms of height distributions from first return LIDAR measurements in 2004 and 2006 (a). DTM derived from 2006 last return LIDAR measurements (b). Severe defoliation due to hurricane wind allows more LIDAR pulses to reach the ground, leading to a better detection of tidal creeks.
Sensors 08 02262f7
Figure 8. Distributions of mean canopy heights and associated standard deviations from 2004 and 2006 LIDAR measurements for five classes at the Shark River site. The bars represent one standard deviation from the mean values. Mean canopy heights for each height interval from the 2006 LIDAR measurements (dash line) are overlaid on the 2004 distributions for comparison purposes.
Sensors 08 02262f8
Figure 9. DCMs of 2004 and 2006 for the Broad River site. Plot locations along a ground survey transect are numbered sequentially from west to east and labeled as grey circles.
Sensors 08 02262f9
Figure 10. LIDAR derived canopy height distributions of 2004 and 2006 for plot 3 (a) and plot 6 (b) along a ground survey transect at the Broad River site.
Sensors 08 02262f10
Figure 11. Tree (DBH>5 cm) diameter distributions for R. mangle, L. racemosa and A. geminans at six plots along the Broad River transect.
Sensors 08 02262f11
Figure 12. Gaps detected at the Broad River site from 2004 and 2006 DCMs.
Sensors 08 02262f12
Figure 13. Five classes for canopy changes derived using the unsupervised ISODATA method in terms of height distributions from first return LIDAR measurements for the Broad River site in 2004 and 2006 (a). The DTM is derived from 2006 last return LIDAR measurements (b).
Sensors 08 02262f13
Figure 14. Distributions of mean canopy heights and associated standard deviations from 2004 and 2006 LIDAR measurements for five classes at the Broad River site. The mean values for 2006 are overlaid on the 2004 curves for comparison purposes.
Sensors 08 02262f14
Figure 15. Tracks of major hurricanes (category 2 and up) influencing the mangrove zone in ENP based on historical hurricane records for the North Atlantic basin from 1851 to 2006.
Sensors 08 02262f15
Figure 16. Decadal changes of hurricanes influencing the mangrove zone in ENP. Major hurricanes: category 2 and up. All storms: tropical storms and hurricanes.
Sensors 08 02262f16
Figure 17. Ground photographs taken at the Shark River site in April 2007 for an old lightning gap created before the 2005 hurricane season (a) and a new gap created during the 2005 hurricane season (b). Note that there are few seedlings in the gap created in 2005. Seedlings and Saplings in the old lightning gap suffered little damage during the 2005 hurricane season because of the protection of surrounding trees.
Sensors 08 02262f17
Table 1. Estimated maximum wind speeds (Vmax) and radius of maximum wind (Rmax) for category 1, 2, 3, 4, and 5 hurricanes using Equation (1). Mean values of the maximum wind speeds for category 1, 2, 3, and 4 hurricanes and the floor value of the maximum wind speed for a category 5 hurricane were used to compute Rmax. The representative latitude of the mangrove zone in ENP is assumed to be 25.4° N.
Category12345
Vmax (m/s)37.645.853.864.069.5
Rmax (km)4035312624
Table 2. Parameters for gap extraction from 2004 and 2006 DCMs. A more detailed description of these parameters can be found in Zhang [27].
Name20042006
Cell size (c) of DCM1 (m)1 (m)
Number of windows for ASF (N)88
Increment of window size (s)2 (c)2 (c)
Gap depth threshold (λ)0.600.60
Minimum canopy height (hmin)5 (m)5 (m)
Minimum gap area (amin)10 (m2)10 (m2)
Window size for filling holes (wf)3NA
Table 3. Estimated total number and area of gaps with areas > 10 m2 in the Shark River and Broad River sites. The parameters left and right of the symbol “/” came from the LIDAR data sets before and after the 2005 hurricane season, respectively.
SiteGap NumberGap Number per km2Gap Area (km2)Gap Area / Total Area (%)Total Forest Area (km2)
Shark River311/2661510/42790.007/0.0741.1/12.10.610
Broad River290/2527424/36940.013/0.0831.9/12.20.684
Table 4. Contributions of first five principal components to the variance of height difference data sets in the Shark River and Broad River sites.
PCAs1st PCA2nd PCA3rd PCA4th PCA5th PCATotal
Shark River44.48%21.90%10.95%6.28%5.19%88.80%
Broad River43.47%29.26%9.36%5.54%4.76%92.39%

