Compound Cellular Imaging of Laser Scanning Confocal Microscopy by Using Gold Nanoparticles and Dyes

Abstract
:1. Introduction
2. Preparation of Samples and Methods
2.1 Synthesis of GNP
2.2 Treatment of Cells
2.3 Lasers and Filters of LSCM
3. Experimental Results & Discussion
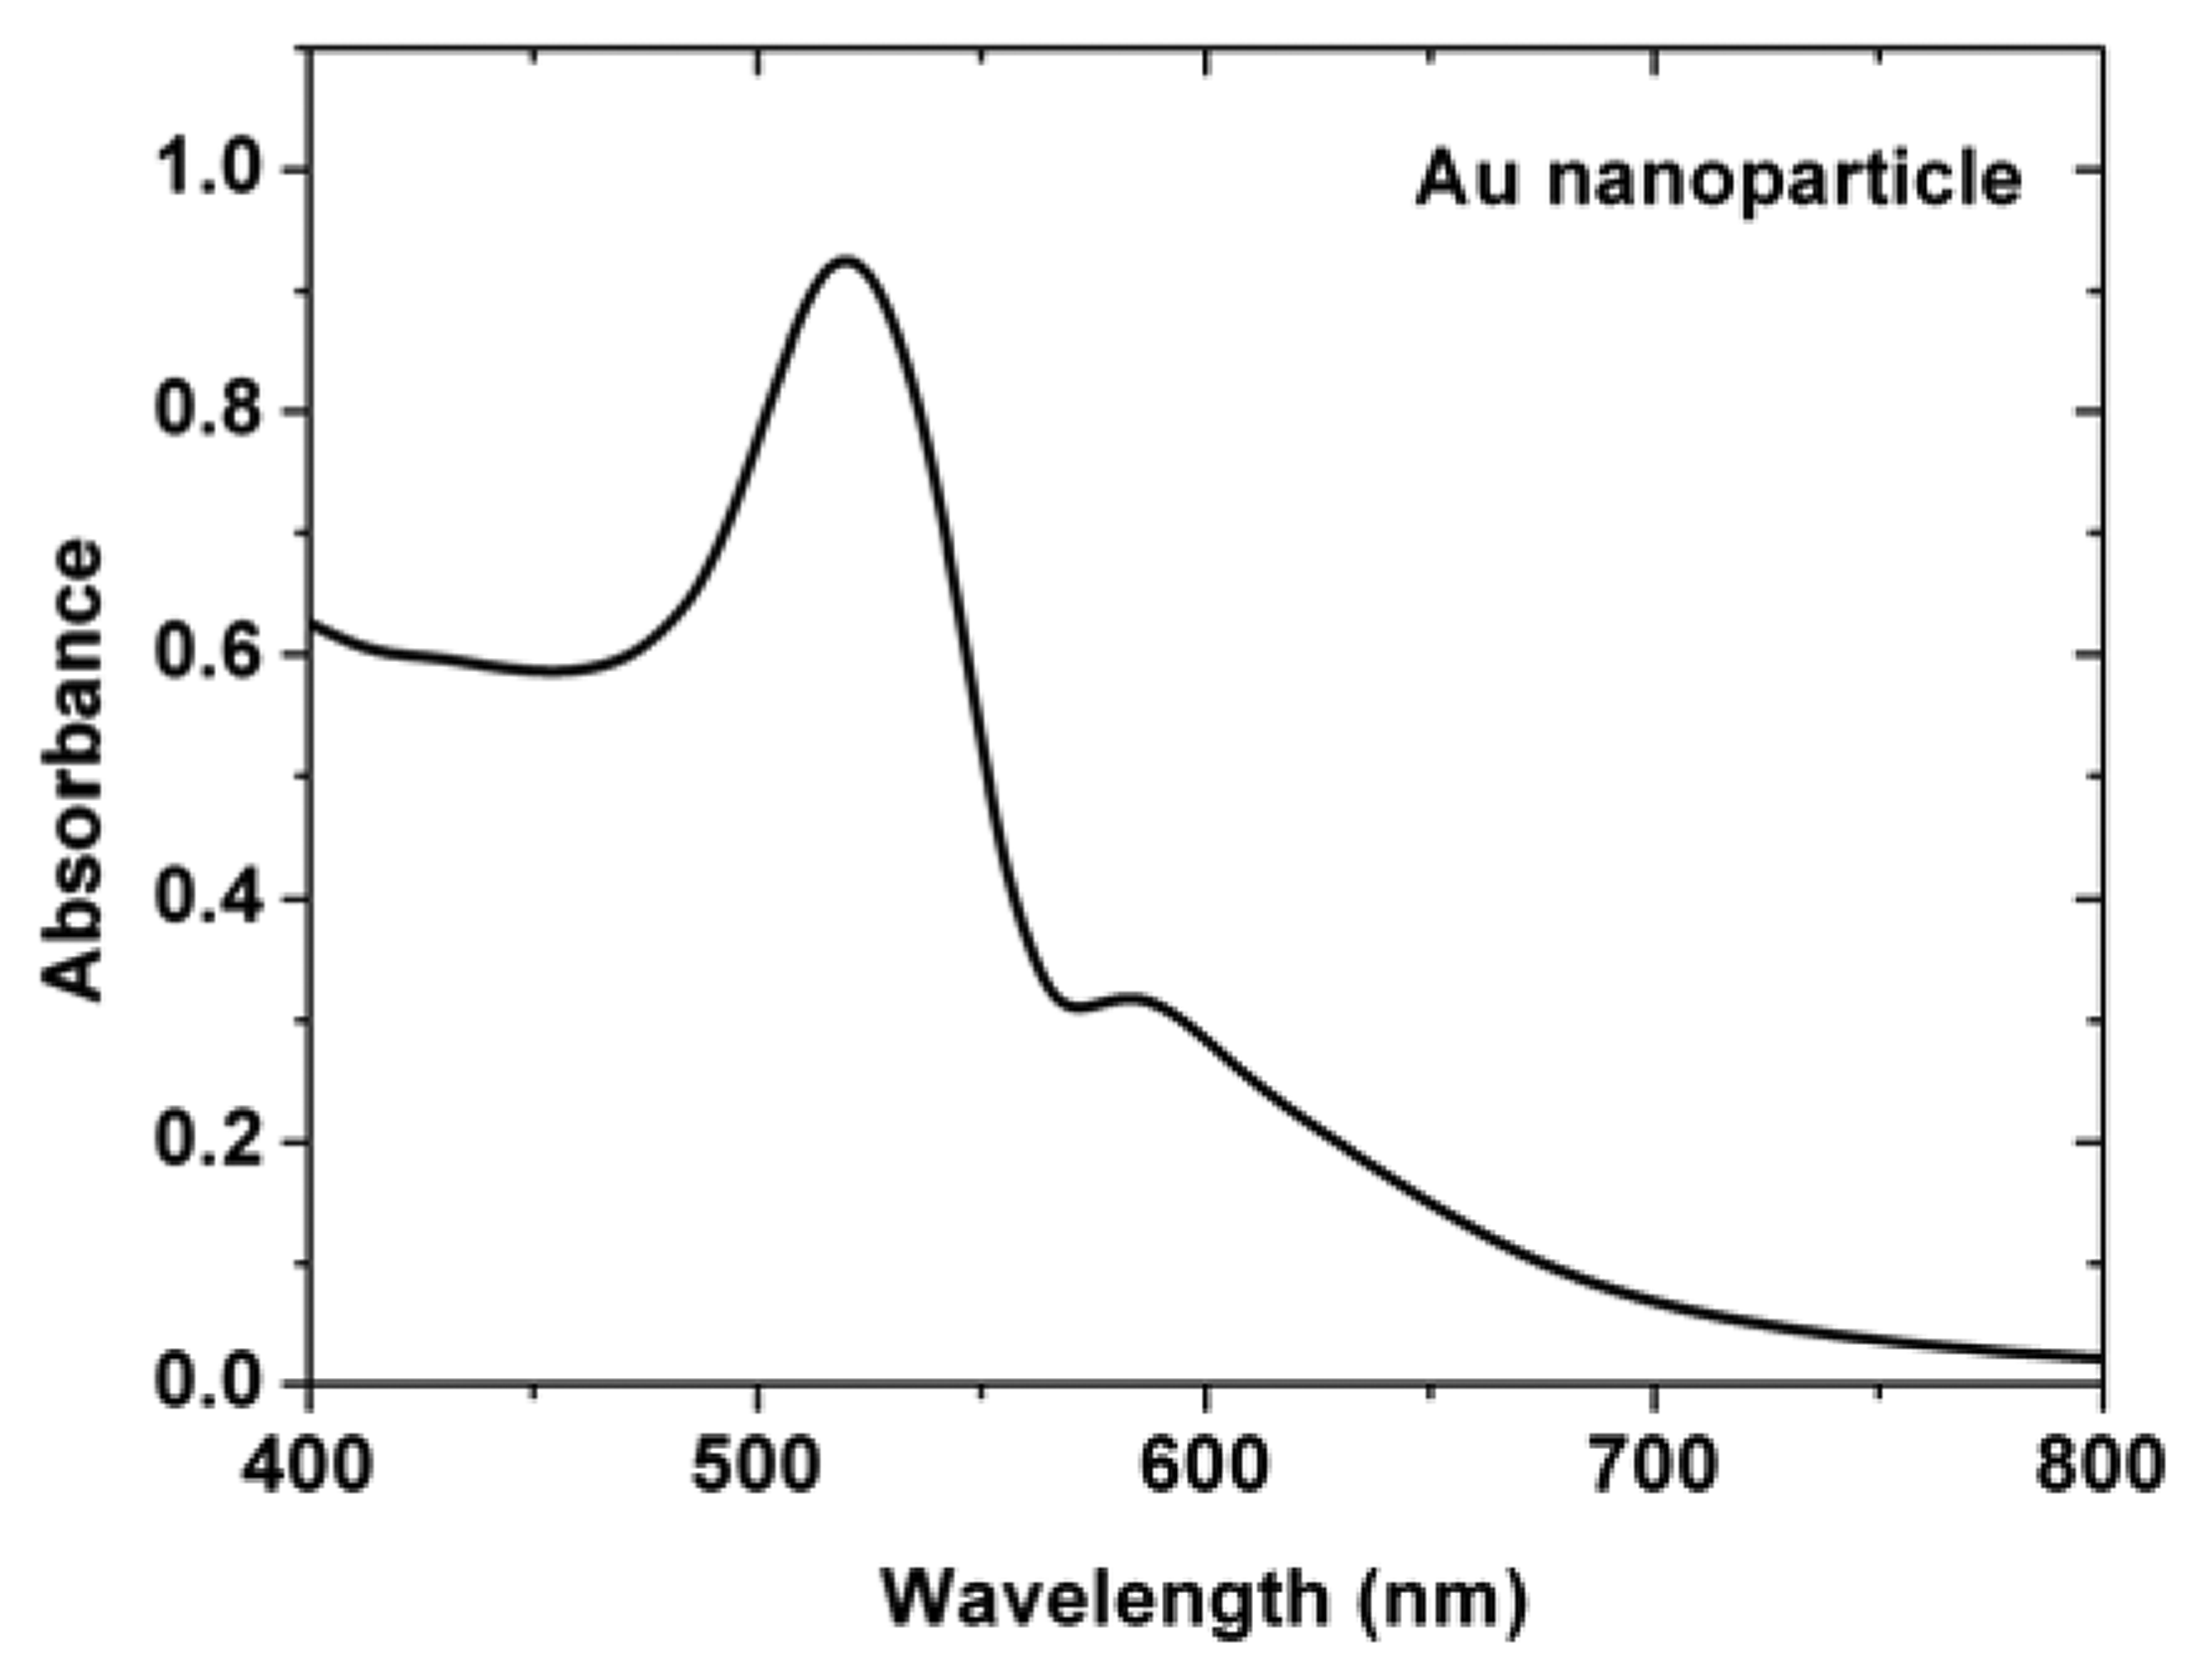
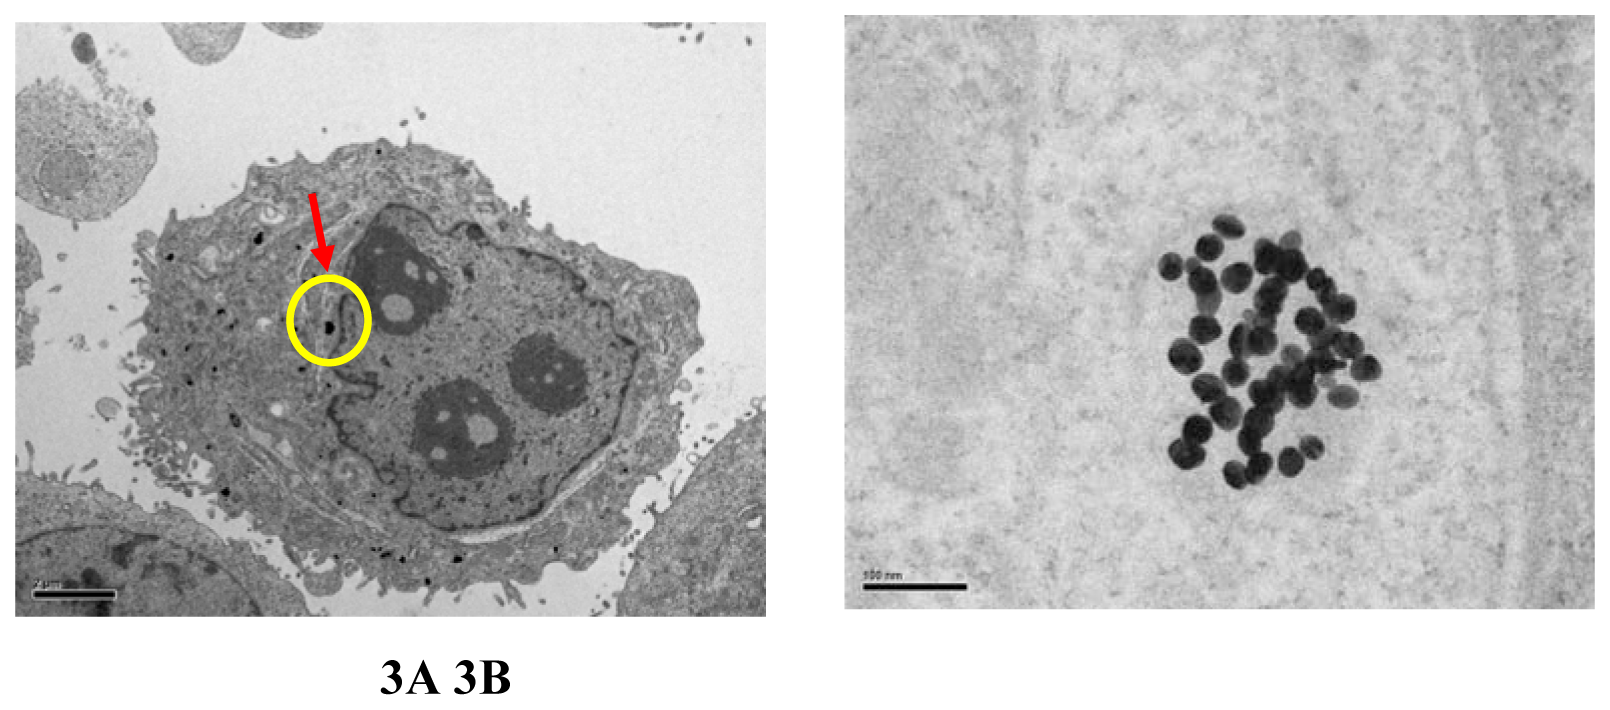
3.1 Image of TEM
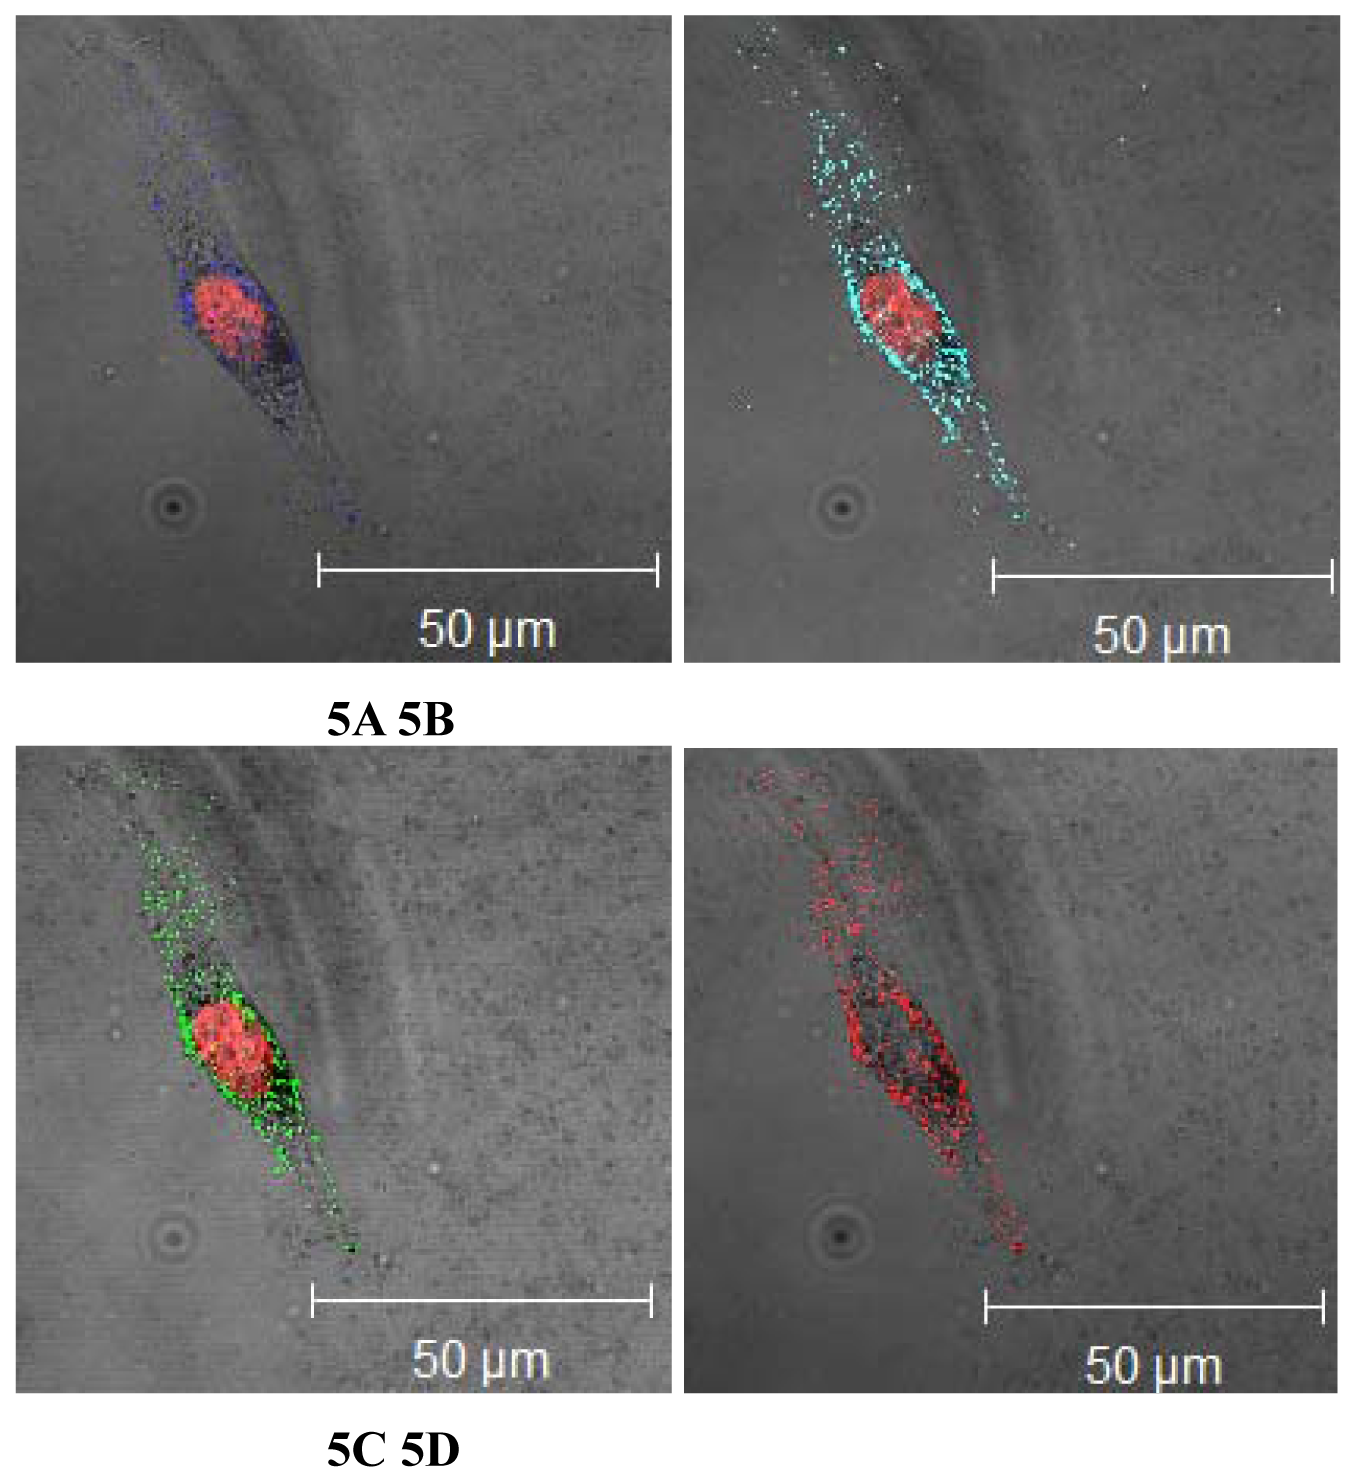
3.2 Images of LSCM
4. Conclusion
Acknowledgments
References and Notes
- Santra, S.; Dutta, D.; Walter, G.A.; Moudgil, B.M. Fluorescent nanoparticle probes for cancer imaging. Tech. Cancer Res. Treat. 2005, 4, 593–602. [Google Scholar]
- Larson, D.R.; Zipfel, W.R.; Williams, R.M.; Clark, S.W.; Bruchez, M.P.; Wise, F.W.; Webb, W.W. Water-soluble quantum dots for multiphoton fluorescence imaging in vivo. Science 2003, 30, 1434–1436. [Google Scholar]
- Jaiswal, J.K.; Mattoussi, H.; Mauro, J.M.; Simon, S.M. Long-term multiple color imaging of live cells using quantum dot bioconjugates. Nature 2003, 21, 47–51. [Google Scholar]
- Schultz, S.; Smith, D.R.; Mock, J. J.; Schultz, D.A. Single-target molecule detection with nonbleaching multicolor optical immunolabels. Proc. Natl. Acad. Science 2000, 97, 996–1001. [Google Scholar]
- Wang, H.; Huff, T.B.; Zweifel, D.A.; He, W.; Low, P.S.; Wei, A.; Cheng, J.X. In vitro and in vivo two-photon luminescence imaging of single gold nanorods. Proc. Natl. Acad. Science 2005, 102, 15752–15756. [Google Scholar]
- Sokolov, K.; Aaron, J.; Hsu, B.; Nida, D.; Gillenwater, A.; Follen, M.; MacAulay, C.; Adler-Storthz, K.; Korgel, B.; Descour, M.; Pasqualini, R.; Arap, W.; Lam, W.; Richards-Kortum, R. Optical systems for in vivo molecular imaging of cancer. Tech. Cancer Res. Treat. 2003, 2, 491–504. [Google Scholar]
- Sokolov, K.; Follen, M.; Aaron, J.; Pavova, I.; Malpica, A.; Lotan, R.; Richards-Kortum, R. Realtime vital optical imaging of precancer using anti-epidermal growth factor receptor antibodies conjugated to gold nanoparticles. Cancer Res. 2003, 63, 1999–2004. [Google Scholar]
- El-Sayed, I.H.; Huang, X.; El-Sayed, M.A. Surface plasmon resonance scattering and absorption of anti-EGFR antibody conjugated gold nanoparticles in cancer diagnostics: Applications in oral cancer. Nano Lett. 2005, 5, 829–834. [Google Scholar]
- Shukla, S.; Priscilla, A.; Banerjee, M.; Bhonde, R.R.; Ghatak, J.; Satyam, P.V.; Satry, M. Porous gold nanoparticles by controlled transmetalation relation: a novel material for application in cell imaging. Chem. Matter. 2005, 17, 5000–5005. [Google Scholar]
- Huang, X.; El-Sayed, I.H.; Oian, W.; El-Sayed, M.A. Cancer cell imaging and photothermal therapy in the near-infrared region by using gold nanorods. J. Am. Cem. Soc. 2006, 128, 2115–2120. [Google Scholar]
- Chen, C.C.; Lin, I.P.; Tzeng, S.C.; Wang, J.W.; Wu, C.H.; Chen, Y.C.; Chen, J.P.; Chen, K.H.; Su, M.T.; Wu, Y.C. DNA-gold nanorod conjugates for remote control of localized gene expression by near infrared irradiation. J. Am. Chem. Soc. 2006, 128, 3709–3715. [Google Scholar]
- Loo, C.; Lowery, A.; Halas, N.; West, J.; Drezek, R. Immunotargeted nanoshells for integrated cancer imaging and therapy. Nano Lett. 2005, 5, 709–711. [Google Scholar]
- Chen, J.; Saeki, F.; Wiley, B.J.; Cang, H.; Cobb, M.J.; Li, Z.-Y; Au, L.; Zhang, H.; Kimmey, M. B.; Li, X.; Xia, Y. Gold nanocages: bioconjugation and their potential use as optical imaging contrast agents. Nano Lett. 2005, 5, 473–477. [Google Scholar]
- Shukla, R.; Bansal, V.; Chaudhary, M.; Basu, A.; Bhonde, R. R.; Sastry, M. Biocompatibility of gold nanoparticles and their endocytotic fate inside the cellular compartment: A microscopic overview. Langmuir 2005, 21, 10644. [Google Scholar]
- Chithrani, B.D.; Ghazani, A.A.; Chan, W.C.W. Determining the size and shape dependence of gold nanoparticle uptake into Mammalian cells. Nano Lett. 2006, 6, 662–668. [Google Scholar]
- Yang, P.-H.; Sun, X.; Chiu, J.-F.; Sun, H.; He, Q.-Y. Transferrin-mediated gold nanoparticle cellular uptake. Bioconjugate Chem. 2005, 16, 494–496. [Google Scholar]
- Aaron, J.; Oh, J.; Larson, T.A.; Kumar, S.; Milner, T.E.; Sokolov, K. Increased optical contrast in imaging of epidermal growth factor receptor using magnetically actuated hybrid gold/iron oxide nanoparticles. Opt. Express 2006, 14, 12930–12943. [Google Scholar]
- Curry, A.; Hwang, W.L.; Wax, A. Epi-illumination through the microscope objective applied to darkfield imaging and microspectroscopy of nanoparticle interaction with cells in culture. Opt. Express 2006, 14, 6535–6542. [Google Scholar]
- He, R.-Y.; Chang, G.-L.; Wu, H.-L.; Lin, C.-H.; Chiu, K.-C.; Su., Y.-D.; Chen, S.-J. Enhanced live cell membrance imaging using surface plasmon-enhanced total internal reflection fluorescence microscopy. Opt. Express 2006, 14, 9307–9316. [Google Scholar]
- Zhang, Y.; Kohler, N.; Zhang, M. Surface modification of superparamagnetic magnetite nanoparticles and their intracellular uptake. Biomaterials 2002, 23, 1553–1561. [Google Scholar]
- Ngoc Bui, M.-P.; Baek, T.J.; Seong, G.H. Gold nanoparticle aggregation-based highly sensitive DNA detection using atomic force microscopy. Anal. Bioanal. Chem. 2007, 388, 1185–1190. [Google Scholar]
- Patra, H.K.; Banerjee, S.; Chaudhuri, U.; Lahiri, P.; Dasgupta, A.K. Cell selective response to gold nanoparticles. Nanomedicine 2007, 3, 111–119. [Google Scholar]
- Aaron, J.; Nitin, N.; Travis, K.; Kumar, S.; Collier, T.; Park, S.Y.; Jose-Yacaman, M.; Coghlan, L.; Follen, M.; Richards-Kortum, R.; Sokolov, K. Plasmon resonance coupling of metal nanoparticles for molecular imaging of carcinogenesis in vivo. J. Biomedical Optics 2007, 12, 034007. [Google Scholar]


| laser | 458 nm | 488 nm | 514 nm | 561 nm | 633 nm |
| filter-I | 443-561 nm | 465-550 nm | 497-561 nm | 508-572 nm | 615-647 nm |
| filter-II | 604-668 nm | 604-668 nm | 604-668 nm | 604-668 nm | 604-630 nm |
© 2008 by MDPI (http://www.mdpi.org). Reproduction is permitted for noncommercial purposes.
Share and Cite
Tsai, S.-W.; Chen, Y.-Y.; Liaw, J.-W. Compound Cellular Imaging of Laser Scanning Confocal Microscopy by Using Gold Nanoparticles and Dyes. Sensors 2008, 8, 2306-2316. https://doi.org/10.3390/s8042306
Tsai S-W, Chen Y-Y, Liaw J-W. Compound Cellular Imaging of Laser Scanning Confocal Microscopy by Using Gold Nanoparticles and Dyes. Sensors. 2008; 8(4):2306-2316. https://doi.org/10.3390/s8042306
Chicago/Turabian StyleTsai, Shiao-Wen, Yi-Yun Chen, and Jiunn-Woei Liaw. 2008. "Compound Cellular Imaging of Laser Scanning Confocal Microscopy by Using Gold Nanoparticles and Dyes" Sensors 8, no. 4: 2306-2316. https://doi.org/10.3390/s8042306