1. Introduction
China is now experiencing urbanization at an unprecedented rate [
1,
2]. Some cities in Southeast China have even doubled in size over the last 20 years and this has led to a great loss of arable land [
3,
4]. In the fast growing areas of China, where land supply is restricted, the cities cannot expand in a sprawl fashion, and thus are becoming higher and more crowded. However, high and dense buildings congested in a small place reduce people's quality-of-life. The literature confirms the influence of urban design on many aspects of people's physical and mental health, and social and cultural vibrancy [
5]. Building density is not only an important issue in urban planning and land management, but also an indicator of a city's evolution, because the buildings constructed in different periods have different styles and vary greatly in how the land is used.
In this paper, both building coverage ratio (BCR) and floor area ratio (FAR) are used to estimate the building density of a city from two aspects, the buildings stretching on the surface and growing along the third dimension. A BCR is the ratio of the total standing area of all buildings to the total area of the interest area, while a FAR is the ratio of the gross floor area of all buildings to the total area of the interest area.
The traditional method to measure BCR and FAR is to survey the area of interest and obtain the heights and shapes of all the buildings; however, this will be quite expensive and time consuming. The Light Detection and Ranging (LiDAR) approach is a quick method to collect topographic data, and is also applicable in the extraction of urban building forms [
6,
7]. Another way is to obtain the building's information from the aerial photos [
8], but the aerial photos are not always affordable.
Nowadays satellite remote sensing could supply higher spatial resolution images, and thus provide an efficient way to collect building's information. Hartl and Cheng pointed out that the building heights and the heights' distribution of a city could be roughly delimited from the shadows on a very good panchromatic SPOT-image, and the delimiting precision could meet the demands of the related researches [
9]. Kim and Muller used a 2 meter resolution Russian DD5 image to detect buildings and stereoscopic images to extract building height, and found that the automatic extraction of large industrial buildings was possible with such imagery [
10]. Shettigara and Sumerling investigated the capabilities of single look SPOT images in determining building heights using shadows, and successfully used an indirect approach to estimate the heights of buildings in their study [
11].
A more recent method was to use SAR images to measure variance of urban building heights. By inverting a simplified coherence model, a measure of building height variance was retrieved from multibaseline ERS coherence images [
12]. Tupin and Roux pointed out that the method to merge SAR and optical information was useful to improve 3D SAR reconstruction [
13]. Other methods also include the merging of high spatial resolution images with the LiDAR data. Sohn and Dowman presented a new approach for automatic extraction of building footprints in a combination of the IKONOS imagery with pan-sharpened multi-spectral bands and the low-sampled airborne laser scanning data [
14].
The objectives of the article are to measure the variation of building density by using BCR and FAR indices in some areas of interest in Shanghai City in China, and to analyze the land use efficiency in these areas. Considering data availability, the method used high resolution satellite images to extract building heights and standing areas to measure the BCR and FAR in the region. This method is useful in analyzing urban building density in similar regions.
2. Research Area
Shanghai region lies in the central part of China's Pacific coast, and covers an area of 6340 km
2. With 0.1% of the land area of the country, it supplies 13% of the nation's revenue and handles more than a quarter of China's total exports. Its population, according to the 2003 Census, was 17.11 million. Since 2000, Shanghai grew at an average GDP rate of more than 12% [
15]. Its capital, Shanghai City is now the largest and greatest commercial and industrial city in China.
With the fast growing economy, Shanghai City accelerated its capital improvement in the last twenty years, and this led to a remarkable transformation in the city's spatial form and associated functional activities [
16]. More than 4000 high buildings have been built, 13 of which are super high buildings over 200 meters in height [
17]. However, it is not a finished process. The great profit obtained from the building of skyscrapers and luxurious villas has brought the land development to a boil. As a result of vigorous land development, the city is becoming more and more diverse in the spatial forms.
According to the urban planning and the urban evolution result, Shanghai City could be divided into the inner circle and the outer circle. The inner circle occupies an area of 100 km2, while the outer-circle delimiting the urban boundary covers 620 km2. Before 1992, Shanghai was a city with many low rise buildings, even in the center, and then the local government began its self-improvement after three big removal and resettlement campaigns in 1992, 2000 and 2005. However, due to some historical reasons and the large amount of fees for resettlement, areas of historical buildings called “Shikumen” and the formerly built residential areas are still left undeveloped.
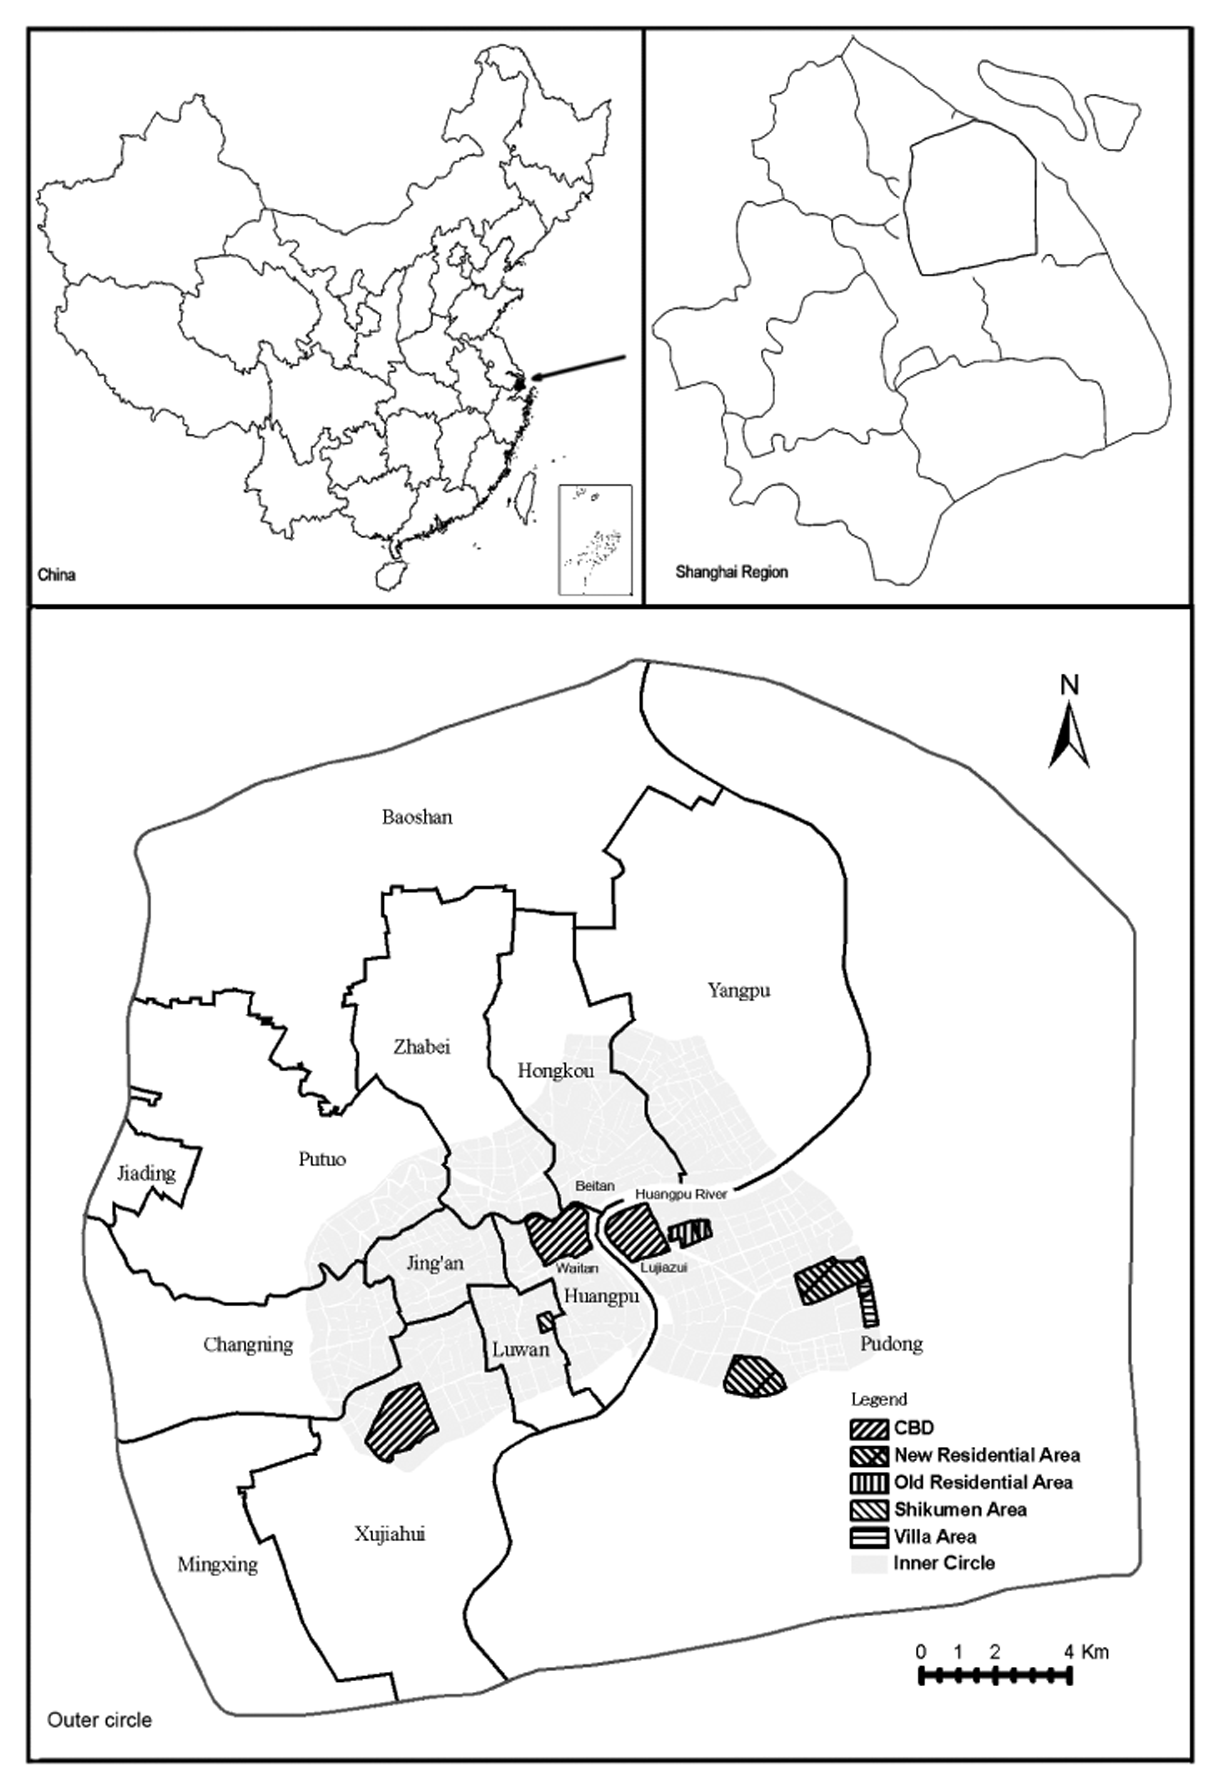
In our research, several areas of interest were selected to represent different types of commercial and residential areas of the city (
Figure 1). The planned CBD (Central Business District) of Shanghai City is divided into three parts by the Huangpu and Shuzhou rivers: the Lujiazui in Pudong sub-region, the Waitan in Huangpu sub-region and Beitan in Hongkou sub-region. However, only the CBD Lujiazui and an area called Huangpuqu commercial center, that includes CBD Waitan, were selected in this research. The Xujiahui commercial center is also called a CBD by some people and was also included in the research. For the residential areas, a typical “Shikumen” district, two residential areas built before 1980s, and two newly built residential areas and two villa areas were selected to represent different types of residential areas. For comparison, the inner circle of Shanghai was also selected to measure the variation of building density of the city.
3. Methodology and Materials
A SPOT5 (scene: 296/287) PAN (2.5 meters in resolution) image and the multi-spectral images acquired on December 2004 were mainly used to obtain the building information. A QuickBird image (PAN, with resolution of 0.6 meter) acquired on July 2004 was also used, but it cannot cover all the area of Shanghai City. The satellite images were firstly georeferenced to a local projection coordinate system using ArcMap and ENVI system before further processing.
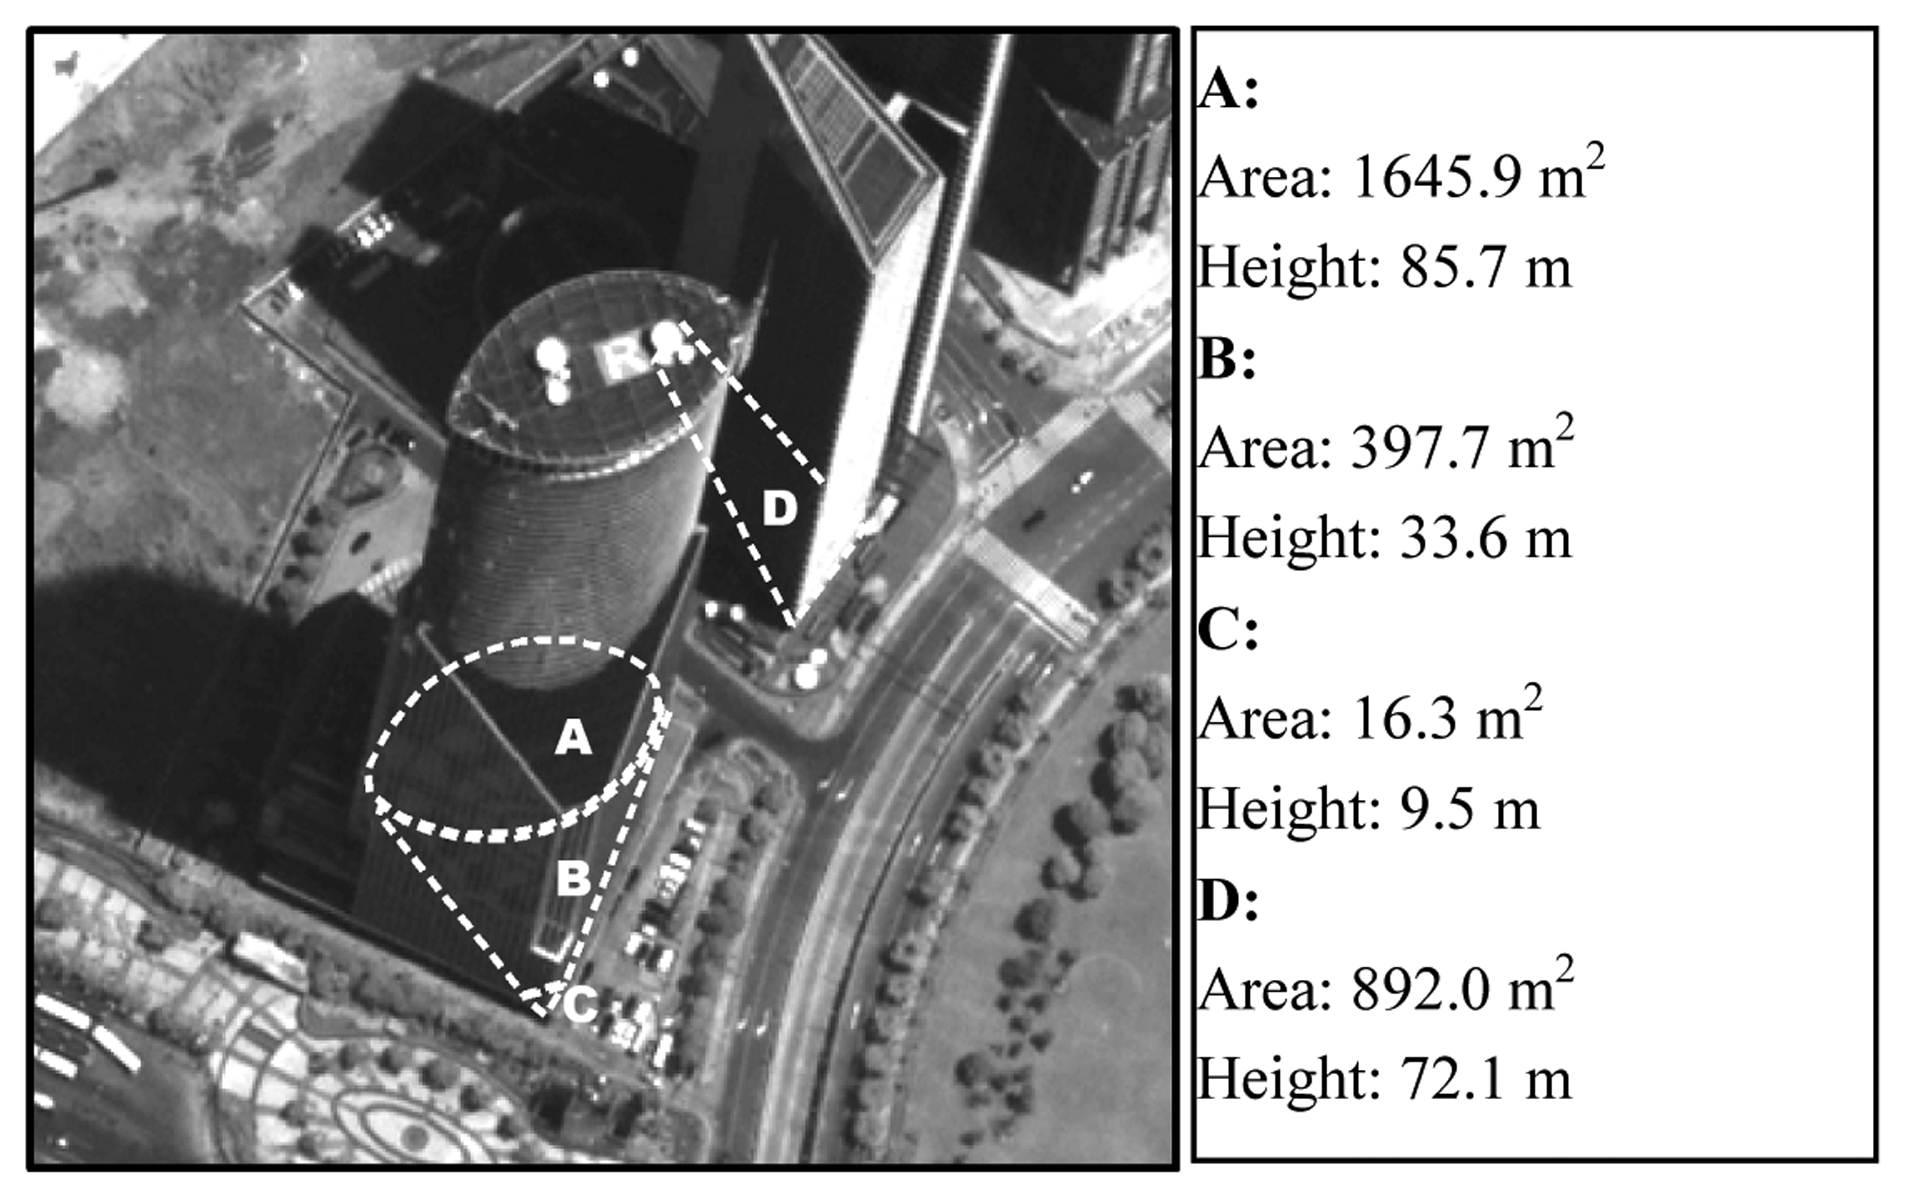
As to the calculation of the BCR, the key is to draw the standing area of each building (projected area). Since most building's standing areas cannot be seen clearly from the images, the main shape of the building's top was drawn and then adjusted to the real location and shape of the building's foot. If a building's shape is complicated, then it was divided into several simple parts. In
Figure 2, the front building is separated into three parts: A, B, C, each of which has different shape and height. Therefore the total area of the three parts represents the standing area of this building.
After drawing the building's shape, the next important step is to measure the height of each part of the building. Usually a building's height was estimated from its shadow [
18]; however, since buildings are densely distributed in Shanghai City, and the shadow of one building is usually mixed with the shadows of other buildings on the images, some of the building's heights could not be estimated directly from the shadows.
In this case, the building's facade facing us was used to help the calculation. The distance between the top and the bottom of a building's facade was measured from the satellite images in the GIS system. The ratios of the measured distance to the real height of all buildings should be the same for a satellite image. Since the ratios could be calculated from some known buildings, the heights of unknown buildings were thus estimated. However, for different satellite images, these ratios should be estimated separately.
In the research, five famous buildings in the Lujiazui area were selected to estimate the ratios of measured distance to the real building height for the two types of satellite images.
Table 1 shows that the ratios between the measured distance, the measured shadow length and the building height are stable for both the SPOT and QuickBird images. The coefficients of variation are less than 5%, which means that the variation within the ratio of facade and height of the building is low. The ratios are then used to measure building heights in the selected research areas.
After obtaining the building's height, the BCR and the FAR within an area of interest are calculated from the following equations:
where
H is the height of a building,
F is a building's standing area,
C is a constant which represents the average height of one storey of all the buildings (here
C = 2.8 m),
A is the total area of a site, FAR and BCR is the floor area ratio and building coverage ratio of a site. A site here refers to a block or a delimited area, usually including one or several blocks.
Since building density is very dense in the “Shikumen” area, and the building's facades cannot be seen from the SPOT image, two typical “Shikumen” districts from the QuickBird image were selected as the representation of the high-density area to calculate the FAR and BCR.
The ArcMap and ENVI software are used in the calculation. The shapes are drawn and the heights are measured in the ArcMap system, the image processing is done by ENVI and ArcMap as well. The statistics of the measurements is done by using SPSS software and ArcMap system.
4. Results
4.1 The distribution of the building density within the inner circle
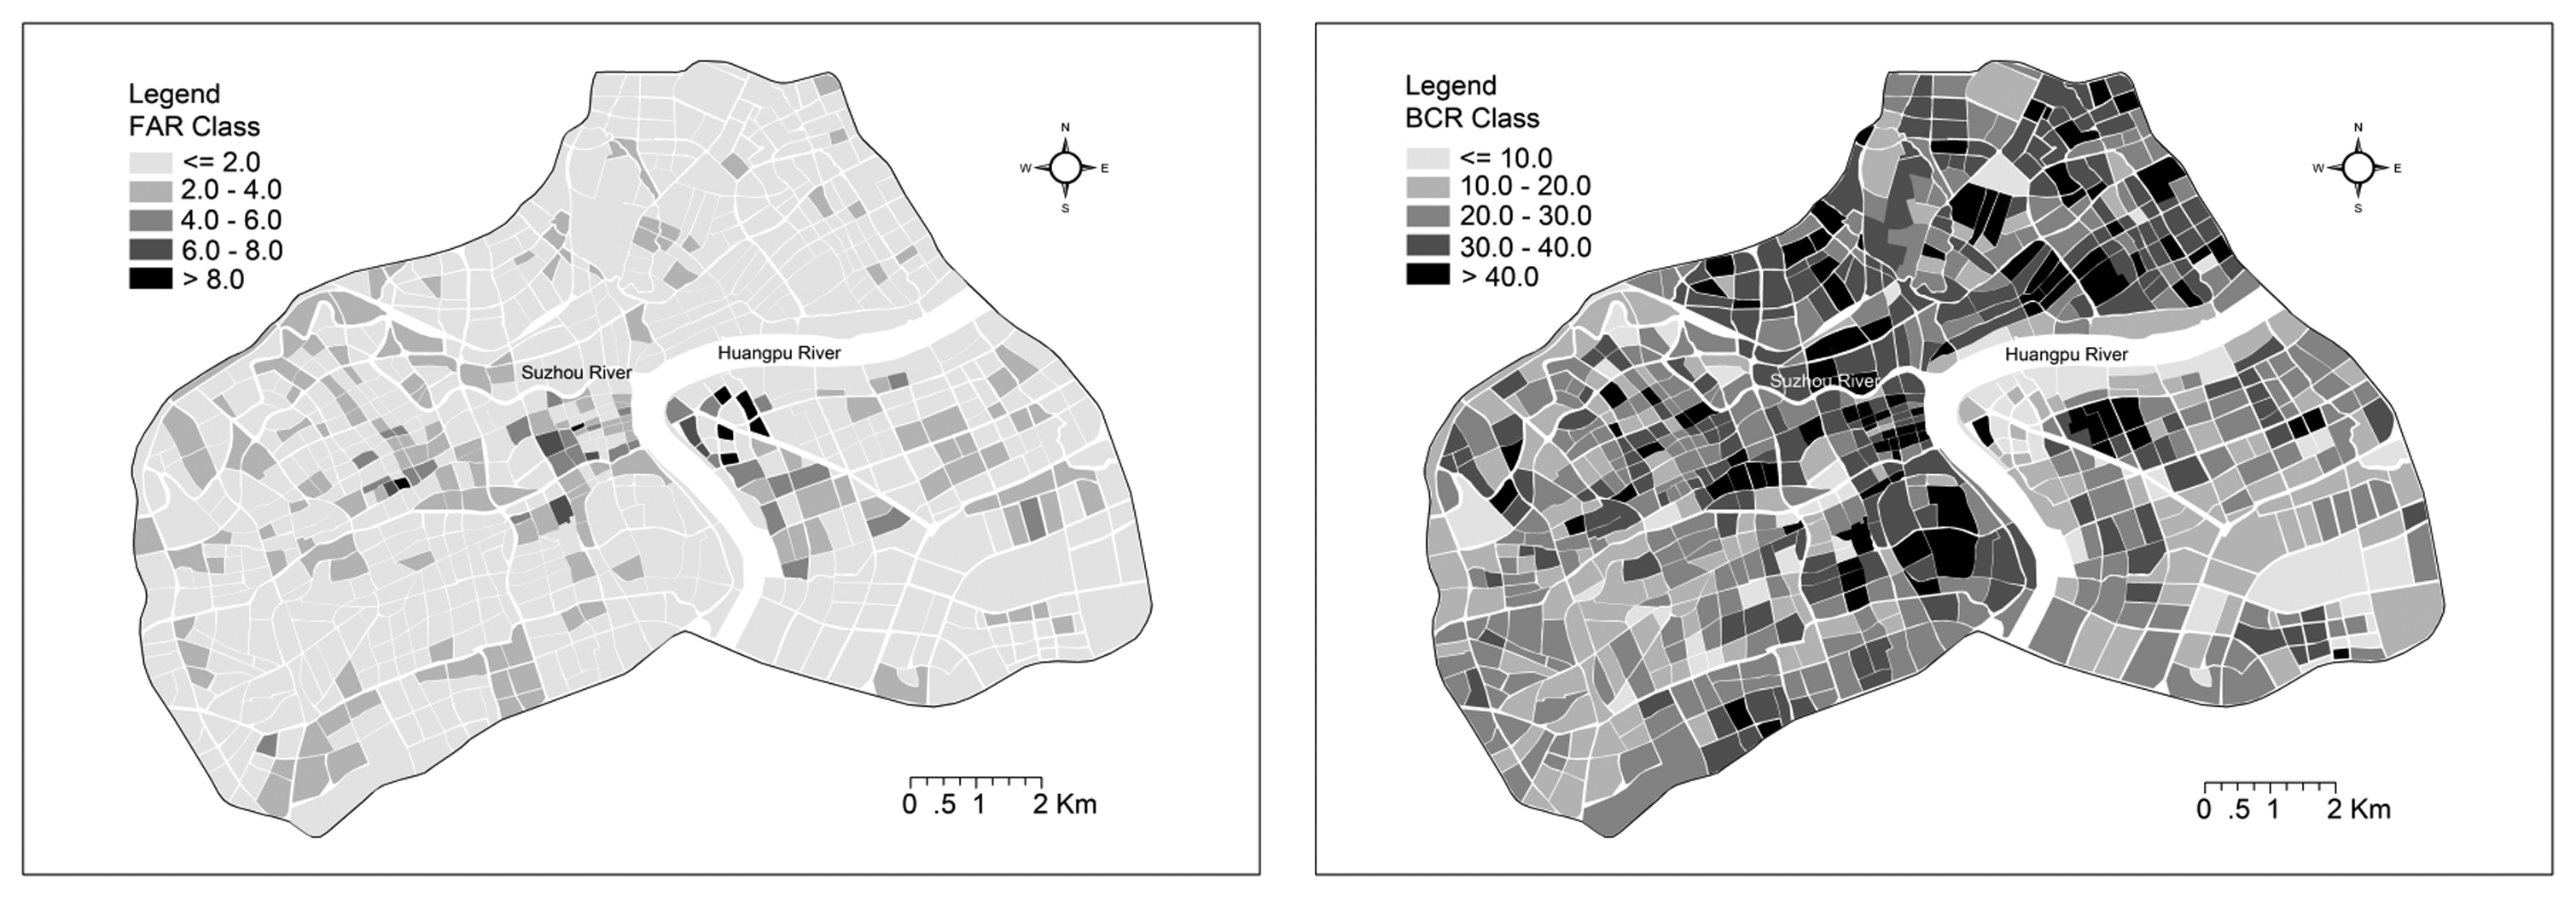
The distributions of FAR and BCR are shown in
Figure 3. It shows that the higher FAR areas are more aggregated, and locate in the center of the inner circle along the Huangpu River and Suzhou River, while the higher BCR areas are more scattered, and interlaced with the higher FAR areas in many places.
Table 2 lists the statistic results of the FAR and BCR based on all the blocks within the inner city. It shows that the average FAR and BCR value are 1.6 and 26.6% respectively for the city's inner circle. The standard deviation could be as high as 1.3 and 11.2% for the FAR and BCR, and the coefficients of variation are 0.82 and 0.42 respectively. The results also indicate that the variation of FAR is higher than that of BCR.
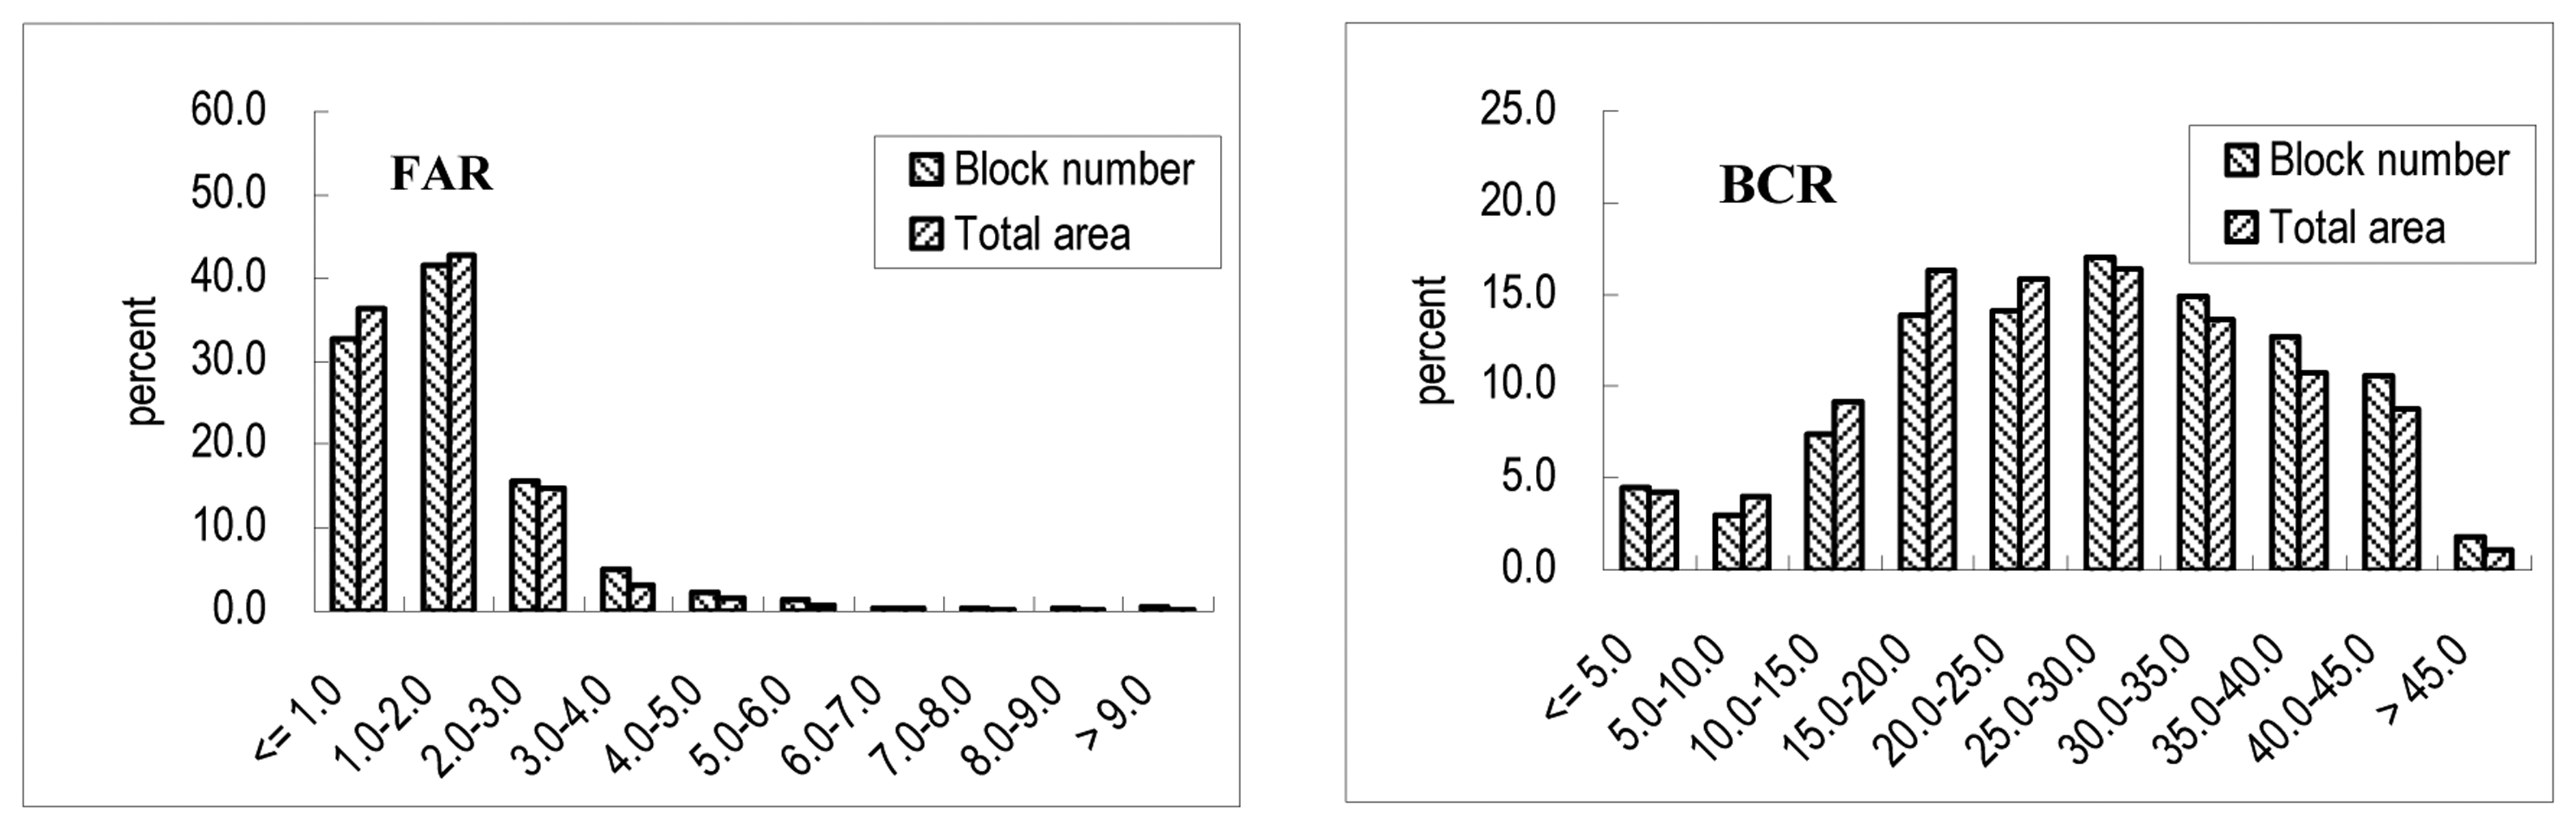
Figure 4 shows the frequency distribution of FAR and BCR values of all the blocks within the inner circle. The figure shows that about 90% of all the blocks have FAR values of less than 3, while more than 80 percent of the blocks are between 15% and 45% for BCR. It also shows that the frequency distribution of BCR is more like a normal distribution, while the FAR is a more skewed one.
It could be concluded that the building density along the third dimension varies more than that on the surface within the inner circle of the city. Since a city usually developed from an older one, which generally has higher BCR and lower FAR, the greater variation in FAR and less variation in BCR would suggest that the city is still in developing and more reconstructions are highly expected. Thus, a better planning and management of the urban land is needed.
4.2 The variation of the building density in the commercial areas
Table 3 shows that all the selected commercial areas have higher FAR than the inner circle, and have lower BCR except for the Huangpuqu commercial zone. The results also show that the CBD Lujiazui has the highest FAR with the lowest BCR, and the Huangpuqu zone and Xujiahui zone both have higher FAR, however, the Huangpuqu zone has higher BCR.
The reason for this is that the CBD Lujiazui was newly designed as a symbol of the city, and holds many higher skyscrapers, more green land and common spaces, while the Huangpuqu zone is the traditional commercial center of Shanghai City, dating back to before the foundation of the P.R. China, which holds more moderate high buildings, but with less common spaces. Its higher FAR results from both a higher BCR and many moderately high buildings. The Xujiahui zone is a newly built commercial area designed to have more common places and higher buildings, however, it is still in development and had some undeveloped areas at the time of the remote sensing.
Although the three commercial zones have different FAR and BCR, still it could be concluded that the new commercial areas usually have higher FAR and lower BCR, however, the traditional commercial centers have higher FAR and higher BCR. It suggests that the newly built commercial areas use land in a more efficient way.
4.3 The variation of the building density in the residential areas
Table 3 also shows the difference of FAR and BCR among the residential areas built in different periods. The “Shikumen” areas have the lowest FAR and almost highest BCR, while the new residential areas have the highest FAR and lowest BCR. However, the older residential areas built before the 1980s have the highest BCR and FAR which is more than twice as much as that of the “Shikumen” area. This is because the “Shikumen” areas were built before the foundation of the P.R. China, and the buildings usually are two-floor ones, while there are usually 4 to 5 floors in the older residential areas built before 1980s. The villa areas are quite different from other residential areas in that they have lower FAR and BCR. Usually the FAR is lower than 1, and the BCR is less than 30%. Thus, it could be concluded that the different residential area varies greatly in FAR and BCR. The early built residential areas have highest BCR, and the newly built areas have highest FAR except in the villa area. The results also indicate that the villas areas are not efficient in using land.
5. Discussion
The methods used to extract a building's information from high resolution satellite images are applicable to our research; however, the methods are actually based on some assumptions when measuring the FAR and BCR values. The shape of the building's standing area cannot be seen directly from the image, thus the roof is drawn first and then adjusted to the standing shape. In this procedure, we assume that the unseen parts of the building are the same as those of the top. This is true for simple and regular buildings; however, when the building is complicated the unseen parts of the building might be quite different and couldn’t be drawn out, even though we had used the trick of separating it into several simple parts to deal with this problem. Obviously this will introduce errors in the calculations. Another assumption is about the roofs of buildings. As is well known, roofs are very diverse in form: some are flat, some have a spire, and others might be inclined. In the article we counted in neither the spire part nor inclined tops. The most fundamental assumption is that the area of each storey of a building is the same when calculating the FAR. That is true for regular buildings; for other buildings each floor area might be quite different. However, the calculation of the FAR of those irregular buildings is very difficult, so we could only use some assumptions.
Therefore, errors are still unavoidable though some techniques are used to deal with those problems. However, since our object is to show the variation of the building density, the relative value is much more focused. Thus, the comparisons between different kinds of study areas are reasonable. The absolute values of the FAR and BCR stated in this article act as a reference, though they are still quite precise in value. The method used to extract FAR and BCR values from the satellite images in the article is more efficient than the traditional survey method. It should be applicable for other similar studies.
As to the results, it is clear that all the newly built building areas have higher FAR and lower BCR, except the villa areas. In South East China, the economy is growing very quickly, and there is a great demand for the land resources. However, the application of land used for urban or manufacture is subject to strict examination by the local governments before approval. Land developers would like to build higher skyscrapers to obtain more profits, but the central and local governments have published regulations to limit the increasing FAR for both commercial and residential area, because too dense buildings and high skyscrapers would affect people's life quality and would give rise to more complaints. Shanghai City regulations encourage 9 to 12 storey-high residence buildings, and promote a FAR of less than 2.5 within the inner circle [
19]. From our research, the newly built residential area satisfies these requirements. However, for the villa area, the regulations also stated that building areas with FAR less than 1 or the floor area more than 144 m
2 are not approved by the government, as this kind of building would occupy and waste large amounts of land. Our research, consistent with other research results [
20], shows that the villa areas cannot meet the requirements of the regulation. From 1998 to 2005, a total of 265 villa areas were built, occupying 6780 ha of land in total, and all these villa areas have FAR values of less than 1 [
20]. Assuming that the FAR of all these areas were increased to near 2.5, and then about one third of the land resources could be saved. It is not practical to limit the building of villas; however, limiting the further building of villas with low FAR is important in land management.
6. Conclusions
The building coverage ratio (BCR) and floor area ratio (FAR) were measured from the high spatial resolution satellite images. Since the two indices reflect the building's stretch on the ground and the vertical height within an area, they are used in the measuring of building density in Shanghai City in China. The results show that the variation of FAR is higher than that of BCR in the inner circle. The newly developed areas usually have higher FAR and lower BCR for the commercial areas except in the traditional commercial center, where buildings are medium high and densely distributed. The results also show that, except for the villa areas, the newly developed residential areas have higher FAR and lower BCR. The results indicate that both older residential area and villa areas are inefficient ways of using urban land resources. It suggests that a better planning and management of land resources is required for future reconstruction in Shanghai City.


