Metal-Organic Frameworks for Sensing Applications in the Gas Phase

 ,
,
Abstract
: Several metal-organic framework (MOF) materials were under investigated to test their applicability as sensor materials for impedimetric gas sensors. The materials were tested in a temperature range of 120 °C - 240 °C with varying concentrations of O2, CO2, C3H8, NO, H2, ethanol and methanol in the gas atmosphere and under different test gas humidity conditions. Different sensor configurations were studied in a frequency range of 1 Hz -1 MHz and time-continuous measurements were performed at 1 Hz. The materials did not show any impedance response to O2, CO2, C3H8, NO, or H2 in the gas atmospheres, although for some materials a significant impedance decrease was induced by a change of the ethanol or methanol concentration in the gas phase. Moreover, pronounced promising and reversible changes in the electric properties of a special MOF material were monitored under varying humidity, with a linear response curve at 120 °C. Further investigations were carried out with differently doped MOF materials of this class, to evaluate the influence of special dopants on the sensor effect.1. Introduction
Metal-organic framework materials (MOF) are well-known since they can store large amounts of hydrogen [1,2] or can be applied for gas purification [3]. These applications are based on their high specific surface area, which is a result of their high and ordered porosity. As small molecules like hydrogen are only adsorbed and not covalently bound to the surface, they can be released completely, for example at lower partial pressures. Furthermore, catalysis is another potential field of application for MOFs [3,4]. Due to the highly modular synthesis of MOF structures, their chemical as well as morphological properties can be modified with respect to the desired application. Thus, MOFs with functionalized cavities and tailored pore sizes are accessible. Moreover, catalytic properties can be implemented by active metal centers, which simultaneously serve as nodes for the coordination framework and as reaction centers for the catalyzed reaction itself. Reference [4] reviews several catalysis applications including Ziegler-Natta polymerization, Diels-Alder reaction, photoreactions, etc.
MOFs were shown to possess superior sorption properties compared to classical sorption materials. For example, the storage capacities of zeolites and activated carbon were exceeded by almost a factor of two for carbon dioxide [5] and hydrogen [3], respectively, by use of specific MOFs. MOFs offer several advantages over zeolites and activated carbon such as their modularity, higher porosity and functionality. Still, most metal-organic frameworks are thermally and chemically significantly less stable than zeolites, so applications at high temperatures (> 400 °C) and under chemically extremely severe conditions are still reserved to purely inorganic sorption materials.
The reversible sorption behavior suggests the investigation of MOF materials for gas sensor purposes. The change of the dielectric properties of the materials, caused by adsorption or desorption of molecules on the inner surface of the MOF, might be utilized to detect selectively small amounts of gaseous analytes by measuring the electrical impedance of the material. For the first time, this study investigates MOF materials for gas sensing.
In particular, the ability to detect different amounts of humidity in gas atmospheres with MOF materials was studied. It is known from several examples reported in the literature that hydration-dehydration of MOFs can significantly change the 3D-structure of the metal-organic framework. For MIL-53, an aluminum terephthalate, a breathing effect was observed upon hydration-dehydration with a compressed structure for the dehydrated MOF [6]. A similar observation was made for the nanoporous coordination polymer [Ag6Cl(atz)4] (atz = 3-amino-1,2,4-triazolate) [7]. Here, hydration-dehydration induces a remarkable crystal interconversion between two different tetragonal structures. Adsorption of ethanol from the vapor phase was investigated using a Ni-based MOF [8]. Interestingly, only slight structural readjustment upon sorption and desorption of the simple alcohol was found.
Humidity is of great importance in a wide field of domestic and industrial applications, e.g. the quality control of production processes or an intelligent control of the living conditions in buildings [9]. From this multiple applications, different requirements arise for humidity sensors, e.g., operating temperature, humidity range, solvent stability [10]. To meet these requirements, a wide variety of sensor mechanisms was investigated for the detection, e.g., optical, resistive, capacitive, piezoresistive, gravimetric, or magnetoelastic [11]. The materials used for these sensors mainly originate from the ceramic, polymer, and semiconducting materials class [12], whereas metal-organic framework materials have not yet been investigated for this purpose to our knowledge.
The sensing mechanism of the different materials is mainly based on physical adsorption or absorption of water molecules from the surrounding atmosphere causing a change in the electrical properties (impedance or resistance and capacitance) of the sensing material [13].
Each of these sensor types suffers from limitations, so intensive research in this field continues. The main drawback of these sensors is that they are mostly only designed to detect relative humidity (rH) in the range of 10 – 90 % rH and to work at room temperature or slightly above [14]. Ceramic humidity sensors have to deal with the formation of stable chemisorbed OH− at their surface. To avoid a drift in the resistance of those ceramic sensors induced by chemisorption, a periodic heat treatment at temperatures higher than 400 °C is necessary to regenerate the sensor surface [15]. Hence, ceramic humidity sensors are often equipped with a supplementary heater for this regeneration process causing extra cost and complexity [16]. This heat cleaning is not necessary for polymer sensors and their fabrication cost is much lower than for ceramic ones, as they do not need high-temperature processing [17]. However, polymers often lack thermal or chemical stability and cannot be used as humidity sensors in harsh environments. Moreover, polymer film sensors show slow response times, hysteresis and long-term drift when exposed to some solvents [10]. Even the use of metal-oxides, although thermally resistant, is restricted to oxygen rich, non reducing atmosphere. For high temperature applications above 400 °C in reducing conditions, zeolites have been investigated recently [14], but there is still a lack of sensors for medium temperature application from 100 – 300 °C [10].
The tested MOF materials are stable in a temperature range up to 250 °C [18]. As the production and processing of MOF materials is rather cheap and adsorption and desorption phenomena of water can be assumed from their surface characteristics and chemical properties as depicted above, these materials are investigated as new materials class for humidity sensors.
2. Experimental
2.1. Sensor materials
Metal-organic frameworks (MOFs) are coordination polymers composed of metal ions and organic linkers. Within the framework, the organic linkers act as bridging ligands between the metal ions. Depending on the vacant sites on the metal ion and the connectivity of the organic linker, 1-, 2- and 3-dimensional polymers can be formed. References [4] and [19] review the general aspects of porous coordination polymers and MOFs.
Three basic MOF materials were tested including Al-terephthalate-MOF (Al-BDC, Basolite™ A100), Fe-1,3,5-benzenetricarboxylate-MOF (Fe-BTC), and Cu-1,3,5-benzenetricarboxylate-MOF (Cu-BTC). In Addition, Li-doped (Fe-BTCld) and Fe(II)-doped (Fe-BTCfd) Fe-1,3,5-benzene-tricarboxylate-MOFs were investigated in the sensing experiments. According to thermogravimetric analyses, the tested MOF materials are stable in a temperature range up to 250 °C [18]. The described MOFs were chosen due to practical reasons: all of them can be synthesized on an industrial scale starting from readily available chemicals. Thus, the MOFs presented herein are available for reasonable prices and can be produced even on large scales. Al-BDC, Cu-BTC, and Fe-BTC can be purchased as BASF-products Basolite™ A100, Basolite™ C300, and Basolite™ F300 from Sigma-Aldrich.
Fe-BTCld
A 100 mL electrochemical beaker cell equipped with an iron anode and a steel cathode (each with an active electrode surface of 2 cm × 5 cm; electrode gap of 1 cm) was charged with a solution of 1,3,5-tricarboxylic acid (960 mg, 4.3 mmol) and methyltributylammonium methylsulfate (960 mg, 60 weight-% in methanol) in methanol (62.25 g). After warming the electrolyte to 32 °C electrolysis was performed at 3.8 A/dm2. After 55 minutes, a charge of 3 F/mol 1,3,5-tricarboxylic was passed and the electrolysis was stopped. Weight loss at the anode indicated anodic dissolution of 66 mmol Fe(II). The resulting brown suspension was kept at 32 °C and LiPF6 (100 mg) was added. After stirring for 12 h at ambient air the suspension brightened up and was filtered, washed with methanol (15 mL), and dried in vacuum at 120 °C for 12 h. Yield: 1.3 g; Langmuir surface area: 1454 m2/g; elemental analysis: 22% Fe, 32.6% C, 42.3% O, 0.32% S, <0.5% N, 3.1% H, 0.03% Li.
Fe-BTCfd
Fe-BTC (3 g; Langmuir surface area 1295 m2/g) and FeSO4 × 7 H2O (150 mg) were finely ground in a mortar for 10 minutes under an Ar-atmosphere.
2.2. Sensor preparation
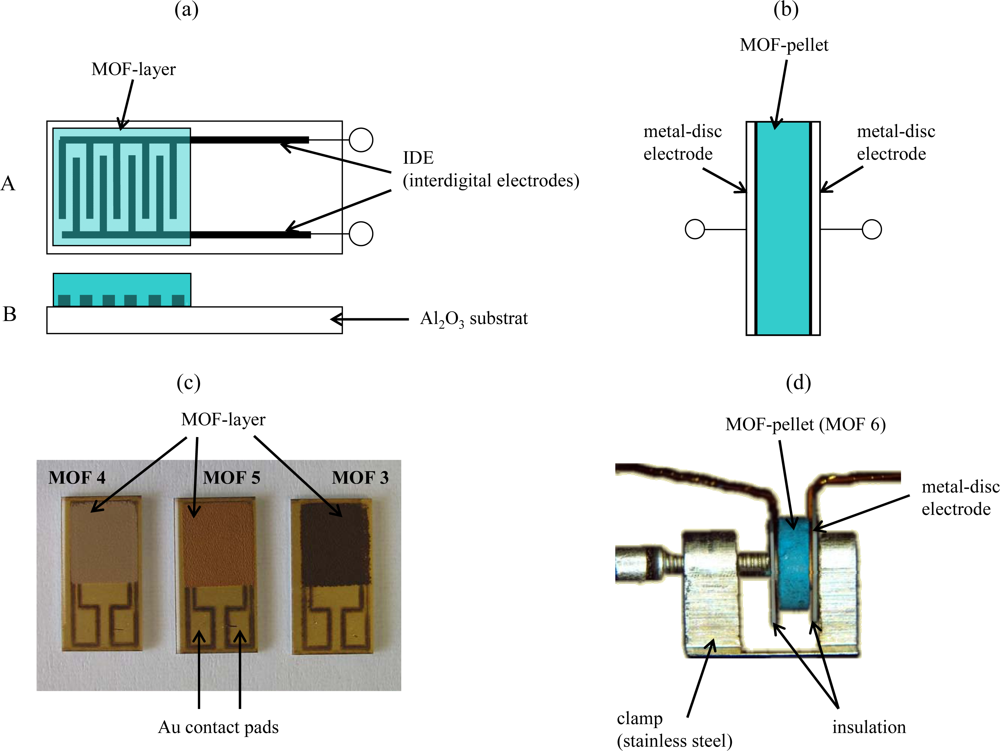
The five types of metal organic frameworks (Al-BDC, Fe-BTC, Cu-BTC, Fe-BTCld, and Fe-BTCfd) were provided in powder form or in pellet form by BASF. From these materials, two different sensor set-ups were prepared as described in Figure 1. The powders were ground, mixed with an organic vehicle (KD2721, Zschimmer & Schwarz) and processed with a three-roll mill to achieve printable thick-film pastes. For the planar sensor set-up, interdigital electrodes (IDE) were prepared as transducers by laser patterning of fired Au thick-film layers. For that purpose, a Au thick-film paste (QG150, DuPont) was printed on top of an alumina substrate (96%, Ceramtec 708S) and fired for 10 min at 850 °C (heating and cooling rate 30 °C/min). The obtained film was dense, had a fired thickness of approx. 10 μm and covered all over the substrate. The applied frequency-tripled Nd:YAG laser (LPKF, Germany) had a beam diameter of about 20 μm. Due to laser energy fluctuations and the surface roughness of the substrate, interdigital electrodes structures with minimal possible line widths and spaces of about 25 to 30 μm each are possible. In order to avoid short circuiting of the IDE fingers and to guarantee an almost infinite resistance between the IDE fingers, structures with 50 μm lines and 50 μm spaces were used as transducers. Further details of the laser processing can be found in [21].
To study the applicability of the different MOF materials as sensor materials, the prepared MOF-thick-film pastes were screen-printed on top of the laser patterned IDEs. Subsequently, the devices were heated to 200 °C for 40 min with a heating and cooling rate of 1 °C/min to evaporate the organic vehicle constituents. Contact to the measurement equipment was provided by two Au-wires, welded on the Au contact pads of the IDE structures (Figures 1a and 1c).
The pellets (Ø = 6 mm, d = 2 mm) were used as obtained and contacted by metal-discs (Ø = 6 mm) giving the pellet-shaped sensor set-up. The metal discs were equipped with a flat electrode at each single end, which were connected by Au-wires to provide a conducting interface to the measurement equipment (Figures 1b and 1d).
2.3. Sensor characterization
Both sensor configurations were tested between 120 °C and 240 °C in a tube furnace set-up similar to the one described in [22]. Different gas components (10 % O2, 10 % CO2, 1,000 ppm C3H8, 1,000 ppm NO, 1,000 ppm H2, 0 – 18 % ethanol, 0 – 35 % methanol) were admixed to the carrier gas N2 to evaluate the impedimetric response of the sensors. Humidity was varied in the range of 0 – 3 %vol. H2O of the test gas by either saturating the carrier gas with water in fritted wash-bottles in a temperature controlled water bath similar to [23] or directly by admixing different amounts of water vapor to the test gas.
The impedance spectra were recorded by a Novocontrol Alpha-Analyzer in the frequency range from 1 Hz to 1 MHz as described in [24]. Impedance spectroscopy is a useful tool to characterize the electric properties of highly resistive materials. The complex impedance Z consists of |Z|, the absolute value of Z and the phase angle between current and voltage φ, with Re(Z) = Z′ and Im(Z) = Z″. If one assumes that the system consists of discrete elements, one may use a parallel equivalent circuit of resistor R and capacitor C. Then, the two independent measurands Z′ and Z″ can be expressed by R and C. Further details can be found in the standard reference book [25].
In addition to the measurements in the frequency range stated above, the complex impedance at 1 Hz was continuously measured to determine the sensor response to stepwise changed gas compositions. The gas composition was monitored by an FTIR analysis system (Nicolet 6700, Thermo) downstream of the tube furnace. An example for a special test procedure at 1 Hz to evaluate the sensor characteristics for varying humidity is given in Table 1.
Two devices were prepared of each material and sensor set-up to evaluate the reproducibility of the sensor response. The repeatability of the signal was determined when the sensors were subjected to the same test procedure for several times.
3. Results and Discussion
Not depending on the admixed concentrations of non-polar gases to the carrier like O2, C3H8, and H2, the impedance of all MOF materials remained unaffected. NO and CO2 also did not lead to changing impedances.
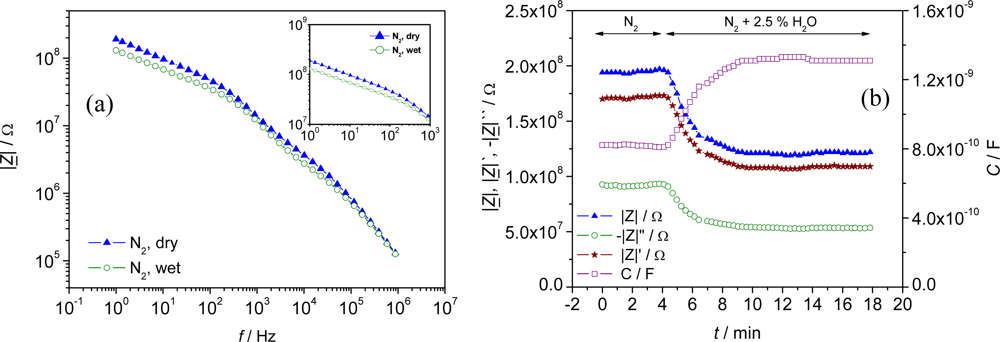
Two of the selected metal organic frameworks (Al-BDC and Fe-BTC) responded to different humidity concentrations of the carrier gas. For example, a decrease in the impedance was detected for a pellet sensor of Al-BDC when the gas flow was changed from dry to wet (2.5 vol.% H2O) at 120 °C (Figure 2a). As obvious from this Figure, the difference in the impedance between dry and wet carrier gas increases towards lower frequencies. Therefore, a frequency of 1 Hz was used to evaluate the influence of varying humidity on the impedance of the sensor in time-dependent measurements (Fig. 2b).
As can be only poorly resolved from Figure 2a, the sensor showed a strong response in all impedance-derived measurands (|Z|, Z′, Z″, and C) at 1 Hz. For instance, the absolute value |Z| changed by 39 % of the base impedance in N2 (∼ 76 MΩ), when the surrounding atmosphere was changed from dry N2 carrier gas to humidified gas (2.5 vol% H2O), meaning a sensitivity of 30.4 MΩ/vol%H2O. The sensor showed stable signals both in dry and wet carrier gases within one measurement cycle.
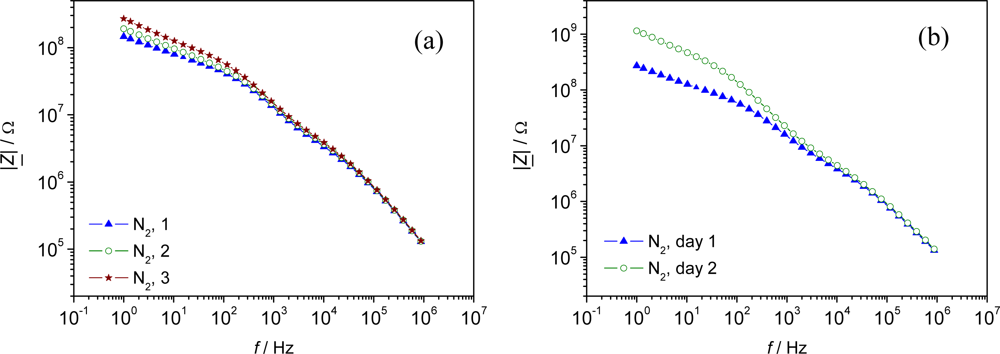
However, a strong shift in the base impedance in N2 was observed, when those pellets were tested consecutively within one day (Figure 3a). An even stronger shift was observed when the impedimetric response was evaluated at two consecutive days (Figure 3b). This shift is supposed to be due to a change in the MOF-characteristics itself, but has to be evaluated in more detail in further studies.
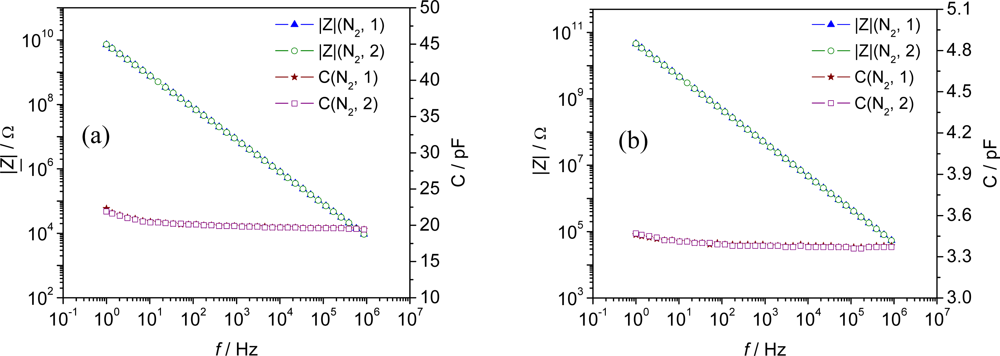
As Al-BDC did not show reproducible results in the base signals, and even the impedimetric response to humidified test gas varied from test cycle to test cycle, it was not investigated any further. Unlike Al-BDC sensors, sensor elements made of Fe-BTC showed significantly higher and repeatable effects when they were exposed to a varying humidity. Advantageously, neither the screen-printed sensor configuration (Figure 4a) nor the pellet-type set-up (Figure 4b) showed any significant changes in the base impedance or capacitance in N2 carrier gas in consecutive measurements (Fig. 4).
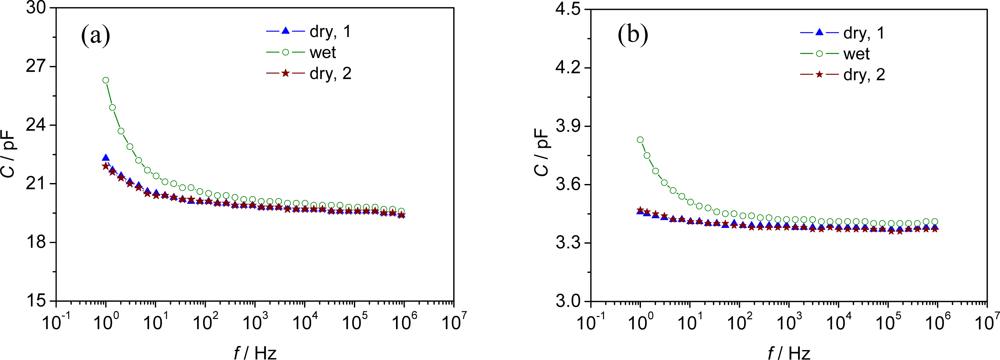
Best results, with a reversible change in the absolute value of the complex impedance |Z| and capacitance C, were obtained for the planar IDE sensors. When the humidity of the carrier gas at 120 °C was changed from dry to wet (∼ 2.3 vol%, H2O saturated at 20 °C) the capacitance of the planar IDE sensor increased by 4.4 pF (20.1 % of the base capacitance in N2) and the capacitance of the pellet-type sensor by 0.36 pF (10.4 % of the base capacitance), respectively, at low frequencies (Figure 5).
Again, an increasing difference between dry and wet (2.3 %vol.) carrier gas was observed with decreasing measurement frequency for C and |Z|. Hence, a frequency of 1 Hz was chosen for the time-dependent measurements at different temperatures between 120 °C and 240 °C.
A decreasing base impedance of the planar Fe-BTC sensors was observed in N2 carrier gas with an increase in the sensor temperature. By comparing two different but equally manufactured sensors one recognizes the good reproducibility, which is considerably high at 120 °C (Table 2).
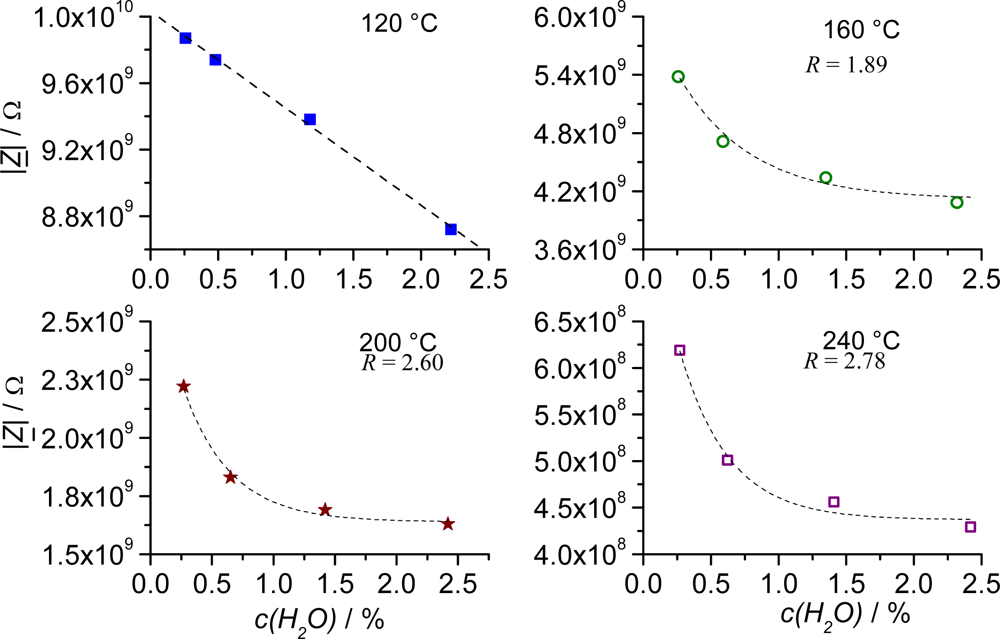
It was also noted that the sensitivity to variations in the water content of the test gas decreased with increasing temperature. At 120 °C, an almost linear behavior was observed (Figure 6).
For increasing temperature, an exponential decay in the form:
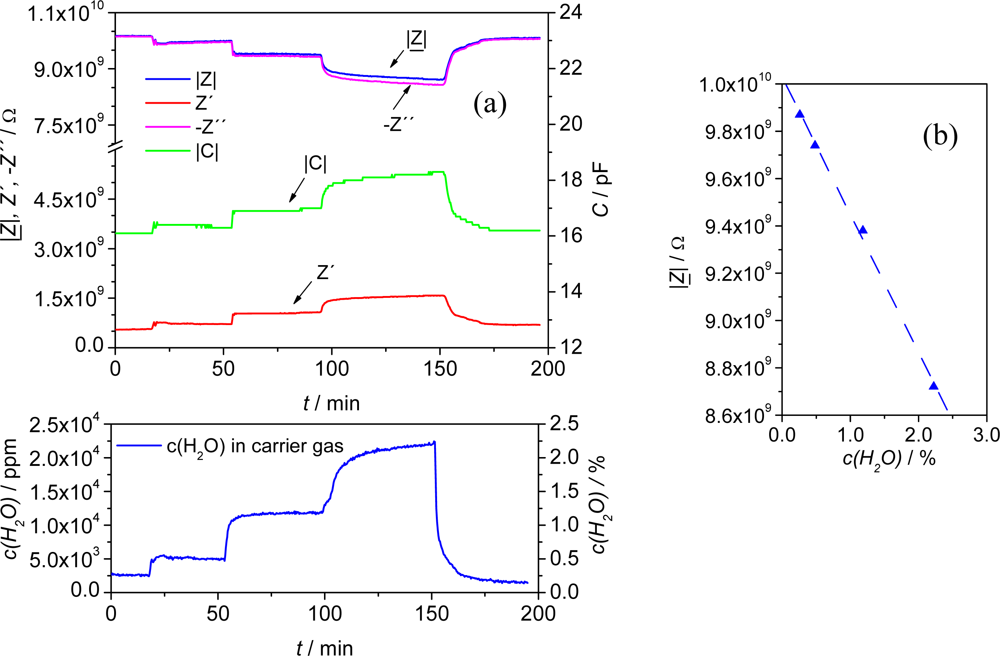
At a temperature of 120 °C, an overall impedance increase of 1.2 GΩ and a linear sensitivity of 590 MΩ/vol% H2O was achieved in a humidity range of 0 to 2.5 vol% (Figure 7).
If one defines a relative sensitivity by the relative change of the absolute value of the impedance at the fixed frequency of 1 Hz when exposed to 2.5 vol% H2O normalized to the initial value in dry gas:
After having the sensor exposed to different H2O-concentrations, the impedance signal recovered almost completely to the initial value, with a marginal shift of 0.4 % of the initial impedance in N2. With this extremely low shift MOF materials perform very well compared to e.g., thin film polymer sensors [13].
Due to this high reproducibility and sufficient sensitivity to variations in humidity, this MOF material showed quite promising properties for gas sensor applications. Thus, the effect of other hydrophilic gases like ethanol and methanol in the gas phase on the impedimetric properties of planar Fe-BTC-sensors was evaluated.
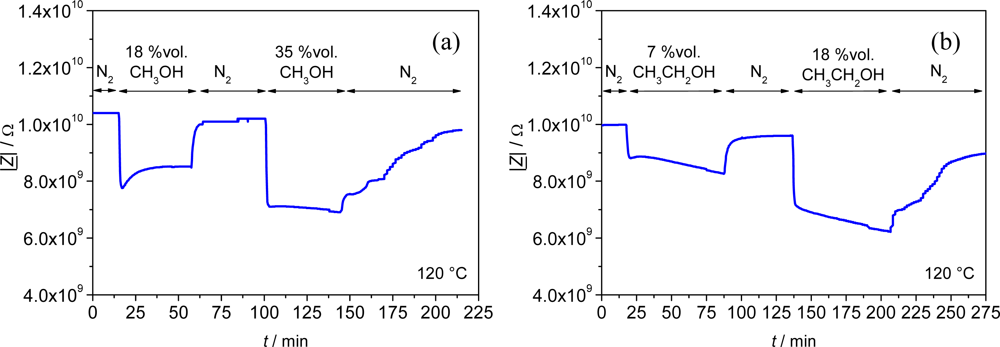
Similarly to the response towards humidity changes, the complex impedance |Z| and capacitance C of planar Fe-BTC was affected by varying ethanol and methanol concentrations in the test gas, with the highest and most linear sensitivity achieved at 120 °C. However, the sensors required much more time to recover to the base impedance in N2 after they had been exposed to ethanol or methanol containing N2. A similar observation was reported in the case of methanol and ethanol sorption in a Cu(II)-framework [26]. Both, methanol and ethanol were found to show hysteric sorption isotherms, indicating a strong adsorbate-host interaction and structural readjustment of the framework upon sorption-desorption. For Fe-BTC additionally, a drifting impedance value was observed when the planar sensor was exposed to ethanol (Figure 8b).
Altogether, at 120 °C the influence of the test gases increased in the order from methanol to ethanol to H2O, with a relative sensitivity Smethanol = 0.99 %/vol% CH3OH obtained for methanol and Sethanol = 2.3 %/vol% C2H5OH for ethanol. Most stable and best reversible signals were obtained for variations in the water content of the test gas. Cross sensitivity of the MOF-sensor on ethanol and methanol can be evaluated when a cross-sensitivity factor (CSF) is introduced similar to [27] comparing the relative sensor response for 1 vol% of the interfering gas species with the sensor response for 1 vol% H2O in the test gas.
If a CSF > 1 is derived from eq. (3), the sensor responds more to the interfering gas than to humidity, whereas for CSF < 1 a low reactivity of the MOF-material on this gas component is determined compared to the reactivity on humidity. For methanol, one obtains CSFmethanol = 0.32 and for ethanol CSFethanol = 0.69, respectively. As both values are < 1 the cross sensitivity of the sensor to methanol and ethanol is rather low.
In order to optimize the sensitivity to humidity and to further investigate the influence of dopants in Fe-BTC material, lithium (Fe-BTCld) and iron (Fe-BTCfd) were tested as dopants. The measurements were conducted at 120 °C in N2 carrier gas and with 1.5 vol% H2O admixed to the carrier gas.
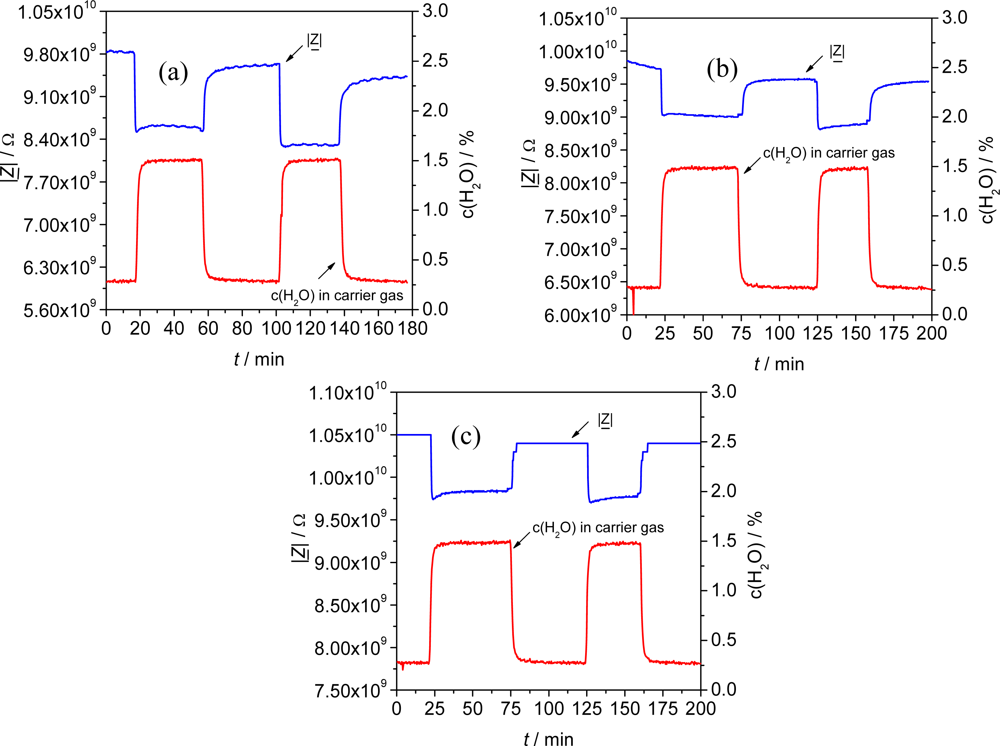
Similarly to sensors with undoped material, planar sensors coated with Fe-BTCld and Fe-BTCfd showed a good reproducibility when the impedimetric signals of two different sensors in N2 were compared. Even no significant changes in the absolute values compared to undoped material were observed (Table 3).
All tested materials were sensitive to humidity in the test gas. The sensitivity of the materials increased like:
Thereby, the reproducibility of the impedimetric sensor signal |Z| to H2O was higher than 93 % for all materials in two consecutive measurements (Figure 9). Moreover, the impedance signal of the doped materials almost completely recovers to the initial value in N2 after exposure to humidity. For example, Fe-BTCfd shows a recovery of the material of 99.5 % and 99.7 % respectively, relating to the initial impedance in N2 for two different sensors (Figure 9c).
In conclusion, doping the base material did not have a significant effect on the main properties of the material as impedimetric sensor material. The materials still showed reproducible results and the same base impedance in N2. Only the sensitivity to H2O was slightly affected but remained present.
4. Conclusions
Different materials from the metal-organic frameworks class have been investigated for the first time as sensor materials for impedimetric humidity sensors. Two different sensor set-ups have been designed and studied in different gas atmospheres at temperatures between 120 °C and 240 °C. Most of the materials did not show any sensor effect when probed with nitrogen that contained O2, CO2, C3H8, NO, H2, ethanol or methanol or a different water contents. However, one material (Fe-BTC) was identified as an appropriate sensor material for the detection of hydrophilic gases like ethanol, methanol or humidity. It did not show a cross sensitivity towards O2, CO2, C3H8, NO, and H2. The sensitivity towards ethanol and methanol was by far lower than for water. Hence, a selective online humidity sensor was successfully manufactured by screen-printing this material on ceramic transducers with laser patterned interdigital electrodes. The absolute value of the complex impedance or the capacitance of the sensor at 1 Hz were good measurands. Best results were obtained at 120 °C with a linear response curve in the tested humidity range of 0 to 2.5 vol% and a sensitivity of 590 MΩ/vol% H2O (5.4 %/vol% H2O). The recovery behavior of the tested material after exposure to humidity was highly promising. Hence, additional heater structures as required for ceramic devices to regenerate the sensor surfaces seem to be unnecessary. It is expected that the device can be further developed to a long-term stable water vapor sensor. Differently doped versions of this material showed a high sensitivity to humidity as well, but did not lead to a better sensor performance. It should be noted that the sensors show a remarkable initial reproducibility with respect to sample scattering.
On the way to a serial product, besides material optimization, miniaturization efforts should be carried out, for instance by applying the sensor to ceramic or silicon micro hot-plates, e.g. as shown in Refs. [28] or [29], respectively. Then, the high ohmic behavior of the material needs special attention, since in this case, if the IDE resolution remains unchanged, one has to deal with sensor impedances in the GΩ-range, due to the reduced IDE area of the micro hot-plates. As a conclusion, one has to use photolithographically defined interdigital electrodes with a resolution in the range of some μm. The latter may even make sense for the above-shown ceramic substrates in order to reduce the sensor impedance to an order, at which measurement circuits are low-cost devices.
Acknowledgments
BASF is gratefully acknowledged for providing the MOF materials used in this investigation.
References and Notes
- Rowsell, J.L.; Yagi, O.M. Strategie für die Wasserstoffspeicherung in metall-organischen Gerüstmaterialien. Angew. Chem 2005, 117, 4748–4758. [Google Scholar]
- Latroche, M.; Surblé, S.; Serre, C.; Mellot-Darznieks, C.; Llewellyn, P.L.; Lee, J.-H.; Chang, J.-S.; Jhung, S.H.; Férey, G. Hydrogen storage in the giant-pore metal-organic frameworks MIL-100 and MIL-101. Angew. Chem 2006, 118, 8407–8411. [Google Scholar]
- Müller, U.; Schubert, F.; Teich, F.; Pütter, H.; Schierle-Arndt, K.; Pastré, J. Metal-organic frameworks - prospective industrial applications. J. Mater. Chem 2006, 16, 626–636. [Google Scholar]
- Kitagawa, S.; Kitaura, R.; Noro, S.-I. Functional porous coordination polymers. Angew. Chem. Int. Ed 2004, 43, 2334–2375. [Google Scholar]
- Millward, A.R.; Yaghi, O. M. Metal-organic frameworks with exceptionally high capacity for storage of carbon dioxide at room temperature. J. Am. Chem. Soc 2005, 127, 17998–17999. [Google Scholar]
- Loiseau, T.; Serre, C.; Huguenard, C.; Fink, G.; Taulelle, F.; Henry, M.; Bataille, T.; Férey, G.A. Rationale for the large breathing of the porous aluminum terephthalate (MIL-53) upon hydration. Chem. Eur. J 2004, 10, 1373–1382. [Google Scholar]
- Zhang, J.-P.; Lin, Y.-Y.; Zhang, W.-X.; Chen, X.-M. Temperature- or guest-induced drastic single-crystal-to-single-crystal transformations of a nanoporous coordination framework. J. Am. Chem. Soc 2005, 127, 14162–14163. [Google Scholar]
- Kepert, C.J.; Rosseinsky, M. J. Zeolite-like crystal structure of an empty microporous molecular framework. Chem. Commun 1999, 4, 375–376. [Google Scholar]
- Ohba, R. Intelligent sensor technology; Wiley: Chichester, UK, 1992; pp. 140–141. [Google Scholar]
- Traversa, E. Ceramic sensors for humidity detection: the state-of-the-art and future development. Sens. Actuat. B: Chem 1995, 23, 135–156. [Google Scholar]
- Lee, C.-Y.; Lee, G.-B. Humidity sensors: a review. Sens. Lett 2005, 3, 1–15. [Google Scholar]
- Chen, Z.; Lu, C. Humidity sensors: a review of materials and mechanisms. Sens. Lett 2005, 3, 274–295. [Google Scholar]
- Yamazoe, N. Humidity sensors: principles and applications. Sens. Actuat 1986, 10, 379–398. [Google Scholar]
- Neumeier, S.; Echterhof, T.; Bölling, R.; Pfeifer, H.; Simon, U. Zeolite based humidity sensor for high temperature applications in hydrogen atmosphere. Sens. Actuat. B: Chem 2008, 134, 171–184. [Google Scholar]
- Morimoto, T.; Nagao, M.; Fukuda, F. The relation between the amounts of chemisorbed and physisorbed water on metal oxides. J. Phys. Chem 1969, 73, 243–248. [Google Scholar]
- Nitta, T. Ceramic humidity sensor. Ind. Eng. Chem. Prod. Res. Dev 1981, 20, 669–674. [Google Scholar]
- Kulwicki, B.M. Humidity sensors. J. Am. Ceram. Soc 1991, 74, 697–708. [Google Scholar]
- Limit of thermal stability according to thermogravimetric analyses; a) Basolite™ A100 (Al-BDC): > 400 °C; b) Basolite™ C300 (Cu-BTC, Cu3BTC2): 320 °C; c) Basolite™ F300 (Fe-BTC): 310 °C.
- James, S.L. Metal-organic frameworks. Chem. Soc. Rev 2003, 32, 276–288. [Google Scholar]
- Müller, U.; Pütter, H.; Hesse, M.; Wesel, H. Verfahren zur Herstellung von fremdsalzarmen Sulfinaten. German Patent DE 10355088,. 2005. [Google Scholar]
- Gollner, E.; Kita, J.; Moos, R. Frequency-tripled Nd:YAG-laser in thick-film and LTTC applications. Proceedings of XXX International Conference of International Microelectronics and Packaging Society, Krakow, Poland, 24.-27.9.2006; pp. 147–152.
- Sahner, K.; Moos, R.; Matam, M.; Tunney, J.J.; Post, M. Hydrocarbon sensing with thick and thin film p-type conducting perovskite materials. Sens. Actuat. B: Chem 2005, 108, 102–112. [Google Scholar]
- Achmann, S; Hämmerle, M.; Moos, R. Amperometric enzyme-based gas sensor for formaldehyde: impact of possible interferences. Sensors 2008, 8, 1351–1365. [Google Scholar]
- Reiß, S.; Hagen, G.; Moos, R. Zeolite-based impedimetric gas sensor device in low-cost technology for hydrocarbon gas detection. Sensors 2008, 8, 7904–7916. [Google Scholar]
- Macdonald, J. R.; Barsoukov, E. Impedance spectroscopy: theory, experiment, and applications, 2nd Ed ed; Wiley: Hoboken, New Jersey, USA, 2005. [Google Scholar]
- Maji, T.K.; Mostafa, G.; Matsuda, R.; Kitagawa, S. Guest-induced asymmetry in a metal-organic porous solid with reversible single-crystal-to-single-crystal structural transformation. J. Am. Chem. Soc 2005, 127, 17152–17153. [Google Scholar]
- Sahner, K.; Schönauer, D.; Kuchinke, P.; Moos, R. Zeolite cover layer for selectivity enhancement of p-type semiconducting hydrocarbon sensors. Sens. Actuat. B: Chem 2008, 133, 502–508. [Google Scholar]
- Rettig, F.; Moos, R. Ceramic meso hot-plates for gas sensor. Sens. Actuat. B: Chem 2004, 103, 91–97. [Google Scholar]
- Simon, I.; Barsan, N.; Bauer, M.; Weimar, U. Micromachined metal oxide gas sensors: opportunities to improve sensor performance. Sens. Actuat. B: Chem 2001, 73, 1–26. [Google Scholar]


| gas composition | t / min |
|---|---|
| N2 | 15 - 20 |
| N2 + 0.5 vol% H2O | 30 - 40 |
| N2 + 1.5 vol% H2O | 30 - 45 |
| N2 + 3.0 vol% H2O | 30 - 45 |
| N2 | >60 |
| T / °C | |Z|N2 / GΩ |
|---|---|
| 120 | 10 (9.9) |
| 160 | 5 (5.4) |
| 200 | 2.5 (2.2) |
| 240 | 0.9 (0.6) |
| MOF material | |Z|N2 / GΩ | S / %/%volH2O |
|---|---|---|
| undoped (Fe-BTC) | 10 (9.9) | 8.6 (10.4) |
| Li doped (Fe-BTCld) | 10.1 (9.7) | 9.4 (6.2) |
| Fe doped (Fe-BTCfd) | 9.6 (10.1) | 3.8 (5.1) |
© 2009 by the authors; licensee MDPI, Basel, Switzerland This article is an open-access article distributed under the terms and conditions of the Creative Commons Attribution license (http://creativecommons.org/licenses/by/3.0/).
Share and Cite
Achmann, S.; Hagen, G.; Kita, J.; Malkowsky, I.M.; Kiener, C.; Moos, R. Metal-Organic Frameworks for Sensing Applications in the Gas Phase. Sensors 2009, 9, 1574-1589. https://doi.org/10.3390/s90301574
Achmann S, Hagen G, Kita J, Malkowsky IM, Kiener C, Moos R. Metal-Organic Frameworks for Sensing Applications in the Gas Phase. Sensors. 2009; 9(3):1574-1589. https://doi.org/10.3390/s90301574
Chicago/Turabian StyleAchmann, Sabine, Gunter Hagen, Jaroslaw Kita, Itamar M. Malkowsky, Christoph Kiener, and Ralf Moos. 2009. "Metal-Organic Frameworks for Sensing Applications in the Gas Phase" Sensors 9, no. 3: 1574-1589. https://doi.org/10.3390/s90301574