2. Results and Discussion
The octocoral
Briareum asbestinum was collected by hand, using scuba in the Bastimentos National Park on the Caribbean side of Panama at a depth of 10 m. The sample was extracted with methanol-dichloromethane and the crude extract was fractionated using two subsequent silica gel columns followed by high performance liquid chromatography (HPLC) purification to yield compounds
1–
3 (
Figure 1).
Figure 1.
Structures of compounds 1–4.
Figure 1.
Structures of compounds 1–4.
High-resolution electrospray ionization-time-of-flight-mass spectrometry (HRESI-TOF-MS) spectrum of compound
1 showed a pseudo-molecular ion peak [M + Na]
+ at
m/z 387.1775 corresponding with the molecular formula C
20H
28O
6Na.
13C-NMR and heteronuclear multiple bond correlation (HMBC) spectra (
Table 1) showed resonances for 20 carbon atoms, while distortion-less enhancement by polarization transfer (DEPT) and multiplicity edited heteronuclear single quantum coherence (HSQC) experiments revealed four quaternary carbons, nine methines, three methylenes and four methyl groups (
Table 1).
13C-NMR chemical shifts revealed the presence of two ketones (
δC 213.4, 205.8); one aldehyde (
δC 193.9) and one double bond (
δC 158.6, 131.0). Additionally, resonances for five carbons bearing oxygen were assigned as two methines (
δC 76.5, 90.7), one methylene (
δC 67.6) and two quaternary carbons (
δC 75.4, 77.6). Seven degrees of unsaturation were inferred from the molecular formula: four accounted for three carbonyl groups and one double bond, therefore compound
1 has three rings. The fact that compound
1 possessed 20 carbon atoms and that the source organism was a coral strongly suggested that compound
1 was a diterpene.
Table 1.
Nuclear magnetic resonance (NMR) Spectroscopic Data (CDCl3) for seco-briarellinone (1).
Table 1.
Nuclear magnetic resonance (NMR) Spectroscopic Data (CDCl3) for seco-briarellinone (1).
| Position | δC, mult. a | δH, mult. J in Hz b | HMBC c | COSY |
|---|
| 1 | 39.3 (CH) | 2.26, dt, 2.0, 9.3 | | 2, 10, 14 |
| 2 | 90.7 (CH) | 3.87, d, 9.3 | 1, 4 | 1 |
| 3 | 77.6 (C) | - | | |
| 4 | 158.6 (CH) | 6.85, d, 15.6 | 3, 6 | 5 |
| 5 | 131.0 (CH) | 6.42, dd, 8.3, 15.6 | 3, 6 | 4, 6 |
| 6 | 193.9 (CH) | 9.60, d, 8.3 | 5 | 5 |
| 7 | 205.8 (C) c | - | | |
| 8 | 49.4 (CH2) | 2.79, dd, 16.3, 3.5 | 7, 9 | 9 |
| 8 | | 2.69, dd, 16.3, 6.1 | | |
| 9 | 76.5 (CH) | 4.68, dt, 3.5, 6.1 | | 8, 10 |
| 10 | 51.0 (CH) | 2.08, m | 11 | 1, 9 |
| 11 | 75.4 (C) | - | | |
| 12 | 213.4 (C) c | - | | |
| 13α | 38.4 (CH2) | 2.48, dd, 14.2, 4.5 | 1, 12 | 14 |
| 13β | | 2.37, m | | |
| 14 | 37.9 (CH) | 2.36, m | | 1, 13α, 15 |
| 15 | 35.7 (CH) | 1.78, m | | 14, 16, 17 |
| 16α | 67.6 (CH2) | 3.66, dd, 3.4, 13.2 | 3, 17 | 15 |
| 16β | | 3.81, d, 13.2 | | |
| 17 | 10.9 (CH3) | 1.00, d, 6.8 | 14, 15, 16 | 15 |
| 18 | 24.3 (CH3) | 1.47, s | 2, 3, 4 | |
| 19 | 30.6 (CH3) | 2.20, s | 7, 8 | |
| 20 | 23.7 (CH3) | 1.45, s | 10, 11, 12 | |
Inspection of the
1H-NMR spectrum of compound
1 showed resonances for an aldehyde proton (
δH 9.60, d,
J = 8.3 Hz, H-6) coupled with an olefinic proton (
δH 6.42, dd,
J = 8.3, 15.6 Hz, H-5). Proton H-5 was also coupled with H-4 whose resonance appeared at
δH 6.85 ppm (d,
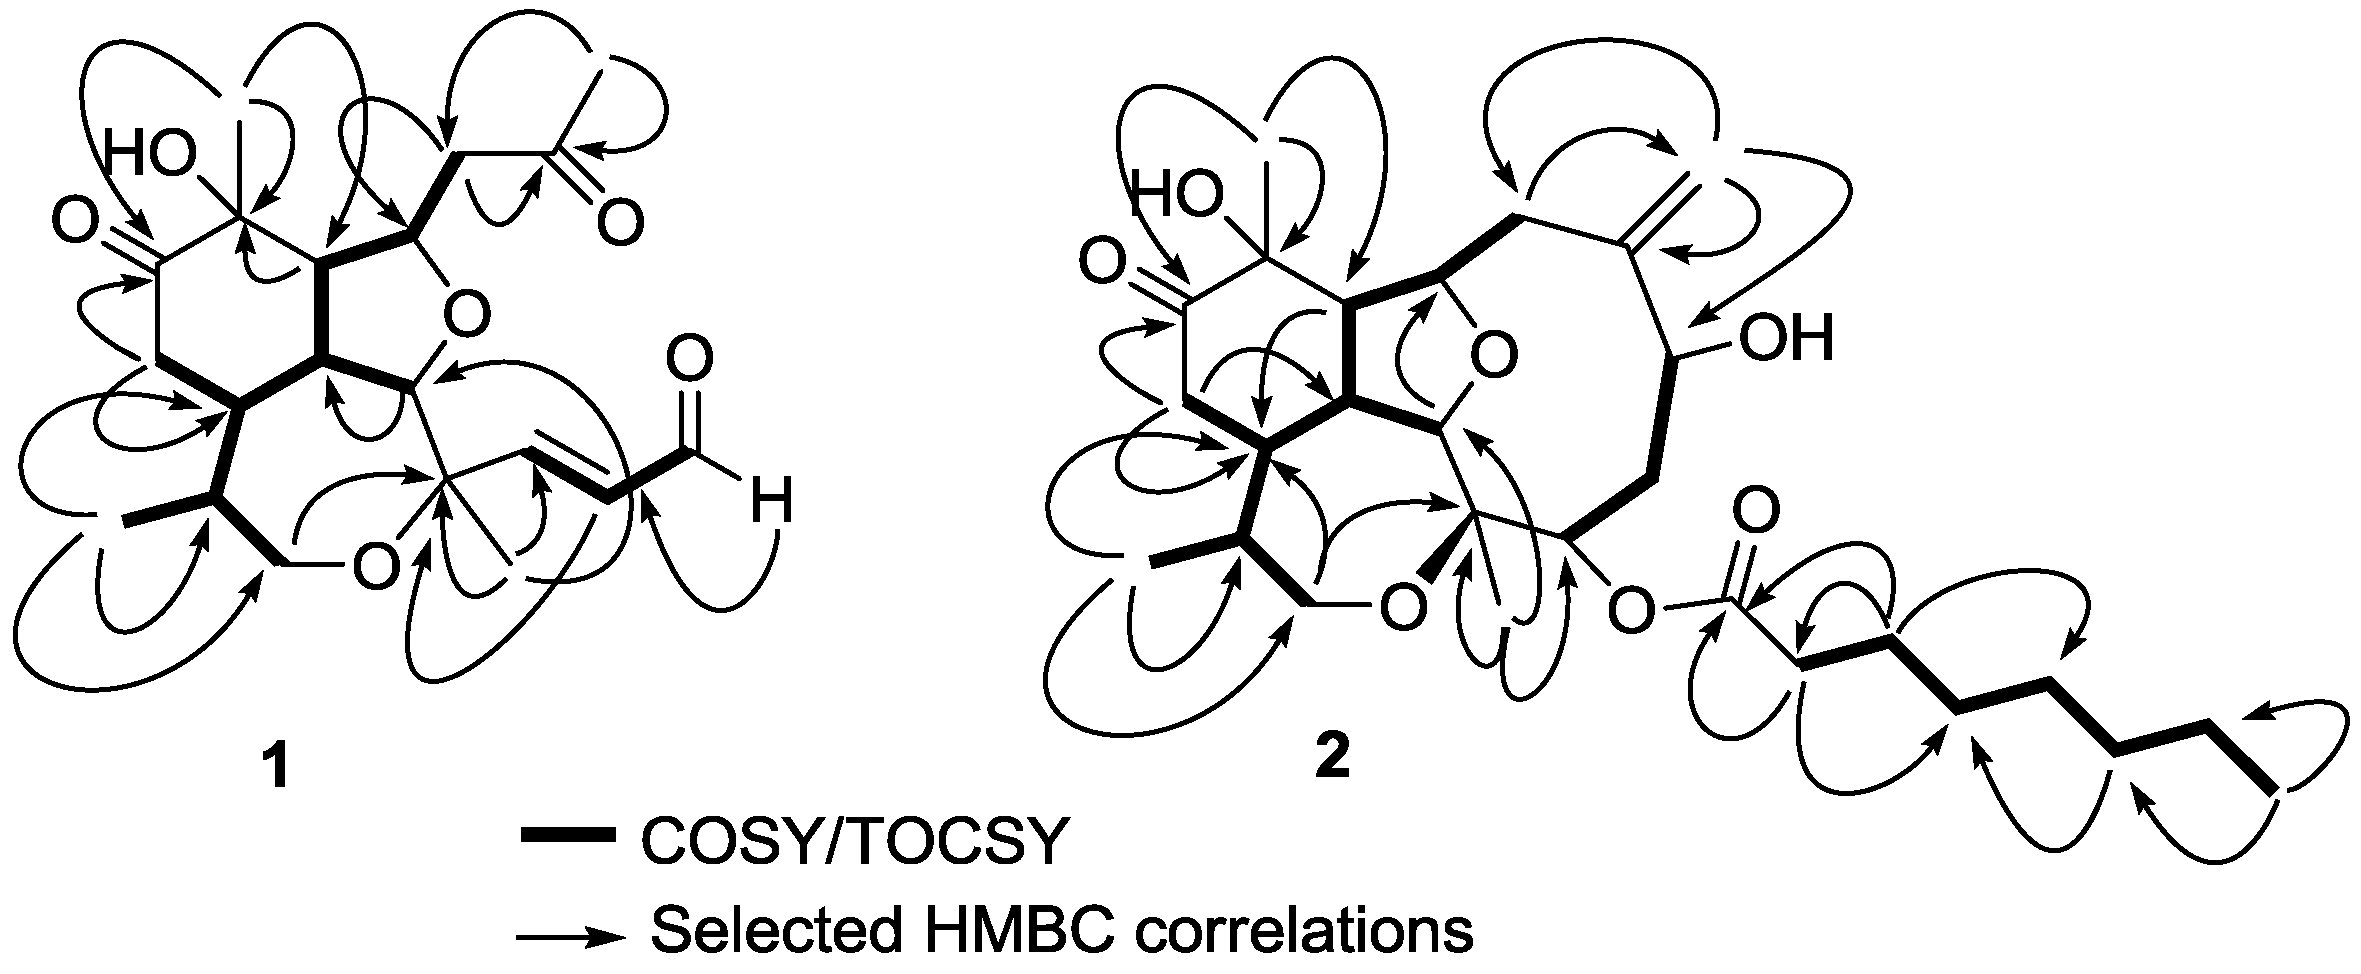
J = 15.6 Hz) forming a α,β-unsaturated aldehyde. The spin system comprised by H-4, H-5, H-6 was confirmed by crossed correlations observed in correlation spectroscopy (COSY) experiments (
Figure 2). The geometry of the C-4/C-5 double bond was assigned as
trans on the basis of the coupling constant observed for protons H-4 and H-5 (
JH4,H5 = 15.6 Hz) [
1].
Figure 2.
Correlation spectroscopy (COSY) or total correlation spectroscopy (TOCSY) and heteronuclear multiple bond correlation (HMBC) correlations of compounds 1 and 2.
Figure 2.
Correlation spectroscopy (COSY) or total correlation spectroscopy (TOCSY) and heteronuclear multiple bond correlation (HMBC) correlations of compounds 1 and 2.
Additionally, signals for four methyl groups were observed: one secondary at
δH 1.00 (d,
J = 6.8 Hz), and three tertiary attached to quaternary carbons bearing oxygen (
δH 1.45,
δC 75.4;
δH 1.47,
δC 77.6;
δH 2.20,
δC 205.8). Remaining protons including, two α-ketone diastereotopic methylenes (
δH 2.37, 2.47; 2.79, 2.69), one diastereotopic oxymethylene (
δH 3.81, 3.66), and six methines (
δH 4.68, 2.08, 2.26, 3.87, 2.36, 1.78), were all connected forming a long and branched spin system using COSY and total correlation spectroscopy (TOCSY) experiments (
Figure 2). Positioning and connectivity of all functional groups and spin systems described above were carried out using
2,3J HMBC experiments (
Figure 2). Thus, the α,β-unsaturated aldehyde was attached to C-3 based on a correlation observed for H
3-18 to C-4. Also
2J HMBC correlations observed for methylene (H
2-8) and methyl (H
3-19) protons to C-7 allowed the assignment of an acetonyl moiety. This acetonyl group was connected to C-9 using COSY (H
2-8 to H-9) and
2J HMBC (H
2-8 to C-9) correlations. Methyl protons H
3-17, H
3-18 and H
3-20 gave strong HMBC correlations with their adjacent carbons (
Figure 2) supporting the assignment of the tricyclic scaffold of compound
1. Finally, positioning of the keto group on C-12 was based on HMBC correlations observed for H
3-20 and H
2-13 to C-12 (
Figure 2). Therefore the assignment of the planar structure of compound
1 was established as a novel
seco-briarellin diterpene depicted in
Figure 1. Comparison of the NMR data of compound
1 with previously reported
seco-briarellins [
1,
4,
7] evidenced the presence of the keto group at C-12 as a unique structural feature for compound
1.
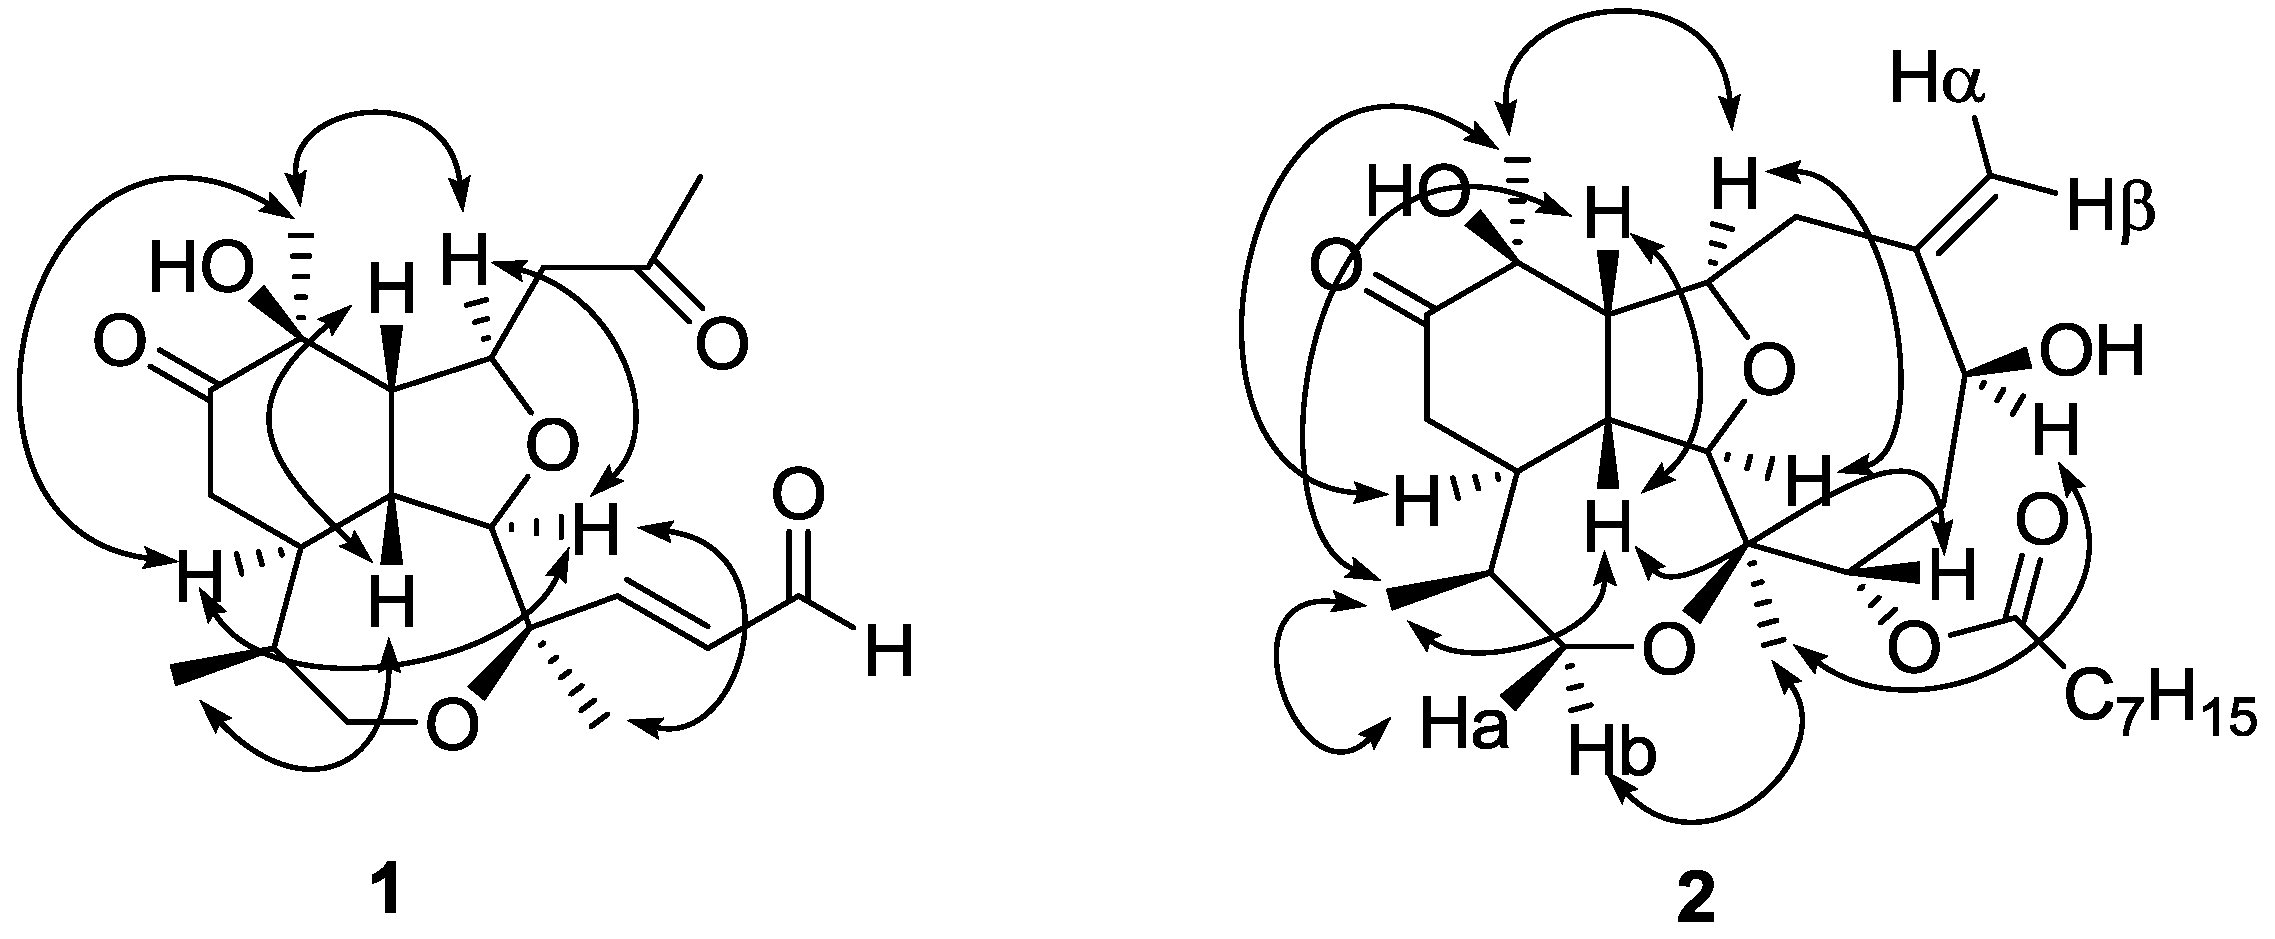
The relative stereochemistry of compound
1 was assigned by double pulsed field gradient spin echo-nuclear Overhauser effect (DPFGSE-NOE) experiments (
Figure 3). A strong enhancement of protons H-2 and H
3-20 was observed when methine H-9 was irradiated, whereas irradiation of H-2 strongly enhanced the signals of H-9, H-14 and H
3-18. Also proton H-14 was enhanced when H-15 was irradiated, while irradiation of H
3-20 enhanced protons H-9 and H-14. All these protons (H
3-20, H-9, H-2 and H-14) were assigned arbitrarily as having α-configuration. On the other hand, irradiation of proton H-1 produced the enhancement of both, H-10 and H
3-17, and these protons were assigned as having β-configuration.
Figure 3.
NOE correlations of compounds 1 and 2.
Figure 3.
NOE correlations of compounds 1 and 2.
HRESI-TOF-MS spectrum of compound
2 showed a pseudo-molecular ion peak [M + Na]
+ at
m/z 515.2975 corresponding with the molecular formula C
28H
44O
7Na.
13C-NMR and HMBC data (
Table 2) showed resonances for 28 carbon atoms. DEPT and multiplicity edited HSQC experiments evidenced the presence of five quaternary carbons, eight methines, eleven methylenes and four methyl groups (
Table 2). Seven degrees of unsaturation were inferred from the molecular formula: two carbonyl groups assigned as a ketone and ester (
δC 214.6 and 175.6) and an exocyclic double bond (
δC 152.8 and 115.8) accounted for three unsaturations, therefore compound
2 has four rings.
Table 2.
NMR spectroscopic data (CDCl3) for briarellin S (2).
Table 2.
NMR spectroscopic data (CDCl3) for briarellin S (2).
| Position | δC, mult. a | δH, mult. (J in Hz) b | HMBC c | COSY |
|---|
| 1 | 38.5 (CH) | 2.80, m | | 2, 10, 14 |
| 2 | 92.9 (CH) | 3.97, d, 8.8 | 3, 4, 9, 14, 18 | 1 |
| 3 | 76.6 (C) | - | | |
| 4 | 71.4 (CH) | 5.08, br s | | 5 |
| 5 | 36.4 (CH2) b | 1.71, br d b | | 4 |
| 6 | 73.8 (CH) | 4.18, br s | | |
| 7 | 152.8 (C) c | - | | |
| 8 | 39.5 (CH2) | 2.33, m | 19 | 9 |
| 9 | 81.5 (CH) | 4.68, br s | | 8, 10 |
| 10 | 49.1 (CH) | 2.54, m | 14 | 1, 9 |
| 11 | 75.7 (C) | - | | |
| 12 | 214.6 (C) | - | | |
| 13α | 39.4 (CH2) | 2.38, m b | 1, 12, 14 | 14 |
| 13β | | 2.38, m b | | |
| 14 | 39.3 (CH) | 2.23, m b | | 1, 13α, 15 |
| 15 | 35.5 (CH) | 1.66, m b | | 14, 16α, 17 |
| 16α | 66.9 (CH2) | 3.44, dd, 13.2, 2.9 | 3, 17 | 15 |
| 16β | | 3.68, d, 13.2 | | |
| 17 | 10.4 (CH3) | 0.88, d, 6.8 | 14, 15, 16 | 15 |
| 18 | 17.6 (CH3) | 1.36, s | 2, 3, 4 | |
| 19α | 115.8 (CH2) | 5.18, br s | 6, 7, 8 | |
| 19β | | 5.56, br s | | |
| 20 | 22.8 (CH3) | 1.39, s | 10, 11, 12 | |
| 21 | 175.6 (C) c | - | | |
| 22 | 34.7 (CH2) | 2.33, m b | 21 | 23 |
| 23 | 25.1 (CH2) | 1.62, m b | 21, 22, 25 | 22 |
| 24 | 29.0 (CH2) d | 1.25, m b | | |
| 25 | 28.8 (CH2) d | 1.30, m b | | |
| 26 | 31.7 (CH2) | 1.26, m b | 24 | |
| 27 | 22.6 (CH2) | 1.27, m b | | 28 |
| 28 | 14.1 (CH3) | 0.86, t, 7.3 | 26, 27 | 27 |
Comparison of NMR data (
1H-NMR,
13C-NMR) of compounds
1 and
2 revealed several structural similarities and differences. For instance, in compound
2 the nine-membered ring across C-2/C-9 was intact and the spin system formed by protons H-4/H-6 was composed of two oxygen-bearing methines and a methylene, in compound 1 the α,β-unsaturated aldehyde moiety was present instead. The exocyclic methylene (C-19) was attached to C-7 based on the
2,3J HMBC correlations of H
2-19 with C-6, C-7 and C-8. This part of the molecule showed very weak or broadened
13C and
1H-NMR signals, likely due to the existence of a slow equilibrium between different conformations across C-2/C-9, as reported previously for other briarelline analogues [
5,
6]. On the other hand, the tricyclic structure comprising the tetrahydrofurane ring, the cyclohexanone ring and the seven-membered ether ring across C-3/C-16 was found to be identical in compounds
1 and
2. The presence of four rings and the structural features shared with compound
1 suggested that compound
2 was a member of the briarellin group. Comparison of NMR data of compound
2 with other briarellins indicated a close structural similarity with briarellin E (
4) [
2], with the presence of a ketone at C-12 being the only difference between compound
2 and briarellin E (
4). As it was expected, the carbonyl group at C-12 in compound
2 produced a deshielding effect on its adjacent carbons C-11 and C-13, which appeared downfield (
δC 75.7, 39.4) in comparison with the same carbons in briarellin E (
4) (
δC 71.6, 24.8). Overall 1D-NMR (
1H-NMR,
13C-NMR, DEPT) and 2D-NMR data (HSQC, COSY, TOCSY and HMBC) (
Table 2) confirmed the assignment of the planar structure of compound
2 as briarellin S.
The three-dimensional structure of compound
2 was established by DPFGSE-NOE experiments (
Figure 3), which indicated that compounds
1 and
2 have the same relative stereochemistry in all the common chiral centers. Irradiation on H-6 and H-1 produced enhancements on protons H
3-18 and H-4, respectively. Thus, H-6 was assigned as having α-configuration and H-4 was assigned as having β-configuration. The absolute stereochemistry of natural briarellin E (
4) was not determined, however Corminboeuf and colleagues carried out the enantioselective total synthesis of
4 [
9]. Given that briarellins E (
4) and S (
2) have the same chiral centers, they likely have the same absolute configuration.
The anti-inflammatory properties of diterpenes from natural sources have been described previously [
10]. However, anti-inflammatory activity of the briarellins family has not been evaluated before. The inhibition of NO production is frequently used as an indicator of anti-inflammatory activity. NO is produced by a family of enzymes called NO synthases (NOS) and it mediates many physiological processes [
11]. Inflammatory conditions lead to production of high levels of NO regulated by the inducible NOS (iNOS) enzyme. NO is produced by many cell types
in vitro in response to several stimuli such as microbial products (e.g., bacterial lipopolisacharide (LPS)), cytokines, viral proteins, among others [
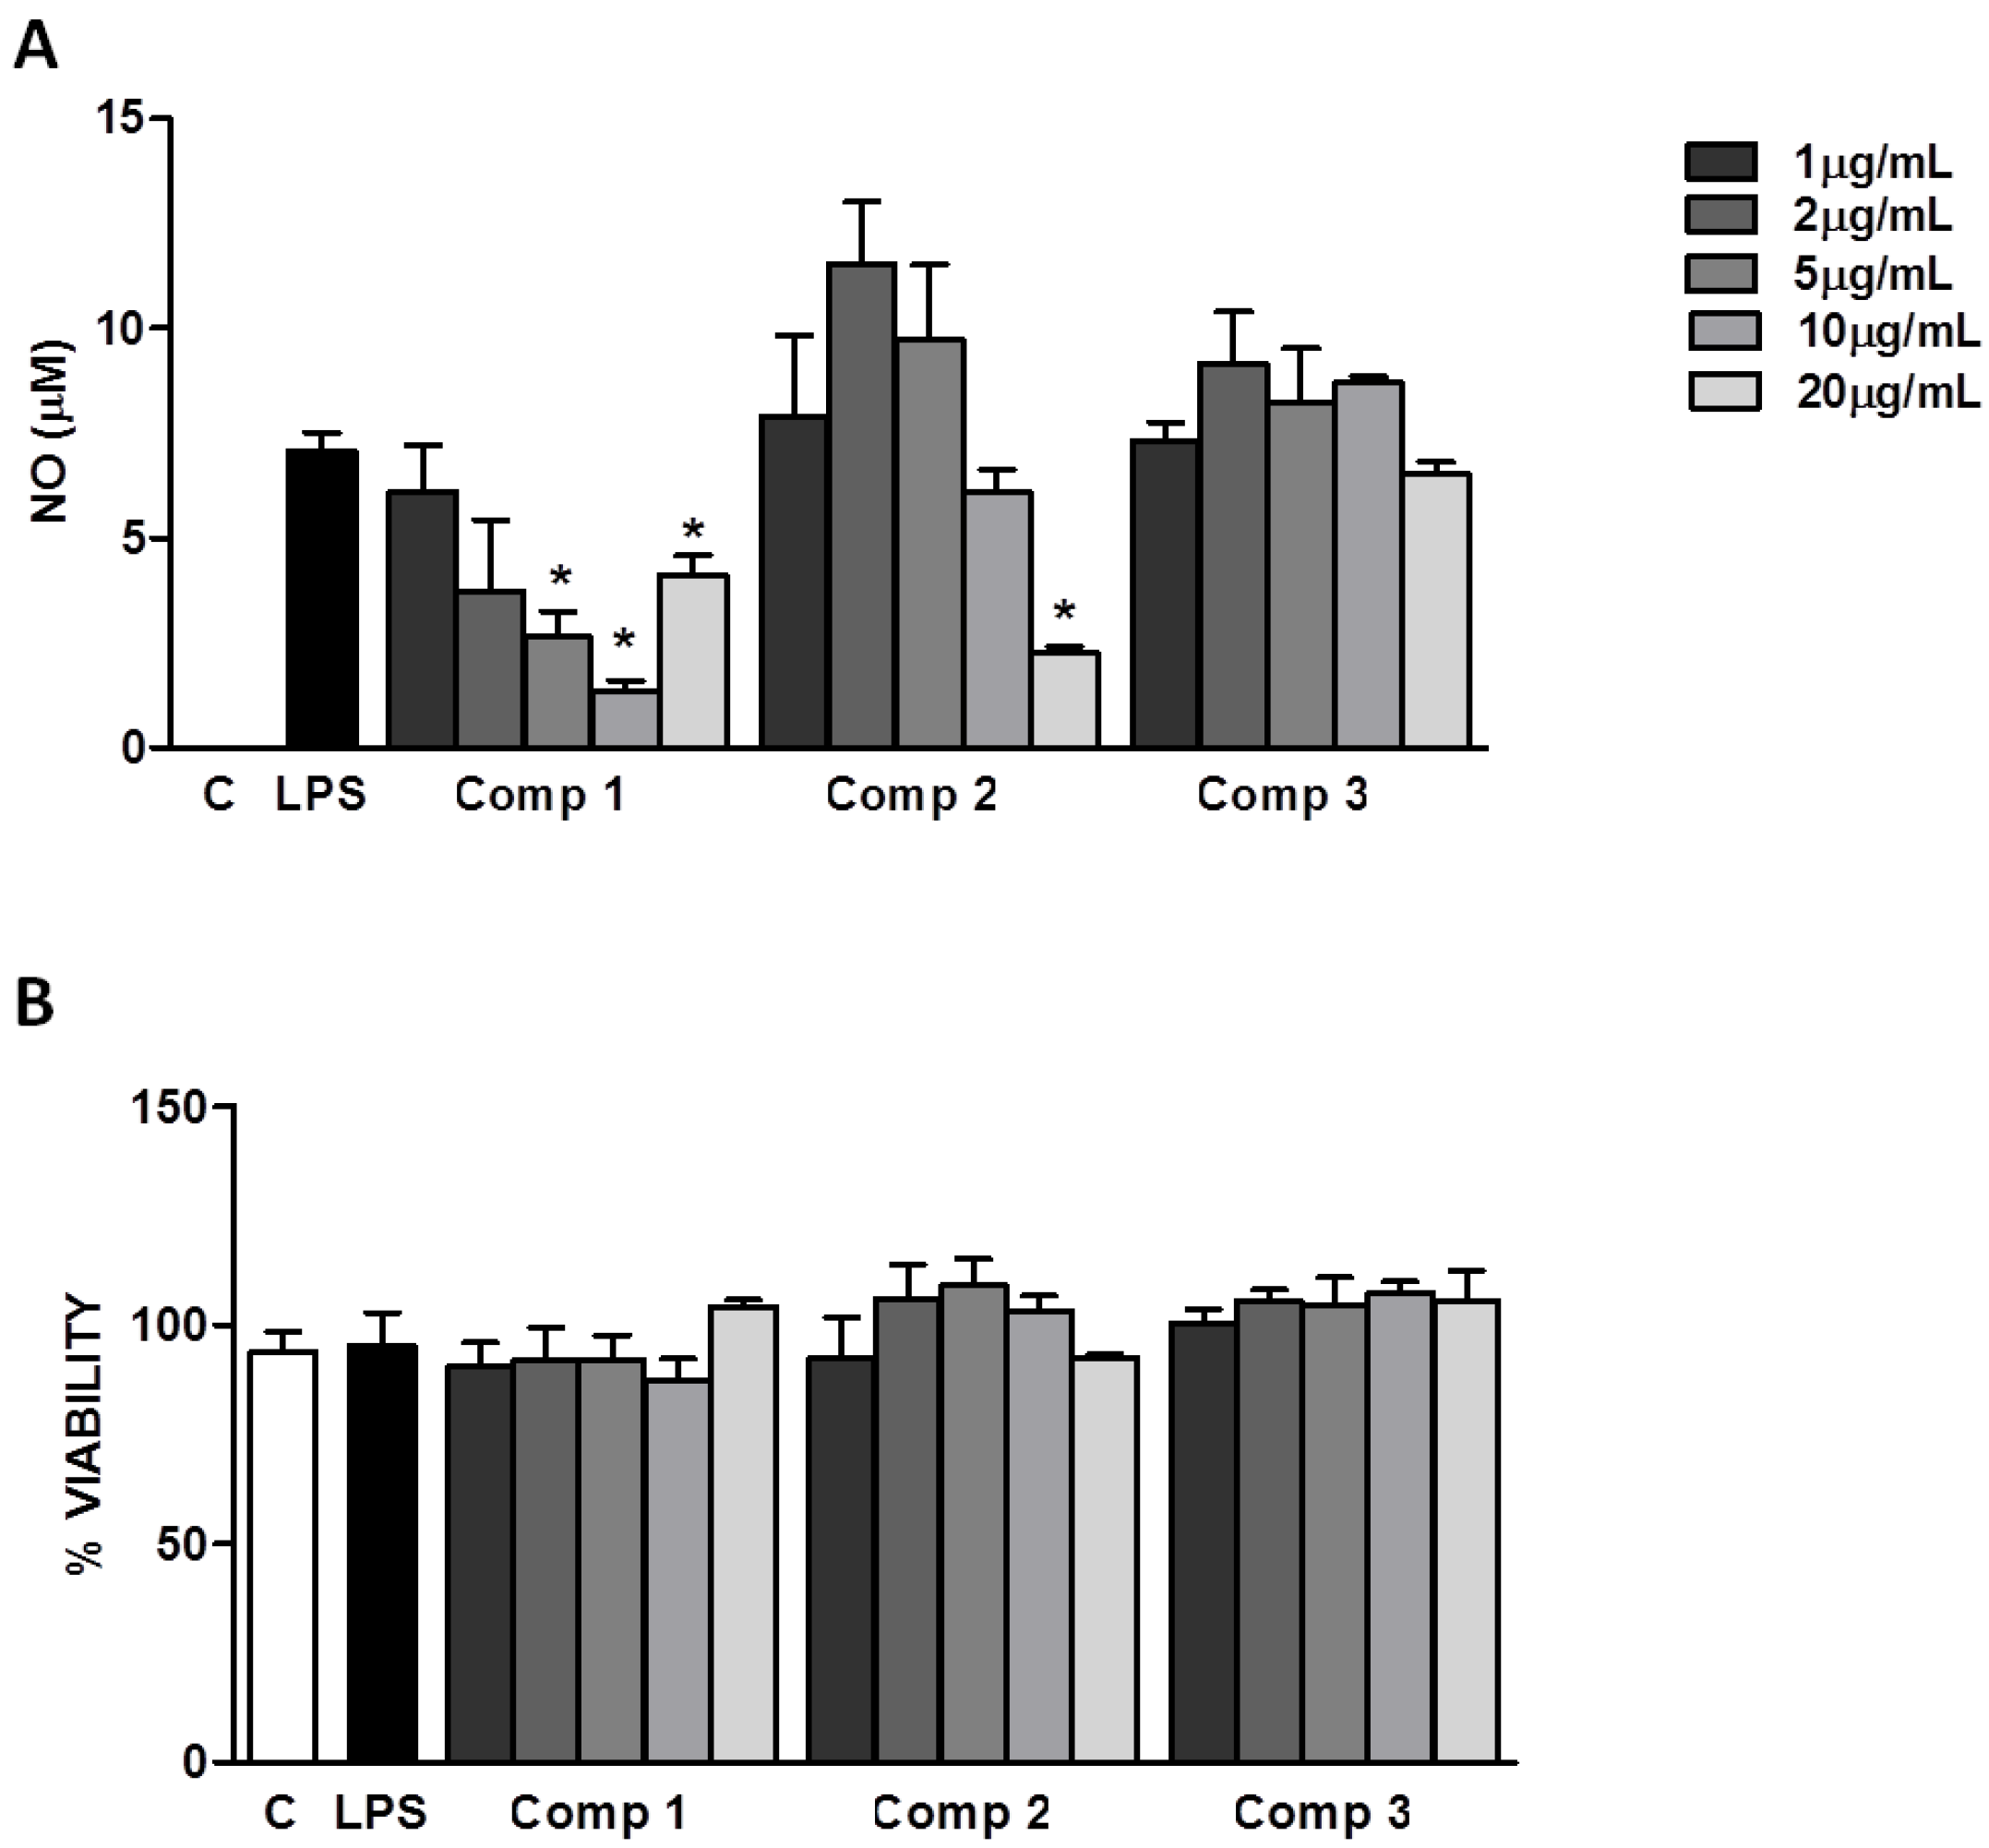
11]. We evaluated the production of NO by primary murine macrophages stimulated with LPS (1 μg/mL) in the presence or absence of different concentrations of compounds
1–
3. As it is shown in
Figure 4A, compounds
1 and
2 inhibited the production of NO with IC
50’s of 1.71 μg/mL (4.7 μM) and 10.04 μg/mL (20.4 μM), respectively. The levels of NO found at higher concentrations (20 μg/mL) of compound
1 might be attributed to the non pyrogen-free conditions of the isolation and purification process of compounds. Possible contaminations with potential microbial products in the compounds preparations disguise the inhibitory effect expected at these concentrations. Compound
3 did not show any significant effect on the production of NO induced by LPS in macrophages (
Figure 4A). Further studies are necessary to find out if compound
3 is able to inhibit other signaling pathways leading to the production of inflammatory mediators different than NO. The inhibition of NO production induced by compounds
1 and
2 is not due to their cytotoxicity, since the inhibitory concentrations (5–20 μg/mL) do not interfere with the cell viability, as it was determined by the 3-(4,5-dimethylthiazol-2-yl)-2,5-diphenyltetrazolium bromide (MTT) method (
Figure 4B). Our results indicate that compounds
1 and
2 can control NO production and could be promising anti-inflammatory agents. Other studies should be performed to elucidate the mechanism by which these compounds inhibit the production of NO and if there are other pathways being regulated by them.
Figure 4.
Inhibition of nitric oxide (NO) production induced by lipopolisacharides (LPS) in macrophages. (A) Peritoneal macrophages from C57Bl/6 mice were treated with different concentrations of compounds 1–3 (1, 2, 5, 10, or 20 μg/mL) 1 h before the stimulus with LPS (1 μg/mL). After 24 h of stimulus with LPS, supernatants were collected for NO determination. (B) Cell viabilities were assessed using 3-(4,5-dimethylthiazol-2-yl)-2,5-diphenyltetrazolium bromide (MTT) assay after collection of the supernatant. Results represent mean ± S.E.M. and are representative of two different experiments. * P < 0.005 compared with LPS stimulus alone. C, control; Comp, compound.


