
Seasonal Changes in Mycosporine-Like Amino Acid Production Rate with Respect to Natural Phytoplankton Species Composition


Abstract
:
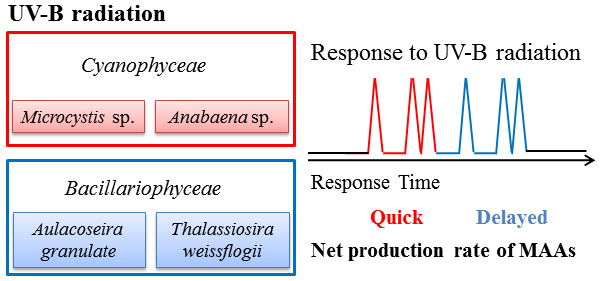
1. Introduction
2. Results
2.1. Seasonal Variation in Chl a and Phytoplankton Composition

| Location of Study and UV-B Intensity | Month | March | April | May | June | July | August | September | October | November |
|---|---|---|---|---|---|---|---|---|---|---|
| Lake Paldang | Chl a | 25.6 | 17.7 | 17.8 | 19.9 | 29.8 | 11.2 | 16.7 | 24.7 | 18.1 |
| Temp. | 8 | 15 | 16 | 23 | 27 | 23 | 24 | 18 | 12 | |
| DO | 12.5 | 14.9 | 10.5 | 10.7 | 11.9 | 9.9 | 11 | 12.6 | 11.8 | |
| Turbidity | 0.6 | 0.9 | 2.5 | 1.4 | 7 | 10.1 | 1.6 | 2.8 | 2.8 | |
| Lake Cheongpyeong | Chl a | 9.6 | 16.9 | 14.4 | 19.9 | 10.4 | 2.6 | 8.5 | 10.5 | 18.7 |
| Temp. | 8 | 13 | 14 | 22 | 26 | 21 | 23 | 19 | 11 | |
| DO | 14.7 | 14.1 | 11 | 10.1 | 10.7 | 9.3 | 10.8 | 8.7 | 12.9 | |
| Turbidity | 0.3 | 0.5 | 1.8 | 1.2 | 2.5 | 15.1 | 1.5 | 1.7 | 1.5 | |
| UV-B intensity (mW·m−2) | 94.2 | 142.3 | 166.5 | 156 | 163.1 | 162.8 | 134.4 | 90.3 | 39.5 | |
| Data Species | March | April | May | June | July | August | September | October | November |
|---|---|---|---|---|---|---|---|---|---|
| Bacillariophyceae | |||||||||
| Achanthoseras zachariasii | 1.06 | ||||||||
| Achnanthes sp. | 0.16 | ||||||||
| Amphora ovalis | 0.11 | ||||||||
| Amphora sp. | |||||||||
| Asterionella formosa | 2.28 | 24.96 | 53.90 | 20.18 | 0.10 | 2.12 | 2.35 | ||
| Aulacoseira granulata | 2.57 | ||||||||
| Aulacoseria granulata var. angustissima | 0.90 | 47.96 | 36.56 | 12.61 | 41.27 | 66.03 | 64.14 | ||
| Cocconeis placentula | 0.11 | ||||||||
| Cocconeis sp. | 0.08 | ||||||||
| Cyclotella comta | 1.06 | 2.50 | |||||||
| Cyclotella meneghiniana | 0.12 | 2.80 | 4.53 | 17.50 | 0.45 | 2.55 | 2.13 | ||
| Cyclotella pseudostelligra | 2.60 | 8.75 | |||||||
| Cyclotella stelligera | 0.12 | 9.77 | |||||||
| Cyclotella sp. | 1.51 | 5.00 | 4.99 | 6.79 | 7.58 | ||||
| Cymbella affinis | 0.24 | ||||||||
| Cmbella minuta var. silesiaca | 0.35 | 0.42 | |||||||
| Cymbella tumida | 0.49 | ||||||||
| Cymbella turgidula | 0.43 | ||||||||
| Fragilaria crotonensis | 5.03 | 24.15 | 1.49 | ||||||
| Fragilaria sp. | 0.43 | ||||||||
| Gomphonema sp. | |||||||||
| Hantzschia sp. | 0.21 | ||||||||
| Navicula cryptocephala | 0.20 | 0.85 | |||||||
| Navicula gregaria | 0.05 | 1.28 | 0.21 | ||||||
| Navicula pupula | 1.28 | 0.21 | |||||||
| Navicula viridula var. rostellata | 0.21 | ||||||||
| Navicula sp. | 0.11 | ||||||||
| Nitzschia acicularis | 1.22 | 4.94 | 0.30 | 1.06 | 0.23 | 4.49 | 0.21 | ||
| Nitzschia actinastroides | 1.59 | 0.19 | |||||||
| Nitzschia amphibia | 1.65 | 2.24 | 0.32 | ||||||
| Nitzschia palea | 1.22 | 1.06 | 6.73 | 0.79 | 1.06 | 0.32 | |||
| Nitzschia sinuata var. tabellaria | 0.30 | ||||||||
| Nitzschia sp. | 0.41 | 0.21 | 0.21 | ||||||
| Rhizosolenia eriensis var. morsa | 0.21 | ||||||||
| Stephanodiscus hantzschii | 89.50 | 57.02 | 3.27 | 6.19 | 0.83 | 0.11 | |||
| Synedra acus | 0.12 | 4.60 | 0.21 | 0.43 | 1.47 | 0.21 | |||
| Unknown | 0.35 | 2.76 | |||||||
| subtotal | 97.80 | 96.53 | 82.62 | 95.22 | 46.72 | 54.70 | 48.98 | 84.50 | 88.79 |
| Cyanophyceae | |||||||||
| Anabaena macrospora | 17.13 | ||||||||
| Anabaena spiroides | 3.07 | ||||||||
| Anabaena smithii | 8.16 | ||||||||
| Anabaena sp. | 4.25 | 3.84 | |||||||
| Aphanizomenon flos-aquae | 4.68 | 3.82 | |||||||
| Merismopedia grauca | 13.68 | 35.15 | |||||||
| Microcystis wesenbergii | 3.12 | ||||||||
| Microcystis sp. | 4.67 | ||||||||
| Pseudoanabaena sp. | 13.68 | 1.92 | |||||||
| unknown | 0.21 | ||||||||
| subtotal | 4.25 | 31.84 | 27.56 | 43.31 | 8.49 | 1.92 | |||
| Chlorophyceae | |||||||||
| Ankistrodesmus falcatus var. mirabilis | 0.33 | 0.52 | 0.12 | 0.53 | 4.89 | 0.43 | 0.45 | 0.64 | |
| Characium sp. | 0.83 | ||||||||
| Chlamydomonas umbonata | 0.11 | ||||||||
| Chlamydomonas sp. | 0.82 | 0.23 | |||||||
| Chlorogonium elongatum | 0.11 | ||||||||
| Chlorogonium sp. | |||||||||
| Coelastrum sp. | 1.87 | 1.71 | |||||||
| Cosmarium sp. | 0.11 | ||||||||
| Dictyosphaerium ehrebergianum | 3.42 | ||||||||
| Eudorina elegans | 1.66 | ||||||||
| Hormidium sp. | 5.12 | ||||||||
| Lobomonas rostrata | 0.10 | ||||||||
| Micractinium pusillum | 0.49 | 0.85 | 0.34 | ||||||
| Oocystis sp. | 0.35 | ||||||||
| Pandorina morum | 8.12 | 0.91 | |||||||
| Pediastrumsimplex var. simplex | 0.91 | ||||||||
| Pteromonas sp. | 0.45 | ||||||||
| Scenedesmus acuminatus | 1.42 | ||||||||
| Scenedesmus acutus f. costulatus | 2.77 | 3.59 | 0.43 | ||||||
| Scenedesmus ecornis | 3.59 | 0.85 | |||||||
| Scenedesmus quadricauda | 2.12 | 1.79 | 2.04 | ||||||
| Scenedesmus sp. | 0.98 | ||||||||
| Staurastrum sp. | 0.11 | ||||||||
| Treubaria schmidlei | 0.45 | ||||||||
| Unknown | 0.12 | 0.43 | |||||||
| subtotal | 1.79 | 3.29 | 3.27 | 0.53 | 19.15 | 15.81 | 6.12 | 7.15 | |
| Others | |||||||||
| Cryptomonas ovata | 0.16 | 7.91 | 1.28 | ||||||
| Cryptomonas sp. | 1.31 | 0.21 | 1.71 | 0.85 | 0.21 | ||||
| Komma sp. | 0.23 | ||||||||
| Mallomonas raginae | 0.05 | ||||||||
| Mallomonas sp. | 0.24 | 0.23 | 0.05 | 0.11 | 0.11 | ||||
| Peridinium bipes f. occultatum | 0.58 | 1.98 | 4.67 | 0.21 | |||||
| Peridinium sp. | 0.17 | 0.11 | 1.49 | ||||||
| Phaccus sp. | |||||||||
| Rhodomonas sp. | 3.85 | 0.21 | 1.36 | 0.32 | |||||
| subtotal | 0.41 | 0.17 | 14.12 | 2.29 | 1.92 | 1.59 | 7.01 | 2.13 |
| Data Species | March | April | May | June | July | August | September | October | November |
|---|---|---|---|---|---|---|---|---|---|
| Bacillariophyceae | |||||||||
| Achanthoseras zachariasii | 6.69 | 2.49 | 0.62 | ||||||
| Achnanthes sp. | 0.97 | 0.17 | |||||||
| Amphora sp. | 0.97 | ||||||||
| Asterionella formosa | 8.39 | 8.39 | 59.38 | 46.19 | 7.77 | 0.65 | 21.33 | 0.42 | |
| Aulacoseira granulata | 4.84 | 2.11 | |||||||
| Aulacoseria granulata var. angustissima | 1.24 | 4.71 | 10.68 | 12.34 | 45.43 | 13.75 | |||
| Cyclotella comta | 0.57 | 0.24 | |||||||
| Cyclotella meneghiniana | 0.19 | 0.21 | 2.77 | 0.62 | |||||
| Cyclotella pseudostelligra | 46.24 | ||||||||
| Cyclotella stelligera | 0.71 | 0.71 | 0.65 | 11.17 | 21.21 | ||||
| Cyclotella sp. | 8.74 | 4.88 | |||||||
| Cymbella affinis | 2.43 | ||||||||
| Cymbella minuta var. silesiaca | 0.35 | 0.35 | |||||||
| Cymbella turgidula | 0.24 | ||||||||
| Cymbella sp. | 0.09 | 1.46 | |||||||
| Fragilaria construens f. venter | 1.74 | 1.74 | 4.37 | ||||||
| Fragilaria crotonensis | 6.06 | 6.06 | 22.16 | 37.81 | 2.02 | 5.83 | 8.12 | ||
| Fragilaria sp. | 0.21 | ||||||||
| Melosira varians | 0.97 | ||||||||
| Navicula cryptocephala | 0.49 | ||||||||
| Navicula gregaria | 0.12 | 0.12 | 1.94 | ||||||
| Navicula viridula var. rostellata | |||||||||
| Navicula sp. | 0.12 | 0.12 | 0.19 | 5.83 | 0.24 | 0.83 | |||
| Nitzschia acicularis | 2.01 | 2.01 | 1.70 | 0.47 | 3.88 | 2.42 | 0.28 | 1.87 | |
| Nitzschia levidensis var. levidensis | 0.49 | ||||||||
| Nitzschia palea | 1.41 | 16.99 | 1.05 | ||||||
| Nitzschia sinuata var. tabellaria | 0.49 | ||||||||
| Nitzschia sp. | 0.57 | 0.38 | 3.88 | ||||||
| Rhizosolenia eriensis var. morsa | 0.28 | 4.27 | 0.83 | 0.02 | |||||
| Stephanodiscus hantzschii | 67.85 | 67.85 | 9.47 | ||||||
| Synedra acus | 0.57 | 1.55 | |||||||
| Synedra ulna | 0.97 | ||||||||
| Unknown | 0.97 | ||||||||
| subtotal | 87.35 | 87.35 | 95.17 | 86.48 | 8.61 | 91.26 | 54.19 | 82.66 | 71.88 |
| Cyanophyceae | |||||||||
| Anabaena spiroides | 40.09 | ||||||||
| Anabaena sp. | 0.29 | 17.79 | 0.65 | 0.83 | |||||
| Microcystis aeuriginosa | 16.80 | ||||||||
| Microcystis wesenbergii | 9.14 | ||||||||
| Pseudoanabaena sp. | 7.39 | ||||||||
| subtotal | 0.29 | 82.07 | 0.65 | 9.97 | |||||
| Chlorophyceae | |||||||||
| Ankistrodesmus falcatus var. mirabilis | 0.09 | 0.97 | 3.06 | 0.62 | |||||
| Carteria cordifomis | 1.21 | ||||||||
| Characium sp. | 4.10 | ||||||||
| Chlamydomonas umbonata | 0.61 | 0.21 | |||||||
| Chlamydomonas sp. | 0.35 | 0.35 | 0.09 | 0.65 | |||||
| Closteriopsis longissima | 0.24 | ||||||||
| Dictyosphaerium ehrebergianum | 2.42 | ||||||||
| Elakatothrix gelatinosa | 0.14 | ||||||||
| Eudorina elegans | 2.49 | ||||||||
| Hormidium sp. | 2.91 | 7.26 | 21.87 | ||||||
| Micractinium pusillum | 0.81 | ||||||||
| Pediastrum duplex var. reticulatum | 2.22 | ||||||||
| Pediastrum sp. | 1.27 | ||||||||
| Scenedesmus acutus f. costulatus | 0.55 | ||||||||
| Scenedesmus ecornis | 0.61 | ||||||||
| Scenedesmus denticulatus | 0.83 | ||||||||
| Scenedesmus quadricauda | 0.81 | 2.22 | 0.83 | ||||||
| Scenedesmus spinosus | 0.61 | ||||||||
| Scenedesmus sp. | 0.28 | ||||||||
| Staurastrum sp. | 4.44 | ||||||||
| Treubaria sp. | 0.12 | 0.12 | |||||||
| Unknown | 1.05 | 0.14 | 0.62 | ||||||
| subtotal | 0.47 | 0.47 | 0.19 | 5.14 | 5.88 | 3.88 | 20.89 | 5.26 | 24.99 |
| Others | |||||||||
| Cryptomonas ovata | 0.71 | 0.71 | 3.98 | 1.05 | 1.18 | 6.29 | 0.28 | ||
| Cryptomonas sp. | 1.18 | 0.97 | 0.83 | ||||||
| Komma sp. | 0.83 | ||||||||
| Mallomonas raginae | 0.10 | ||||||||
| Mallomonas sp. | 0.35 | 0.35 | 0.09 | 0.81 | |||||
| Peridinium bipes f. occultatum | 0.57 | 6.19 | 1.08 | 1.04 | |||||
| Peridinium sp. | 1.46 | 6.05 | 1.11 | 0.42 | |||||
| Rhodomonas sp. | 11.11 | 11.11 | 0.76 | 2.43 | 11.13 | 0.72 | |||
| subtotal | 12.17 | 12.17 | 4.64 | 8.10 | 3.44 | 4.85 | 24.27 | 2.11 | 3.12 |
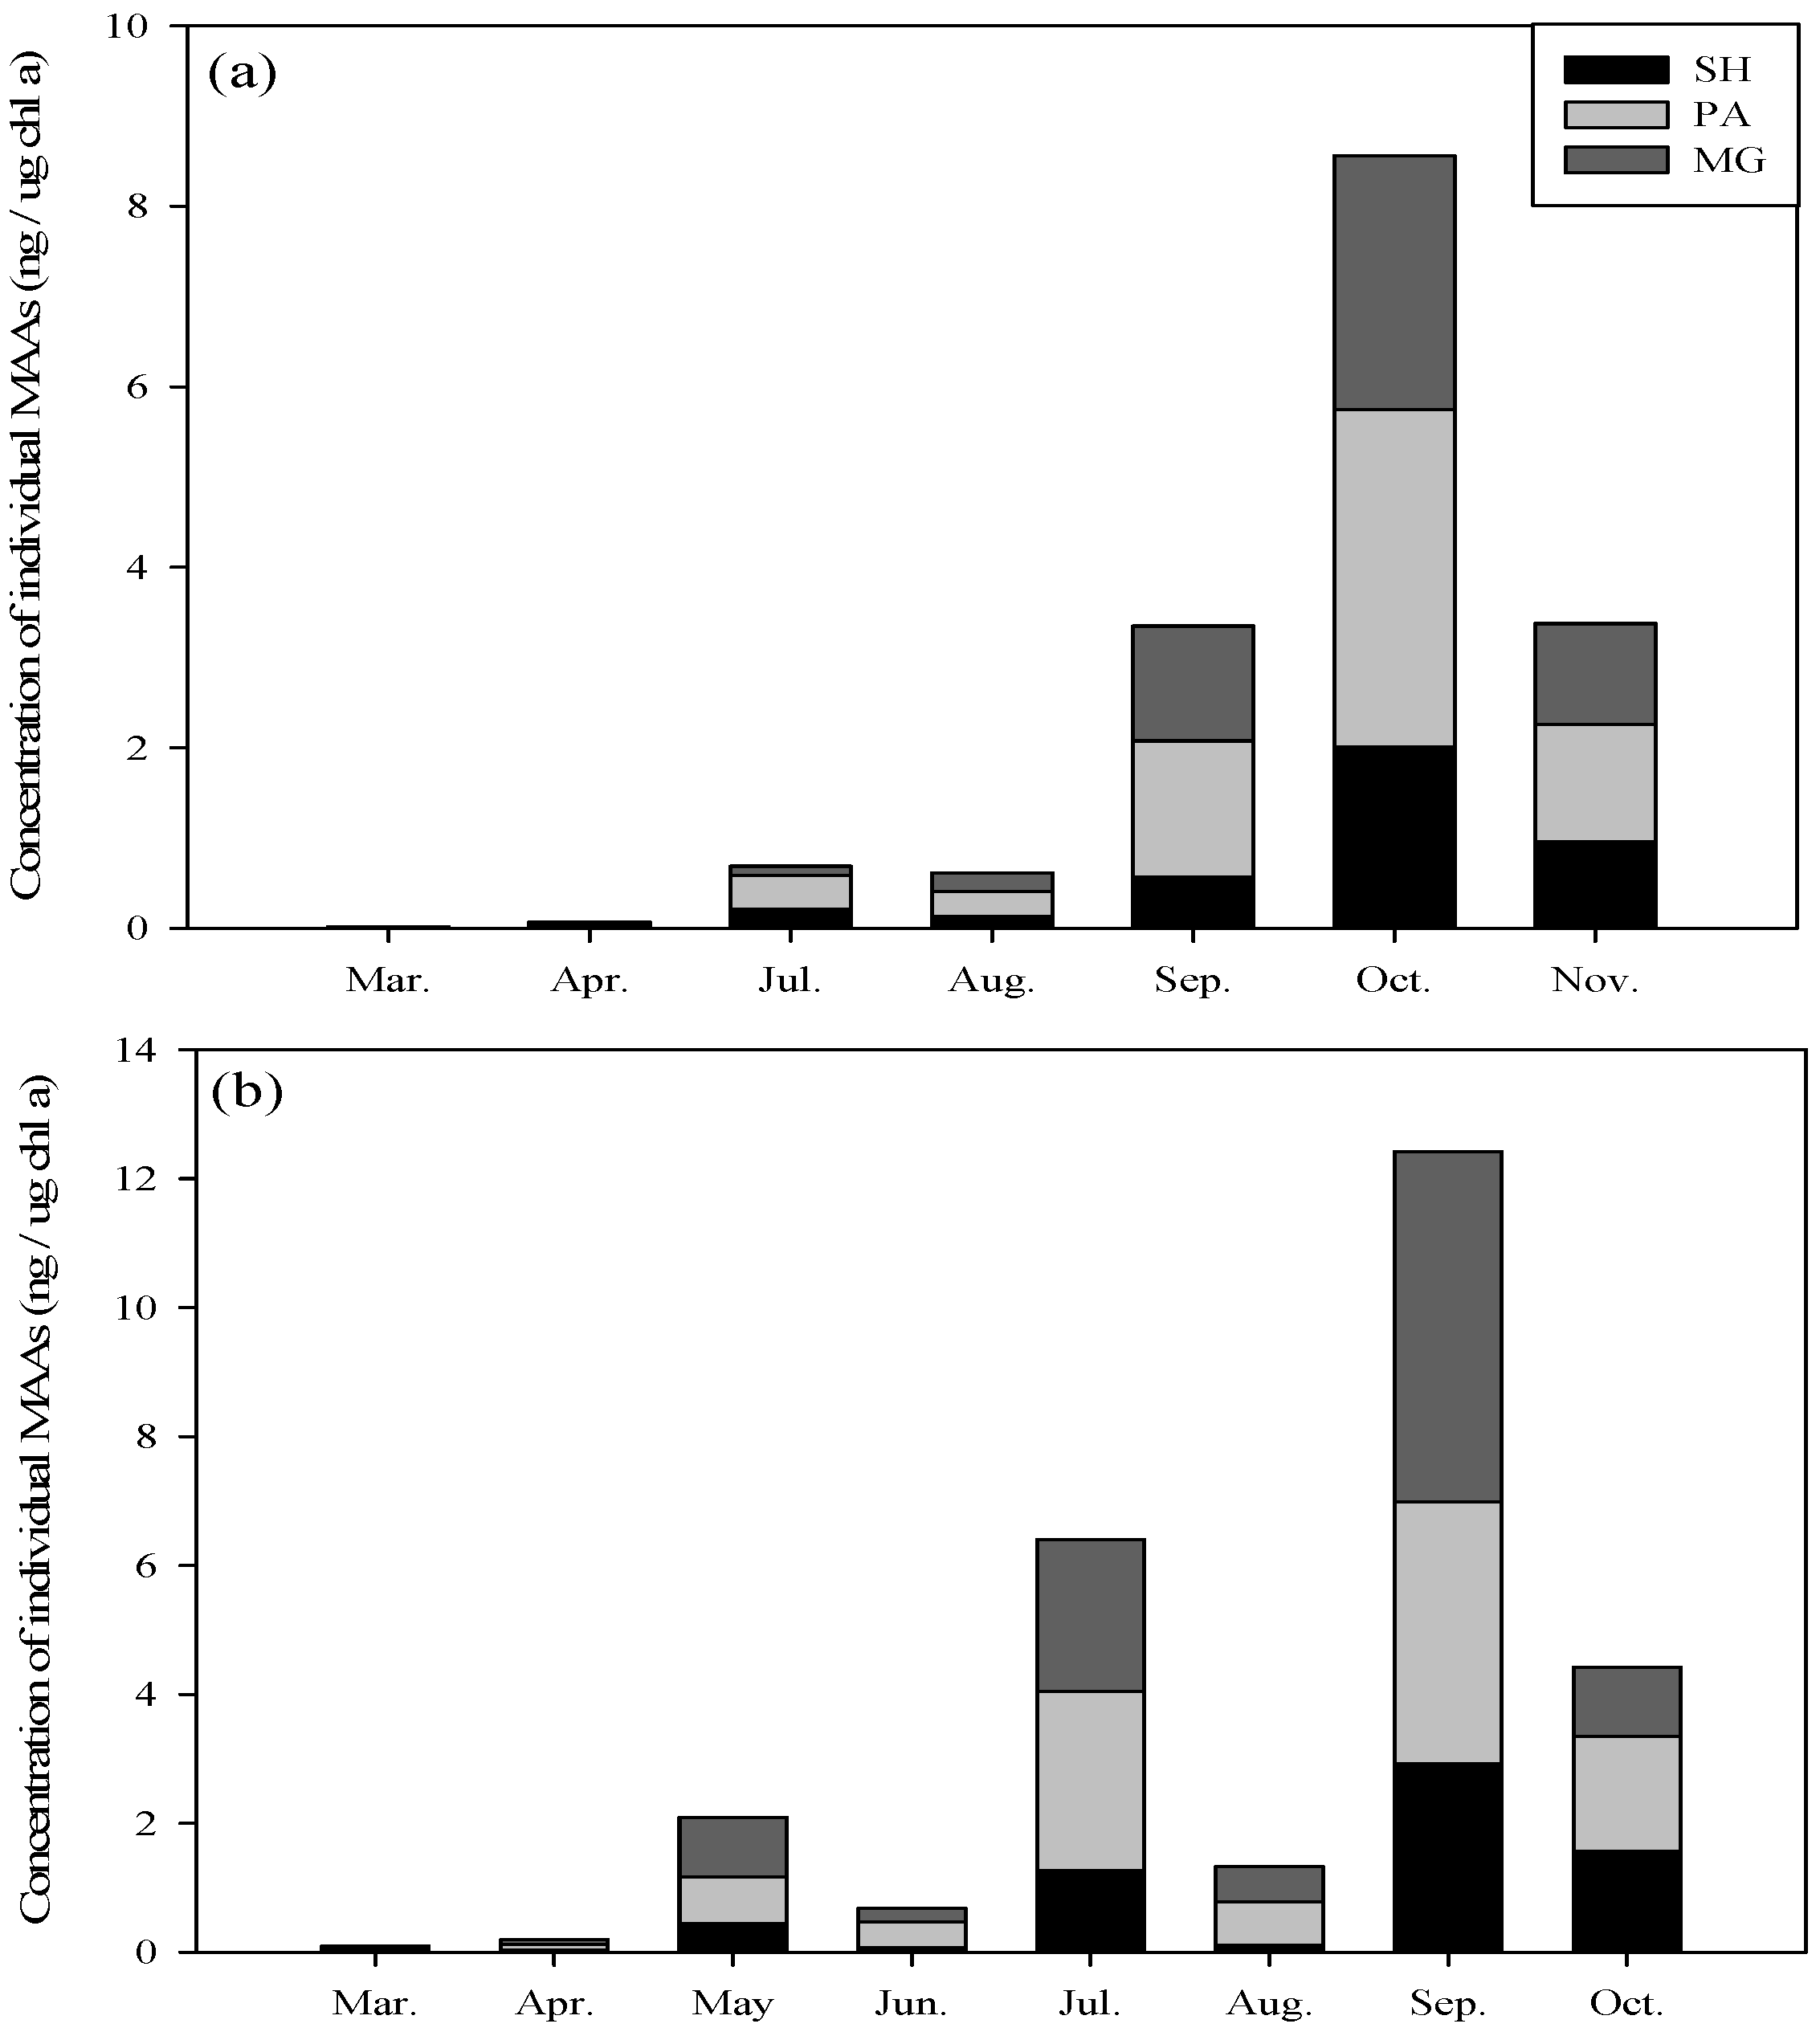
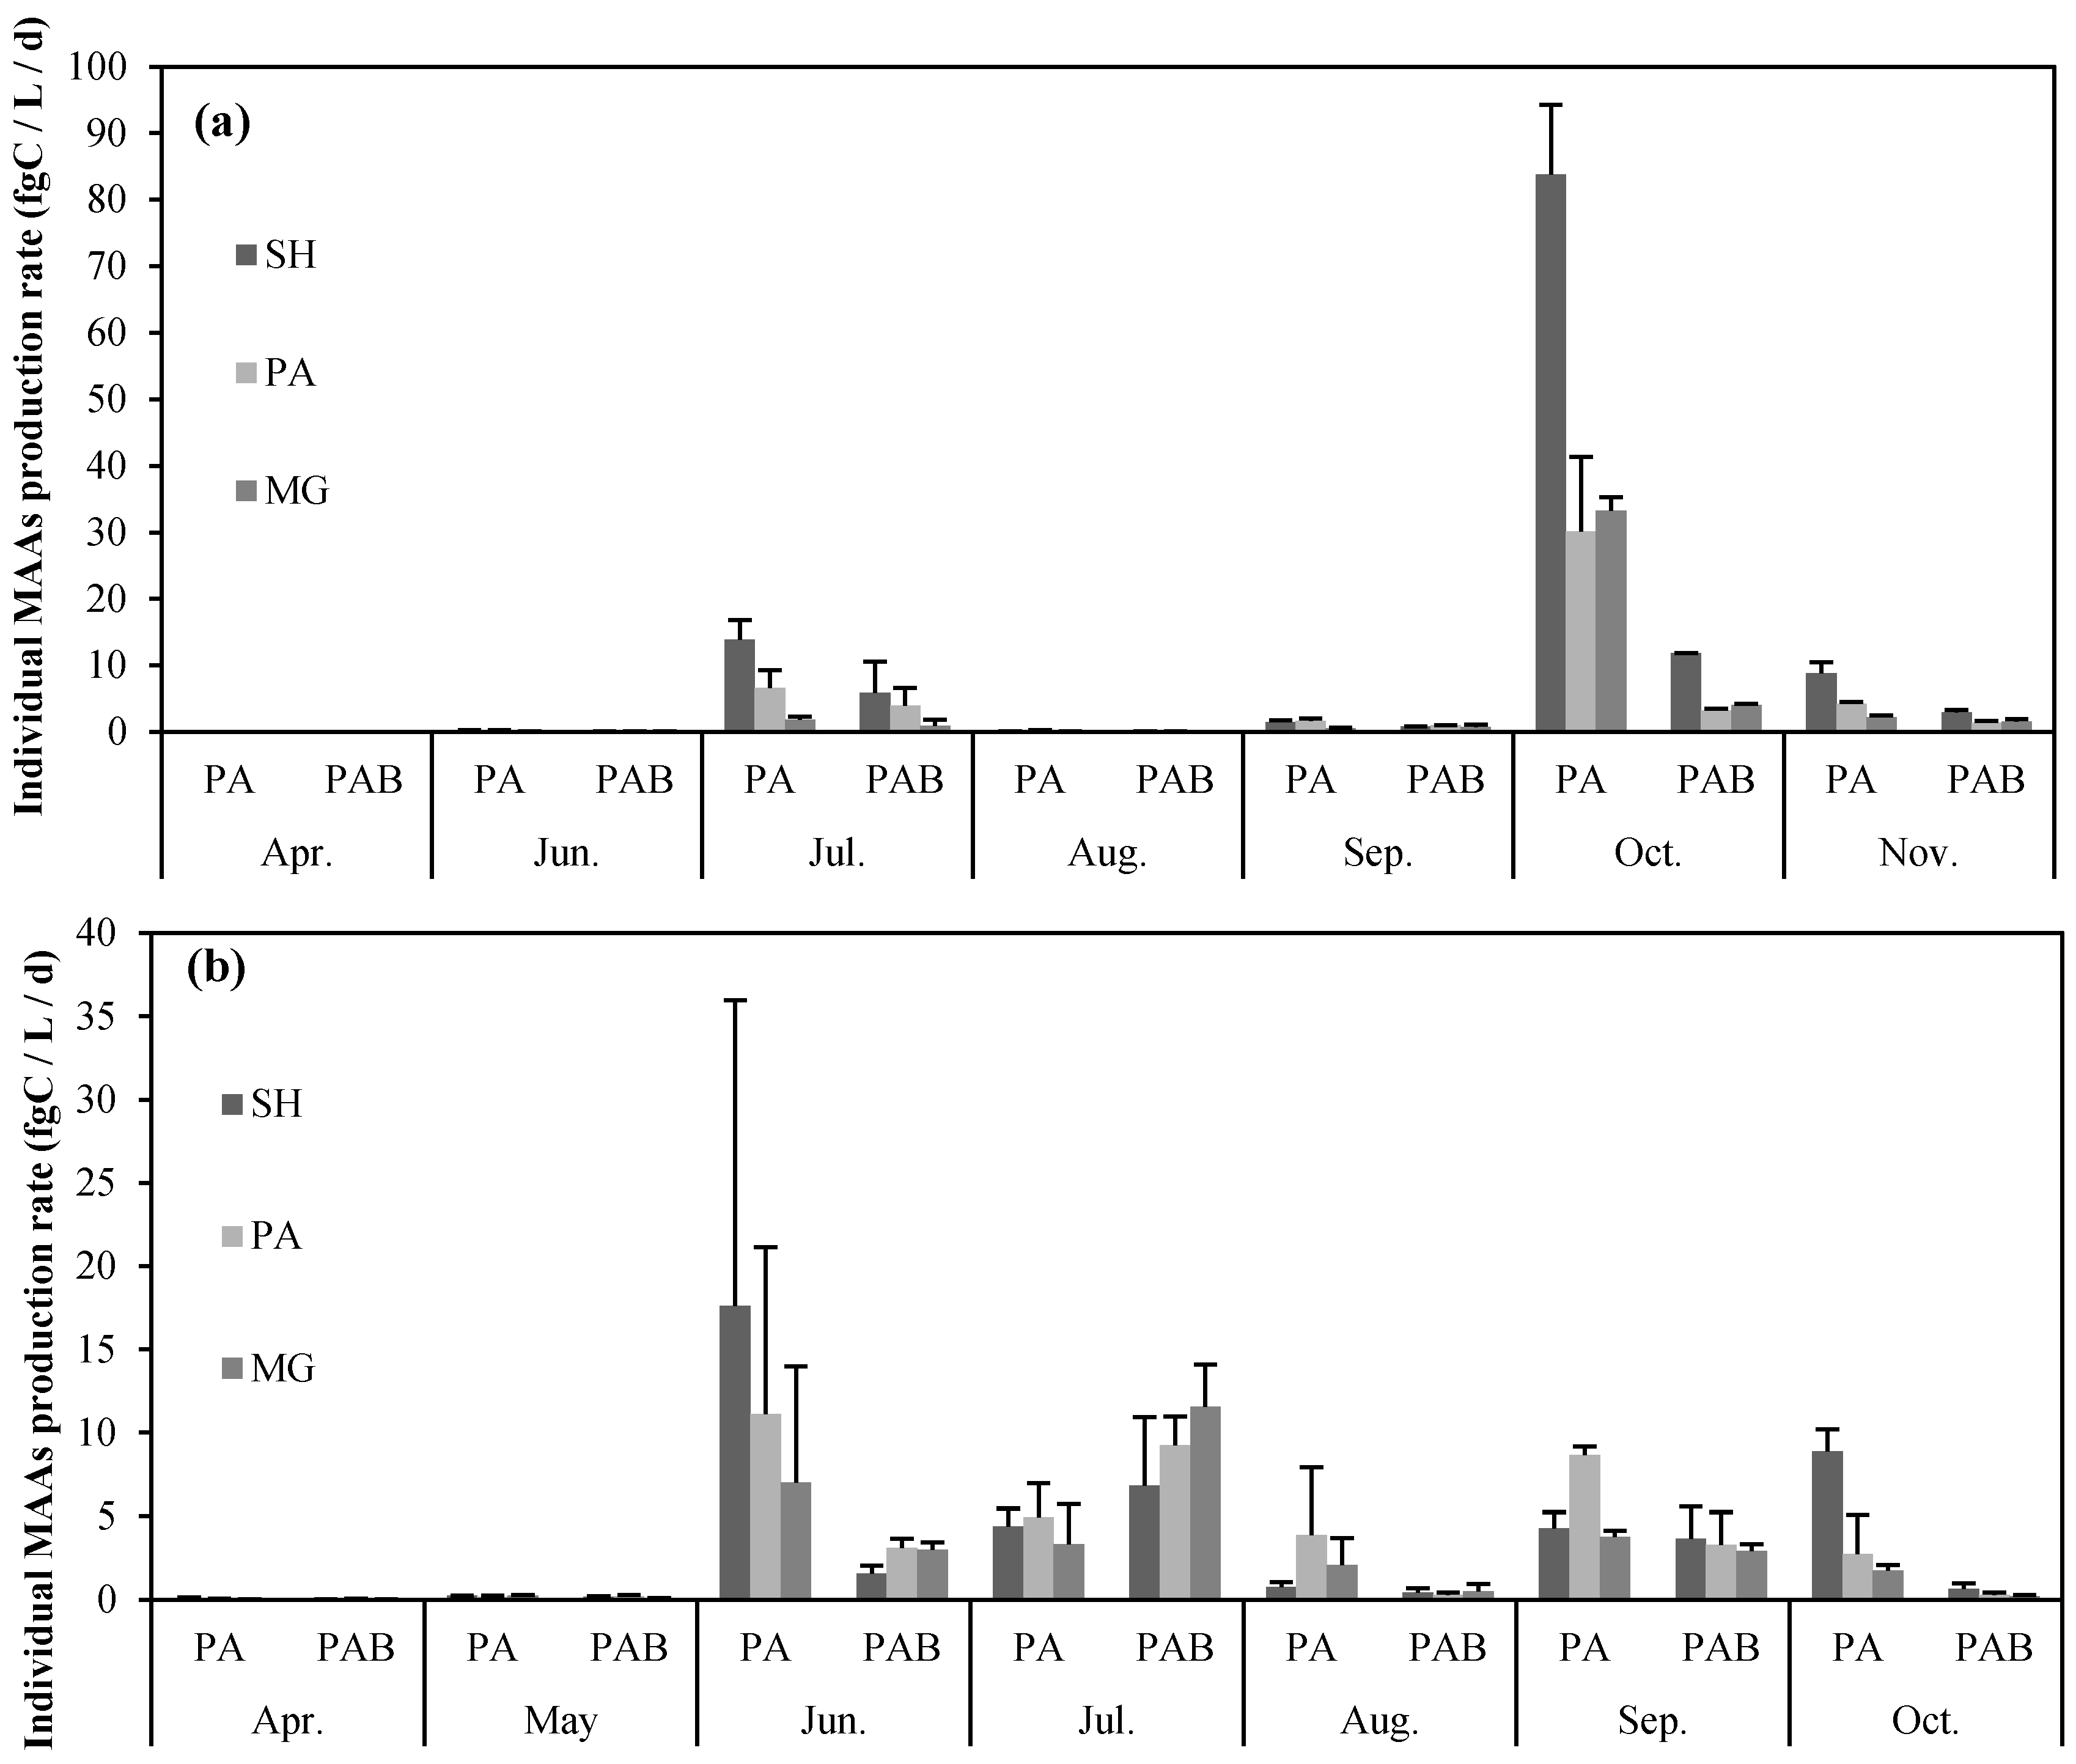
2.2. Seasonal Variation in Concentration and Net Production Rate of MAA


3. Materials and Methods
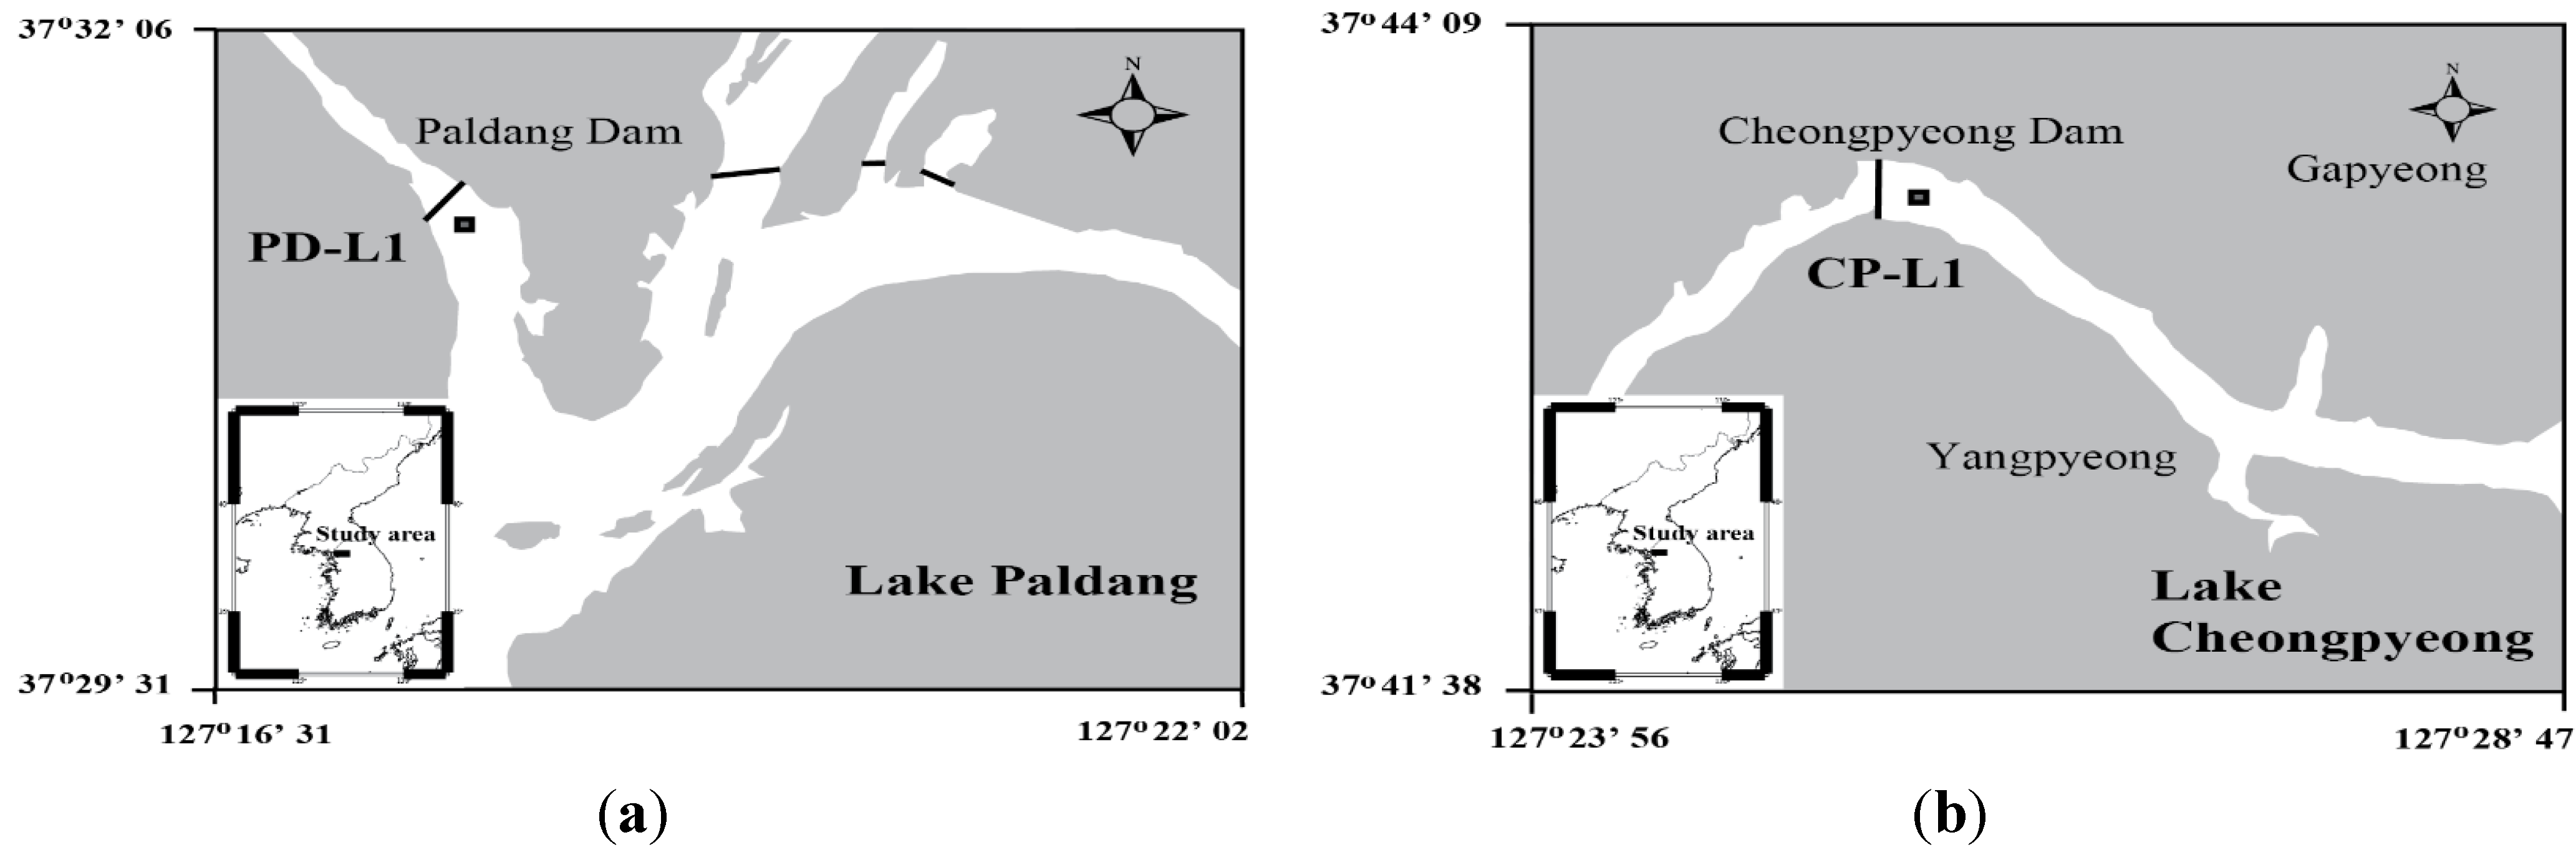
3.1. Study Area

3.2. In Situ Culture Experiment Using 13C Tracer

3.3. Extraction and Analysis of Mycosporine-Like Amino Acids

3.4. Calculation of the Net Production Rate and Turnover Rates of MAAs
3.5. Statistics
4. Discussion
Acknowledgments
Author Contributions
Conflicts of Interest
References
- Helbling, E.W.; Villafane, V.; Ferrario, M.; Holm-Hansen, O. Impact of natural ultraviolet radiation on rates of photosynthesis and on specific marine phytoplankton species. Mar. Ecol. Prog. Ser. 1992, 80, 89–100. [Google Scholar] [CrossRef]
- Behrenfeld, M.J.; Lean, D.R.S., II; Lee, H. Ultraviolet-B radiation effects on inorganic nitrogen uptake by natural assemblages of oceanic plankton. J. Phycol. 1995, 31, 25–36. [Google Scholar] [CrossRef]
- Häder, D.P.; Kumar, H.D.; Smith, R.C.; Worrest, R.C. Effects of solar UV radiation on aquatic ecosystems and interactions with climate change. Photochem. Photobiol. Sci. 2007, 6, 267–285. [Google Scholar] [CrossRef] [PubMed]
- Karentz, D.; Cleaver, J.E.; Mitchell, D.L. Cell survival characteristics and molecular responses of Antarctic phytoplankton to ultraviolet-B radiation. J. Phycol. 1991, 27, 326–341. [Google Scholar] [CrossRef]
- Döhler, G.; Buchmann, T. Effects of UV-A and UV-B irradiance on pigments and 15N-ammonium assimilation of the haptophycean Pavlova. J. Plant Physiol. 1995, 146, 29–34. [Google Scholar] [CrossRef]
- Boelen, P.; De Boer, M.K.; Kraay, G.W.; Veldhuis, M.J.W.; Buma, A.G.J. UVBR-induced DNA damage in natural marine picoplankton assemblages in the tropical Atlantic Ocean. Mar. Ecol. Prog. Ser. 2000, 193, 1–9. [Google Scholar] [CrossRef]
- Vernet, M.; Whitehead, K. Release of ultraviolet-absorbing compounds by the red-tide dinoflagellate Lingulodinium polyedra. Mar. Biol. 1996, 127, 35–44. [Google Scholar] [CrossRef]
- Moeller, R.E.; Gilroy, S.; Williamson, C.E.; Grad, G.; Sommaruga, R. Dietary acquisition of photoprotective compounds (mycosporine-like amino acids, carotenoids) and acclimation to ulraviolet radiation in a freshwater copepod. Limnol. Oceanogr. 2005, 50, 427–439. [Google Scholar] [CrossRef]
- Xiong, F.; Kopecky, J.; Nedbal, L. The occurrence of UV-B absorbing mycosporine-like amino acids in freshwater and terrestrial microalgae (Chlorophyta). Aquat. Bot. 1999, 63, 37–49. [Google Scholar] [CrossRef]
- Sommaruga, R.; Garicia-Pichel, R. UV-absorbing compounds in planktonic and benthic organisms from a high-mountain lake. Arch. Hydrobiol. 1999, 144, 225–269. [Google Scholar]
- Laurion, I.; Lami, A.; Sommaruga, R. Distribution of mycosporine-like amino acids and photprotective carotenoids among freshwatr phytoplankton assemblages. Aquat. Microb. Ecol. 2002, 26, 283–294. [Google Scholar] [CrossRef]
- Tartarotti, B.; Sommaruga, R. Seasonal and ontogenetic changes of mycosporine-like amino acids in planktonic organisms from an alpine lake. Limnol. Oceanogr. 2002, 51, 1530–1541. [Google Scholar] [CrossRef]
- Sinha, R.P.; Singh, S.P.; Häder, D.P. Database on mycosporines and mycosporine-like amino acids (MAAs) in fungi, cyanobacteria, macroalgae, phytoplankton and animals. J. Photochem. Photobiol. B Biol. 2007, 89, 29–35. [Google Scholar] [CrossRef] [PubMed]
- Karentz, D. Chemical defenses of marine organisms against solar radiation exposure: UV-absorbing mycosporine-like amino acids and scytonemin. In Marine Chemical Ecology; McClintock, J.B., Baker, B.J., Eds.; CRC Press: Boca Raton, FL, USA, 2001; pp. 481–520. [Google Scholar]
- Häder, D.P.; Helbing, E.W.; Williamson, C.E.; Worrest, R.C. Effects of UV radiation on aquatic ecosystems and interactions with climate change. Photochem. Photobiol. Sci. 2011, 10, 242–260. [Google Scholar] [CrossRef] [PubMed]
- Sommaruga, R. The role of solar UV radiation in the ecology of alpine lakes. J. Photochem. Photobiol. B Biol. 2001, 62, 35–42. [Google Scholar] [CrossRef]
- Schindler, D.W.; Jefferson Curtis, P.; Parker, B.R.; Stainton, M.P. Consequences of climate warming and lake acidification for UV-B penetration in North American boreal lakes. Nature 1996, 379, 705–708. [Google Scholar] [CrossRef]
- Yan, N.D.; Keller, W.; Scully, N.M.; Lean, D.R.S.; Dillon, P.J. Increased UV-B penetration in lake owing to drought-induced acidification. Nature 1996, 381, 141–143. [Google Scholar] [CrossRef]
- Behrenfeld, M.J.; Chapman, J.W.; Hardy, J.T.; Lee, H., II. Is there a common response to ultraviolet-B radiation by phytoplankton? Mar. Ecol. Prog. Ser. 1993, 102, 59–68. [Google Scholar] [CrossRef]
- Helbling, E.W.; Avaria, S.; Letelier, J.; Montecino, V.; Ramírez, B.; Ramos, M.; Rojas, W.; Villafañe, V.E. Respuesta del fitoplancton marino a la radiación ultraviolet en latitudes medias (33 grados s). Rev. Biol. Mar. 1993, 28, 219–237. [Google Scholar]
- Helbling, E.W.; Buma, A.G.J.; de Boer, M.K.; Villafañe, V.E. In situ impact of solar ultraviolet radiation on photosynthesis and DNA in temperate marine phytoplankton. Mar. Ecol. Prog. Ser. 2001, 211, 43–49. [Google Scholar] [CrossRef]
- Kim, J.; Heo, S.; Noh, H.; Yang, H.; Jeong, D.I. Water quality fluctuation study of Paldang Reservoir affected by Gyeongsan stream inflow according to rainfall. Korean J. Limnol. 2006, 39, 236–244. [Google Scholar]
- Kim, J.; Lee, S.; Bang, H.; Hwang, S. Characteristics of algae occurrence in Lake Paldang. J. Korean Environ. Eng. Res. 2009, 31, 325–331. [Google Scholar]
- Hama, T.; Miyazaki, T.; Ogawa, W.; Iwakuma, T.; Takahashi, M.; Otsuki, A.; Ichimura, S. Measurement of photosynthetic production of a marine phytoplankton population using a stable isotope. Mar. Biol. 1983, 73, 31–36. [Google Scholar] [CrossRef]
- Ha, S.; Kim, Y.; Park, M.; Kang, S.; Kim, H.; Shin, K. Production rate of mycosporine-like amino acids of in situ phytoplankton community in Kongsfjorden, Svalbard, Arctic. J. Photochem. Photobiol. B 2012, 114, 1–14. [Google Scholar] [CrossRef] [PubMed]
- Liu, Z.; Häder, D.P.; Sommaruga, R. Occurrence of mycosporine-like amino acids (MAAs) in the bloom-forming cyanobacterium Microcystis aeruginosa. J. Plankton Res. 2004, 8, 963–966. [Google Scholar] [CrossRef]
- Lesser, M.P. Effects of ultraviolet radiation on productivity and nitrogen fixation in the Cyanobacterium, Anabaena sp. (Newton’s strain). Hydrobiology 2008, 598, 1–9. [Google Scholar] [CrossRef]
- Klisch, M.; Häder, D.P. Mycsoporine-like amino acids and marine toxins—The common and the different. Mar. Drugs 2008, 6, 147–163. [Google Scholar] [CrossRef] [PubMed]
- Carreto, J.I.; Carignan, M.O.; Daleo, G.; De Marco, S.G. Occurrence of mycosporine-like amino acids in the red tide dinoflagellate Alexandrium excavatum: UV-photoprotective compounds? J. Plankton Res. 1990, 12, 909–921. [Google Scholar] [CrossRef]
- Sinha, R.P.; Klish, M.; Helbling, E.W.; Häder, D.P. Induction of mycosporine-like amino acids (MAAs) in cyanobacteria by solar ultraviolet-B radiation. J. Photochem. Photobiol. B 2001, 60, 129–135. [Google Scholar] [CrossRef]
- Shick, J.M.; Dunlap, W.C. Mycosporine-like amino acids and related gadusols: Biosynthesis, accumulation, and UV-protective functions in aquatic organisms. Annu. Rev. Physiol. 2002, 64, 223–262. [Google Scholar] [CrossRef] [PubMed]
- Zudaire, L.; Roy, S. Photoprotection and long-term acclimation to UV radiation in the marine diatom Thalassiosira weissflogii. J. Photochem. Photobiol. B Biol. 2001, 62, 26–34. [Google Scholar] [CrossRef]
- Singh, S.P.; Kumari, S.; Rastogi, R.P.; Singh, K.L.; Sinha, R.P. Mycosporine-like amino acids (MAAs): Chermical structure, biosynthesis and significance as UV-absorbing/screening compounds. Ind. J. Exp. Biol. 2008, 46, 7–17. [Google Scholar]
- Moisan, T.A.; Mitchell, B.G. UV absorption by mycosporine-like amino acids in Phaeocystis antarctica Karsten induced by photosynthetically available radiation. Mar. Biol. 2001, 138, 217–227. [Google Scholar] [CrossRef]
- Korbee, N.; Mata, M.; Figueroa, F. Photoprotection mechanisms against ultraviolet radiation in Heterocapsa sp. (Dinophyceae) are influenced by nitrogen availability: Mycosporine-like amino acids vs. xanthophyll cycle. Limnol. Oceanogr. 2010, 55, 899–908. [Google Scholar] [CrossRef]
- Ha, S.Y.; Kang, S.W.; Park, M.O.; Kim, Y.N.; Kang, S.H.; Shin, K.H. Photoinduction of UV-absorbing comppounds and photo-protctive pigment in Phaeocystis pouchetii and Porosira glacialis by UV exposure. Ocean Polar Res. 2010, 32, 397–409. [Google Scholar] [CrossRef]
- Archer, S.; Cummings, D.; Llewellyn, C.; Fishwick, J. Phytoplankton taxa, irradiance and nutrient availability determine the seasonal cycle of DMSP in temperate shelf seas. Mar. Ecol. Prog. Ser. 2009, 394, 111–124. [Google Scholar] [CrossRef]
- Bonomi-Barufi, J.; Korbee, N.; Oliveira, M.; Figueroa, F.L. Effects of N supply on the accumulation of photosynthetic pigments and photoprotectors in Gracilaria tenuistipitata (Phodophyta) cultured under N limitation. J. Appl. Phycol. 2011, 23, 457–466. [Google Scholar] [CrossRef]
- Navarro, N.P.; Figueroa, F.L.; Korbee, N.; Mansilla, A.; Matsuhiro, B.; Barahona, T.; Plastino, E.M. The effects of NO3(-) supply on Mazzaella laminarioides (Rhodophyta, Gigartinales) from southern Chile. Photochem. Photobiol. 2014, 90, 1299–1307. [Google Scholar] [CrossRef] [PubMed] [Green Version]
- Korbee, N.; Huovinen, P.; Figueroa, H.L.; Aguilera, J.; Karsten, U. Availability of ammonium influences photosynthesis and the accumulation of mycosporine-like amino acids in two Porphyra species (Bangiales Rhodophyta). Mar. Biol. 2005, 146, 645–654. [Google Scholar] [CrossRef]
- Korbee-Peinado, N.; Abdala-Díaz, R.; Figueroa, F.L. Ammonium and UV radiation stimulate the accumulation of mycosporine-like amino acids vs. xanthophyll cycle. Limnol. Oceanogr. 2010, 55, 899–908. [Google Scholar] [CrossRef]
- Klisch, M.; Häder, D.P. Wavelength dependence of mycosporine-like amino acid synthesis in Gyrodinium dorsum. J. Photochem. Photobiol. B Biol. 2002, 66, 60–66. [Google Scholar] [CrossRef]
- Karsten, U.; Franklin, L.A.; Lüning, K.; Wiencke, C. Natural ultraviolet radiation and photosynthetically active radiation induce formation of mycosporine-like amino acids in the marine macroalga Chondrus crispus (Rhodophyta). Planta 1998, 205, 257–262. [Google Scholar] [CrossRef]
- Portwich, A.; Garcia-Pichel, F. A novel prokaryotic UVB photoreceptor in the cyanobacterium Chlorogloeopsis PCC 6912. Photochem. Photobiol. 2000, 71, 493–498. [Google Scholar] [CrossRef]
- Kräbs, G.; Watanabe, M.; Wiencke, C. A monochromatic action spectrum for the photoinduction of the UV-absorbing mycosporine-like amino acids shinorine in the red alga Chondrus crispus. Photochem. Photobiol. 2004, 79, 515–519. [Google Scholar] [CrossRef] [PubMed]
© 2015 by the authors; licensee MDPI, Basel, Switzerland. This article is an open access article distributed under the terms and conditions of the Creative Commons Attribution license (http://creativecommons.org/licenses/by/4.0/).
Share and Cite
Ha, S.-Y.; Lee, Y.; Kim, M.-S.; Kumar, K.S.; Shin, K.-H. Seasonal Changes in Mycosporine-Like Amino Acid Production Rate with Respect to Natural Phytoplankton Species Composition. Mar. Drugs 2015, 13, 6740-6758. https://doi.org/10.3390/md13116740
Ha S-Y, Lee Y, Kim M-S, Kumar KS, Shin K-H. Seasonal Changes in Mycosporine-Like Amino Acid Production Rate with Respect to Natural Phytoplankton Species Composition. Marine Drugs. 2015; 13(11):6740-6758. https://doi.org/10.3390/md13116740
Chicago/Turabian StyleHa, Sun-Yong, Yeonjung Lee, Min-Seob Kim, K. Suresh Kumar, and Kyung-Hoon Shin. 2015. "Seasonal Changes in Mycosporine-Like Amino Acid Production Rate with Respect to Natural Phytoplankton Species Composition" Marine Drugs 13, no. 11: 6740-6758. https://doi.org/10.3390/md13116740