
Characterization of Shrimp Oil from Pandalus borealis by High Performance Liquid Chromatography and High Resolution Mass Spectrometry


Abstract
:
1. Introduction
2. Results
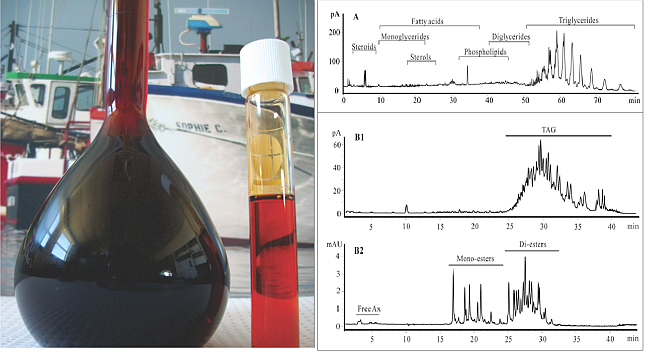
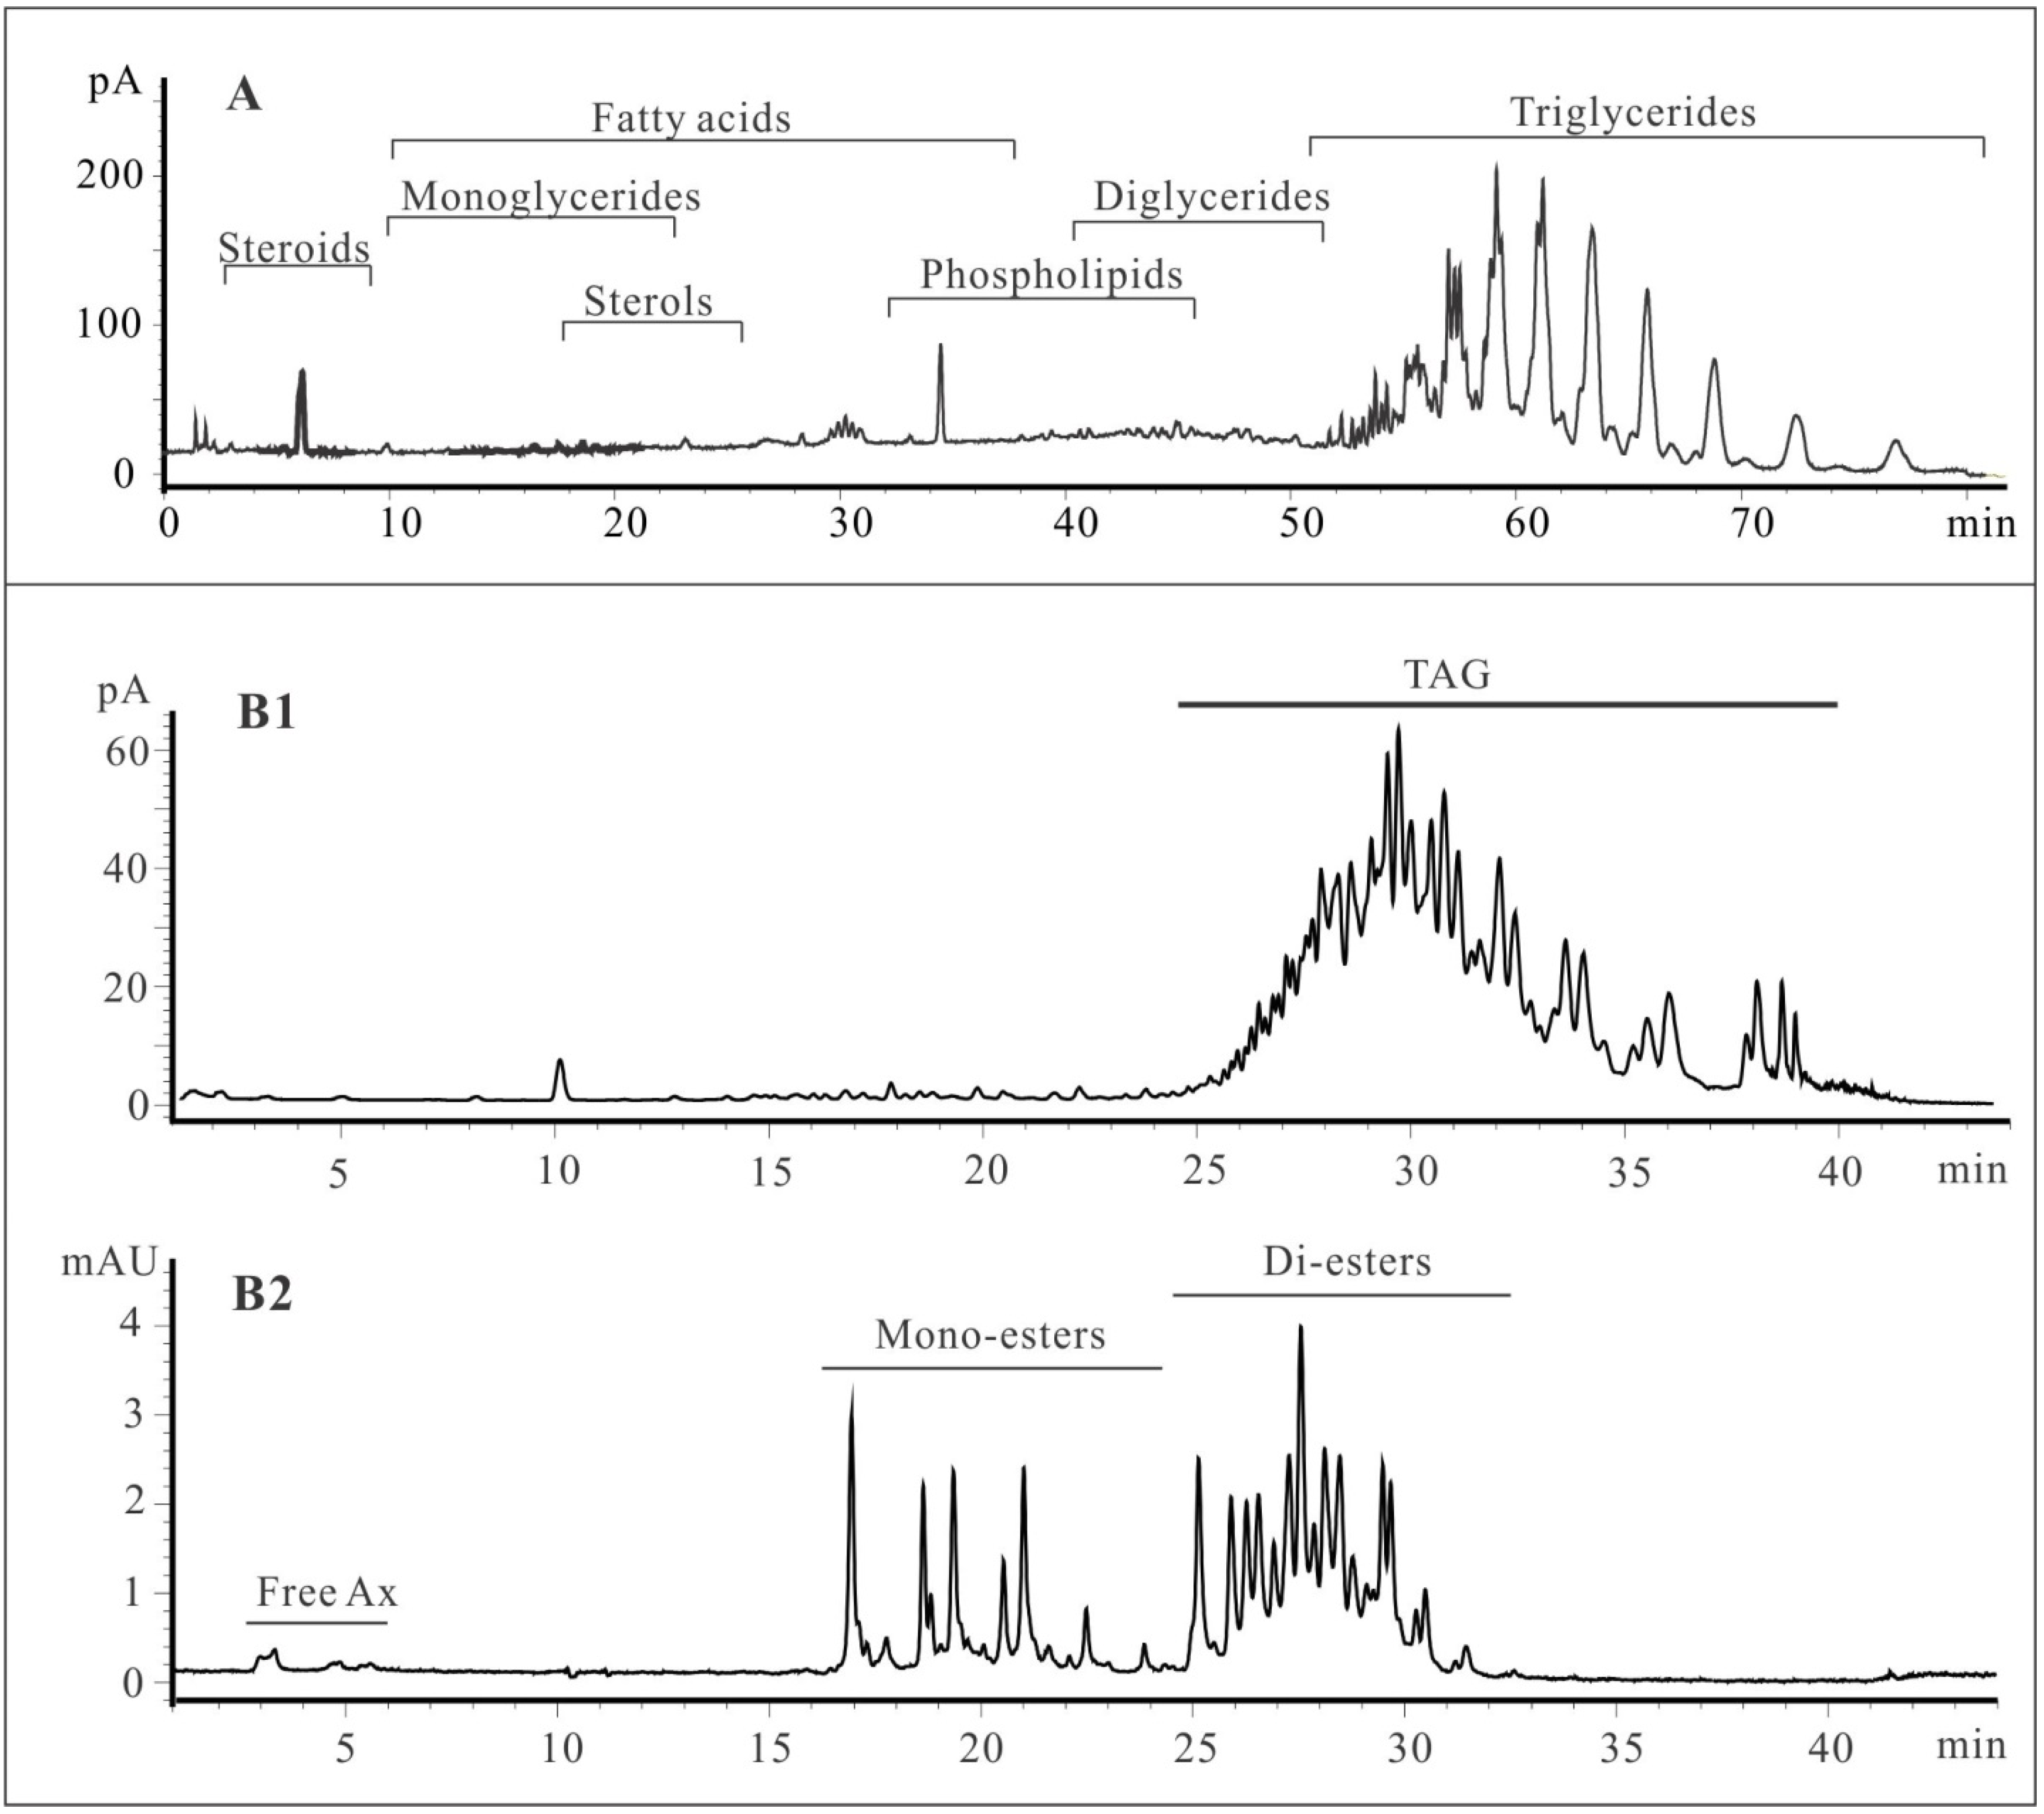
2.1. Lipid Classification of Shrimp Oil by HPLC-CAD

2.2. Fatty Acid Methylated Esters (FAMEs) Analysis by GC

| FAME | P. borealis Shrimp Oil | P. borealis Whole Shrimp [22] | Krill Oil [23] | ||
|---|---|---|---|---|---|
| Intensity | RSD% (n = 4) | Original Oil | TAG Rich Fraction | ||
| 12:0 | 0.2% | 30.8 | 0.1% ± 0.0% | 0.2% ± 0.0% | |
| 13:0 | Trace | ||||
| 14:0 | 3.6% | 19.1 | 2.3% | 1.1% ± 0.0% | 17.5% ± 0.2% |
| 15:0 | 0.3% | 15.9 | 0.4% ± 0.0% | 0.4% ± 0.0% | |
| 16:0 | 12.5% | 2.1 | 14.9% | 24.0% ± 0.1% | 18.9% ± 0.2% |
| 17:0 | 0.2% | 32.9 | 0.2% ± 0.0% | 0.2% ± 0.0% | |
| 18:0 | 2.9% | 17.5 | 2.9% | 1.0% ± 0.0% | 0.8% ± 0.0% |
| 20:0 | Trace | 0.1% ± 0.0% | 0.1% ± 0.0% | ||
| 22:0 | Trace | ||||
| 14:1n5 | 0.2% | 17.3 | |||
| 16:1n5 | 0.4% | 22.5 | |||
| 16:1n7 | 12.5% | 13.2 | 14.5% | 5.5% ± 0.0% | 9.2% ± 0.2% |
| 17:1n7 | Trace | ||||
| 18:1n5 | 0.7% | 15.0 | |||
| 18:1n7 | 4.3% | 10.8 | 7.7% | 6.6% ± 0.1% | 6.3% ± 0.1% |
| 18:1n9 | 12.9% | 7.3 | 12.3% | 10.0% ± 0.0% | 10.9% ± 0.1% |
| 20:1n7 | 1.7% | 49.3 | 0.2% ± 0.0% | 0.2% ± 0.0% | |
| 20:1n9 | 6.3% | 36.7 | 2.7% | 0.6% ± 0.0% | 0.5% ± 0.0% |
| 20:1n11 | 0.8% | - | |||
| 22:1n7 | 2.4% | 56.2 | |||
| 22:1n9 | 7.7% | 39.0 | 1.3% | 0.6% ± 0.0% | 0.3% ± 0.0% |
| 24:1n9 | Trace | 0.1% ± 0.0% | |||
| 16:2n4 | 0.5% | 53.3 | 0.5% ± 0.0% | 1.1% ± 0.0% | |
| 16:2n6 | 0.3% | 81.5 | |||
| 16:3n3 | 0.2% | 16.7 | 0.1% ± 0.0% | 2.5% ± 0.0% | |
| 16:3n4 | 0.4% | 37.1 | |||
| 16:4n1 | 0.3% | 4.9 | |||
| 16:4n3 | Trace | 0.8% ± 0.0% | |||
| 18:2n4 | 0.4% | 28.3 | |||
| 18:2n6 | 0.8% | 8.4 | 0.6% | 1.7% ± 0.0% | 1.7% ± 0.0% |
| 18:3n3 | 0.6% | 44.0 | Trace | 1.3% ± 0.0% | 1.4% ± 0.0% |
| 18:3n4 | 0.7% | - | |||
| 18:3n6 | Trace | 0.2% ± 0.0% | 0.3% ± 0.0% | ||
| 18:4n1 | Trace | ||||
| 18:4n3 | 1.1% | 8.2 | 0.5% | 3.8% ± 0.1% | 6.8% ± 0.1% |
| 20:2n6 | 0.3% | 38.8 | |||
| 20:2n9 | Trace | ||||
| 20:3n3 | 0.2% | 73.5 | |||
| 20:3n6 | Trace | 0.0% ± 0.0% | |||
| 20:4n3 | 2.4% | - | Trace | 0.4% ± 0.0% | 0.3% ± 0.0% |
| 20:4n6 | 0.4% | 34.2 | 0.4% ± 0.0% | 0.3% ± 0.0% | |
| 20:5n3 | 10.4% | 11.3 | 12.5% | 18.5% ± 0.2% | 9.7% ± 0.0% |
| 21:5n3 | 0.3% | 23.0 | 0.6% ± 0.0% | 0.3% ± 0.0% | |
| 22:2 | Trace | ||||
| 22:4n6 | Trace | ||||
| 22:5n3 | 0.5% | 7.2 | 1.0% | 0.4% ± 0.0% | 0.2% ± 0.0% |
| 22:5n6 | Trace | 0.0% ± 0.0% | |||
| 22:6n3 | 9.5% | 7.1 | 7.7% | 9.0% ± 0.0% | 3.8% ± 0.0% |
| Total | 98.8% | 0.00 | |||
| Saturated (SFAs) | 19.7% | 3.4 | 21.4% | 38.1% ± 0.0% | 43.4% ± 0.0% |
| Monounsaturated (MUFAs) | 49.9% | 8.8 | 46.0% | 24.0% ± 0.2% | 27.9% ± 0.1% |
| Polyunsaturated (PUFAs) | 29.2% | 16.1 | 25.3% | 37.9% ± 0.2% | 28.8% ± 0.1% |
| Omega-3 | 25.2% | 18.9 | 21.7% | 35.0% ± 0.2% | 25.2% ± 0.1% |
| Omega-6 | 1.7% | 17.7 | 0.6% | 2.3% ± 0.0% | 2.3% ± 0.0% |
2.3. Characterization of TAGs in Shrimp Oil
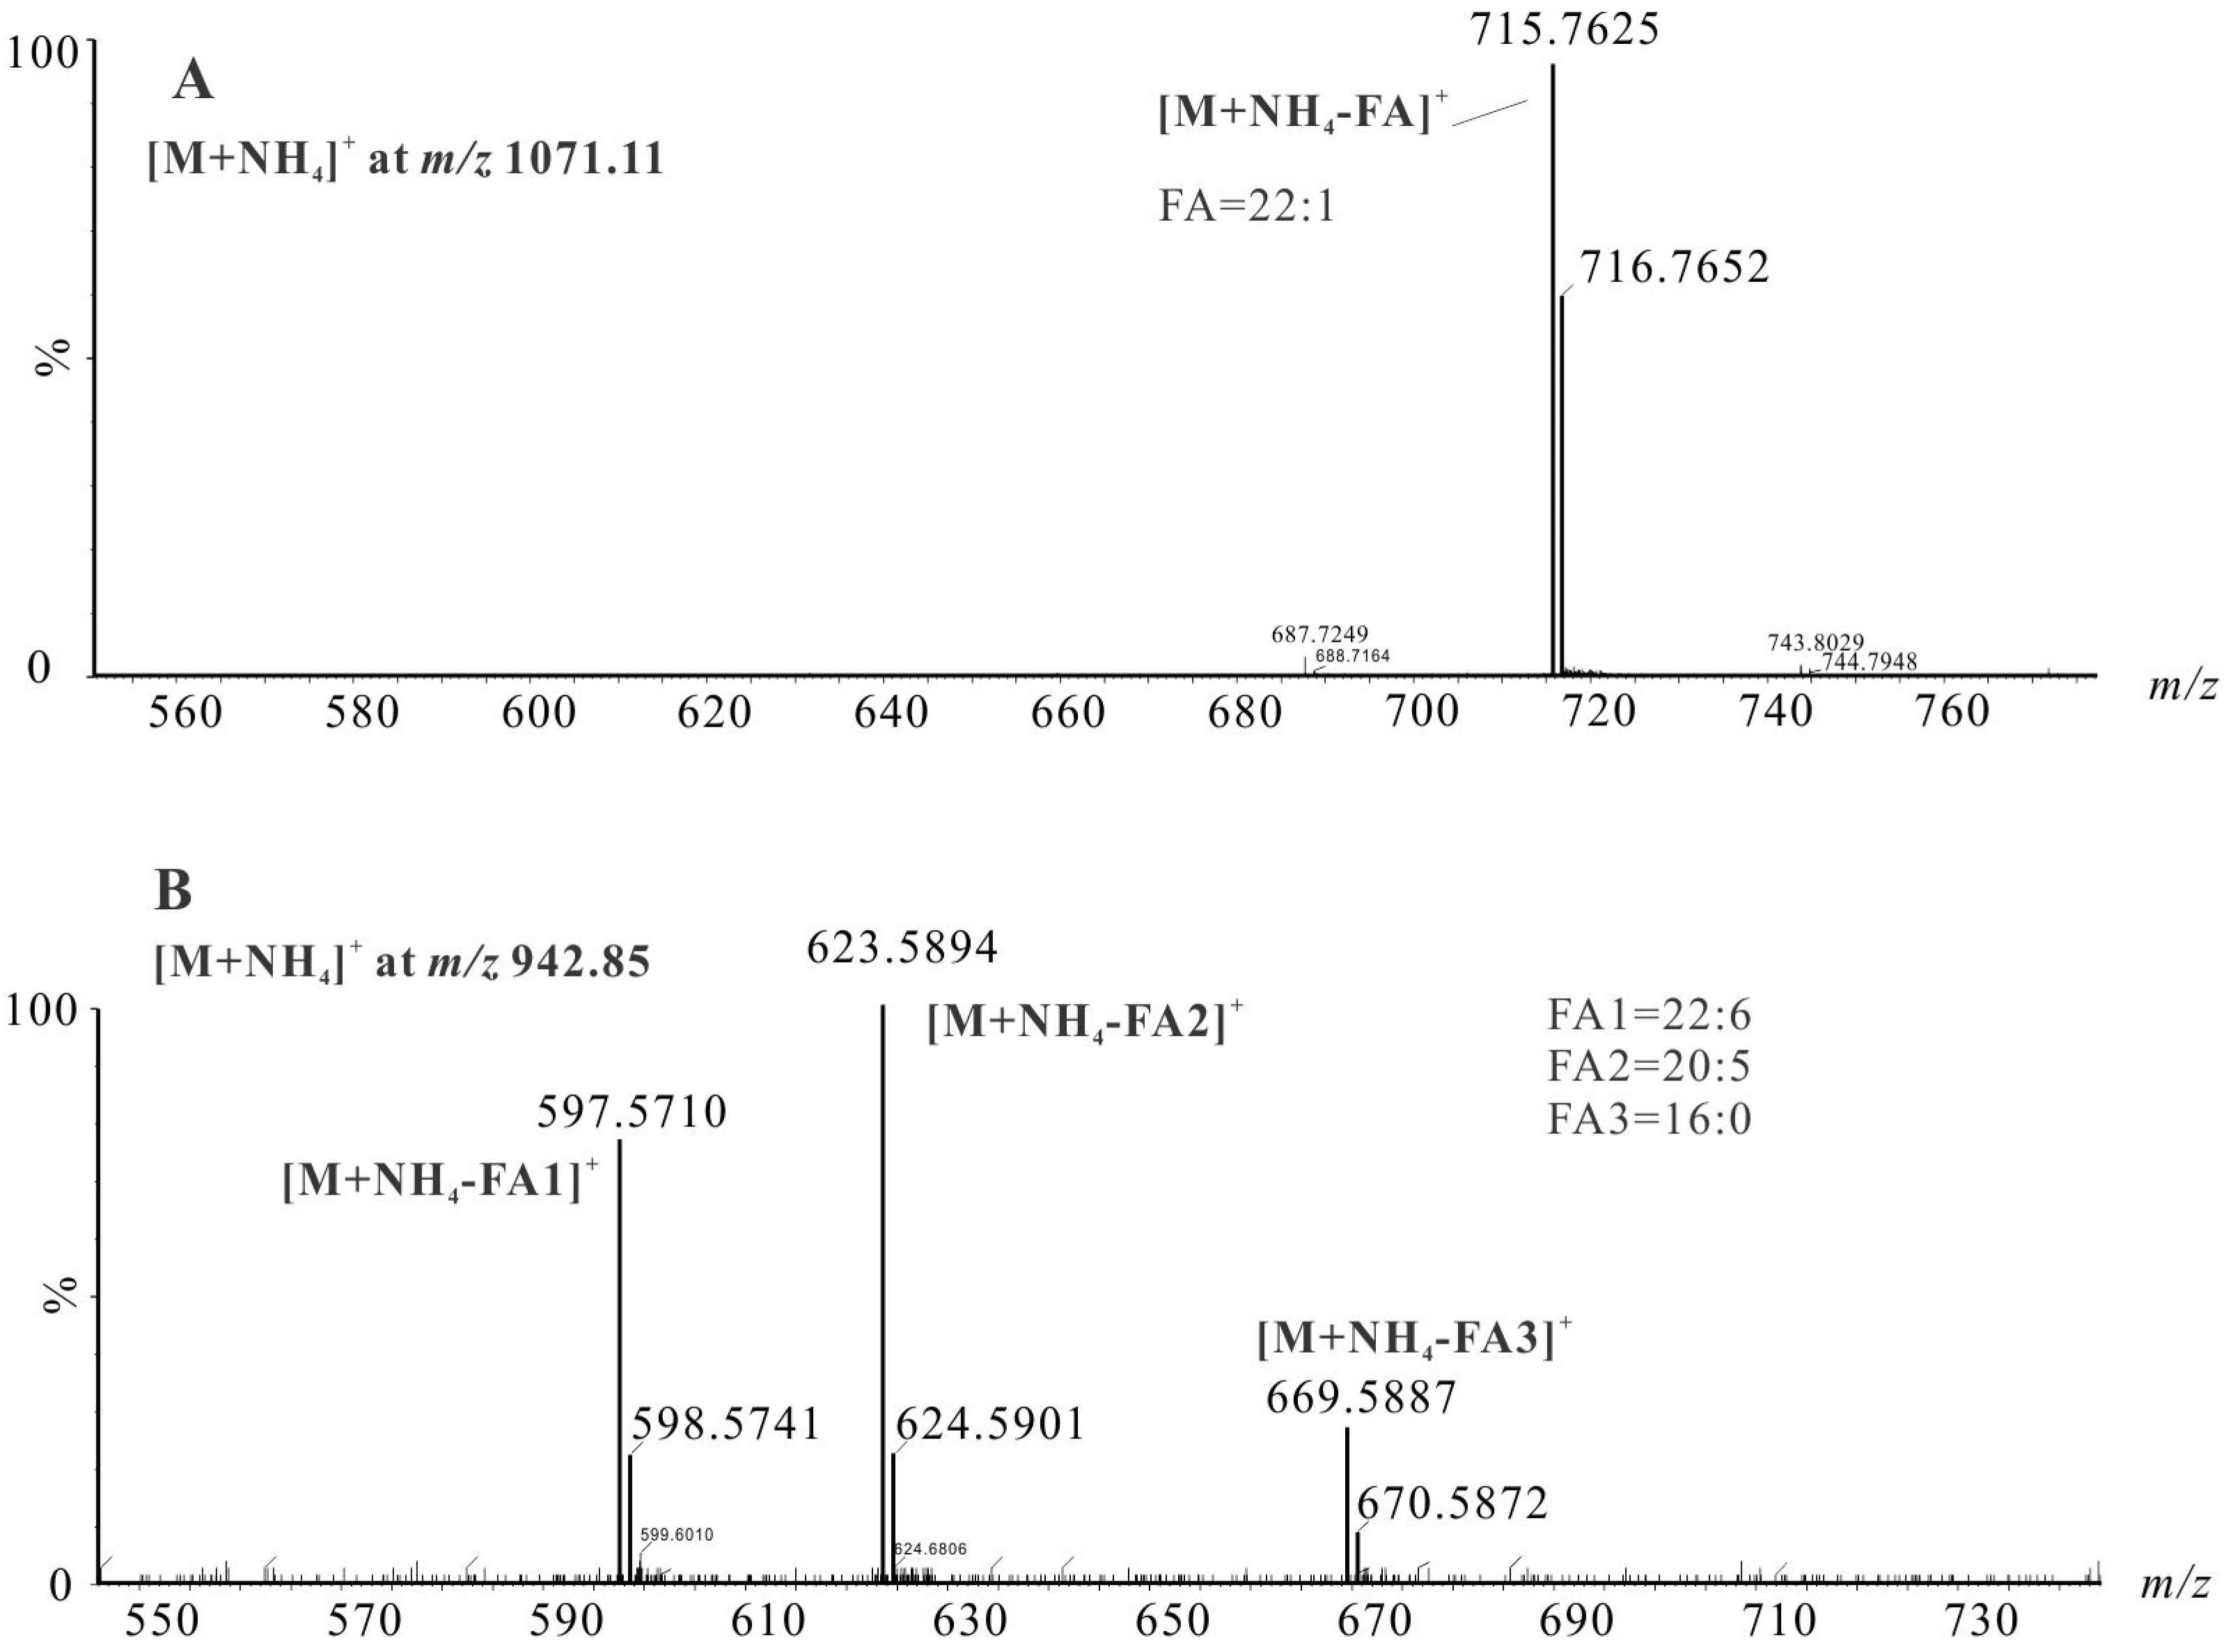
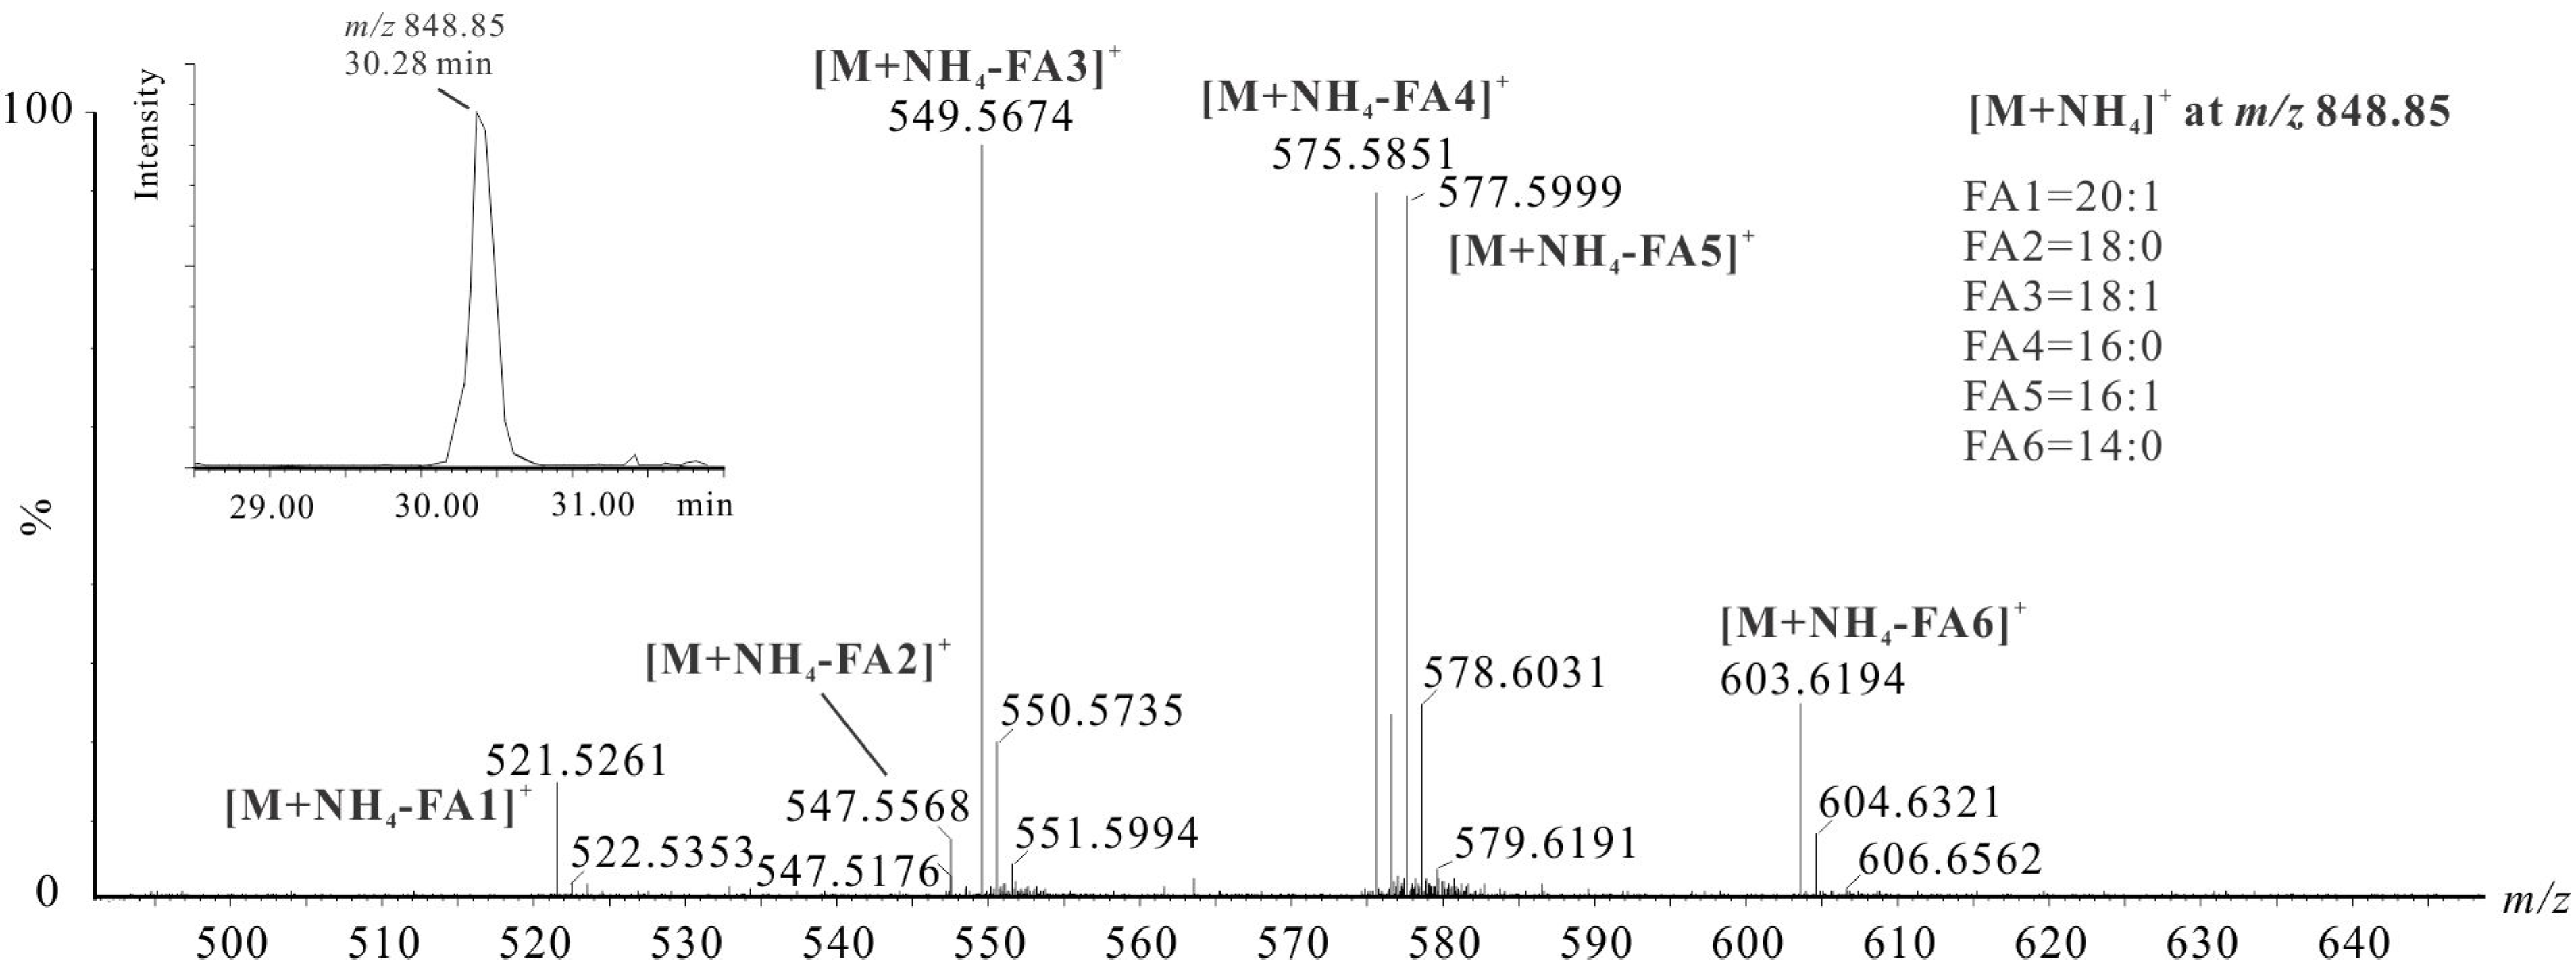
2.3.1. Identification of TAGs Species by LC-HRMS


| No. | Molecular Formula | RT (min) | Calculated m/z [M + NH4]+ | Observed [M + NH4]+ | C:DB | Intensity (%) | TAG Identity | |
|---|---|---|---|---|---|---|---|---|
| Major Composition | Other Composition | |||||||
| 1 | C49H90O6 | 27.79 | 792.7076 | 792.7081 | TAG(46:2) | 1.4 | TAG(14:0/16:1/16:1) | TAG(12:0/16:1/18:1) |
| 2 | C49H92O6 | 28.70 | 794.7232 | 794.7256 | TAG(46:1) | 3.2 | TAG(14:0/16:0/16:1) | TAG(14:0/14:0/18:1), TAG(12:0/16:0/18:1) |
| 3 | C51H92O6 | 28.31 | 818.7232 | 818.7220 | TAG(48:3) | 2.5 | TAG(16:1/16:1/16:1) | TAG(14:1/16:1/18:1) |
| 4 | C51H94O6 | 29.13 | 820.7389 | 820.7413 | TAG(48:2) | 6.4 | TAG(16:0/16:1/16:1) | TAG(14:0/16:1/18:1) |
| 5 | C51H96O6 | 29.90 | 822.7545 | 822.7618 | TAG(48:1) | 1.3 | TAG(16:0/16:0/16:1) | TAG(14:0/16:0/18:1) |
| 6 | C53H90O6 | 27.40 | 840.7053 | 840.7105 | TAG(50:6) | 1.4 | TAG(14:0/16:1/20:5) | |
| 7 | C53H96O6 | 29.54 | 846.7545 | 846.7565 | TAG(50:3) | 2.9 | TAG(16:1/16:1/18:1) | TAG(14:1/18:1/18:1), TAG(14:1/16:1/20:1) |
| 8 | C53H98O6 | 30.29 | 848.7702 | 848.7761 | TAG(50:2) | 1.6 | TAG(16:0/16:1/18:1) | TAG(14:0/16:1/20:1), TAG(14:0/18:1/18:1), TAG(16:1/16:1/18:0) |
| 9 | C53H100O6 | 31.11 | 850.7858 | 850.7929 | TAG(50:1) | 2.3 | TAG(16:0/16:0/18:1) | TAG(14:0/16:0/20:1) |
| 10 | C55H92O6 | 27.89 | 866.7232 | 866.7246 | TAG(52:7) | 2.4 | TAG(16:1/16:1/20:5) | |
| 11 | C55H94O6 | 28.70 | 868.7389 | 868.7418 | TAG(52:6) | 2.7 | TAG(16:0/16:1/20:5) | TAG(14:0/18:1/20:5) |
| 12 | C55H96O6 | 29.62 | 870.7545 | 870.7586 | TAG(52:5) | 3.0 | TAG(16:0/16:0/20:5) | TAG(14:0/18:0/20:5) |
| 13 | C55H100O6 | 30.75 | 874.7858 | 874.7930 | TAG(52:3) | 3.4 | TAG(16:1/18:1/18:1), TAG(16:1/16:1/20:1) | TAG(14:1/18:1/20:1), TAG(14:1/16:1/22:1) |
| 14 | C55H102O6 | 31.44 | 876.8015 | 876.8102 | TAG(52:2) | 1.4 | TAG(16:0/16:1/20:1), TAG(16:0/18:1/18:1) | TAG(14:0/18:1/20:1), TAG(14:0/16:1/22:1), TAG(16:1/18:0/18:1) |
| 15 | C55H104O6 | 32.24 | 878.8171 | 878.8104 | TAG(52:1) | 1.3 | TAG(16:0/18:0/18:1) | TAG(14:0/16:0/22:1), TAG(14:0/18:0/20:1), TAG(16:0/16:0/20:1) |
| 16 | C57H90O6 | 26.97 | 888.7076 | 888.7070 | TAG(54:10) | 0.6 | TAG(14:0/20:5/20:5) | |
| 17 | C57H96O6 | 29.22 | 894.7545 | 894.7576 | TAG(54:7) | 2.8 | TAG(16:1/18:1/20:5) | TAG(16:0/16:1/22:6), TAG(14:0/18:1/22:6) |
| 18 | C57H98O6 | 30.00 | 896.7702 | 896.7792 | TAG(54:6) | 4.5 | TAG(16:0/18:1/20:5) | TAG(14:0/20:1/20:5) |
| 19 | C57H104O6 | 31.88 | 902.8171 | 902.8209 | TAG(54:3) | 2.6 | TAG(16:1/18:1/20:1), TAG(18:1/18:1/18:1) | TAG(16:1/16:1/22:1), TAG(14:1/20:1/20:1), TAG(14:1/18:1/22:1) |
| 20 | C57H106O6 | 32.57 | 904.8328 | 904.8364 | TAG(54:2) | 2.3 | TAG(16:0/18:1/20:1) | TAG(14:0/20:1/20:1), TAG(16:0/16:1/22:1), TAG(14:0/18:1/22:1), TAG(16:1/18:0/20:1), TAG(18:0/18:1/18:1) |
| 21 | C59H92O6 | 27.41 | 914.7232 | 914.7269 | TAG(56:11) | 1.6 | TAG(16:1/20:5/20:5) | TAG(16:1/18:4/22:6) |
| 22 | C59H98O6 | 29.75 | 920.7702 | 920.7770 | TAG(56:8) | 2.2 | TAG(16:1/18:1/22:6) | |
| 23 | C59H100O6 | 30.37 | 922.7858 | 922.7889 | TAG(56:7) | 2.3 | TAG(18:1/18:1/20:5) | TAG(16:0/18:1/22:6), TAG(16:1/20:1/20:5) |
| 24 | C59H102O6 | 31.22 | 924.8015 | 924.8085 | TAG(56:6) | 3.5 | TAG(16:0/20:1/20:5) | TAG(18:0/18:1/20:5), TAG(18:1/18:4/20:1) |
| 25 | C59H108O6 | 32.93 | 930.8484 | 930.8499 | TAG(56:3) | 2.5 | TAG(16:1/18:1/22:1), TAG(16:1/20:1/20:1), TAG(18:1/18:1/20:1) | TAG(14:1/20:1/22:1), TAG(14:1/18:1/24:1) |
| 26 | C59H110O6 | 33.59 | 932.8641 | 932.8682 | TAG(56:2) | 2.6 | TAG(16:0/18:1/22:1), TAG(16:0/20:1/20:1) | TAG(14:0/20:1/22:1), TAG(16:1/18:0/22:1), TAG(18:0/18:1/20:1) |
| 27 | C61H94O6 | 28.06 | 940.7389 | 940.7376 | TAG(58:12) | 1.0 | TAG(16:1/20:5/22:6) | |
| 28 | C61H96O6 | 28.96 | 942.7545 | 942.7576 | TAG(58:11) | 1.7 | TAG(16:0/20:5/22:6) | |
| 29 | C61H102O6 | 30.99 | 948.8015 | 948.8088 | TAG(58:8) | 3.3 | TAG(18:1/18:1/22:6) | TAG(16:1/20:1/22:6) |
| 30 | C61H104O6 | 31.53 | 950.8171 | 950.8204 | TAG(58:7) | 1.9 | TAG(16:1/20:5/22:1) | TAG(18:1/20:1/20:5) |
| 31 | C61H106O6 | 32.30 | 952.8328 | 952.8352 | TAG(58:6) | 2.4 | TAG(16:0/20:5/22:1) | TAG(18:0/20:1/20:5) |
| 32 | C61H114O6 | 34.57 | 960.8954 | 960.8954 | TAG(58:2) | 2.6 | TAG(16:0/20:1/22:1) | TAG(14:0/20:1/24:1), TAG(14:0/22:1/22:1), TAG(16:0/18:1/24:1), TAG(18:0/18:1/22:1), TAG(18:0/20:1/20:1) |
| 33 | C63H98O6 | 29.30 | 968.7702 | 968.7745 | TAG(60:12) | 0.9 | TAG(18:1/20:5/22:6) | |
| 34 | C63H106O6 | 32.11 | 976.8328 | 976.8328 | TAG(60:8) | 2.9 | TAG(16:1/22:1/22:6),TAG(18:1/20:1/22:6) | |
| 35 | C63H108O6 | 32.66 | 978.8484 | 978.8484 | TAG(60:7) | 2.8 | TAG(18:1/20:5/22:1) | TAG(20:1/20:1/20:5) |
| 36 | C63H110O6 | 33.40 | 980.8641 | 980.8679 | TAG(60:6) | 0.7 | TAG(18:0/20:5/22:1) | |
| 37 | C63H116O6 | 34.85 | 986.9110 | 986.9110 | TAG(60:3) | 1.9 | TAG(16:1/22:1/22:1), TAG(18:1/20:1/22:1) | TAG(16:1/20:1/24:1), TAG(18:1/18:1/24:1), |
| 38 | C63H118O6 | 35.47 | 988.9267 | 988.9183 | TAG(60:2) | 1.4 | TAG(16:0/22:1/22:1) | TAG(16:0/20:1/24:1), TAG(14:0/22:1/24:1), TAG(18:0/20:1/22:1) |
| 39 | C65H110O6 | 33.13 | 1004.8641 | 1004.8661 | TAG(62:8) | 2.4 | TAG(18:1/22:1/22:6), TAG(20:1/20:1/22:6) | |
| 40 | C65H112O6 | 33.63 | 1006.8797 | 1006.8805 | TAG(62:7) | 1.0 | TAG(20:1/20:5/22:1) | TAG(18:1/20:5/24:1) |
| 41 | C65H120O6 | 35.74 | 1014.9423 | 1014.9392 | TAG(62:3) | 2.3 | TAG(18:1/22:1/22:1), TAG(20:1/20:1/22:1) | TAG(16:1/22:1/24:1), TAG(18:1/20:1/24:1) |
| 42 | C67H114O6 | 34.06 | 1032.8954 | 1032.8907 | TAG(64:8) | 1.3 | TAG(20:1/22:1/22:6) | |
| 43 | C67H124O6 | 36.62 | 1042.9736 | 1042.9720 | TAG(64:3) | 2.3 | TAG(20:1/20:1/24:1) | TAG(18:1/22:1/24:1), TAG(20:1/22:1/22:1) |
| 44 | C69H118O6 | 35.01 | 1060.9267 | 1060.9216 | TAG(66:8) | 1.3 | TAG(22:1/22:1/22:6) | |
| 45 | C69H128O6 | 37.41 | 1071.0049 | 1071.0076 | TAG(66:3) | 1.5 | TAG(22:1/22:1/22:1) | TAG(20:1/22:1/24:1) |

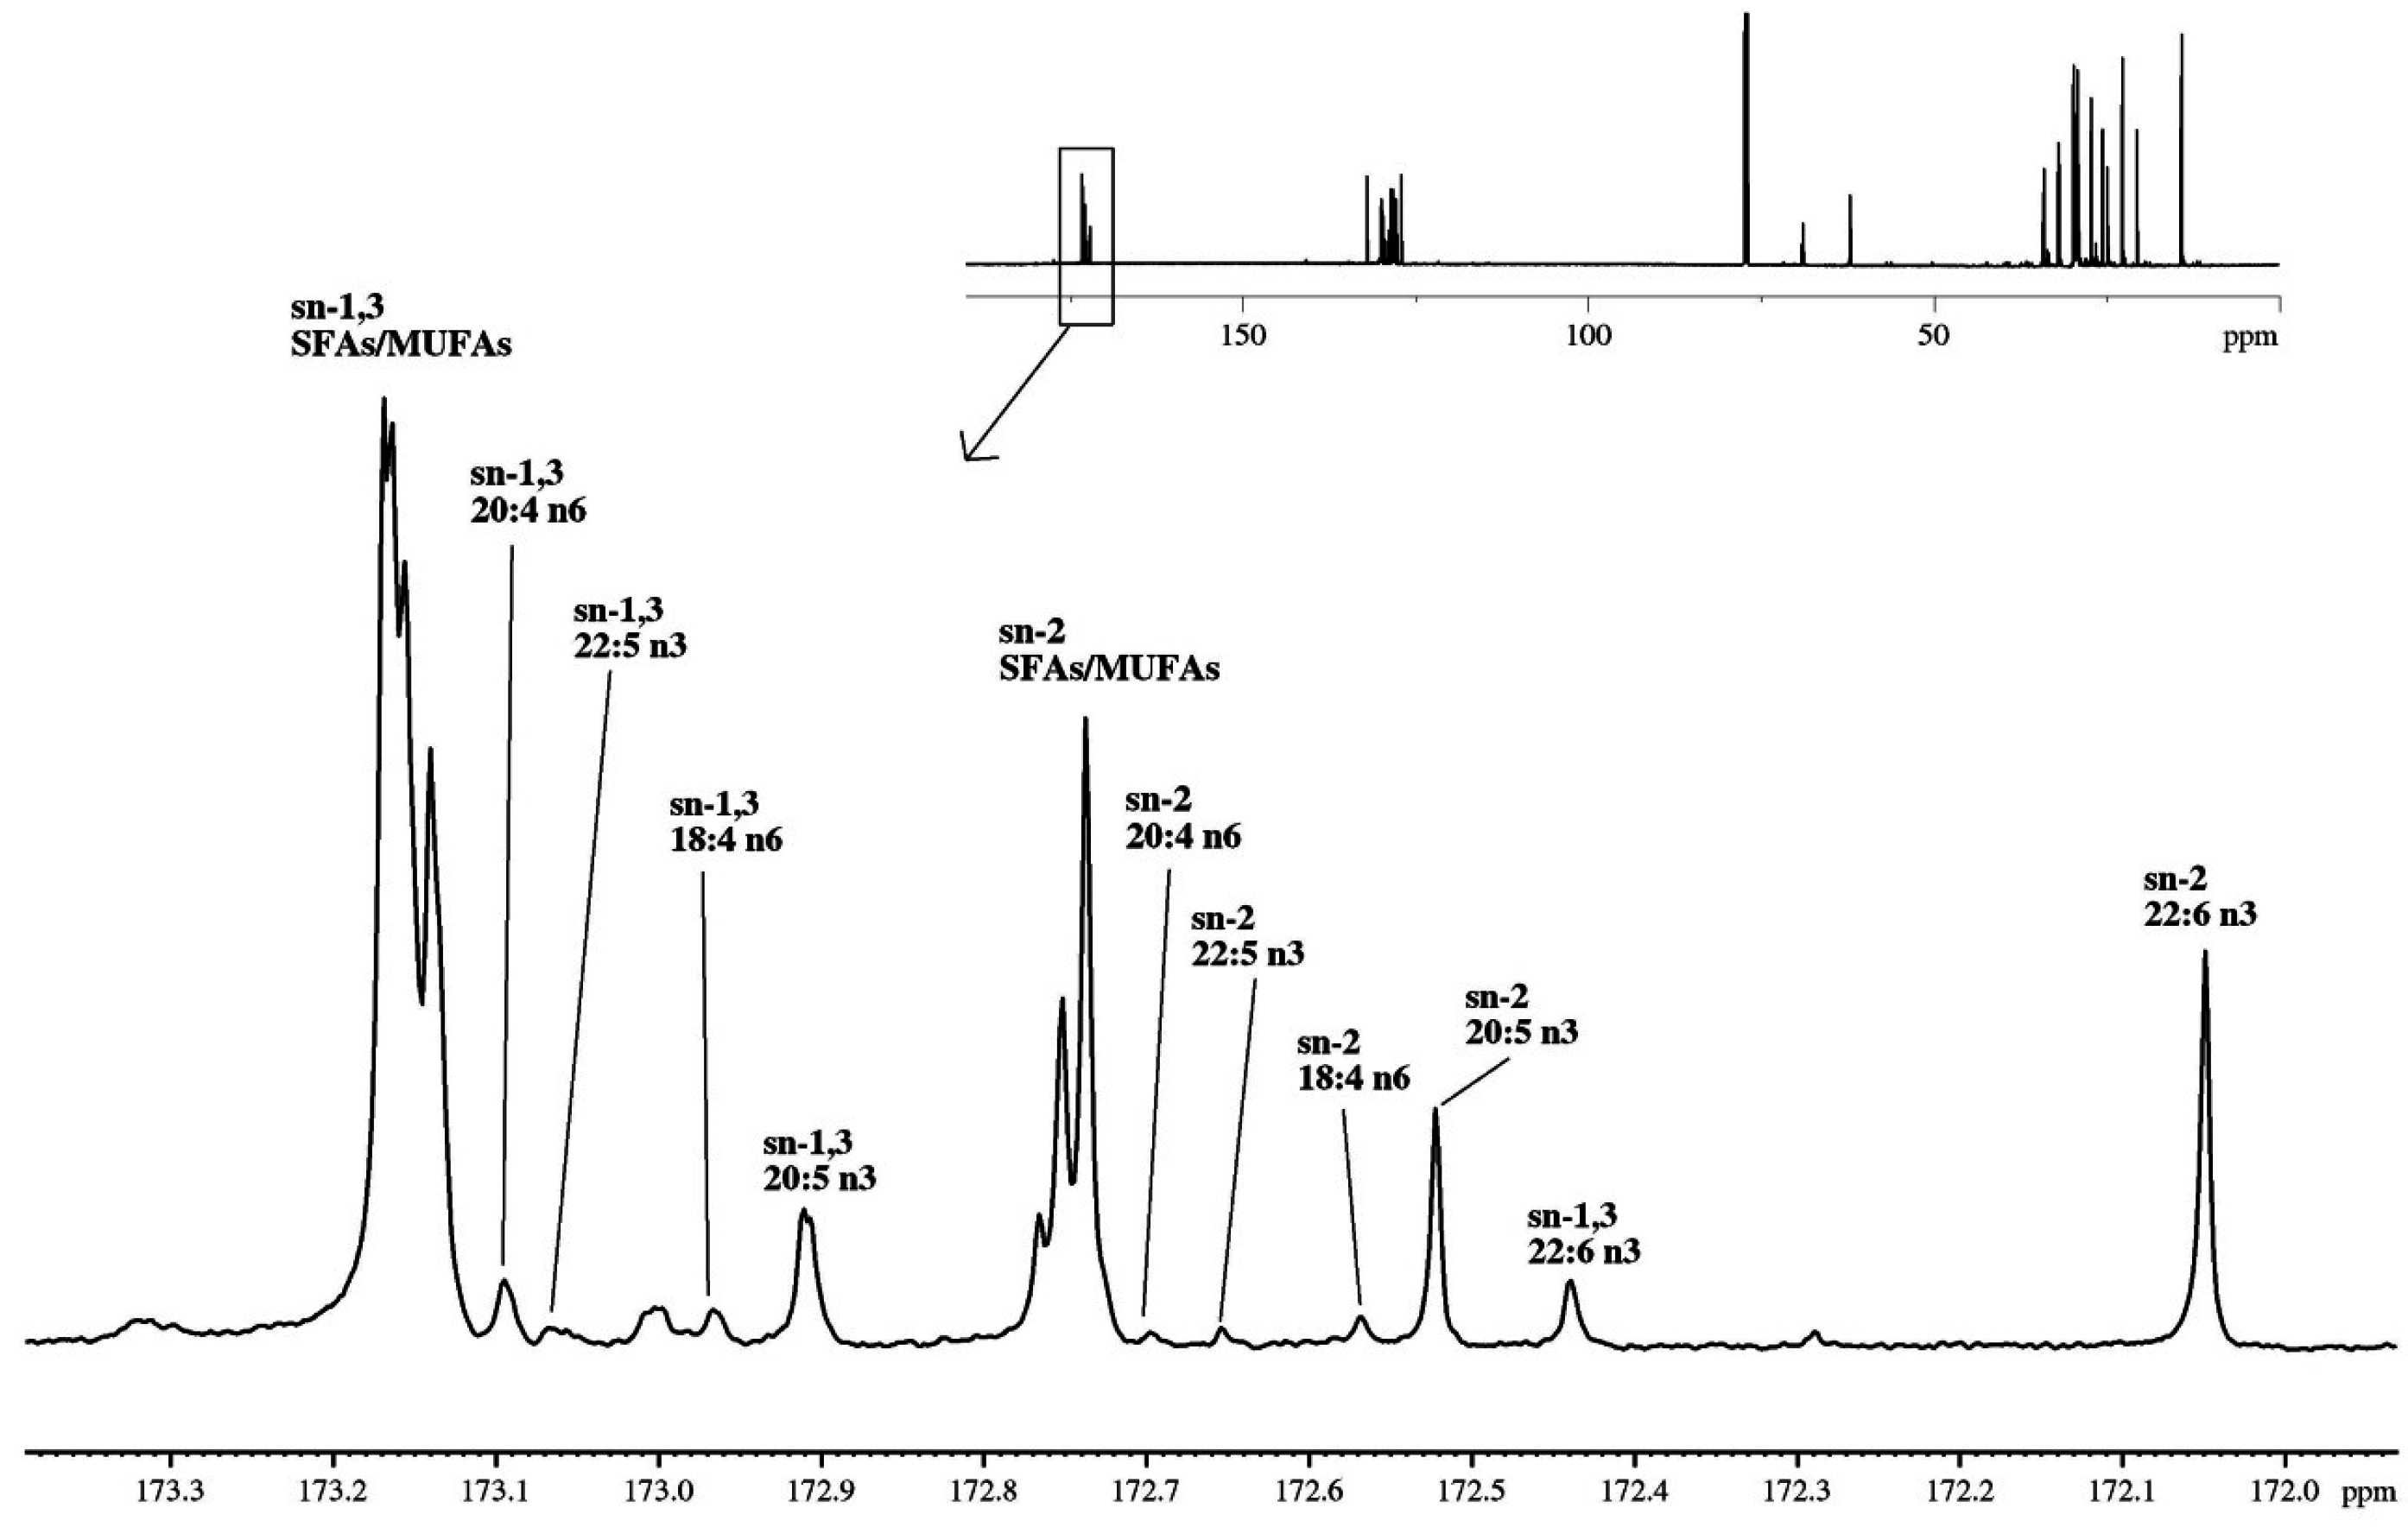
| Source | Molar (%) | sn-1,3 | sn-2 | Total |
|---|---|---|---|---|
| P. borealis Shrimp oil | SFAs + MUFAs | 56.8 | 19.2 | 75.9 |
| 20:5n3 (EPA) | 4.1 | 4.5 | 9.0 | |
| 22:6n3 (DHA) | 1.2 | 7.1 | 8.3 | |
| Omega-3 | 17.8 | |||
| Omega-6 | 2.8 | |||
| Cod liver oil [27] | EPA | 2.1 | 6.4 | 8.5 |
| DHA | 0.4 | 9.2 | 9.6 | |
| Tuna oil [28] | EPA | 6.7 | ||
| DHA | 11.5 | |||
| Algae oil [28] | DHA | 35.2 | ||
| Anchovy/sardine fish oil [25] | EPA | 80.9 | 19.1 | |
| DHA | 38.3 | 61.7 |
2.3.2. Regioisomeric Distributions of Fatty Acids on TAGs Determined by 13C-NMR
2.4. Characterization of Astaxanthin and Its Esters in Shrimp Oil
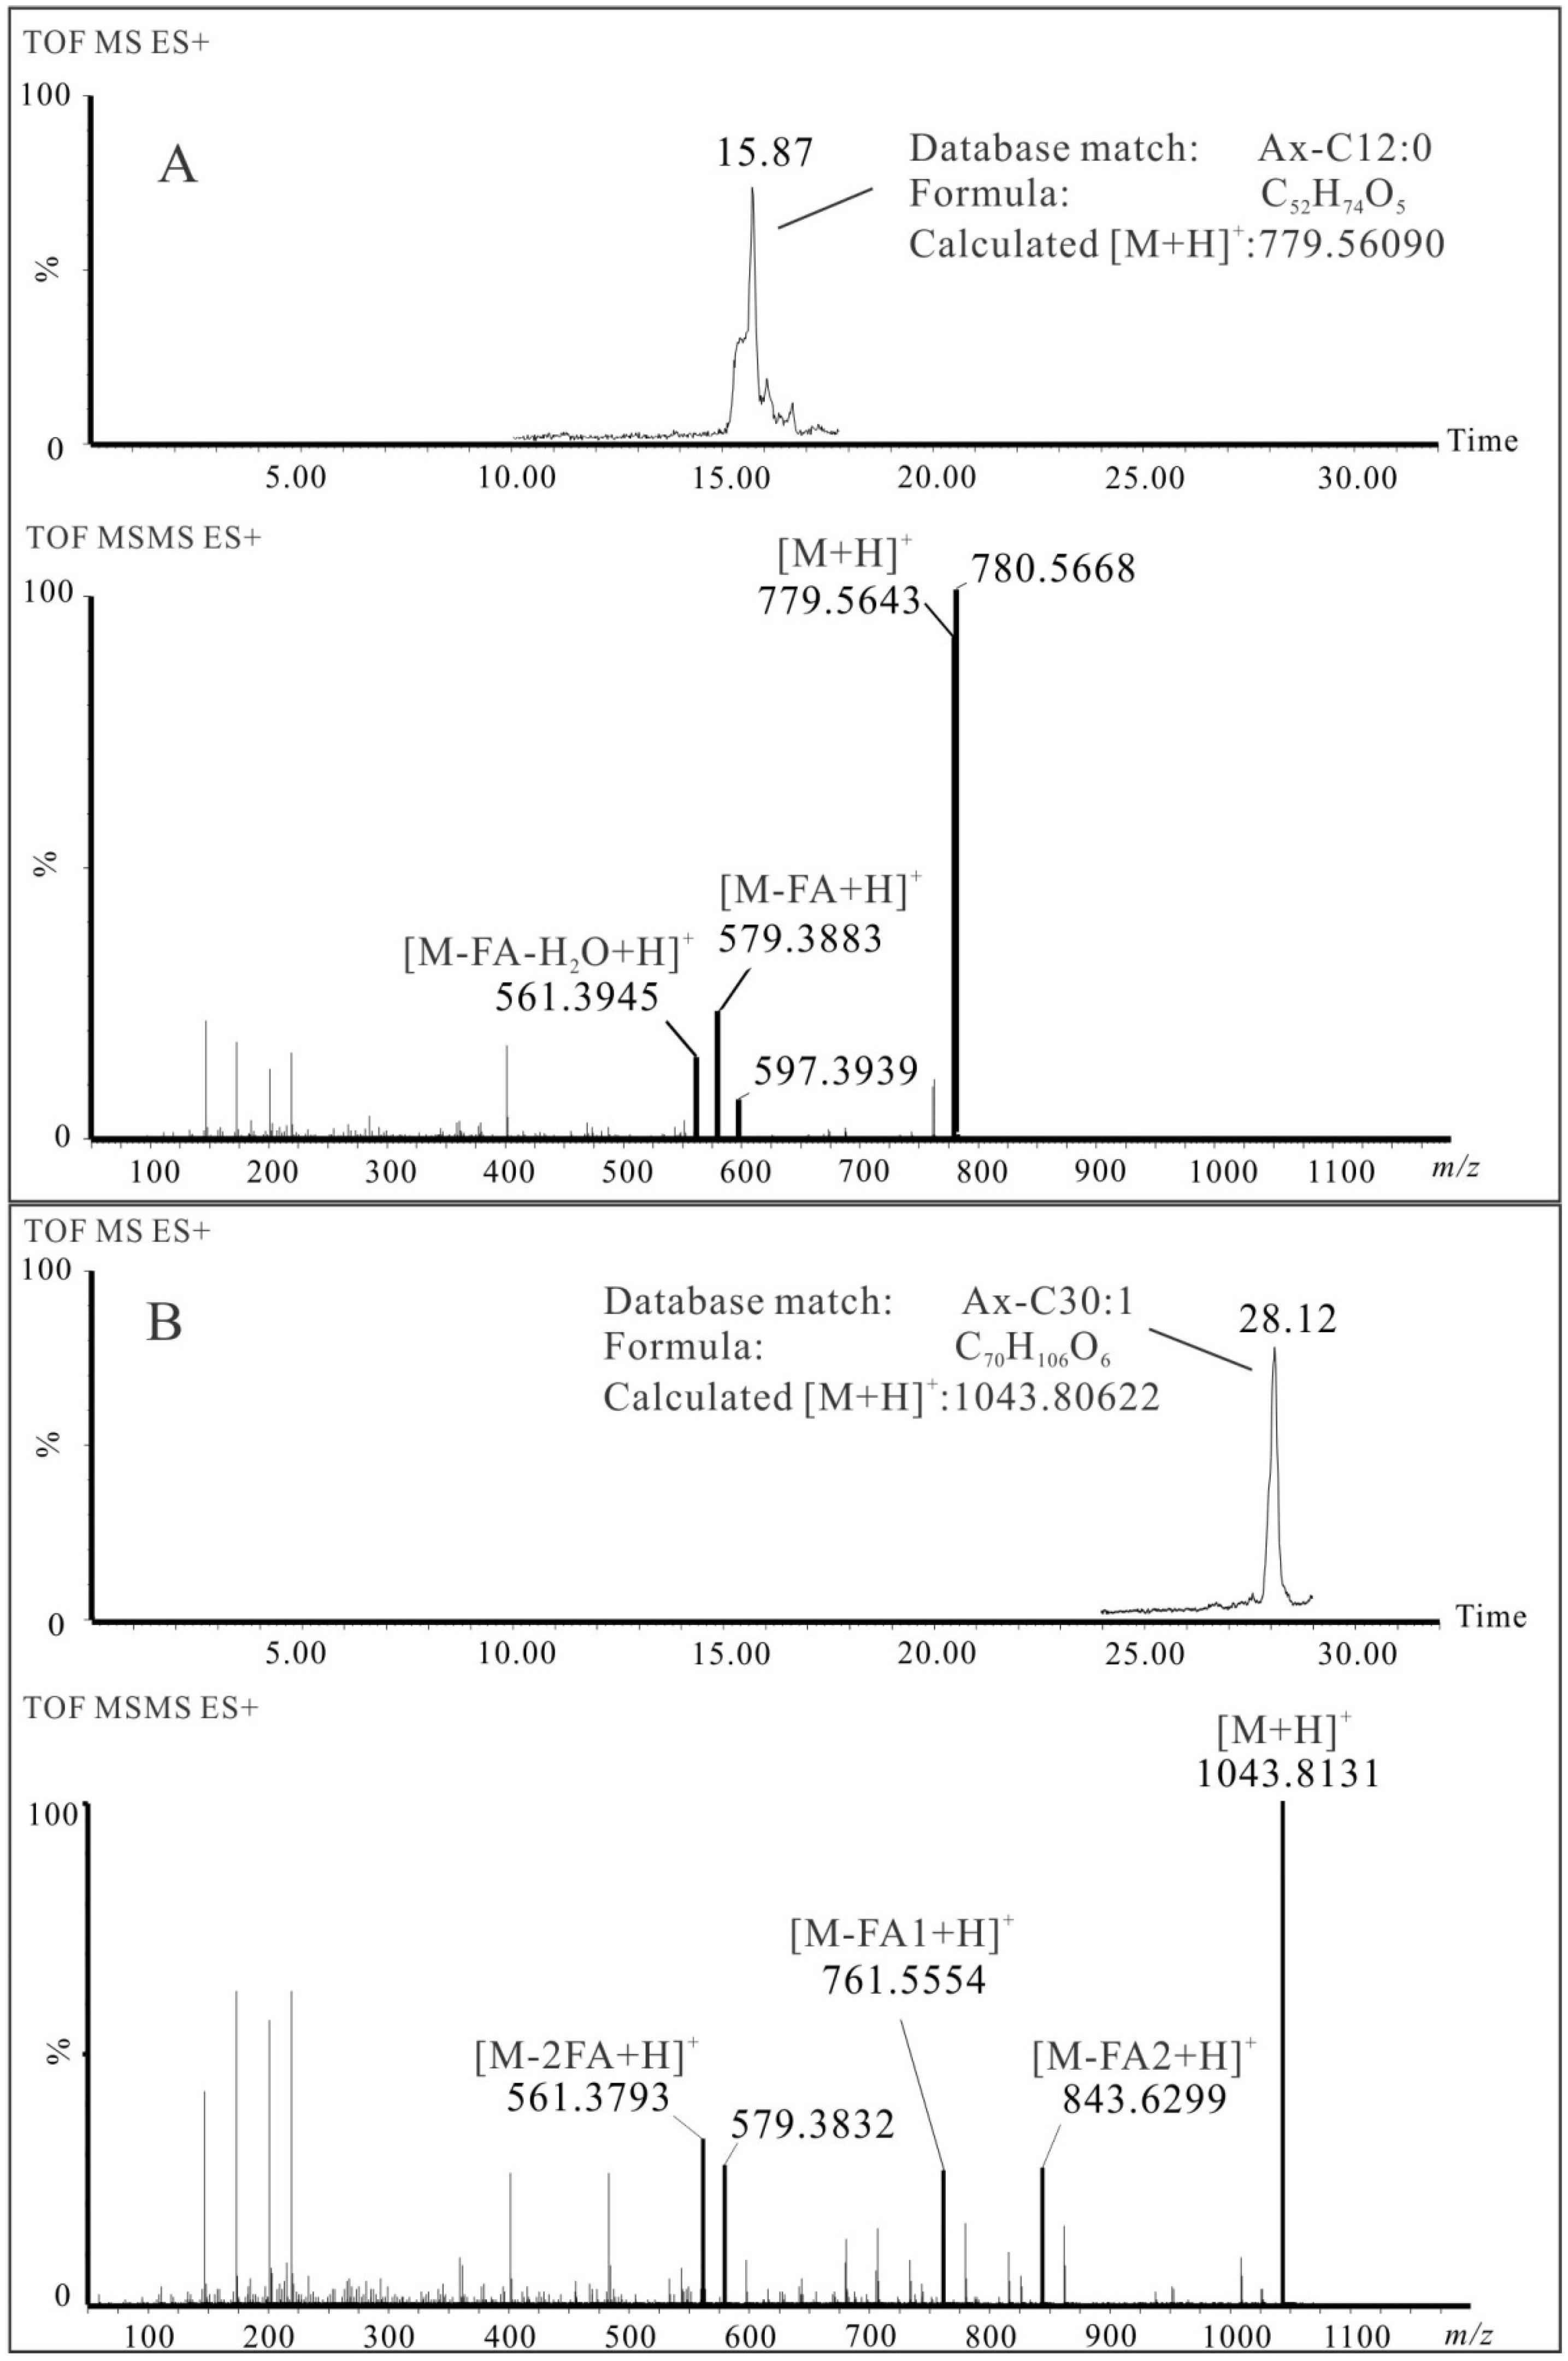
2.4.1. Identification of Astaxanthin and Its Esters by LC-HRMS


3. Discussion
3.1. Lipid Classes and FA Profiles of Shrimp Oil
| Compounds | Molecular Formula | RT (min) | Intensity (%) | Observed m/z on MS/MS | Identification by Other Reports | ||||||||
|---|---|---|---|---|---|---|---|---|---|---|---|---|---|
| [M + H]+ | [M-FA1 + H]+ | [M-FA2 + H]+ | Ax Backbone Related MS/MS | P. borealis [31] | L. vannamei [32] | Krill [33] | Microalgae [31] | ||||||
| Free Ax | |||||||||||||
| 1 | Astaxanthin | C40H52O4 | 2.10 | 0.5 | 597.3663 | 579.3843 | 561.4108 | ||||||
| 2 | Astaxanthin isomer1 | C40H52O4 | 3.56 | 0.5 | 597.3266 | 579.3949 | 561.3801 | ||||||
| 3 | Astaxanthin isomer2 | C40H52O4 | 3.85 | 0.4 | 597.3575 | 579.3616 | 561.3696 | ||||||
| Ax-FA Monoesters | |||||||||||||
| 4 | Ax-C12:0 | C52H74O5 | 15.87 | 7.3 | 779.5643 | 579.3883 | 561.3945 | ✓ | ✓ | ||||
| 5 | Ax-C20:5 | C60H80O5 | 17.78 | 5.1 | 881.6111 | 579.3793 | 561.3813 | ✓ | |||||
| 6 | Ax-C14:0 | C54H78O5 | 17.80 | 1.3 | 807.6991 | 579.4027 | 561.4552 | ✓ | ✓ | ||||
| 7 | Ax-C22:6 | C62H82O5 | 18.56 | 2.3 | 907.7129 | 579.4470 | 561.4552 | ✓ | |||||
| 8 | Ax-C16:1 | C56H80O5 | 18.41 | 2.3 | 833.6066 | 579.3861 | 561.3824 | ✓ | |||||
| 9 | Ax-C16:0 | C56H82O5 | 19.63 | 2.4 | 835.7094 | 579.4558 | 561.4291 | ✓ | ✓ | ✓ | ✓ | ||
| 10 | Ax-C18:1 | C58H84O5 | 20.18 | 3.9 | 861.6601 | 579.3837 | 561.3689 | ✓ | ✓ | ✓ | ✓ | ||
| 11 | Ax-C18:0 | C58H86O5 | 21.39 | 0.9 | 863.6774 | 579.4111 | 561.3632 | ✓ | ✓ | ✓ | |||
| 12 | Ax-C20:1 | C60H88O5 | 21.82 | 2.0 | 889.7763 | 579.4647 | 561.4116 | ✓ | |||||
| Ax-FA Diesters | |||||||||||||
| 13 | Ax-C12:0/20:5 | C72H102O6 | 26.47 | 4.9 | 1063.8861 | 863.6884 | 761.6426 | 579.447 | 561.4377 | ✓ | |||
| 14 | Ax-C12:0/22:6 | C74H104O6 | 26.99 | 2.6 | 1089.8059 | 889.5828 | 761.5556 | 579.384 | 561.3867 | ✓ | |||
| 15 | Ax-C20:5/20:5 | C80H108O6 | 27.51 | 1.3 | 1165.8419 | 863.5995 | 863.5995 | 579.3549 | 561.3832 | ✓ | |||
| 16 | Ax-C12:0/16:0 | C68H104O6 | 27.78 | 5.8 | 1017.8812 | 817.6915 | 761.6426 | 579.4558 | 561.4291 | ✓ | ✓ | ||
| 17 | Ax-C14:0/14:0 | 789.6770 | 789.6770 | ✓ | |||||||||
| 18 | Ax-C20:5/22:6 | C82H110O6 | 28.02 | 1.1 | 1191.8425 | 889.6176 | 863.5938 | 579.3936 | 561.3767 | ✓ | |||
| 19 | Ax-C16:1/20:5 | C76H108O6 | 28.04 | 2.2 | 1117.8411 | 863.5801 | 815.6221 | 579.3740 | 561.3672 | ||||
| 20 | Ax-C12:0/18:1 | C70H106O6 | 28.12 | 12.6 | 1043.8131 | 843.6299 | 761.5554 | 579.3832 | 561.3793 | ✓ | ✓ | ||
| 21 | Ax-C14:0/16:1 | 815.6266 | 789.5727 | ✓ | |||||||||
| 22 | Ax-C16:0/20:5 | C76H110O6 | 28.76 | 2.3 | 1119.8601 | 863.6044 | 817.5956 | 579.3857 | 561.3710 | ✓ | |||
| 23 | Ax-C18:1/20:5 | C78H112O6 | 29.13 | 5.5 | 1145.8514 | 863.5996 | 843.6376 | 579.3837 | 561.3719 | ✓ | ✓ | ||
| 24 | Ax-C16:0/22:6 | 889.5994 | 817.6177 | ✓ | |||||||||
| 25 | Ax-C12:0/20:1 | C72H110O6 | 29.23 | 7.3 | 1071.8407 | 871.6646 | 761.5882 | 579.3846 | 561.3730 | ✓ | ✓ | ||
| 26 | Ax-C14:0/18:1 | 843.6436 | 789.5870 | ✓ | |||||||||
| 27 | Ax-C16:1/18:1 | C74H112O6 | 29.56 | 4.4 | 1097.9844 | 843.7114 | 815.6818 | 579.4558 | 561.4291 | ✓ | |||
| 28 | Ax-C18:1/22:6 | C80H114O6 | 29.78 | 2.0 | 1171.8672 | 889.6319 | 843.6218 | 579.3994 | 561.3832 | ✓ | ✓ | ||
| 29 | Ax-C20:1/20:5 | C80H116O6 | 30.17 | 1.3 | 1173.8394 | 863.6236 | 871.6613 | 579.3936 | 561.3782 | ||||
| 30 | Ax-C16:0/18:1 | C74H114O6 | 30.26 | 6.3 | 1099.8682 | 843.6331 | 817.6174 | 579.3845 | 561.3745 | ✓ | ✓ | ||
| 31 | Ax-C14:0/20:1 | 871.6799 | 789.6058 | ||||||||||
| 32 | Ax-C18:1/18:1 | C76H116O6 | 30.57 | 5.4 | 1125.9897 | 843.7221 | 843.7221 | 579.4470 | 561.4377 | ✓ | ✓ | ✓ | |
| 33 | Ax-C16:1/20:1 | 871.7469 | 815.7239 | ||||||||||
| 34 | Ax-C16:0/20:1 | C76H118O6 | 31.25 | 2.0 | 1127.9919 | 871.7578 | 817.7126 | 579.4558 | 561.4203 | ||||
| 35 | Ax-C18:0/18:1 | 843.7327 | 845.7125 | ✓ | |||||||||
| 36 | Ax-C18:1/20:1 | C78H120O6 | 31.55 | 2.8 | 1153.9973 | 871.7469 | 843.7006 | 579.4558 | 561.4465 | ✓ | |||
| 37 | Ax-C20:1/20:1 | C80H124O6 | 32.49 | 1.3 | 1181.9945 | 871.7469 | 871.7469 | 579.4558 | 561.4291 | ||||
| 38 | Ax- C18:1/22:1 | 843.7114 | 899.8098 | ||||||||||
| Sources | Phospholipids | Triacylglycerols | Other Polar Lipids |
|---|---|---|---|
| P. borealis shrimp oil | >90% | ||
| P. borealis shrimp larvae [12,13] | ~80% | 5%–15% | |
| Krill oil [11] | 20%–33% | 1%–3% | 64%–77% |
| Krill oil [35] | 93.1% | 1.7% | 5.4% |
| Krill oil [35] | 51.3% | 33.4% | 15.2% |
3.2. Characterization and Structural Elucidation of TAGs in Shrimp Oil
3.3. Characterization and Identification of Astaxanthin Species of Shrimp Oil
4. Materials and Methods
4.1. Materials
4.2. High Performance Liquid Chromatography (HPLC)
4.3. FAME Preparation
4.4. Gas Chromatography (GC)
4.5. LC-MS Instrumentation
4.6. 13C-NMR Spectroscopy
5. Conclusions
Supplementary Files
Supplementary File 1Acknowledgments
Author Contributions
Conflicts of Interest
References
- Holthuis, L.B. Shrimps and Prawns of the World: An Annotated Catalogue of Species of Interest to Fisheries. In FAO Species Catalogue; Food and Agriculture Organization of the United Nations: Roma, Italy, 1980; Volume 1. [Google Scholar]
- Heu, M.S.; Kim, J.S.; Shahidi, F. Components and nutritional quality of shrimp processing by-products. Food Chem. 2003, 82, 235–242. [Google Scholar] [CrossRef]
- Rødde, R.H.; Einbu, A.; Varum, K.M. A seasonal study of the chemical composition and chitin quality of shrimp shells obtained from northern shrimp (Pandalus borealis). Carbohydr. Polym. 2008, 71, 388–393. [Google Scholar] [CrossRef]
- Kjartansson, G.T.; Zivanovic, S.; Kristbergsson, K.; Weiss, J. Sonication-assisted extraction of chitin from north Atlantic shrimps (Pandalus borealis). J. Agric. Food Chem. 2006, 54, 5894–5902. [Google Scholar] [CrossRef] [PubMed]
- Pinelli Saavedra, A.; Toledo Guillén, A.R.; Esquerra Brauer, I.R.; Luviano Silva, A.R.; Higuera Ciapara, I. Methods for extracting chitin from shrimp shell waste. Arch. Latinoam. Nutr. 1998, 48, 58–61. (In Spanish) [Google Scholar] [PubMed]
- Guillou, A.; Khalil, M.; Adambounou, L. Effects of silage preservation on astaxanthin forms and fatty acid profiles of processed shrimp (Pandalus borealis) waste. Aquaculture 1995, 130, 351–360. [Google Scholar] [CrossRef]
- Sachindra, N.M.; Mahendrakar, N.S. Effect of protease treatment on oil extractability of carotenoids from shrimp waste. J. Aquat. Food Prod. Technol. 2011, 20, 22–31. [Google Scholar] [CrossRef]
- Treyvaud Amiguet, V.; Kramp, K.L.; Mao, J.; McRae, C.; Goulah, A.; Kimpe, L.E.; Blais, J.M.; Arnason, J.T. Supercritical carbon dioxide extraction of polyunsaturated fatty acids from northern shrimp (Pandalus borealis Kreyer) processing by-products. Food Chem. 2012, 130, 853–858. [Google Scholar] [CrossRef]
- Krill oil. Monograph. Altern. Med. Rev. 2010, 15, 84–86.
- Vognild, E.; Elvevoll, E.O.; Brox, J.; Olsen, R.L.; Barstad, H.; Aursand, M.; Osterud, B. Effects of dietary marine oils and olive oil on fatty acid composition, platelet membrane fluidity, platelet responses, and serum lipids in healthy humans. Lipids 1998, 33, 427–436. [Google Scholar] [CrossRef] [PubMed]
- Gigliotti, J.C.; Davenport, M.P.; Beamer, S.K.; Tou, J.C.; Jaczynski, J. Extraction and characterisation of lipids from Antarctic krill (Euphausia superba). Food Chem. 2011, 125, 1028–1036. [Google Scholar] [CrossRef]
- Ouellet, P.; Taggart, C.T.; Frank, K.T. Early Growth, Lipid-Composition, and Survival Expectations of Shrimp Pandalus borealis Larvae in the Northern Gulf of St-Lawrence. Mar. Ecol. Prog. Ser. 1995, 126, 163–175. [Google Scholar] [CrossRef]
- Pedersen, S.A. Distribution and lipid composition of Pandalus shrimp larvae in relation to hydrography in west Greenland waters. J. Northwest Atl. Fish. Sci. 1998, 24, 39–60. [Google Scholar] [CrossRef]
- Latscha, T. The Role of Astaxanthin in Shrimp pigmentation. In Proceedings of the Advances in Tropical Aquaculture, Tahiti, French Polynesia, 20 February–4 March 1989.
- Sachindra, N.M.; Bhaskar, N.; Mahendrakar, N.S. Carotenoids in different body components of Indian shrimps. J. Sci. Food Agric. 2005, 85, 167–172. [Google Scholar] [CrossRef]
- Ambati, R.; Phang, S.-M.; Ravi, S.; Aswathanarayana, R. Astaxanthin: Sources, extraction, stability, biological activities and its commercial applications—A review. Mar. Drugs 2014, 12, 128–152. [Google Scholar] [CrossRef] [PubMed]
- Seabra, L.M.J.; Pedrosa, L.F.C. Astaxanthin: Structural and functional aspects. Rev. Nutr. 2010, 23, 1041–1050. [Google Scholar]
- Sowmya, R.; Sachindra, N.M. Evaluation of antioxidant activity of carotenoid extract from shrimp processing byproducts by in vitro assays and in membrane model system. Food Chem. 2012, 134, 308–314. [Google Scholar] [CrossRef]
- Hussein, G.; Sankawa, U.; Goto, H.; Matsumoto, K.; Watanabe, H. Astaxanthin, a carotenoid with potential in human health and nutrition. J. Nat. Prod. 2006, 69, 443–449. [Google Scholar] [CrossRef] [PubMed]
- Ayed-Ajmi, Y.; Bougatef, A.; Martínez Alvarez, O.; Nasri, M.; Sayari, N.; Sila, A. Antioxidant and anti-proliferative activities of astaxanthin extracted from the shell waste of deep-water pink shrimp (Parapenaeus longirostris). J. Nat. Prod. 2013, 3, 82–89. [Google Scholar]
- Santos, S.D.; Cahú, T.B.; Firmino, G.O.; de Castro, C.C.; Carvalho, L.B., Jr.; Bezerra, R.S.; Filho, J.L. Shrimp waste extract and astaxanthin: Rat alveolar macrophage, oxidative stress and inflammation. J. Food Sci. 2012, 77, H141–H146. [Google Scholar] [CrossRef] [PubMed]
- Dahl, T.M.; Lydersen, C.; Kovacs, K.M.; Falk-Petersen, S.; Sargent, J.; Gjertz, I.; Gulliksen, B. Fatty acid composition of the blubber in white whales (Delphinapterus leucas). Polar Biol. 2000, 23, 401–409. [Google Scholar] [CrossRef]
- Araujo, P.; Zhu, H.; Breivik, J.F.; Hjelle, J.I.; Zeng, Y. Determination and structural elucidation of triacylglycerols in krill oil by chromatographic techniques. Lipids 2014, 49, 163–172. [Google Scholar] [CrossRef] [PubMed]
- MacDougall, K.M.; McNichol, J.; McGinn, P.J.; O’Leary, S.J.; Melanson, J.E. Triacylglycerol profiling of microalgae strains for biofuel feedstock by liquid chromatography-high-resolution mass spectrometry. Anal. Bioanal. Chem. 2011, 401, 2609–2616. [Google Scholar] [CrossRef] [PubMed]
- Suárez, E.; Mugford, P.; Rolle, A.; Burton, I.; Walter, J.; Kralovec, J. 13C-NMR regioisomeric analysis of EPA and DHA in fish oil derived triacylglycerol concentrates. J. Am. Oil Chem. Soc. 2010, 87, 1425–1433. [Google Scholar] [CrossRef]
- Standal, I.; Axelson, D.; Aursand, M. Differentiation of fish oils according to species by 13C-NMR regiospecific analyses of triacyglycerols. J. Am. Oil Chem. Soc. 2009, 86, 401–407. [Google Scholar] [CrossRef]
- Zeng, Y.X.; Araujo, P.; Du, Z.Y.; Nguyen, T.T.; Froyland, L.; Grung, B. Elucidation of triacylglycerols in cod liver oil by liquid chromatography electrospray tandem ion-trap mass spectrometry. Talanta 2010, 82, 1261–1270. [Google Scholar] [CrossRef] [PubMed]
- Baiocchi, C.; Medana, C.; Dal Bello, F.; Giancotti, V.; Aigotti, R.; Gastaldi, D. Analysis of regioisomers of polyunsaturated triacylglycerols in marine matrices by HPLC/HRMS. Food Chem. 2015, 166, 551–560. [Google Scholar] [CrossRef] [PubMed]
- Rivera, S.M.; Christou, P.; Canela-Garayoa, R. Identification of carotenoids using mass spectrometry. Mass Spectrom. Rev. 2014, 33, 353–372. [Google Scholar] [CrossRef] [PubMed]
- Frassanito, R.; Cantonati, M.; Flaim, G.; Mancini, I.; Guella, G. A new method for the identification and the structural characterisation of carotenoid esters in freshwater microorganisms by liquid chromatography/electrospray ionisation tandem mass spectrometry. Rapid Commun. Mass Spectrom. 2008, 22, 3531–3539. [Google Scholar] [CrossRef] [PubMed]
- Breithaupt, D.E. Identification and quantification of astaxanthin esters in shrimp (Pandalus borealis) and in a microalga (Haematococcus pluvialis) by liquid chromatography-mass spectrometry using negative ion atmospheric pressure chemical ionization. J. Agric. Food. Chem. 2004, 52, 3870–3875. [Google Scholar] [CrossRef] [PubMed]
- Yang, S.; Zhou, Q.; Yang, L.; Xue, Y.; Xu, J.; Xue, C. Effect of thermal processing on astaxanthin and astaxanthin esters in pacific white shrimp Litopenaeus vannamei. J. Oleo Sci. 2015, 64, 243–253. [Google Scholar] [CrossRef] [PubMed]
- Grynbaum, M.D.; Hentschel, P.; Putzbach, K.; Rehbein, J.; Krucker, M.; Nicholson, G.; Albert, K. Unambiguous detection of astaxanthin and astaxanthin fatty acid esters in krill (Euphausia superba Dana). J. Sep. Sci. 2005, 28, 1685–1693. [Google Scholar] [CrossRef] [PubMed]
- Plante, M.; Bailey, B.; Acworth, I.; Clark, D. Analysis of lipids by HPLC-CAD; ESA—A Dionex Company: Chelmsford, MA, USA, 2011. [Google Scholar]
- Phleger, C.F.; Nichols, P.D.; Virtue, P. Lipids and trophodynamics of antarctic zooplankton. Comp. Biochem. Physiol. B 1998, 120, 311–323. [Google Scholar] [CrossRef]
- Indarti, E.; Majid, M.I.A.; Hashim, R.; Chong, A. Direct fame synthesis for rapid total lipid analysis from fish oil and cod liver oil. J. Food Compos. Anal. 2005, 18, 161–170. [Google Scholar] [CrossRef]
- Bender, N.; Portmann, M.; Heg, Z.; Hofmann, K.; Zwahlen, M.; Egger, M. Fish or n-3 PUFA intake and body composition: A systematic review and meta-analysis. Obes. Rev. 2014, 15, 657–665. [Google Scholar] [CrossRef] [PubMed]
- Vigerust, N.; Bjørndal, B.; Bohov, P.; Brattelid, T.; Svardal, A.; Berge, R. Krill oil versus fish oil in modulation of inflammation and lipid metabolism in mice transgenic for TNF-α. Eur. J. Nutr. 2013, 52, 1315–1325. [Google Scholar] [CrossRef] [PubMed]
- Yang, Z.H.; Miyahara, H.; Mori, T.; Doisaki, N.; Hatanaka, A. Beneficial effects of dietary fish-oil-derived monounsaturated fatty acids on metabolic syndrome risk factors and insulin resistance in mice. J. Agric. Food. Chem. 2011, 59, 7482–7489. [Google Scholar] [CrossRef] [PubMed]
- Bunea, R.; El Farrah, K.; Deutsch, L. Evaluation of the effects of neptune krill oil on the clinical course of hyperlipidemia. Altern. Med. Rev. 2004, 9, 420–428. [Google Scholar] [PubMed]
- Yamagishi, K.; Iso, H.; Date, C.; Fukui, M.; Wakai, K.; Kikuchi, S.; Inaba, Y.; Tanabe, N.; Tamakoshi, A. Fish, omega-3 polyunsaturated fatty acids, and mortality from cardiovascular diseases in a nationwide community-based cohort of Japanese men and women the JACC (Japan Collaborative Cohort Study for Evaluation of Cancer Risk) Study. J. Am. Coll. Cardiol. 2008, 52, 988–996. [Google Scholar] [CrossRef] [PubMed]
- Baum, S.J.; Kris-Etherton, P.M.; Willett, W.C.; Lichtenstein, A.H.; Rudel, L.L.; Maki, K.C.; Whelan, J.; Ramsden, C.E.; Block, R.C. Fatty acids in cardiovascular health and disease: A comprehensive update. J. Clin. Lipidol. 2012, 6, 216–234. [Google Scholar] [CrossRef] [PubMed]
- Pacifico, L.; Giansanti, S.; Gallozzi, A.; Chiesa, C. Long chain omega-3 fatty acids in pediatric metabolic syndrome. Mini Rev. Med. Chem. 2014, 14, 791–804. [Google Scholar] [CrossRef] [PubMed]
- Schwab, U.; Lauritzen, L.; Tholstrup, T.; Haldorssoni, T.; Riserus, U.; Uusitupa, M.; Becker, W. Effect of the amount and type of dietary fat on cardiometabolic risk factors and risk of developing type 2 diabetes, cardiovascular diseases, and cancer: A systematic review. Food Nutr. Res. 2014, 58, 25145. [Google Scholar] [CrossRef] [PubMed]
- Calder, P.C. Marine omega-3 fatty acids and inflammatory processes: Effects, mechanisms and clinical relevance. Biochim. Biophys. Acta 2014, 4, 469–484. [Google Scholar] [CrossRef] [PubMed]
- Kris-Etherton, P.M. Monounsaturated fatty acids and risk of cardiovascular disease. Circulation 1999, 100, 1253–1258. [Google Scholar] [CrossRef] [PubMed]
- Kris-Etherton, P.M.; Pearson, T.A.; Wan, Y.; Hargrove, R.L.; Moriarty, K.; Fishell, V.; Etherton, T.D. High-monounsaturated fatty acid diets lower both plasma cholesterol and triacylglycerol concentrations. Am. J. Clin. Nutr. 1999, 70, 1009–1015. [Google Scholar] [PubMed]
- Ros, E. Dietary cis-monounsaturated fatty acids and metabolic control in type 2 diabetes. Am. J. Clin. Nutr. 2003, 78, 617s–625s. [Google Scholar] [PubMed]
- Shen, Z.; Wijesundera, C. Evaluation of ethanolysis with immobilized candida Antarctica lipase for regiospecific analysis of triacylglycerols containing highly unsaturated fatty acids. J. Am. Oil. Chem. Soc. 2006, 83, 923–927. [Google Scholar] [CrossRef]
- Haraldsson, G.G.; Gudmundsson, B.Ö.; Almarsson, Ö. The synthesis of homogeneous triglycerides of eicosapentaenoic acid and docosahexaenoic acid by lipase. Tetrahedron 1995, 51, 941–952. [Google Scholar] [CrossRef]
- Haddad, I.; Mozzon, M.; Strabbioli, R.; Frega, N.G. Stereospecific analysis of triacylglycerols in camel (Camelus dromedarius) milk fat. Int. Dairy J. 2010, 20, 863–867. [Google Scholar] [CrossRef]
- IUPAC Official Method 2.210: Determination of Fatty Acids in the 2-Position in the Triglycerides of Oils and Fats. In Standard Methods for the Analysis of Oils, Fats and Derivatives; Blackwell: Oxford, UK, 1987.
- Tengku-Rozaina, T.M.; Birch, E.J. Positional distribution of fatty acids on hoki and tuna oil triglycerides by pancreatic lipase and 13C NMR analysis. Eur. J. Lipid Sci. Technol. 2014, 116, 272–281. [Google Scholar] [CrossRef]
- Marzilli, L.; Fay, L.; Dionisi, F.; Vouros, P. Structural characterization of triacylglycerols using electrospray ionization-MSn ion-trap MS. J. Am. Oil Chem. Soc. 2003, 80, 195–202. [Google Scholar] [CrossRef]
- Hvattum, E. Analysis of triacylglycerols with non-aqueous reversed-phase liquid chromatography and positive ion electrospray tandem mass spectrometry. Rapid Commun. Mass Spectrom. 2001, 15, 187–190. [Google Scholar] [CrossRef]
- Cheng, C.; Gross, M.L.; Pittenauer, E. Complete structural elucidation of triacylglycerols by tandem sector mass spectrometry. Anal. Chem. 1998, 70, 4417–4426. [Google Scholar] [CrossRef] [PubMed]
- Holčapek, M.; Jandera, P.; Zderadička, P.; Hrubá, L. Characterization of triacylglycerol and diacylglycerol composition of plant oils using high-performance liquid chromatography-atmospheric pressure chemical ionization mass spectrometry. J. Chromatogr. A 2003, 1010, 195–215. [Google Scholar] [CrossRef]
- Mottram, H.R.; Woodbury, S.E.; Evershed, R.P. Identification of triacylglycerol positional isomers present in vegetable oils by high performance liquid chromatography/atmospheric pressure chemical ionization mass spectrometry. Rapid Commun. Mass Spectrom. 1997, 11, 1240–1252. [Google Scholar] [CrossRef]
- Yamamoto, Y.; Imori, Y.; Hara, S. Oxidation behavior of triacylglycerol containing conjugated linolenic acids in sn-1(3) or sn-2 position. J. Oleo Sci. 2014, 63, 31–37. [Google Scholar] [CrossRef] [PubMed]
- Wijesundera, C. The influence of triacylglycerol structure on the oxidative stability of polyunsaturated oils. Lipid Technol. 2008, 20, 199–202. [Google Scholar] [CrossRef]
- Wijesundera, C.; Ceccato, C.; Watkins, P.; Fagan, P.; Fraser, B.; Thienthong, N.; Perlmutter, P. Docosahexaenoic acid is more stable to oxidation when located at the sn-2 position of triacylglycerol compared to sn-1(3). J. Am. Oil Chem. Soc. 2008, 85, 543–548. [Google Scholar] [CrossRef]
- Bar-Yoseph, F.; Lifshitz, Y.; Cohen, T. Review of sn-2 palmitate oil implications for infant health. Prostaglandins Leukot. Essent. Fat. Acids 2013, 89, 139–143. [Google Scholar] [CrossRef] [PubMed]
- Ramírez, M.; Amate, L.; Gil, A. Absorption and distribution of dietary fatty acids from different sources. Early Hum. Dev. 2001, 65, S95–S101. [Google Scholar] [CrossRef]
- Yuan, J.-P.; Chen, F. Chromatographic separation and purification of trans-astaxanthin from the extracts of Haematococcus pluvialis. J. Agric. Food. Chem. 1998, 46, 3371–3375. [Google Scholar] [CrossRef]
- Orosa, M.; Franqueira, D.; Cid, A.; Abalde, J. Analysis and enhancement of astaxanthin accumulation in Haematococcus pluvialis. Bioresour. Technol. 2005, 96, 373–378. [Google Scholar] [CrossRef] [PubMed]
- Rivera, S.M.; Canela-Garayoa, R. Analytical tools for the analysis of carotenoids in diverse materials. J. Chromatogr. A 2012, 1224, 1–10. [Google Scholar] [CrossRef] [PubMed]
- Weesepoel, Y.; Vincken, J.P.; Pop, R.M.; Liu, K.; Gruppen, H. Sodiation as a tool for enhancing the diagnostic value of MALDI-TOF/TOF-MS spectra of complex astaxanthin ester mixtures from Haematococcus pluvialis. J. Mass Spectrom. 2013, 48, 862–874. [Google Scholar] [CrossRef] [PubMed]
- Holtin, K.; Kuehnle, M.; Rehbein, J.; Schuler, P.; Nicholson, G.; Albert, K. Determination of astaxanthin and astaxanthin esters in the microalgae Haematococcus pluvialis by LC-(APCI)MS and characterization of predominant carotenoid isomers by NMR spectroscopy. Anal. Bioanal. Chem. 2009, 395, 1613–1622. [Google Scholar] [CrossRef] [PubMed]
- Subramanian, B.; Tchoukanova, N.; Djaoued, Y.; Pelletier, C.; Ferron, M. Raman spectroscopic investigations on intermolecular interactions in aggregates and crystalline forms of trans-astaxanthin. J. Raman Spectrosc. 2013, 44, 219–226. [Google Scholar] [CrossRef]
- Subramanian, B.; Tchoukanova, N.; Djaoued, Y.; Pelletier, C.; Ferron, M.; Robichaud, J. Investigations on the geometrical isomers of astaxanthin: Raman spectroscopy of conjugated polyene chain with electronic and mechanical confinement. J. Raman Spectrosc. 2014, 45, 299–304. [Google Scholar] [CrossRef]
- Tchoukanova, N.; Benoit, G. Method for extracting organic solids and oil from marine organisms enriched with astaxanthin. WO/2014/138920, 18 September 2014. [Google Scholar]
- Renstrøm, B.; Liaaen-Jensen, S. Fatty acid composition of some esterified carotenols. Comp. Biochem. Physiol. B 1981, 69, 625–627. [Google Scholar] [CrossRef]
- Miao, F.; Geng, Y.; Lu, D.; Zuo, J.; Li, Y. Stability and changes in astaxanthin ester composition from Haematococcus pluvialis during storage. Chin. J. Ocean. Limnol. 2013, 31, 1181–1189. [Google Scholar] [CrossRef]
- Cervantes-Paz, B.; Yahia, E.M.; de Jesús Ornelas-Paz, J.; Victoria-Campos, C.I.; Ibarra-Junquera, V.; Pérez-Martínez, J.D.; Escalante-Minakata, P. Antioxidant activity and content of chlorophylls and carotenoids in raw and heat-processed jalapeño peppers at intermediate stages of ripening. Food Chem. 2014, 146, 188–196. [Google Scholar] [CrossRef] [PubMed]
- HPLC and Spectrophotometric Analysis of Carotenoids from Haematococcus Algae Powder; Cyanotech: Kailua-Kona, HI, USA, 2001.
- Fatty Acid/Fame Application Guide. Analysis of Foods for Nutritional Needs; Sigma-Aldrich: Louis, MO, USA, 2008.
- Békri, K.; Milley, J.E.; Melanson, J.E.; Olsen, R.E. Identification of astaxanthin fatty acid esters by LC-UV/Vis-DAD and LC-ESI-exactive orbitrap ms in Calanus finmarchicus oil and meal. In Present at national Symposium on Fish Nutrition and Feeding, Molde, Norway, 4–7 June 2012.
- McNichol, J.; MacDougall, K.M.; Melanson, J.E.; McGinn, P.J. Suitability of soxhlet extraction to quantify microalgal fatty acids as determined by comparison with in situ transesterification. Lipids 2012, 47, 195–207. [Google Scholar] [CrossRef] [PubMed]
© 2015 by the authors; licensee MDPI, Basel, Switzerland. This article is an open access article distributed under the terms and conditions of the Creative Commons Attribution license (http://creativecommons.org/licenses/by/4.0/).
Share and Cite
Jiao, G.; Hui, J.P.M.; Burton, I.W.; Thibault, M.-H.; Pelletier, C.; Boudreau, J.; Tchoukanova, N.; Subramanian, B.; Djaoued, Y.; Ewart, S.; et al. Characterization of Shrimp Oil from Pandalus borealis by High Performance Liquid Chromatography and High Resolution Mass Spectrometry. Mar. Drugs 2015, 13, 3849-3876. https://doi.org/10.3390/md13063849
Jiao G, Hui JPM, Burton IW, Thibault M-H, Pelletier C, Boudreau J, Tchoukanova N, Subramanian B, Djaoued Y, Ewart S, et al. Characterization of Shrimp Oil from Pandalus borealis by High Performance Liquid Chromatography and High Resolution Mass Spectrometry. Marine Drugs. 2015; 13(6):3849-3876. https://doi.org/10.3390/md13063849
Chicago/Turabian StyleJiao, Guangling, Joseph P. M. Hui, Ian W. Burton, Marie-Hélène Thibault, Claude Pelletier, Josée Boudreau, Nadia Tchoukanova, Balaji Subramanian, Yahia Djaoued, Stephen Ewart, and et al. 2015. "Characterization of Shrimp Oil from Pandalus borealis by High Performance Liquid Chromatography and High Resolution Mass Spectrometry" Marine Drugs 13, no. 6: 3849-3876. https://doi.org/10.3390/md13063849