Article

γ-Lindane Increases Microcystin Synthesis in Microcystis aeruginosa PCC7806

by
Laura Ceballos-Laita
1,
Laura Calvo-Begueria
1,
Jessica Lahoz
2,
María-Teresa Bes
1,
María F. Fillat
1 and
María-Luisa Peleato
1,*
1
Department of Biochemistry and Molecular & Cellular Biology, and the Institute for Biocomputation and Physics of Complex Systems (BIFI), University of Zaragoza, Pedro Cerbuna 12, 50009 Zaragoza, Spain
2
Laboratorio de Calidad de las Aguas, Confederación Hidrografica del Ebro, Plaza Canal Imperial, n° 9, 50004 Zaragoza, Spain
*
Author to whom correspondence should be addressed.
Mar. Drugs 2015, 13(9), 5666-5680; https://doi.org/10.3390/md13095666
Submission received: 2 July 2015 / Revised: 20 July 2015 / Accepted: 29 July 2015 / Published: 3 September 2015
(This article belongs to the Special Issue Compounds from Cyanobacteria)

Abstract

:
HCH factories, and the waste dumpsites associated to its production, have become a global environmental concern, and their runoff could pollute ground and surface waters with high levels of the pollutant. In this study, the influence of lindane (γ-HCH) on microcystin production has been investigated in Microcystis aeruginosa PCC7806. This toxic cyanobacterium is highly tolerant to γ-lindane (20 mg/L), and produces more toxin (microcystin) in the presence of the pollutant. Microcystis degrades γ-lindane and presence of γ-lindane induces genes involved in its own degradation (nirA). RT-PCRsq has been used to monitor changes in levels of transcripts encoded by the mcy operon (mcyD, mcyH and mcyJ), responsible for the microcystin synthesis machinery, as well as other genes involved in its transcriptional regulation, such as ntcA and fur family members. The presence of lindane in the culture media induces mcyD expression, as well as ntcA gene transcription, while other genes, such as mcyH, (putative ABC transporter), are downregulated. The amount of microcystin found in the cells and the culture media is higher when M. aeruginosa is treated with γ-lindane than in control cells. The results suggest that in a lindane polluted environment, Microcystis toxic strains may enhance their microcystin synthesis.

1. Introduction

Cyanobacteria are organisms with an outstanding capacity to adapt to a wide range of environments and survive in extreme or highly degraded environments. Their metabolic plasticity includes the synthesis of a broad variety of secondary metabolites, some of them potentially toxic for eukaryotic organisms, the so-called cyanotoxins [1,2]. Moreover, changes in the environment, such as the eutrophication of aquifers, provoke blooms of cyanobacteria, in many cases producing high levels of toxins in the water and thus causing serious health and environmental problems [1]. Microcystis aeruginosa is a freshwater cyanobacterium responsible for many toxic blooms, producing microcystin. Sometimes it is naturally occurring in the tidal fresh estuaries and low salinity coastal areas, and there is an alarming increase of blooms in such mesohaline estuaries [3].
The cyclic heptapeptide microcystin is the most ubiquitous and abundant cyanotoxin on Earth [1]. Microcystins are synthesized by a mixed polyketide synthase/nonribosomal peptide synthetase system called microcystin synthetase. Tillett and co-workers [4] identified and sequenced the gene cluster named mcy operon, which encodes the microcystin synthetase machinery in Microcystis aeruginosa PCC7806. This 55-kb sequence consists of ten open reading frames transcribed bidirectionally from a central 732-bp intergenic region between mcyA and mcyD. Microcystin synthesis is an inducible event, which is probably regulated by many environmental and nutritional factors [5].
The extreme adaptability of some cyanobacteria makes them able to tolerate and even metabolize moderate doses of pesticides [6,7]. Organochlorines, such as lindane (γ-hexachlorocychlohexane), are one of the most recalcitrant and persistent pesticides (Persistent Organic Pollutants, POP. Stockholm Convention 2009), having been used intensively in recent decades. Lindane was severely restricted in the 1970s and 1980s in the majority of developed countries [8], but is still used in some developing countries in Asia, Africa and Latin America [8]. Due to its long persistence in waters, lindane is now a widespread contaminant in aquatic ecosystems [9]. Several microorganisms have metabolic mechanisms to degrade lindane. Kuritz et al. [6] highlight the ability of fifteen strains of cyanobacteria to degrade lindane. This process seems to be dependent on a functional nir operon, involved in the nitrite reduction system, implicated in a dechlorination process [10]. Cyanobacteria show a remarkable potential in the bioremediation of aquatic and terrestrial habitats [11], but the risks of proliferation of potentially toxic strains or the increasing toxin production in the presence of contaminants require rigorous evaluation. It has been shown that ampicillin, atrazine and cadmium downregulate the transcription of microcystin synthesis gene clusters [12], demonstrating that the aforementioned antibiotics, herbicides and heavy metals affect microcystin levels. A review of the available literature shows ample data variations both in lindane tolerance and lindane degradation depending on the cyanobacterial strain used [6,11,13,14]. Lindane physiological effects on growth (decreased), photosynthesis (decreased) and oxidative metabolism (antioxidant defenses increased) have been described in non-toxic strains of Anabaena (PCC7120 [14] and in a strain isolated from paddy fields [13].
In Spain, as well as around the world, there are several lindane residues dumpsites, with high levels of the pollutant, a consequence of former lindane factories activity. Risk management of eventual leachates of dumpsites requires knowledge of secondary environmental problems derived from the presence of lindane. In this study, the influence of lindane (γ-HCH) on microcystin production has been investigated in M. aeruginosa PCC7806 exposed to the pesticide. The changes in levels of transcripts encoding mcyD, mcyH, and mcyJ in treated cells have been determined using semi-quantitative RT-PCR. The expression of the transcriptional regulators involved in mcy operon regulation has also been examined together with nirA, since lindane degradation depends on an active nir operon [10].

2. Results and Discussion

2.1. Effects of Lindane on M. Aeruginosa PCC7806 Growth

The toxic Microcystis aeruginosa PCC7806 exhibits a considerable tolerance to lindane, surviving and growing up to 20 mg/L (Figure 1), whereas the growth of a field isolated Microcystis aeruginosa strain (Kützing) Lemmermann (MaD7) was completely inhibited at 5 mg/L [11]. Initially, lindane was added from a stock solution in ethanol. The presence of 0.04% ethanol, as used for lindane solubilization in most published papers (5% ethanol in [11], 0.1% in [14]), affects the growth of the cyanobacteria (Figure 1). For this reason, in subsequent experiments, lindane was used at its limit of solubility in water, 7 mg/L. Growth curves were determined and the results are shown in Figure 2. The data indicates that lindane affects cell survival and growth, but after a few hours a certain recovery could be observed. The recovery could be due either to the adaptation of the Microcystis cells to the pesticide or/and the induction of the metabolic mechanism to metabolize moderate amounts of lindane. Initially, cells increased their protein content as a response to lindane, but after 48 h, control and lindane-treated cells showed similar levels.
Figure 1. Survival of M. aeruginosa PCC7806 cells grown in the presence of different amounts of γ-lindane, dissolved in 400 µL/L of ethanol.
Marinedrugs 13 05666 g001
Figure 2. Effect of lindane. (a) Growth of M. aeruginosa PCC7806 in the presence of lindane at its limit of solubility in water, 7 mg/L; (b) Total protein determined in cells growing in 7 mg/L lindane. * significant p < 0.05.
Marinedrugs 13 05666 g002
Chlorophyll a, phycobiliproteins and carotenoids were determined and the results are shown in Figure 3. When exposed to lindane, the amount of cell pigments is not altered in the case of chlorophyll a, whereas synthesis of carotenoids and phycobiliproteins increased (Figure 3). H2O2 production increase was found in early stages of the lindane treatment (Figure 4).

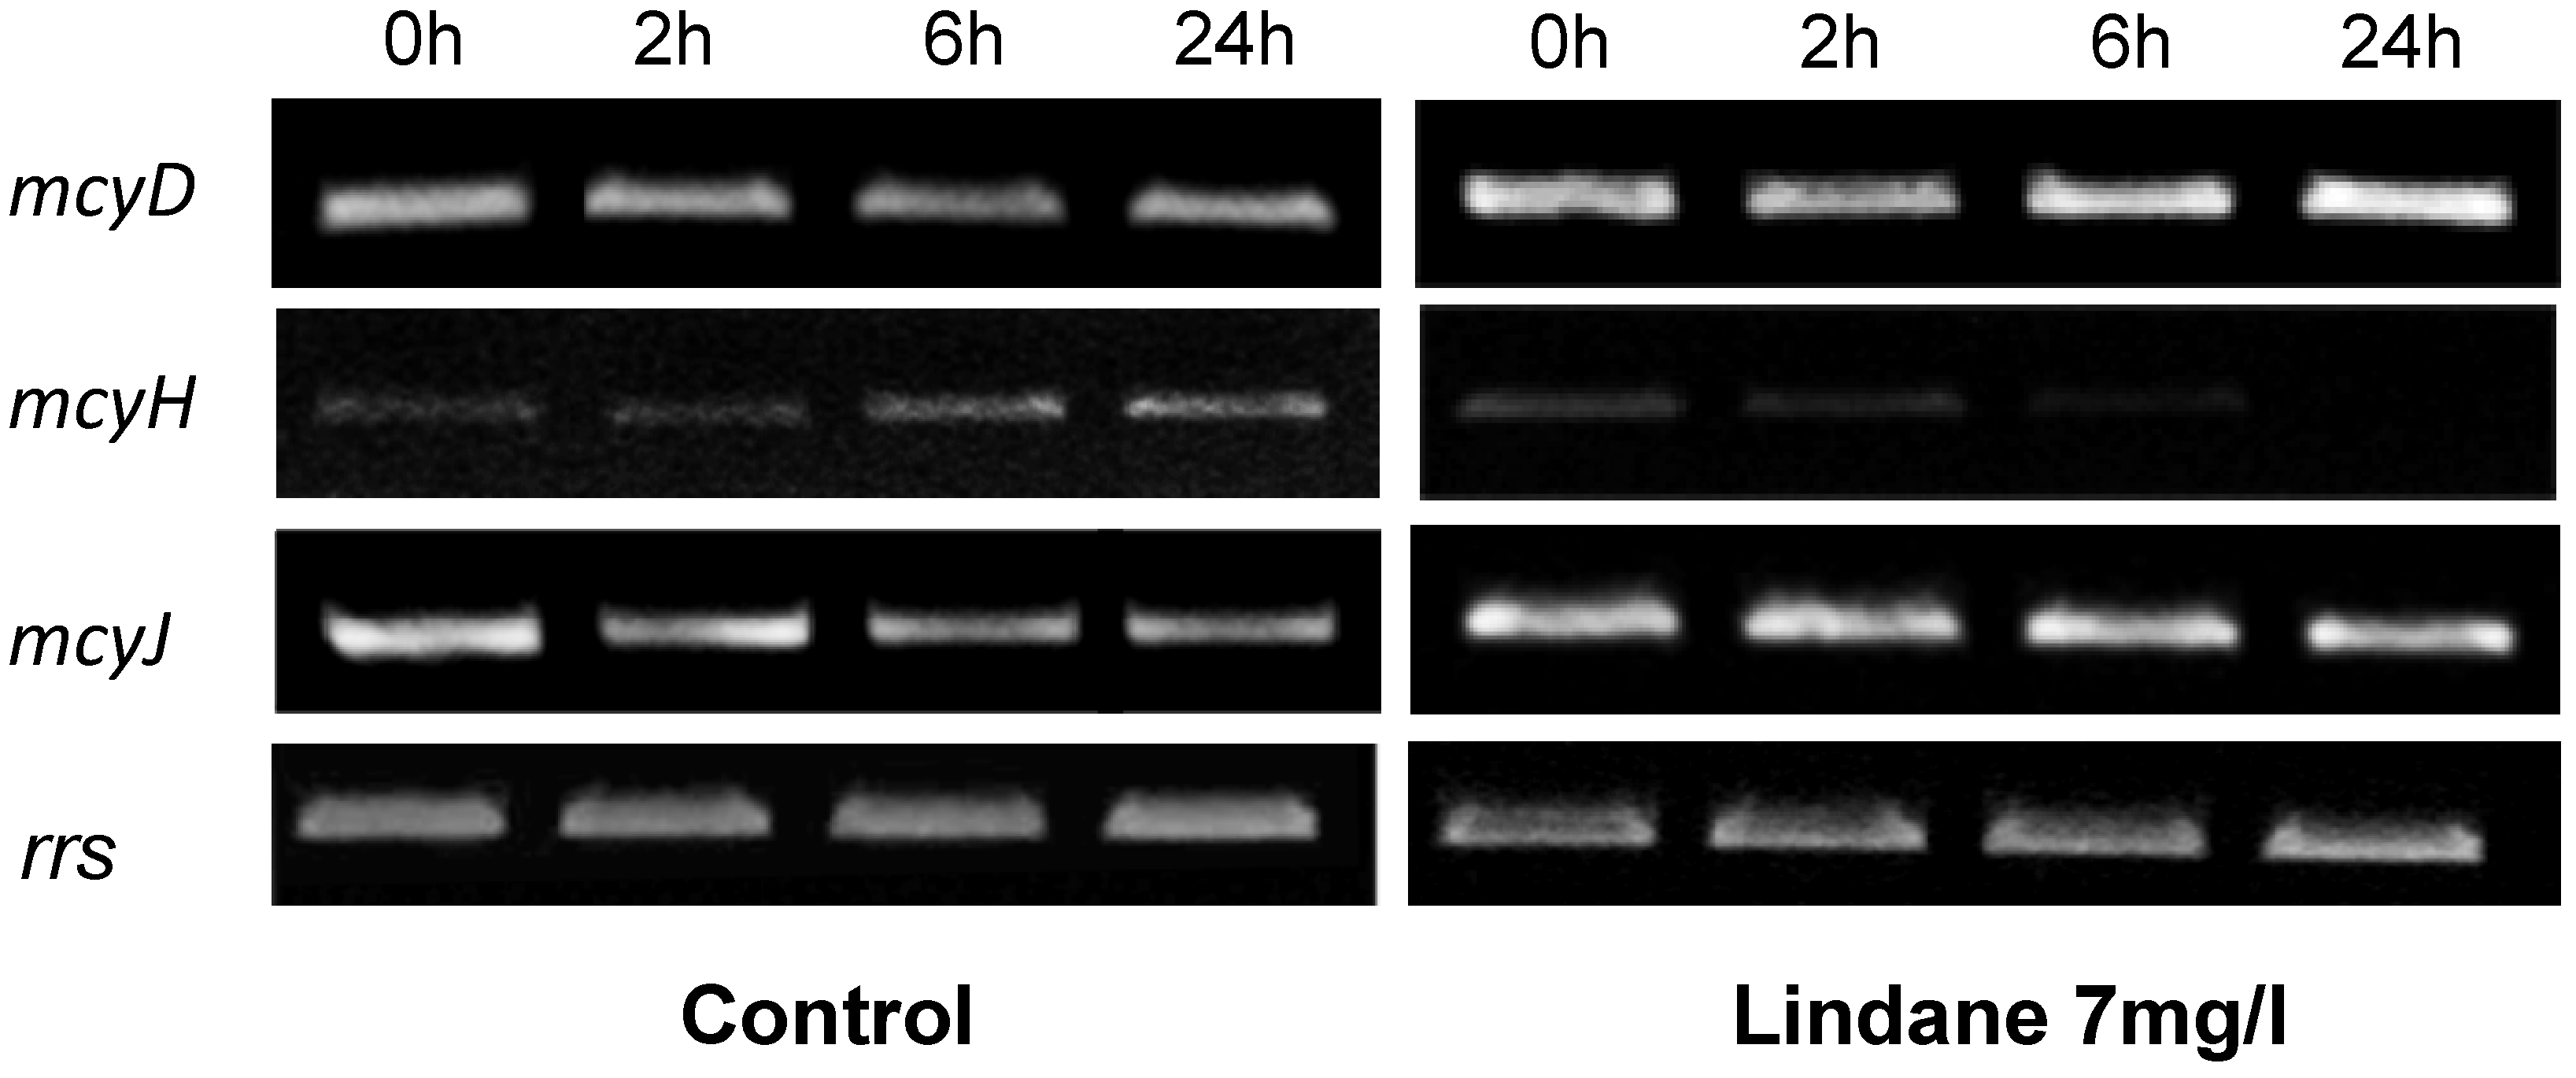
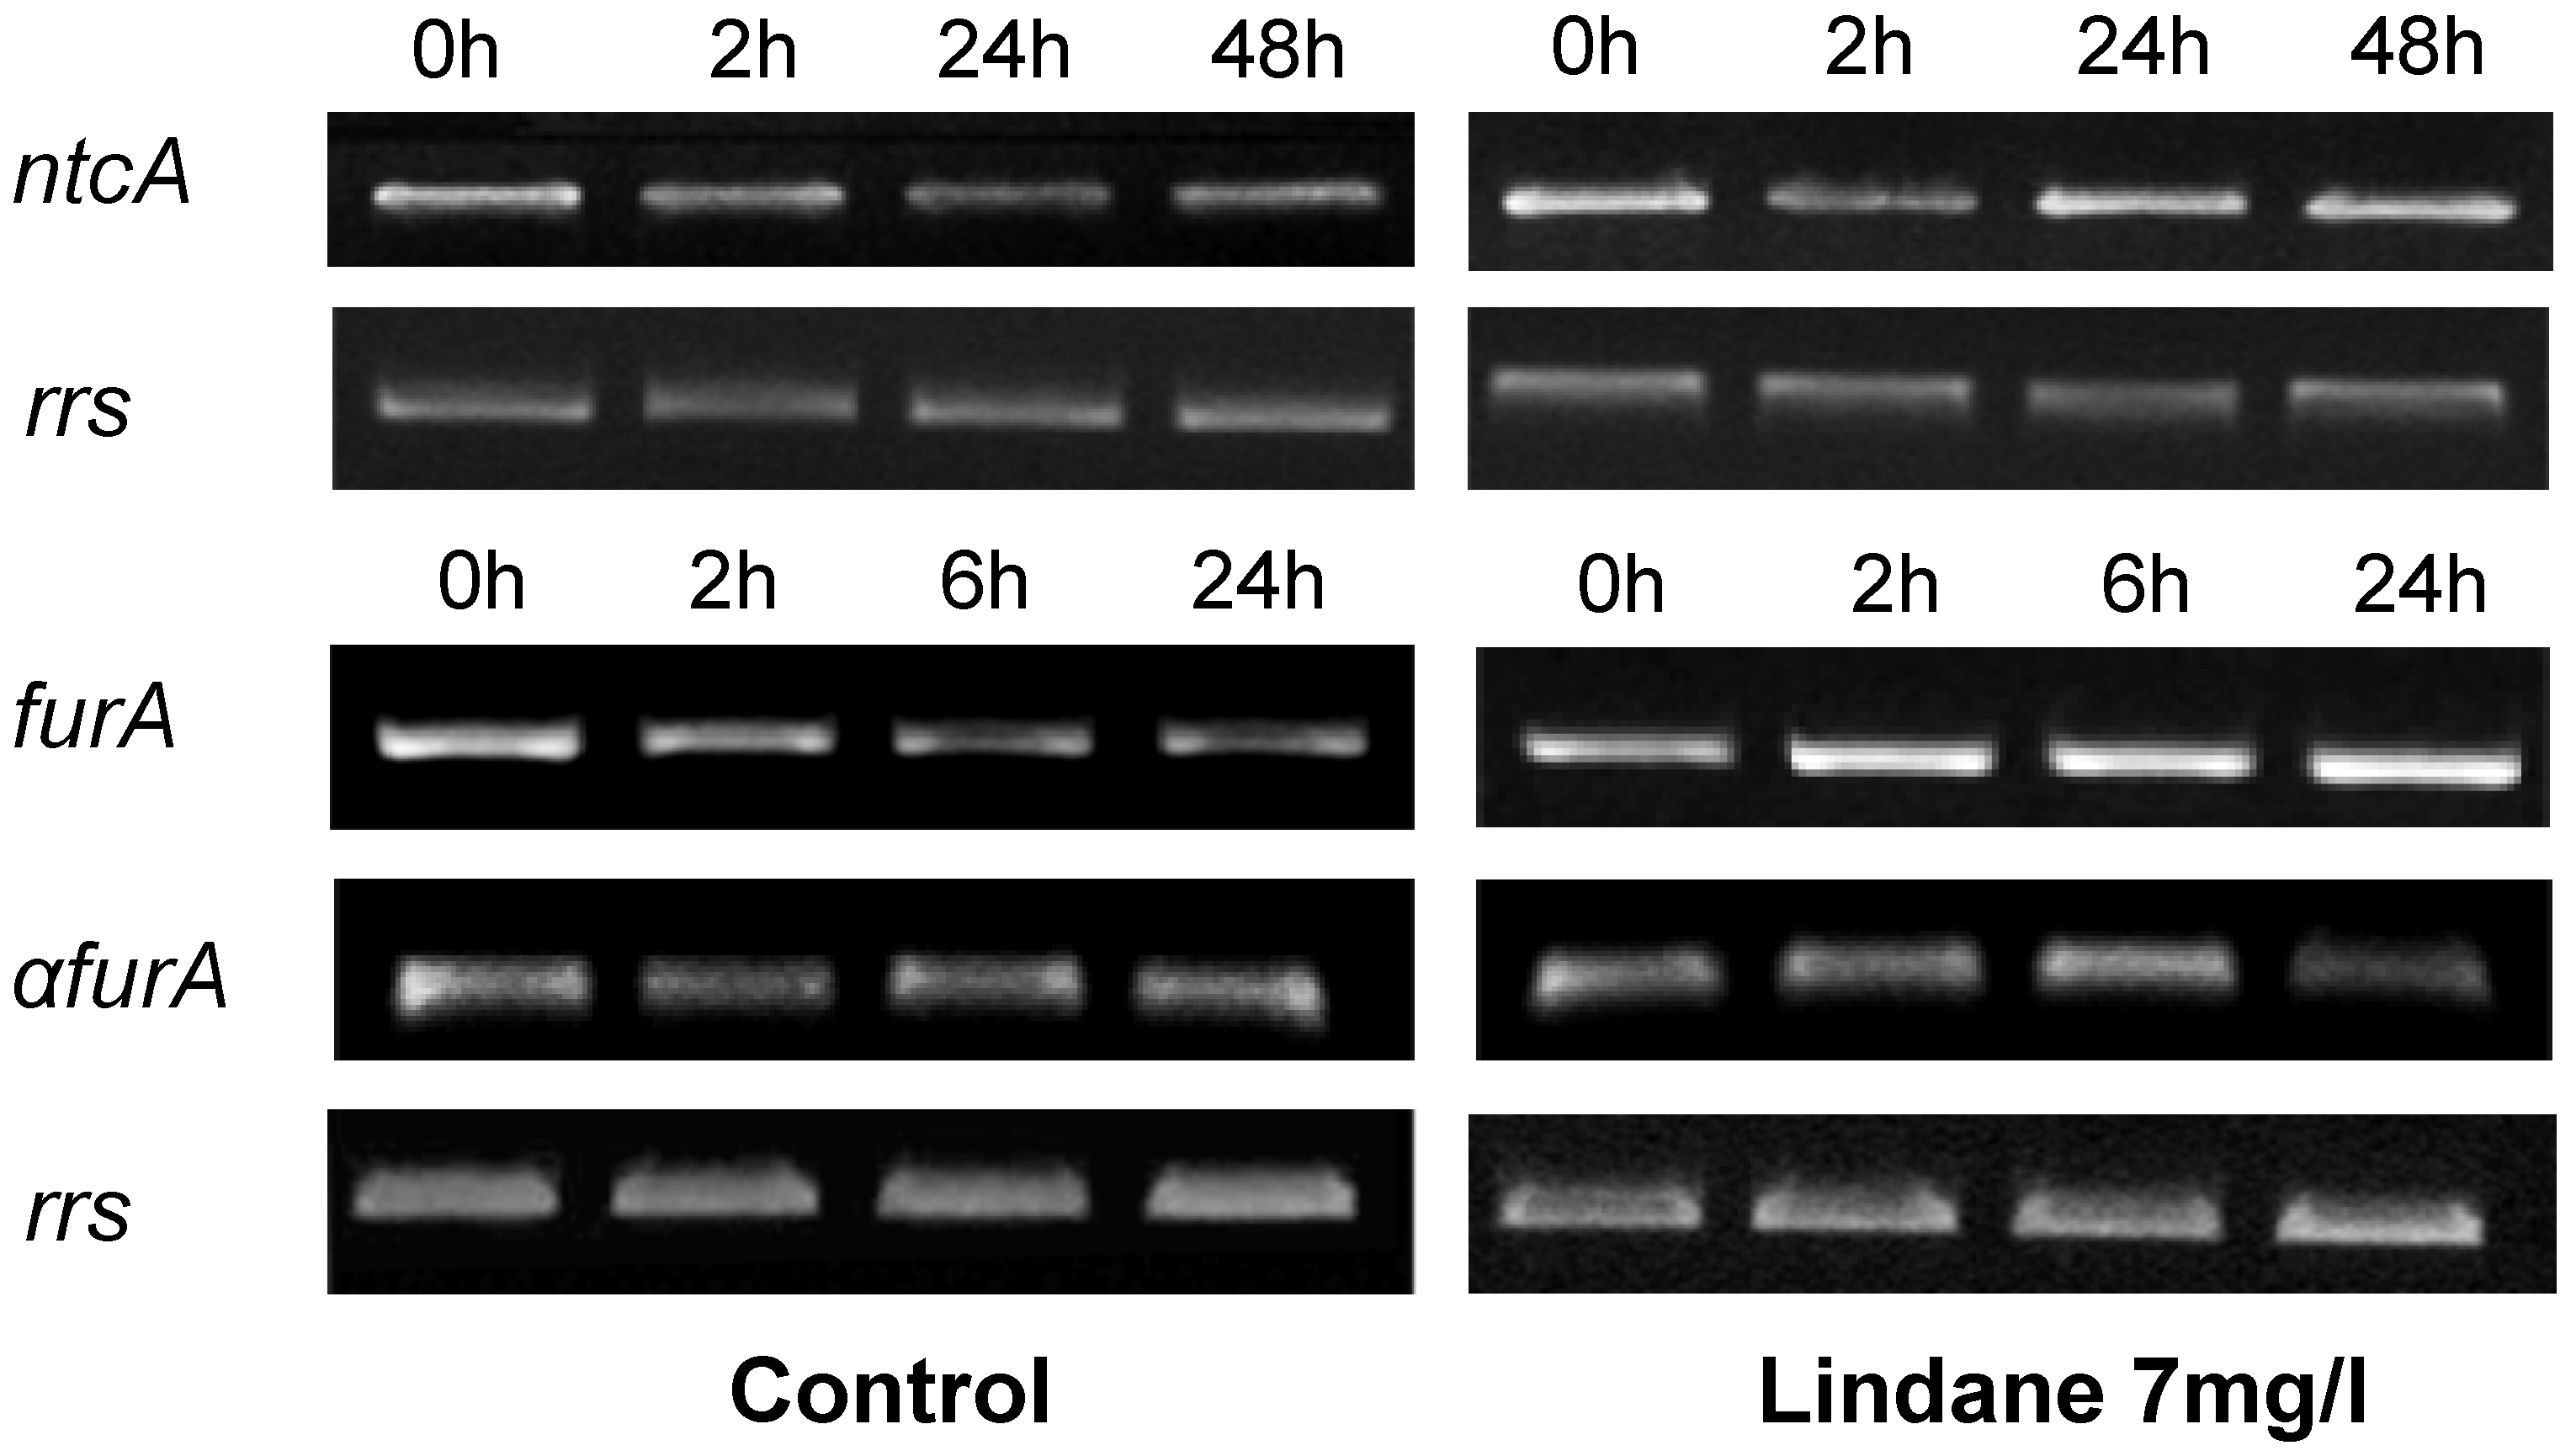
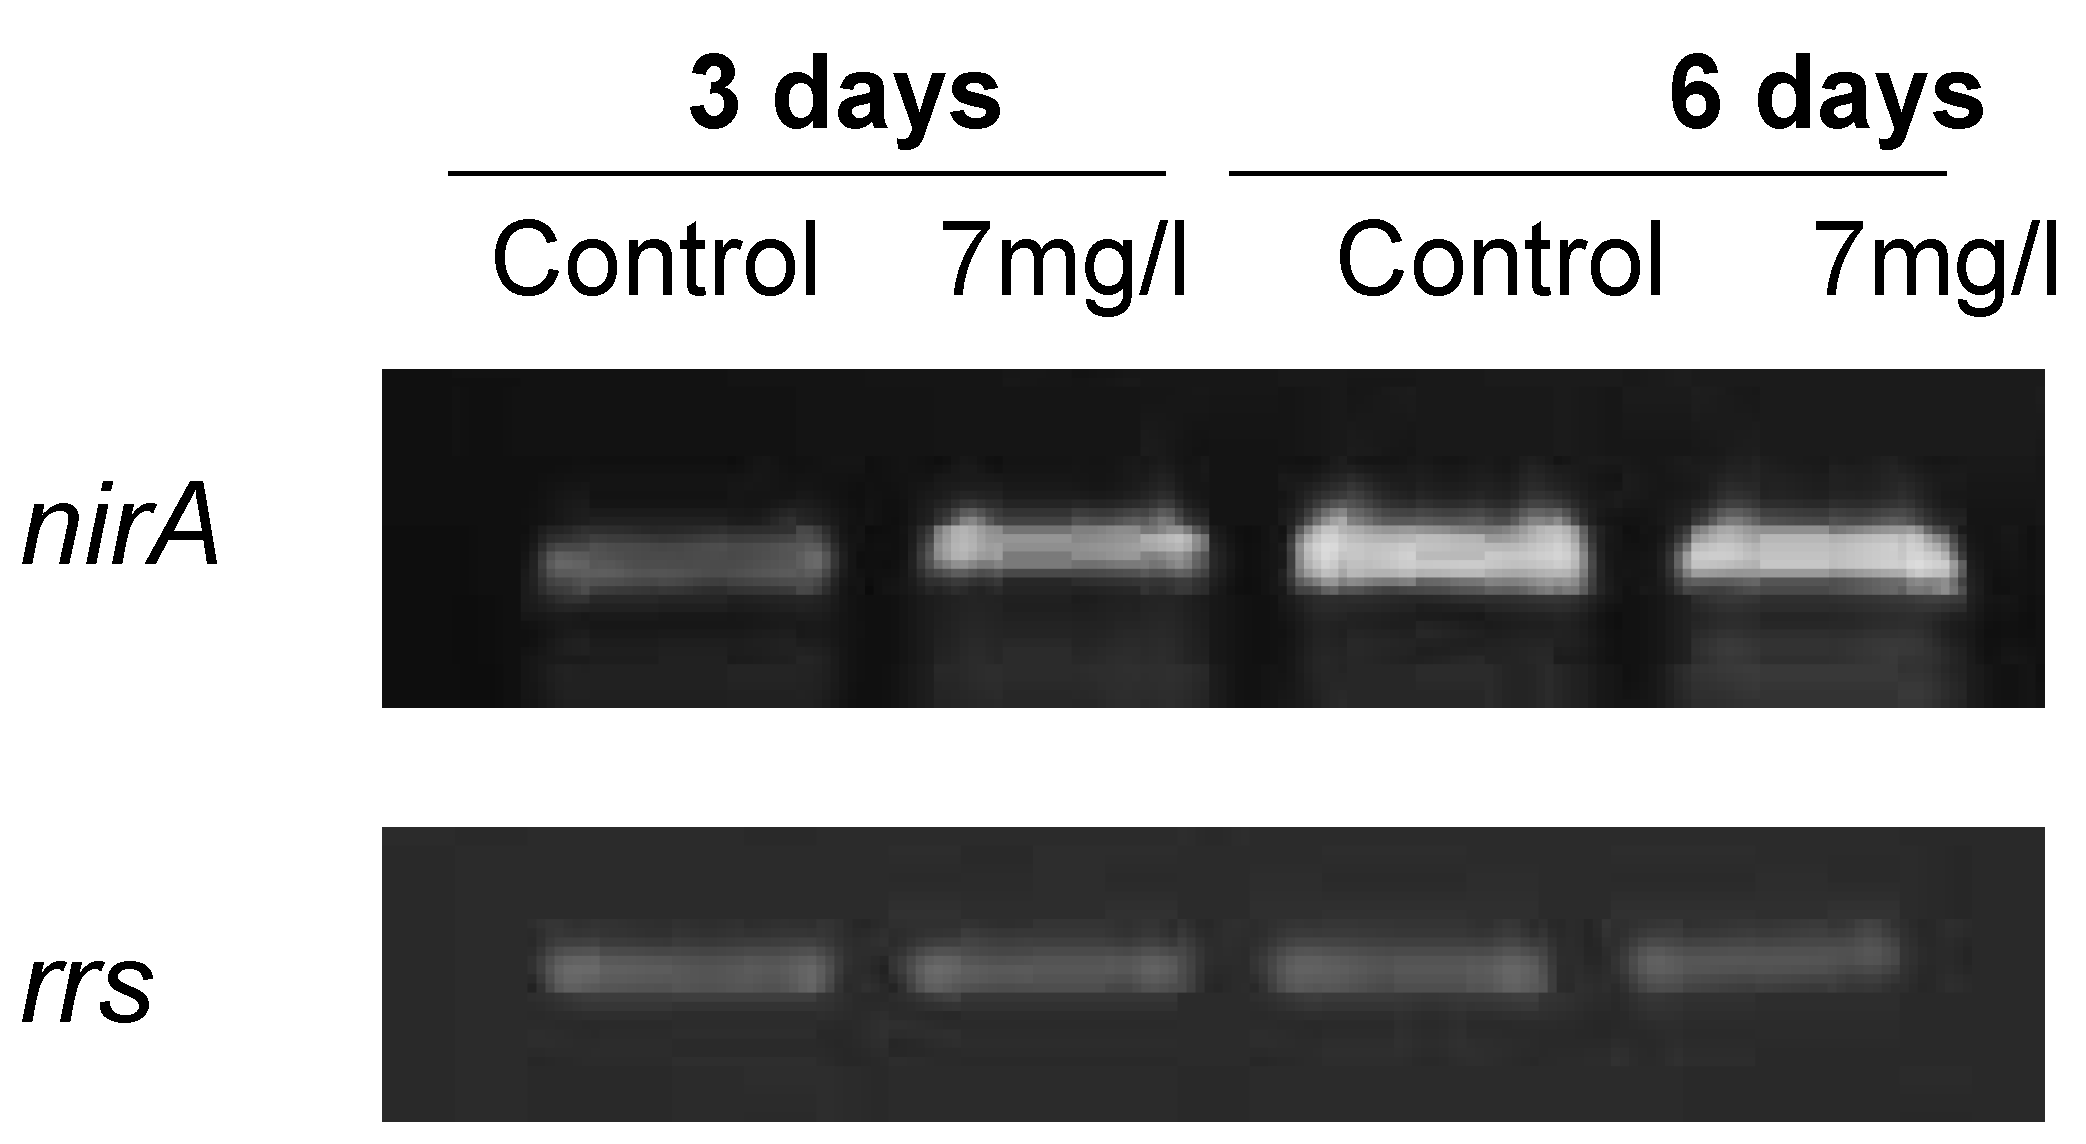
2.2. Effects of Lindane on Gene Expression Levels

The mcyD gene, transcribed from the bidirectional promoter present in the mcy cluster encodes a modular polyketide synthase involved in the synthesis of Adda, the β-amino acid responsible for the toxicity of all variants of microcystins. Moreover, mcyD expression is essential in microcystin synthesis and the lack of the protein results in the absence of microcystin synthesis [5]. For these reasons we considered it a suitable gene candidate to be studied as mcy expression marker.
Figure 3. Effect of lindane on the pigment content in M. aeruginosa PCC7806. (a) chlorophyll a; (b) phycobiliproteins; (c) carotenoids. * Significant p < 0.05.
Marinedrugs 13 05666 g003
Aliquots of those cells growing in 7 mg/L lindane were studied versus non-stressed cells. M. aeruginosa PCC7806 cells were grown at 40 μmol photons m−2·s−1 until they reached an early exponential phase of growth (OD700 nm = 0.6). Lindane was then added to the culture. Aliquots were collected at different times and the total RNA was extracted and reverse-transcribed. RT-PCR was performed with cDNAs using specific primers for each gene, and a 16S rRNA gene was used as a housekeeping gene. The change in mRNAs levels in stressed cells was measured at different times and the data obtained are shown in Figure 5. mcyD is induced in lindane-treated cells. On the other hand, the data shown in Figure 5 indicate that mcyH, encoded for a putative ABC transporter protein, is downregulated in lindane-treated cells, with an apparent disappearance of the transcript. mcyJ, a putative methytransferase, increased very slightly its expression (Figure 5).
Figure 4. Generation of H2O2 in M. aeruginosa PCC7806 cells under lindane treatment. * significant p < 0.05.
Marinedrugs 13 05666 g004
Figure 5. Changes in the mcyD, mcyH and mcyJ expression in M. aeruginosa PCC7806 cells treated with lindane. The expression was studied with semi-quantitative RT-PCR. The housekeeping gene rrs was used as control. Determinations for each gene were performed in the exponential phase of PCR. Experiments were repeated at least 3 times with independent RNA extractions and the relevant portions of a representative gel are shown.
Marinedrugs 13 05666 g005
ntcA and fur, genes corresponding with the two transcriptional regulators involved in mcy regulation [15,16], were also analyzed transcriptionally and the results obtained are indicated in Figure 6. ntcA, encoding the master regulator of the nitrogen metabolism, is clearly induced in the presence of lindane in comparison with control cells. The furA transcript level rises whereas its antisense, the a-furA [17], decreases, with a presumably final effect of more FurA protein synthesis. Other members of the Fur family, such as furB or furC, do not alter their expression upon treatment.
Figure 6. Semi-quantitative RT-PCR analysis of the expression of several genes involved in the regulation of the mcy operon. The housekeeping gene rrs was used as control. Determinations for each gene were performed in the exponential phase of PCR. Experiments were repeated at least twice with independent RNA extractions, and the relevant portions of a representative gel are shown.
Marinedrugs 13 05666 g006

2.3. M. aeruginosa Degrades Lindane

Seven milligrams per liter of lindane was added to a culture of M. aeruginosa and to an identical volume of culture media without cells. After 1 and 15 days, aliquots were obtained and lindane concentration determined. Table 1 shows the observed changes. Cells cultured without lindane, as well as culture medium with the pollutant, were used as negative control. When M. aeruginosa is present, lindane concentration dropped after 15 days 6 times more than lindane in culture medium without cells (0.36 mg/L).
Table 1. Lindane presence in M. aeruginosa cultures as well as in control samples, 7 mg/L of lindane was added at time zero.
SampleTime 24 h mg/L lindaneTime 15 days mg/L lindane
M. aeruginosa culture without lindane<0.005<0.005
Culture media 7 mg/L lindane6.27 ± 0.342.08 ± 0.26
M. aeruginosa culture 7 mg/L lindane6.19 ± 0.290.36 ± 0.05
Since an active nir operon is necessary for lindane dechlorination [10], the expression of nirA was also studied. The cells exhibit a considerable increase at 3 days of the nirA transcript in lindane-treated samples (Figure 7).
Figure 7. Transcriptional analysis of the nirA gene expression in lindane treated cells, using rrs as housekeeping reference.
Marinedrugs 13 05666 g007

2.4. Microcystin-LR Content Correlates with mcyD Transcriptional Changes Caused by Lindane

The increase of microcystin-LR content in the cells exposed to lindane was consistent with the changes found during the transcriptional analysis of the mcyD gene. Microcystin-LR (and the very low amount of D-Aps3 MC-LR, the only two variants found in this strain [18]) were determined using the MicroCystest®. The results expressed as microcystin-LR equivalents are represented in Figure 8. Figure 8A shows the microcystin present inside the cells while Figure 8B represents the microcystin extruded to the media. Lindane induces the synthesis of microcystin in M. aeruginosa and the increase coincided in time with the early gene induction responses to the pesticide. There was also an increment in the extracellular microcystin, probably due to the cell death observed as a consequence of lindane addition. In this case, the extracellular microcystin increase cannot be related to mcyH expression, which decreased in the presence of lindane.

2.5. Discussion

Cyanobacteria are considered as key primary producers in aquatic ecosystems, and there is a growing interest in how pollutants affect the physiology of phytoplankton. Moreover, the ability of several strains to produce cyanotoxins leads to the need to investigate if changes in the environment could affect this type of secondary metabolism. Lindane is one of the most widespread contaminants in aquatic environments and its impact on phytoplankton has been widely described (growth rate affectation, photosynthesis decrease and oxidative stress increase [11,13], though there are no references concerning its effect on cyanotoxin production. The amount of γ-lindane used in this work exceeds the usual levels found in rivers as a consequence of its pesticide use, but leachates from dumpsites can reach such concentrations [19].
After the addition of lindane, part of the population dies, but after a few hours and depending on the dose, growth is observed. As previously mentioned, it seems that M. aeruginosa PCC7806 tolerates higher lindane concentrations than other cyanobacteria reported in the literature, such as Anabaena PCC7120 [14] or other microcystin-producing strains such as M. aeruginosa (MaD7) or Pseudoanabena limnetica [11]. Additionally, M. aeruginosa PCC7806 seems to have the ability to degrade lindane, with the nir gene induced. Thus, this cyanobacterium can survive in a lindane-contaminated environment, and its tolerance may cause imbalances in the population of aquatic ecosystems, favoring the growth of this toxic strain. Lindane causes oxidative stress, but microcystin synthesis is not induced under such conditions [20]. Even though other microcystin-producing strains [11] do not tolerate more than 5 mg/L of lindane, according to Zilliges et al. [21], the presence of microcystin may increase the fitness of the cells under oxidative stress conditions.
Figure 8. Microcystin-LR equivalents determined using MicroCystest®. (a) Intracellular microcystin content determined in lindane-treated cells and control cells; (b) extracellular microcystin content in lindane-treated cells and control cells. * Significant p < 0.05.
Marinedrugs 13 05666 g008
Lindane increases slightly the mcyD transcript level (Figure 5), and the microcystin content per cell (Figure 8) correlates with the transcription of mcyD in all the experiments performed. Other pollutants such as ampicillin, atrazine and cadmium have been shown to decrease the mcyD transcript level in M. aeruginosa (strain: code 905 from the Institute of Hydrobiology, Chinese Academy of Sciences) [12], as well as the microcystin cell content. These authors also found mcyH downregulation, congruent with our experimental data where mcyH decreases slightly. McyH is a putative ABC transporter, and its inactivation results in loss of microcystin production [22]. Intracellular microcystin arises at the same time that mcyH is downregulated, but the more interesting point is in the change in the extracellular amount of toxin (Figure 8B). This microcystin can be released either from the initial cell death observed in Figure 1 and Figure 2, or because lindane could alter the cell wall and the membrane permeability. Observation of the cells by optical microscopy and scanning electron microscopy did not enable any apparent difference in size, surface or shape to be observed (data not shown).
ntcA increased its expression as a consequence of the presence of lindane. This key nitrogen transcriptional regulator exhibits affinity for two fragments of the bidirectional mcyDA promoter and 2-oxoglutarate enhanced its affinity, suggesting that the C to N metabolism balance regulates the microcystin gene cluster [15]. The increase in ntcA transcript can be explained from different points of view. Microcystin synthesis diverts a considerable amount of nitrogen, and the expression of NtcA can be a response to the stress of a lack of nitrogen available for the GS-GOGAT cycle. An increase in NtcA will induce the machinery for the uptake of nitrogen from the media. Other studies have shown that the degradation of lindane in other cyanobacteria was faster and more efficient in the presence of nitrogen [6] and the cell induces the machinery for its intake. On the other hand, nirA expression is enhanced in lindane treated M. aeruginosa. Since the nir operon is supposed to be involved in lindane dechlorination [10], the increase may be indicating that lindane is being degraded. Other transcriptional regulators from the Fur family involved in mcy operon regulation gave different results: furB and furC are not affected (data not shown). The increased amount of furA transcript and the decreased a-furA may again suggest that the cells are under oxidative stress from lindane exposure [17], congruent with the hydrogen peroxide increase (Figure 4), since there is no reason to think that the cells are iron-deficient.

3. Experimental Section

3.1. Growth Conditions

The axenic strain Microcystis aeruginosa PCC7806 was provided by the Pasteur Culture Collection (Paris, France) and grown in BG11 media [23] with 2 mM of NaNO3 as indicated by the Pasteur Institute. Cells were grown in batch conditions with continuous agitation at 25 °C. The cyanobacteria were grown using a light intensity of 40 µmol of photons m−2·s−1, unless indicated. Light was measured using a Quantum Sensor photometer (Skye Instruments, SKP 200). Every culture, control and stressed cell was started with equal aliquots of 0.3 OD (700 nm). When they reached the exponential growth phase (OD 700 nm, 0.6–0.7), they were treated as indicated in each experiment. Experiments were performed in duplicated cell culture of 250 mL in 500 mL Erlenmeyer flasks to avoid substantial volume changes during the sampling. Three different experiments were performed.

3.2. Analytical Methods and Microcystin Quantification

Samples of 1 mL and 5 mL were collected for chlorophyll a and protein determination. Chlorophyll a was extracted with 80% methanol and determined spectrophotometrically, quantified in accordance with the procedure described by Mackiney [24]. Total proteins were quantified according to the bicinchoninic acid (BCA) method (BCA Protein Assay Reagent Kit from Pierce) as previously described [25]. For the microcystin analysis, aliquots of cells (5 mL) were collected and frozen at −20 °C. Samples were taken out with 4 extractions after stirring for 10 min with 80% methanol, 0.1% trifluoroacetic acid (TFA), 0.1% tween and centrifugate at 4000 g for 10 min. The supernatant were pooled, and microcystin quantified using the MicroCystest®, as microcystin-LR equivalents (manufacturer’s information, based on protein-phosphatase inhibition). Carotenoids, phycobiliproteins, and H2O2 production were determined using 5 ml according to previously described methods [26,27,28].
Lindane was removed from the sample by extraction from water by adsorption on a magnetic bar stirrer of polydimethylpolysiloxane (SBSE) and analyzed by gas chromatography and mass spectrometry (GC/MS).

3.3. Cell Counting

The cell density was determined daily both spectrophotometrically and by counting cells with a Neubauer cell. To avoid cell aggregation, the samples were treated with KOH following the Azevedo methodology [2].

3.4. Sampling and RNA Isolation

Sampling was performed very carefully to avoid RNA degradation during manipulation. Aliquots of the cultures (25 mL) were harvested by centrifugation at 4000 g for 4 min at 4 °C. After removing the supernatant, each cell pellet was resuspended in 600 µL of 50 mM Tris-HCl (pH 8), 100 mM EDTA and 130 µL of chloroform and incubated in ice for 3 min to eliminate external RNases. The buffer was removed by centrifugation at 13,000 g for 5 min at 4 °C. Finally, the cell pellets were frozen in liquid nitrogen and kept at −80 °C until RNA isolation was achieved. Cells were lysed using TRIZOL (Invitrogen) according to the manufacturer’s instructions. After the chloroform extraction, RNA was collected from the aqueous layer and precipitated in isopropanol and liquid nitrogen. The RNA pellet was washed twice with 75% ethanol.

3.5. Reverse Transcription (cDNA Synthesis)

Prior to RT-PCR, the total RNA was treated with 40 units of DNase I (Pharmacia) in a volume of 100 µL using a buffer containing 4 mL of 1 M Tris-HCl (pH 7.5) and 0.6 mL 1 M of MgCl2 in DEPC-H2O. The sample was incubated at 37 °C for 1 h. After digestion, the enzyme was inactivated with one extraction of phenol:chloroform and RNA was precipitated with absolute ethanol. The successful digestion of DNA was assessed by PCR with primers targeting the16S rRNA gene (Table 2). RNA integrity was checked using a 1% agarose gel and the concentration was determined by measuring the absorbance at 260 nm. Its purity was assessed by the ratio A260 nm/A280 nm. For reverse transcription, 1 µg of total RNA was mixed with 150 ng of random hexamer primers (Invitrogen Corp.) and diluted with the annealing buffer (10 mM Tris-HCl (pH 8), 1 mM EDTA, 150 mM KCl) to a final volume of 10 µL. The mixture was heated at 85 °C for 10 min and then incubated at 50 °C for 1 h. After that, the RNA was reverse transcribed with 200 U of SuperScriptTM (GibcoBRL) in the presence of 2 µL of deoxyribonucleoside triphosphate mixture (2.5 mM each), 2 µL of dithiothreitol (100 mM) and 4 µL of the 5× buffer provided by the manufacturer with the Reverse Transcriptase enzyme kit. The volume was adjusted to 20 µL in DEPC-H2O. The mixture was incubated at 47 °C for 1 h and finally heated at 75 °C for 15 min.
Table 2. Oligonucleotides used as primers (RT-PCR).
PrimersSequence 5′ → 3′LengthTm (°C)
R16S dirCAAGTCGAACGGGAATCTTC2047
R16S revCTCAAGTACCGTCAGAACTTC21
mcy D dirGAGCATTAAGGGCTAAATCG2045
mcy D revCTTGGTTGCTTCATCAACTC20
mcy J dirGCCGAAGAAACAACTTATAACG2248
mcy J revCTATAGCCAAGCTTCCACCGGG22
RT-mcy H upGGTATGAATGCAGCAG1645
RT-mcy H dwCGCCTGGTTCGATAGG16
ntcA upGGAATTCCATATGGACTTATCATTAATACAAGATAAAC3854
ntcA dwCCCAAGCTTTTAAGTAAATTGTTGACTGAGAG32
furA dirGTCGATCGCCCATGGCTGCCTAC2365
furA revCAGTTGGGAATTCCCGCTAGATG24
αfurA dirCGACGATTTACCGCAGTG1853
αfurA revCACACTGTTTGAGACTGTG19
nirA dirTGCCCATTCTACTCAACCCTA2158
nirA revGTGTCGCTAATCCCCATAGTTG22
fur B myc1 dirCAATCTATGGGWYTAGCTACYGT2360
fur B myc1 rev1CCGCAIARWCCAAAAAATTCIARIGTATG29
fur C myc dirCATYTITCTGCTMGIGAAATTTATGATCC2960
fur C myc revCATGIGAATGIGAATCIGAAATAKTWCC28

3.6. RT-PCR Analysis of Gene Expression

Semi-quantitative RT-PCR assays were performed with the cDNA samples. Specific primer sets were designed to amplify both the studied genes and 16S rRNA (rrs) housekeeping gene (Table 2). The exponential phase of each gene amplification reaction was estimated by measuring the amount of PCR products after different numbers of cycles, and the endogenous reference gene rrs was used to normalize the possible variation in cDNA concentration, as previously described [29]. PCR-amplified DNA fragments were observed by agarose gel electrophoresis 1%, stained with ethidium bromide and analyzed using a Gel Doc 2000 Image Analyzer (Bio-Rad). Samples for at least 3 different Microcystis growth curves were analyzed, with congruent results.

4. Conclusions

The results in this paper suggest that in a lindane polluted environment, Microcystis aeruginosa may enhance its toxicity, producing more microcystin. On the other hand, Microcystis shows capability to degrade γ-lindane and tolerate high concentration of the pollutant. Those facts are of interest first for environmental risk prevention and secondly, they open an interesting research area in bioremediation, with potential use of non-toxic Microcystis strains in lindane-polluted waters. However, the work presented here corresponds to laboratory data, and cannot be simplistically extrapolated to the natural environment.

Acknowledgments

This work was funded by the government of Aragon and “La Caixa” Foundation (2012/GA LC 003), and the Spanish Ministry of Science and Innovation (BFU2012-31458). We would like to thank Francisco Barja (University of Genève, Microbiology Laboratory) for his Microcystis scan microscopy images.

Author Contributions

Laura Ceballos-Laita and Laura Calvo-Begueria performed the growth studies of the cyanobacteria.
Laura Ceballos-Laita performed all the analytical determinations, except lindane
Laura Ceballos-Laita, Laura Calvo-Begueria and Maria Fillat are responsible for the fur family genes expression analysis
Laura Ceballos-Laita, Laura Calvo-Begueria and Maria Luisa Peleato are responsible for the mcy operon, nir and ntcA gene expression analysis.
Jessica Lahoz performed the lindane quantification
Maria Luisa Peleato and Maria Teresa Bes have planned, coordinated and written this work.

Conflicts of Interest

The authors declare no conflict of interest.

References

  1. Carmichael, W.W.; Azevedo, S.M.; An, J.S.; Molica, R.J.; Jochimsen, E.M.; Lau, S.; Rinehart, K.L.; Shaw, G.R.; Eaglesham, G.K. Human fatalities from cyanobacteria: Chemical and biological evidence for cyanotoxins. Environ. Health Perspect. 2001, 109, 663–668. [Google Scholar] [CrossRef] [PubMed]
  2. Codd, G.A.; Morrison, L.F.; Metcalf, J.S. Cyanobacterial toxins: Risk management for health protection. Toxicol. Appl. Pharmacol. 2005, 203, 264–272. [Google Scholar] [CrossRef] [PubMed]
  3. Black, K.; Yilmaz, M.; Phlips, E.J. Growth and toxin production by Microcystis aerugionosa PCC 7806 (Kutzing) Lemmerman at elevated salt concentrations. J. Environ. Prot. 2011, 2, 669–674. [Google Scholar] [CrossRef]
  4. Tillett, D.; Dittmann, E.; Erhard, M.; von Dohren, H.; Borner, T.; Neilan, B.A. Structural organization of microcystin biosynthesis in Microcystis aeruginosa PCC7806: An integrated peptide-polyketide synthetase system. Chem. Biol. 2000, 7, 753–764. [Google Scholar] [CrossRef]
  5. Neilan, B.A.; Pearson, L.A.; Muenchhoff, J.; Moffitt, M.C.; Dittmann, E. Environmental conditions that influence toxin biosynthesis in cyanobacteria. Environ. Microbiol. 2012, 15, 1239–1253. [Google Scholar] [CrossRef] [PubMed]
  6. Kuritz, T.; Wolk, C.P. Use of filamentous cyanobacteria for biodegradation of organic pollutants. Appl. Environ. Microbiol. 1995, 61, 234–238. [Google Scholar] [PubMed]
  7. Kuritz, T. Cyanobacteria as agents for the control of pollution by pesticides and chlorinated organic compounds. J. Appl. Microbiol. 1998, 85 (Suppl. 1), 186S–192S. [Google Scholar] [CrossRef] [PubMed]
  8. Vijgen, J.; Abhilash, P.C.; Li, Y.F.; Lal, R.; Forter, M.; Torres, J.; Singh, N.; Yunus, M.; Tian, C.; Schaffer, A.; Weber, R. Hexachlorocyclohexane (HCH) as new Stockholm Convention POPs—A global perspective on the management of Lindane and its waste isomers. Environ. Sci. Pollut. Res. Intl. 2011, 18, 152–162. [Google Scholar] [CrossRef] [PubMed]
  9. Phillips, T.M.; Seech, A.G.; Lee, H.; Trevors, J.T. Biodegradation of hexachlorocyclohexane (HCH) by microorganisms. Biodegradation 2005, 16, 363–392. [Google Scholar] [CrossRef] [PubMed]
  10. Kuritz, T.; Bocanera, L.V.; Rivera, N.S. Dechlorination of lindane by the cyanobacterium Anabaena sp. strain PCC7120 depends on the function of the nir operon. J. Bacteriol. 1997, 179, 3368–3370. [Google Scholar] [PubMed]
  11. Gonzalez, R.; Garcia-Balboa, C.; Rouco, M.; Lopez-Rodas, V.; Costas, E. Adaptation of microalgae to lindane: A new approach for bioremediation. Aquat. Toxicol. 2012, 109, 25–32. [Google Scholar] [CrossRef] [PubMed]
  12. Qian, H.; Pan, X.; Chen, J.; Zhou, D.; Chen, Z.; Zhang, L.; Fu, Z. Analyses of gene expression and physiological changes in Microcystis aeruginosa reveal the phytotoxicities of three environmental pollutants. Ecotoxicology 2012, 21, 847–859. [Google Scholar] [CrossRef] [PubMed]
  13. Suresh Babu, G.; Hans, R.K.; Singh, J.; Viswanathan, P.N.; Joshi, P.C. Effect of lindane on the growth and metabolic activities of cyanobacteria. Ecotoxicol. Environ. Saf. 2001, 48, 219–221. [Google Scholar] [CrossRef] [PubMed]
  14. Bueno, M.; Fillat, M.F.; Strasser, R.J.; Maldonado-Rodriguez, R.; Marina, N.; Smienk, H.; Gomez-Moreno, C.; Barja, F. Effects of lindane on the photosynthetic apparatus of the cyanobacterium Anabaena: Fluorescence induction studies and immunolocalization of ferredoxin-NADP+ reductase. Environ. Sci. Pollut. Res. Intl. 2004, 11, 98–106. [Google Scholar] [CrossRef]
  15. Kuniyoshi, T.M.; Gonzalez, A.; Lopez-Gomollon, S.; Valladares, A.; Bes, M.T.; Fillat, M.F.; Peleato, M.L. 2-oxoglutarate enhances NtcA binding activity to promoter regions of the microcystin synthesis gene cluster. FEBS Lett. 2011, 585, 3921–3926. [Google Scholar] [CrossRef] [PubMed]
  16. Martin-Luna, B.; Sevilla, E.; Hernandez, J.A.; Bes, M.T.; Fillat, M.F.; Peleato, M.L. Fur from Microcystis aeruginosa binds in vitro promoter regions of the microcystin biosynthesis gene cluster. Phytochemistry 2006, 67, 876–881. [Google Scholar] [CrossRef] [PubMed]
  17. Sevilla, E.; Martin-Luna, B.; Gonzalez, A.; Gonzalo-Asensio, J.A.; Peleato, M.L.; Fillat, M.F. Identification of three novel antisense RNAs in the fur locus from unicellular cyanobacteria. Microbiology 2011, 157, 3398–3404. [Google Scholar] [CrossRef] [PubMed]
  18. Wiedner, C.; Visser, P.M.; Fastner, J.; Metcalf, J.S.; Codd, G.A.; Mur, L.R. Effects of light on the microcystin content of Microcystis strain PCC 7806. Appl. Environ. Microbiol. 2003, 69, 1475–1481. [Google Scholar] [CrossRef] [PubMed]
  19. Fernandez, J.; Arjol, M.A.; Cacho, C. POP-contaminated sites from HCH production in Sabinanigo, Spain. Environ. Sci. Pollut. Res. 2013, 20, 1937–1950. [Google Scholar] [CrossRef] [PubMed]
  20. Sevilla, E.; Martin-Luna, B.; Bes, M.T.; Fillat, M.F.; Peleato, M.L. An active photosynthetic electron transfer chain required for mcyD transcription and microcystin synthesis in Microcystis aeruginosa PCC7806. Ecotoxicology 2012, 21, 811–819. [Google Scholar] [CrossRef] [PubMed]
  21. Zilliges, Y.; Kehr, J.C.; Meissner, S.; Ishida, K.; Mikkat, S.; Hagemann, M.; Kaplan, A.; Borner, T.; Dittmann, E. The cyanobacterial hepatotoxin microcystin binds to proteins and increases the fitness of microcystis under oxidative stress conditions. PLoS ONE 2011, 6, e17615. [Google Scholar] [CrossRef] [PubMed]
  22. Pearson, L.A.; Hisbergues, M.; Borner, T.; Dittmann, E.; Neilan, B.A. Inactivation of an ABC transporter gene, mcyH, results in loss of microcystin production in the cyanobacterium Microcystis aeruginosa PCC 7806. Appl. Environ. Microbiol. 2004, 70, 6370–6378. [Google Scholar] [CrossRef] [PubMed]
  23. Rippka, R.; Deruelles, J.B.; Waterbury, M.; Herdman, M.; Stanier, R.Y. Genetics asignments, strain stories and properties of pure cultures of cyanobacteria. J. Gen. Microbiol. 1979, 11, 1–61. [Google Scholar] [CrossRef]
  24. Mackinney, G. Absorption of light by chlorophyll solutions. J. Biol. Chem. 1941, 140, 109–112. [Google Scholar]
  25. Sevilla, E.; Martin-Luna, B.; Vela, L.; Bes, M.T.; Fillat, M.F.; Peleato, M.L. Iron availability affects mcyD expression and microcystin-LR synthesis in Microcystis aeruginosa PCC7806. Environ. Microbiol. 2008, 10, 2476–2483. [Google Scholar] [CrossRef] [PubMed]
  26. Taylor, R.F.; Davies, B.H. Triterpenoid carotenoids and related lipids. Triterpenoid carotenoid aldehydes from Streptococcus faecium UNH 564P. Biochem. J. 1976, 153, 233–239. [Google Scholar] [CrossRef] [PubMed]
  27. Glazer, A.N.; Apell, G.S.; Hixson, C.S.; Bryant, D.A.; Rimon, S.; Brown, D.M. Biliproteins of cyanobacteria and Rhodophyta: Homologous family of photosynthetic accessory pigments. Proc. Natl. Acad. Sci. USA 1976, 73, 428–431. [Google Scholar] [CrossRef] [PubMed]
  28. Thurman, R.G.; Ley, H.G.; Scholz, R. Hepatic microsomal ethanol oxidation. Hydrogen peroxide formation and the role of catalase. Eur. J. Biochem. 1972, 25, 420–430. [Google Scholar] [CrossRef] [PubMed]
  29. Gonzalez, A.; Bes, M.T.; Barja, F.; Peleato, M.L.; Fillat, M.F. Overexpression of FurA in Anabaena sp. PCC 7120 reveals new targets for this regulator involved in photosynthesis, iron uptake and cellular morphology. Plant Cell Physiol. 2010, 51, 1900–1914. [Google Scholar] [CrossRef] [PubMed]

