Article

Chlorophyll Derivatives from Marine Cyanobacteria with Lipid-Reducing Activities

1
Interdisciplinary Center of Marine and Environmental Research (CIIMAR/CIMAR), University of Porto, Terminal de Cruzeiros de Leixões, Av. General Norton de Matos s/n, 4450-208 Matosinhos, Portugal
2
FCUP, Faculty of Science, Department of Biology, University of Porto, Rua do Campo, Alegre, 4169-007 Porto, Portugal
*
Author to whom correspondence should be addressed.
These authors contributed equally to this paper.
Mar. Drugs 2019, 17(4), 229; https://doi.org/10.3390/md17040229
Submission received: 26 March 2019 / Revised: 11 April 2019 / Accepted: 14 April 2019 / Published: 17 April 2019
(This article belongs to the Special Issue Marine Natural Products and Obesity)

Abstract

:
Marine organisms, particularly cyanobacteria, are important resources for the production of bioactive secondary metabolites for the treatment of human diseases. In this study, a bioassay-guided approach was used to discover metabolites with lipid-reducing activity. Two chlorophyll derivatives were successfully isolated, the previously described 132-hydroxy-pheophytin a (1) and the new compound 132-hydroxy-pheofarnesin a (2). The structure elucidation of the new compound 2 was established based on one- and two-dimensional (1D and 2D) NMR spectroscopy and mass spectrometry. Compounds 1 and 2 showed significant neutral lipid-reducing activity in the zebrafish Nile red fat metabolism assay after 48 h of exposure with a half maximal effective concentration (EC50) of 8.9 ± 0.4 µM for 1 and 15.5 ± 1.3 µM for 2. Both compounds additionally reduced neutral lipid accumulation in 3T3-L1 multicellular spheroids of murine preadipocytes. Molecular profiling of mRNA expression of some target genes was evaluated for the higher potent compound 1, which indicated altered peroxisome proliferator activated receptor gamma (PPARγ) mRNA expression. Lipolysis was not affected. Different food materials (Spirulina, Chlorella, spinach, and cabbage) were evaluated for the presence of 1, and the cyanobacterium Spirulina, with GRAS (generally regarded as safe) status for human consumption, contained high amounts of 1. In summary, known and novel chlorophyll derivatives were discovered from marine cyanobacteria with relevant lipid-reducing activities, which in the future may be developed into nutraceuticals.

1. Introduction

In recent years, the discovery of natural products was extended to new pharmaceutical targets in addition to the traditional targets explored in the past decades, for example, in the search of new anti-obesogenic compounds [1]. Obesity is a complex metabolic disease characterized by an abnormal fat accumulation in adipocytes which are also important regulators of the whole metabolism and homeostasis [2]. This disease is an increasing epidemic, since a considerable percentage of the world’s population is overweight, which is associated with several chronic diseases like diabetes, cardiovascular diseases, and cancer [2,3].
The ineffective pharmacological treatment of current anti-obesity drugs available on the market is due to the limitation of long-term success, potentially dangerous side effects, and high costs [4]. Alternatively, some natural products and derived compounds are being used in the clinic to treat obesity, for example, orlistat, a synthetic derivative of lipostatin isolated from Streptomyces toxytricini [5]. Yoshinone A isolated from the marine cyanobacterium Leptolyngbya sp., and other marine natural products containing a 7-en-γ-pyrone moiety showed promising anti-obesogenic activity [6].
Although the marine environment is a rich source of new natural products with a high range of applications [7], this environment is still largely underexploited due to inaccessibility and difficulties in retrieving these organisms from their habitat into laboratorial cultures. Cyanobacteria, a group of ancient photoautotrophic microorganisms, are interesting resources for natural product discovery in marine environments [8]. These organisms are known to produce a wide range of bioactive secondary metabolites and most often adapt well to laboratorial culture conditions [9,10]. Our in-house cyanobacterial culture collection (LEGEcc) currently harbors about 500 cyanobacterial strains isolated from the Portuguese coast and other environments that overall represent a largely untapped source for discovery of new secondary metabolites [11]. Some natural compounds were already successfully isolated from this collection, for example, hierridin B [12], bartolosides (A–K) [13,14], and portoamides (A–D) [15], all with cytotoxic activity on cancer cell lines.
Zebrafish (Danio rerio) is an attractive model organism for biomedical research. In the study of complex metabolic disorders like obesity, the use of more complex in vivo model systems as small whole animal models can bring significant advantages. For drug discovery, zebrafish assays can be used complementary to rodent assays with easier handling, high predictive validity and cost-efficiency, while compatible with high-throughput screening [16]. Zebrafish possess higher physiological relevance than cellular in vitro models, more interactions between tissues and have genetic homology to mammals, as well as significant similarities in lipid metabolism [16,17]. The original procedure of the zebrafish Nile red fat metabolism assay was published by Jones et al. [18] and analyzed the capacity of compounds to reduce neutral lipids in zebrafish larvae in vivo. The authors concluded that the zebrafish organism model can be used for identifying non-toxic molecules for treating clinical obesity due the conservation of signal transduction pathways that regulate lipid metabolism.
The aim of this study was to uncover new cyanobacterial compounds with lipid-reducing activity using the zebrafish Nile red fat metabolism assay optimized in our laboratory. We report the isolation and structural elucidation of a known and a novel chlorophyll derivative from the marine cyanobacteria Cyanobium sp. LEGE 07175 and Nodosilinea sp. LEGE 06001, respectively. Their lipid-reducing activity was additionally evaluated in a three-dimensional (3D) cell culture model of murine pre-adipocytes. Initial molecular profiling was performed for the more potent compound 1. Furthermore, the presence of 1 was evaluated in different photoautotrophic organisms (Spirulina, Chlorella, spinach, and cabbage), with GRAS (generally regarded as safe) status for human consumption.

2. Results

2.1. Isolation of Compound 1

Compound 1 was obtained as a green dark amorphous solid from the cyanobacterium Cyanobium sp. LEGE 07175. The isolation required several chromatographic steps and was guided by a strong reduction of lipid content observed in the zebrafish Nile red fat metabolism assay. An LC-ESI-LRMS (liquid chromatography-electrospray ionization-low resolution mass spectrometry) analysis revealed a mass consistent with 132-hydroxy-pheophytin a (data not shown), through comparison with spectroscopic data reported on the literature [19,20]. An HR-ESI-MS analysis was performed and showed a monoisotopic m/z 887.5697 value for [M + H]+ consistent with the molecular formula of C55H74N4O6 of 132-hydroxy-pheophytin a (Figure 1). One- and two-dimensional (1D and 2D) NMR experiments and HR-ESI-MS/MS analysis also corroborated this assignment, revealing the typical resonances and correlations of this chlorophyll derivative [19,20].

2.2. Isolation and Sctructure Elucidation of Compound 2

The zebrafish Nile red fat metabolism assay-guided fractionation of the CH2Cl2/MeOH (dichloromethane/methanol) extract of the cyanobacterium Nodosilinea sp. LEGE 06001 yielded compound 2 as a brownish green amorphous solid. The molecular formula was determined as C50H64N4O6 on the basis of HR-ESI-MS data, m/z 817.4522 [M + H]+, which demanded 15 degrees of unsaturation. The 1H and 13C NMR data for compound 2 showed similarities to what was observed for 1, indicating that 2 could be a chlorophyll derivative. Comparison of the HR-ESI-MS/MS data between 1 and 2 suggested that compound 2 bears a farnesyl moiety instead of a phytyl group. The difference between the mass of the pseudomolecular ion at m/z 817.4522 [M + H]+ and the fragment at m/z 609.2697 [M + 2H − farnesyl]+m/z 208.1825) is consistent with the presence of a farnesyl substituent as opposed to phytyl (Δ m/z 279.36; m/z 909.55 [M + Na]+ and m/z 607.20 [M − phytol]+) [18]. Therefore, compound 2 was named 132-hydroxy-pheofarnesin a.
The 1H NMR spectrum of 2 (Table 1) showed all the typical resonances of the porphyrin ring: three singlets and an aromatic methyl multiplet (δH 1.59 m, 3.28 s, 3.44 s, 3.90 s), one methyl triplet (δH 1.72) and two diastereotopic benzylic proton signals (δH 3.64, 3.77) corresponding to an aromatic ethyl substituent, three olefinic singlets (δH 8.71, 9.56, 9.77), a methyl singlet (δH 3.76) corresponding to a methoxy group, and a vinyl moiety (δH 6.19, 6.35, 8.03) with the characteristic exomethylene coupling pattern (J = 18.7 and J = 11.4 Hz). The attached farnesyl moiety was recognized by a large number of overlapping proton signals of aliphatic methylene and methyl functions. Indicative proton resonances were the oxymethylene resonances (δH 4.44, 4.5 at F1), the vinylic resonances for H-F2 (δH 5.14), and H3-F31H 1.61), as well as those for the geminal dimethyl at F111 and F12 (δH 0.85 d).
The 13C NMR and 2D NMR data (COSY, HSQC, and HMBC) for 2 allowed the assignment of all carbons on the porphyrin ring and the location of the functional groups, with the exception of the carboxyl group at C-131 (Figure 2 and Figure S10, Supplementary Materials). The connection between the four pyrrole rings was established by the long-range HMBC correlations (Figure 2) of the olefinic protons H-5 to C-4 (ring A), H-10 to C-8 (ring B), C-11, and C-12 (ring C), and H-20 with C-18 (ring D), C-1, and C-2 (ring A). The presence of the methoxycarbonyl group was deduced from the long-range HMBC correlation of the singlet protons of a methyl group resonating at δH 3.76 H3-134 to a carbonyl carbon (δC 170.8 C-133). This assignment was corroborated by comparison with reported data for similar moieties [19,21,22]. A singlet at δH 6.11 without an HSQC correlation, but with HMBC correlations to C-132, C-133, and C-15 suggested the presence of a hydroxy group in ring E. Its position at C-132 was deduced by the significant low field shifts of carbons at 132 and 15 (δC 100.4 and 102, respectively). Moreover, the HMBC data allowed the connection of the farnesyl moiety to the porphyrin system by a long correlation of the methylene group H2-F1 (δH 4.44/4.5) with the carboxyl group at C-173. The assignments from F1 to F12 were confirmed through 1H-1H TOCSY and 1H-1H COSY experiments (Figure 2 and Figure S12, Supplementary Materials).
The relative stereochemistry of 2 was confirmed by ROESY experiments and comparison with literature data. Strong ROESY interactions between H-17/H2-172 and H2-172/H3-181 indicated that these protons lay on the same side of the molecule plane (Figure S13, Supplementary Materials). Moreover, the alpha (α) orientation of these protons results from the natural biosynthesis of chlorophylls, in which occurs a stereo-specific reduction of the C-17/C-18 bond of ring D [23]. The stereochemistry of the hydroxy group at C-132 varies naturally to an alpha or beta position (δOHβ 5.47 to 5.53 in CDCl3 [19,24]; δOHα 5.35 in CDCl3 [24]). A correlation of the stereochemistry at C-132 was studied in several pheophytin derivatives comparing the shielding level of the H-17 [25]. It was established that, when the hydroxy group was located on the same side of the molecular plane as H-17 (H-17α and OHα-132), the proton was distinctly deshielded, displaying chemical shifts between δH 4.54 and 4.69. By contrast, when the hydroxy group had β orientation and the H-17 had α orientation, there was a lack of significant deshielding, and the chemical shift was between δH 4.13 and 4.29. Thus, despite any strong ROESY signal being observed for this chiral center, the stereochemistry was determined as S (OHβ-132) in accordance with these findings. Therefore, the structure of compound 2 was identified as 132(S)-hydroxy-pheofarnesin a.

2.3. Lipid-Reducing Activity of 1 and 2, but not of Chlorophyll a and b

To characterize the lipid-reducing activity of the two isolated chlorophyll derivatives, the zebrafish Nile red fat metabolism assay was used. Exposure of the zebrafish larvae to compounds 1 and 2 resulted in significant neutral lipid-reducing activity in this assay after 48 h (Figure 3A). A significant decrease in Nile red staining was observed for compound 1 at 10, 5, and 2.5 µg/mL, and for compound 2 at 10 and 5 µg/mL (Figure 3B), with half maximal effective concentration (EC50) values of 8.9 ± 0.4 µM (7.5 ± 0.3 µg/mL) for 1 and 15.5 ± 1.3 µM (12.7 ± 1.3 µg/mL) for 2. Toxicity and malformations were evaluated on zebrafish larvae exposed to these two compounds considering general toxicity (death after 24 h or 48 h) and malformations of larval morphological features. No such adverse effects were observed for both compounds. REV (resveratrol) was used as a positive control at a final concentration of 50 µM and significantly reduced the Nile red lipid staining in all bioassays. The solvent control, 0.1% DMSO (dimethyl sulfoxide), did not cause any observable toxicity or malformations toward the zebrafish larvae. Chlorophylls a and b were tested for lipid-reducing activity in this same assay, but neither reduced the fluorescence intensity of Nile red in any of the tested concentrations (156 ng/mL to 10 µg/mL) as shown in Figure 3B.

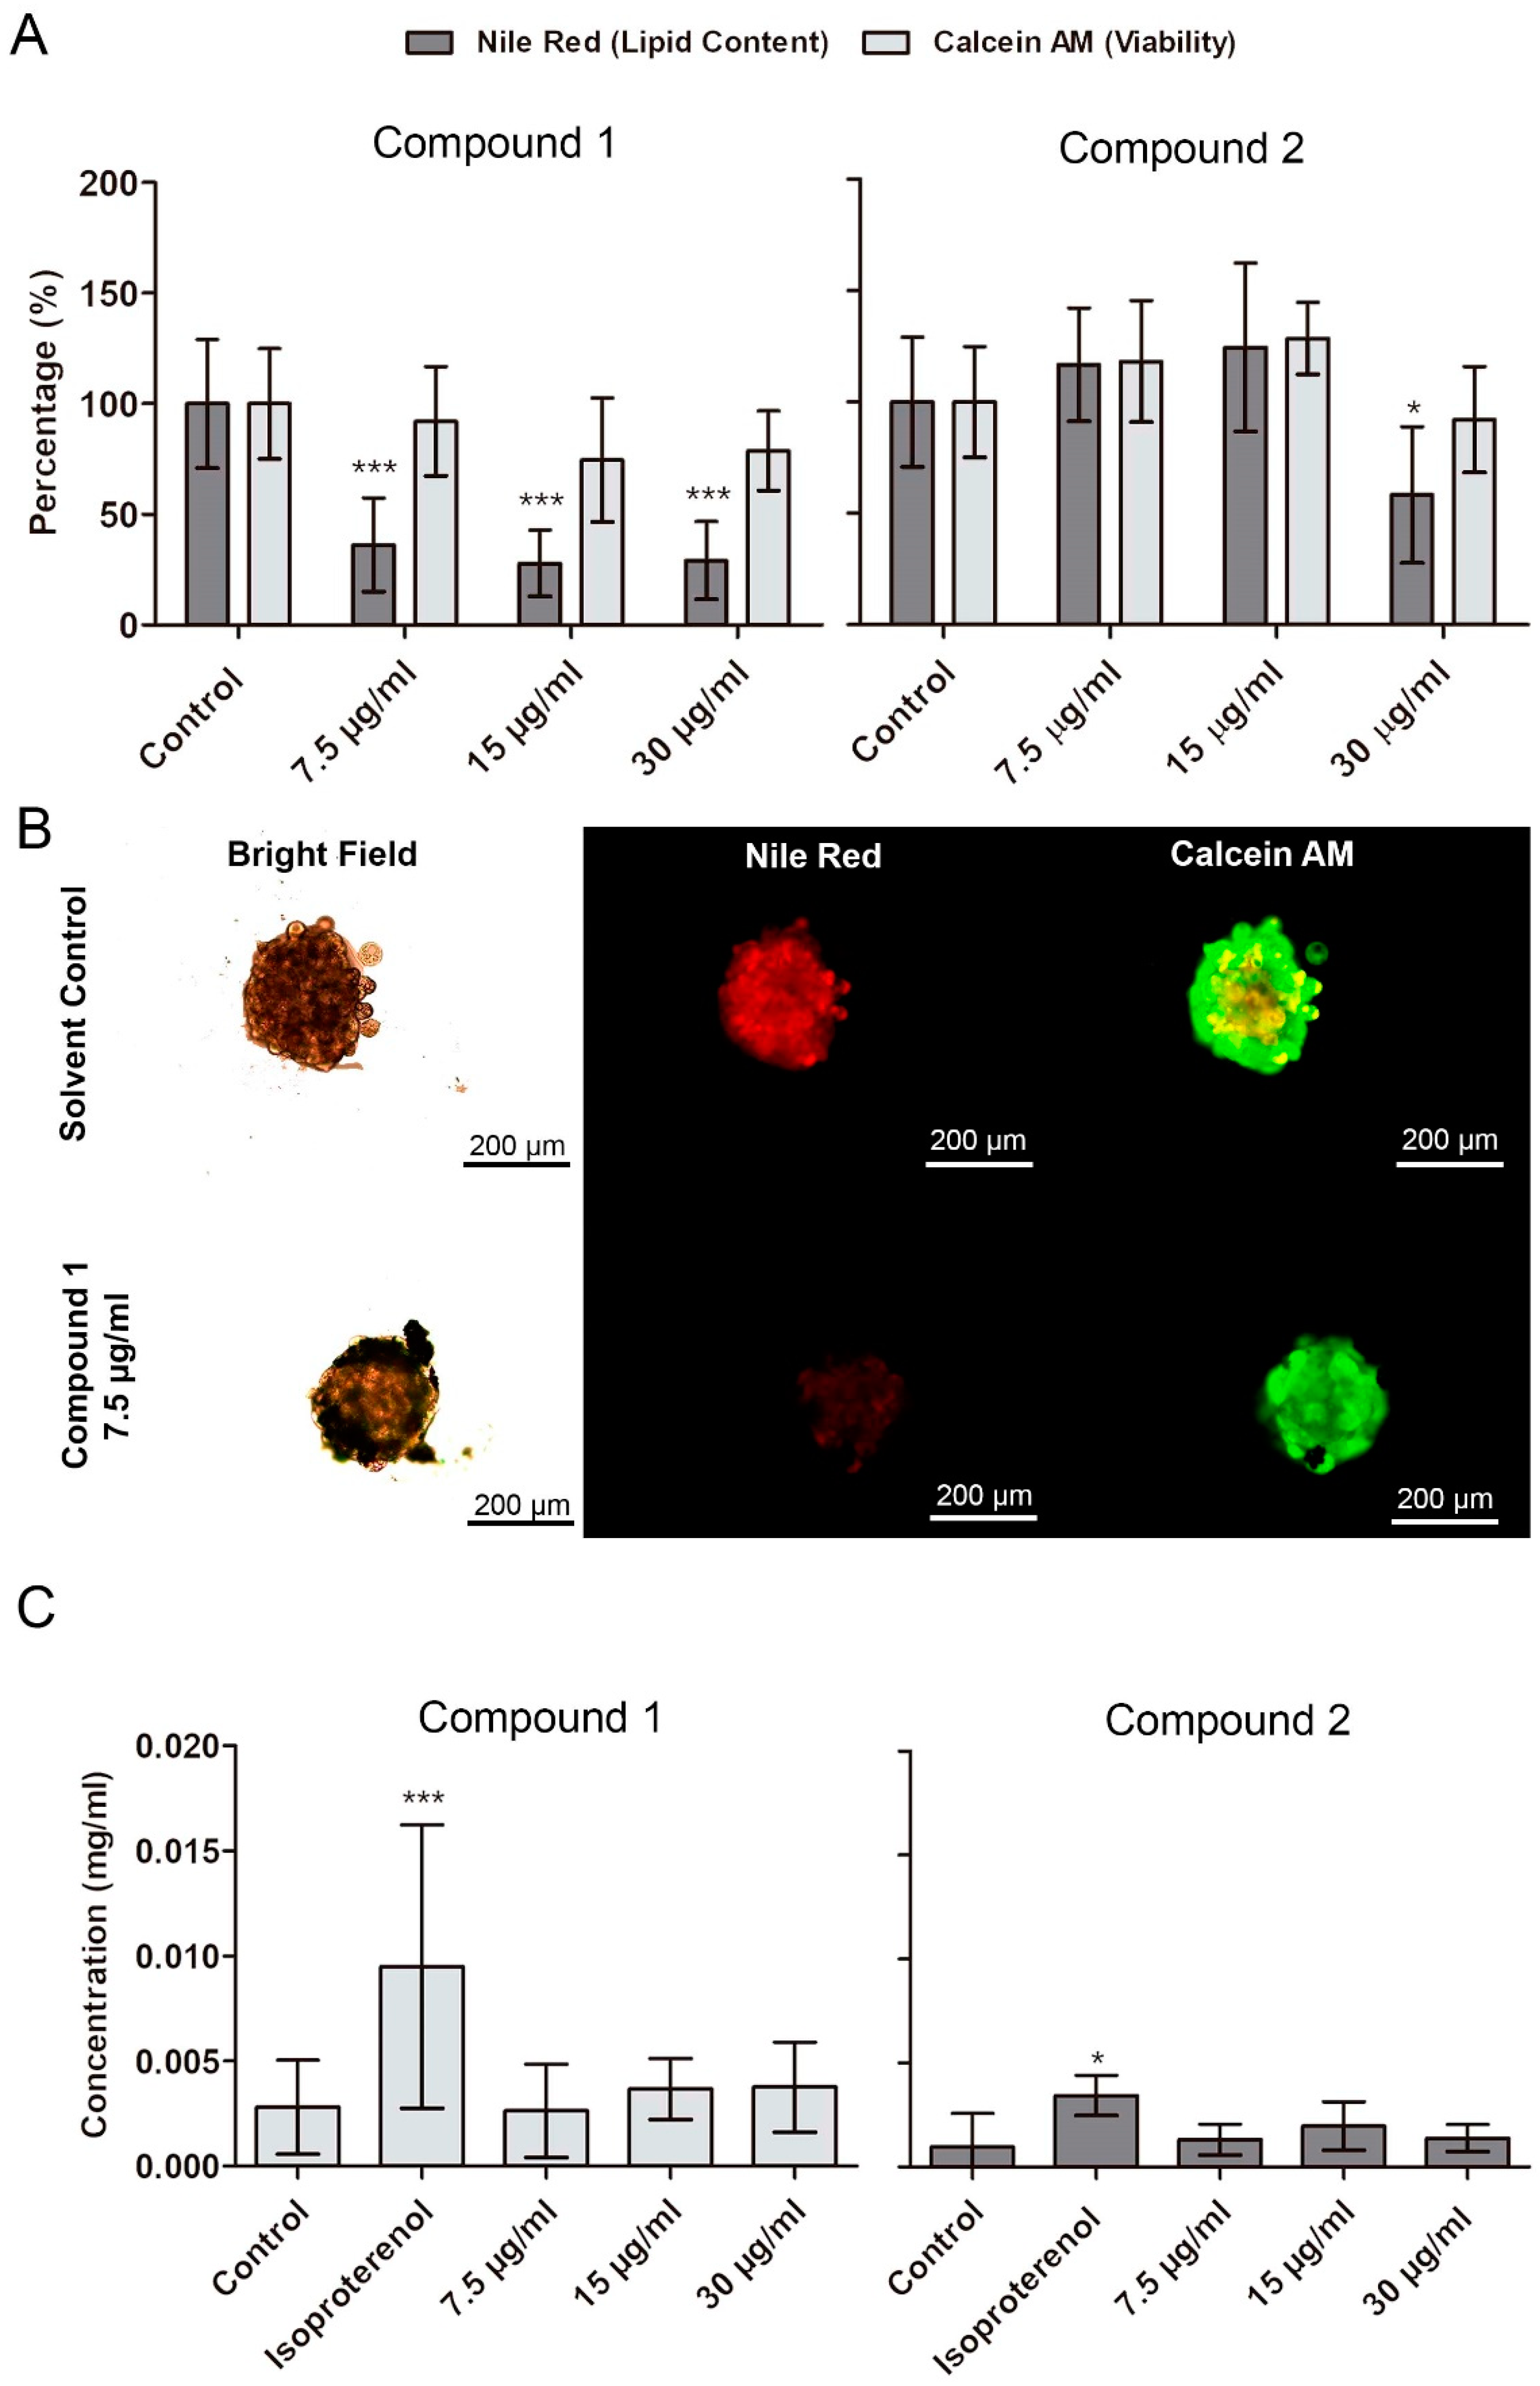
2.4. Confirmation of Lipid-Reducing Activity in Differentiated 3T3-L1 Spheroids, and Analysis of Lipolysis

The lipid-reducing activity of 1 and 2 was evaluated in 3T3-L1 spheroids, obtained after a seven-day differentiation period (Figure S16). A significant reduction of lipid accumulation was observed following 48 h of exposure to 1 at 7.5, 15, and 30 µg/mL, and to 2 at 30 µg/mL (Figure 4A). The concentrations were chosen based on the EC50 values of compound 1 and 2 in the zebrafish fat metabolism assay. The uptake of this lipids was blocked without affecting cell differentiation, since the impairment of lipid accumulation did not occur in spheroids at the beginning of adipogenesis. No significant reduction of viability of spheroids was observed for exposure to 1 and 2 at 7.5 to 30 µg/mL. Lipases hydrolyze triglycerides into glycerol and free fatty acids making the latter available for cell incorporation [26]. By analysis of the free glycerol content, we observed that compounds 1 and 2 did not induce lipolysis on spheroids of differentiated adipocytes.

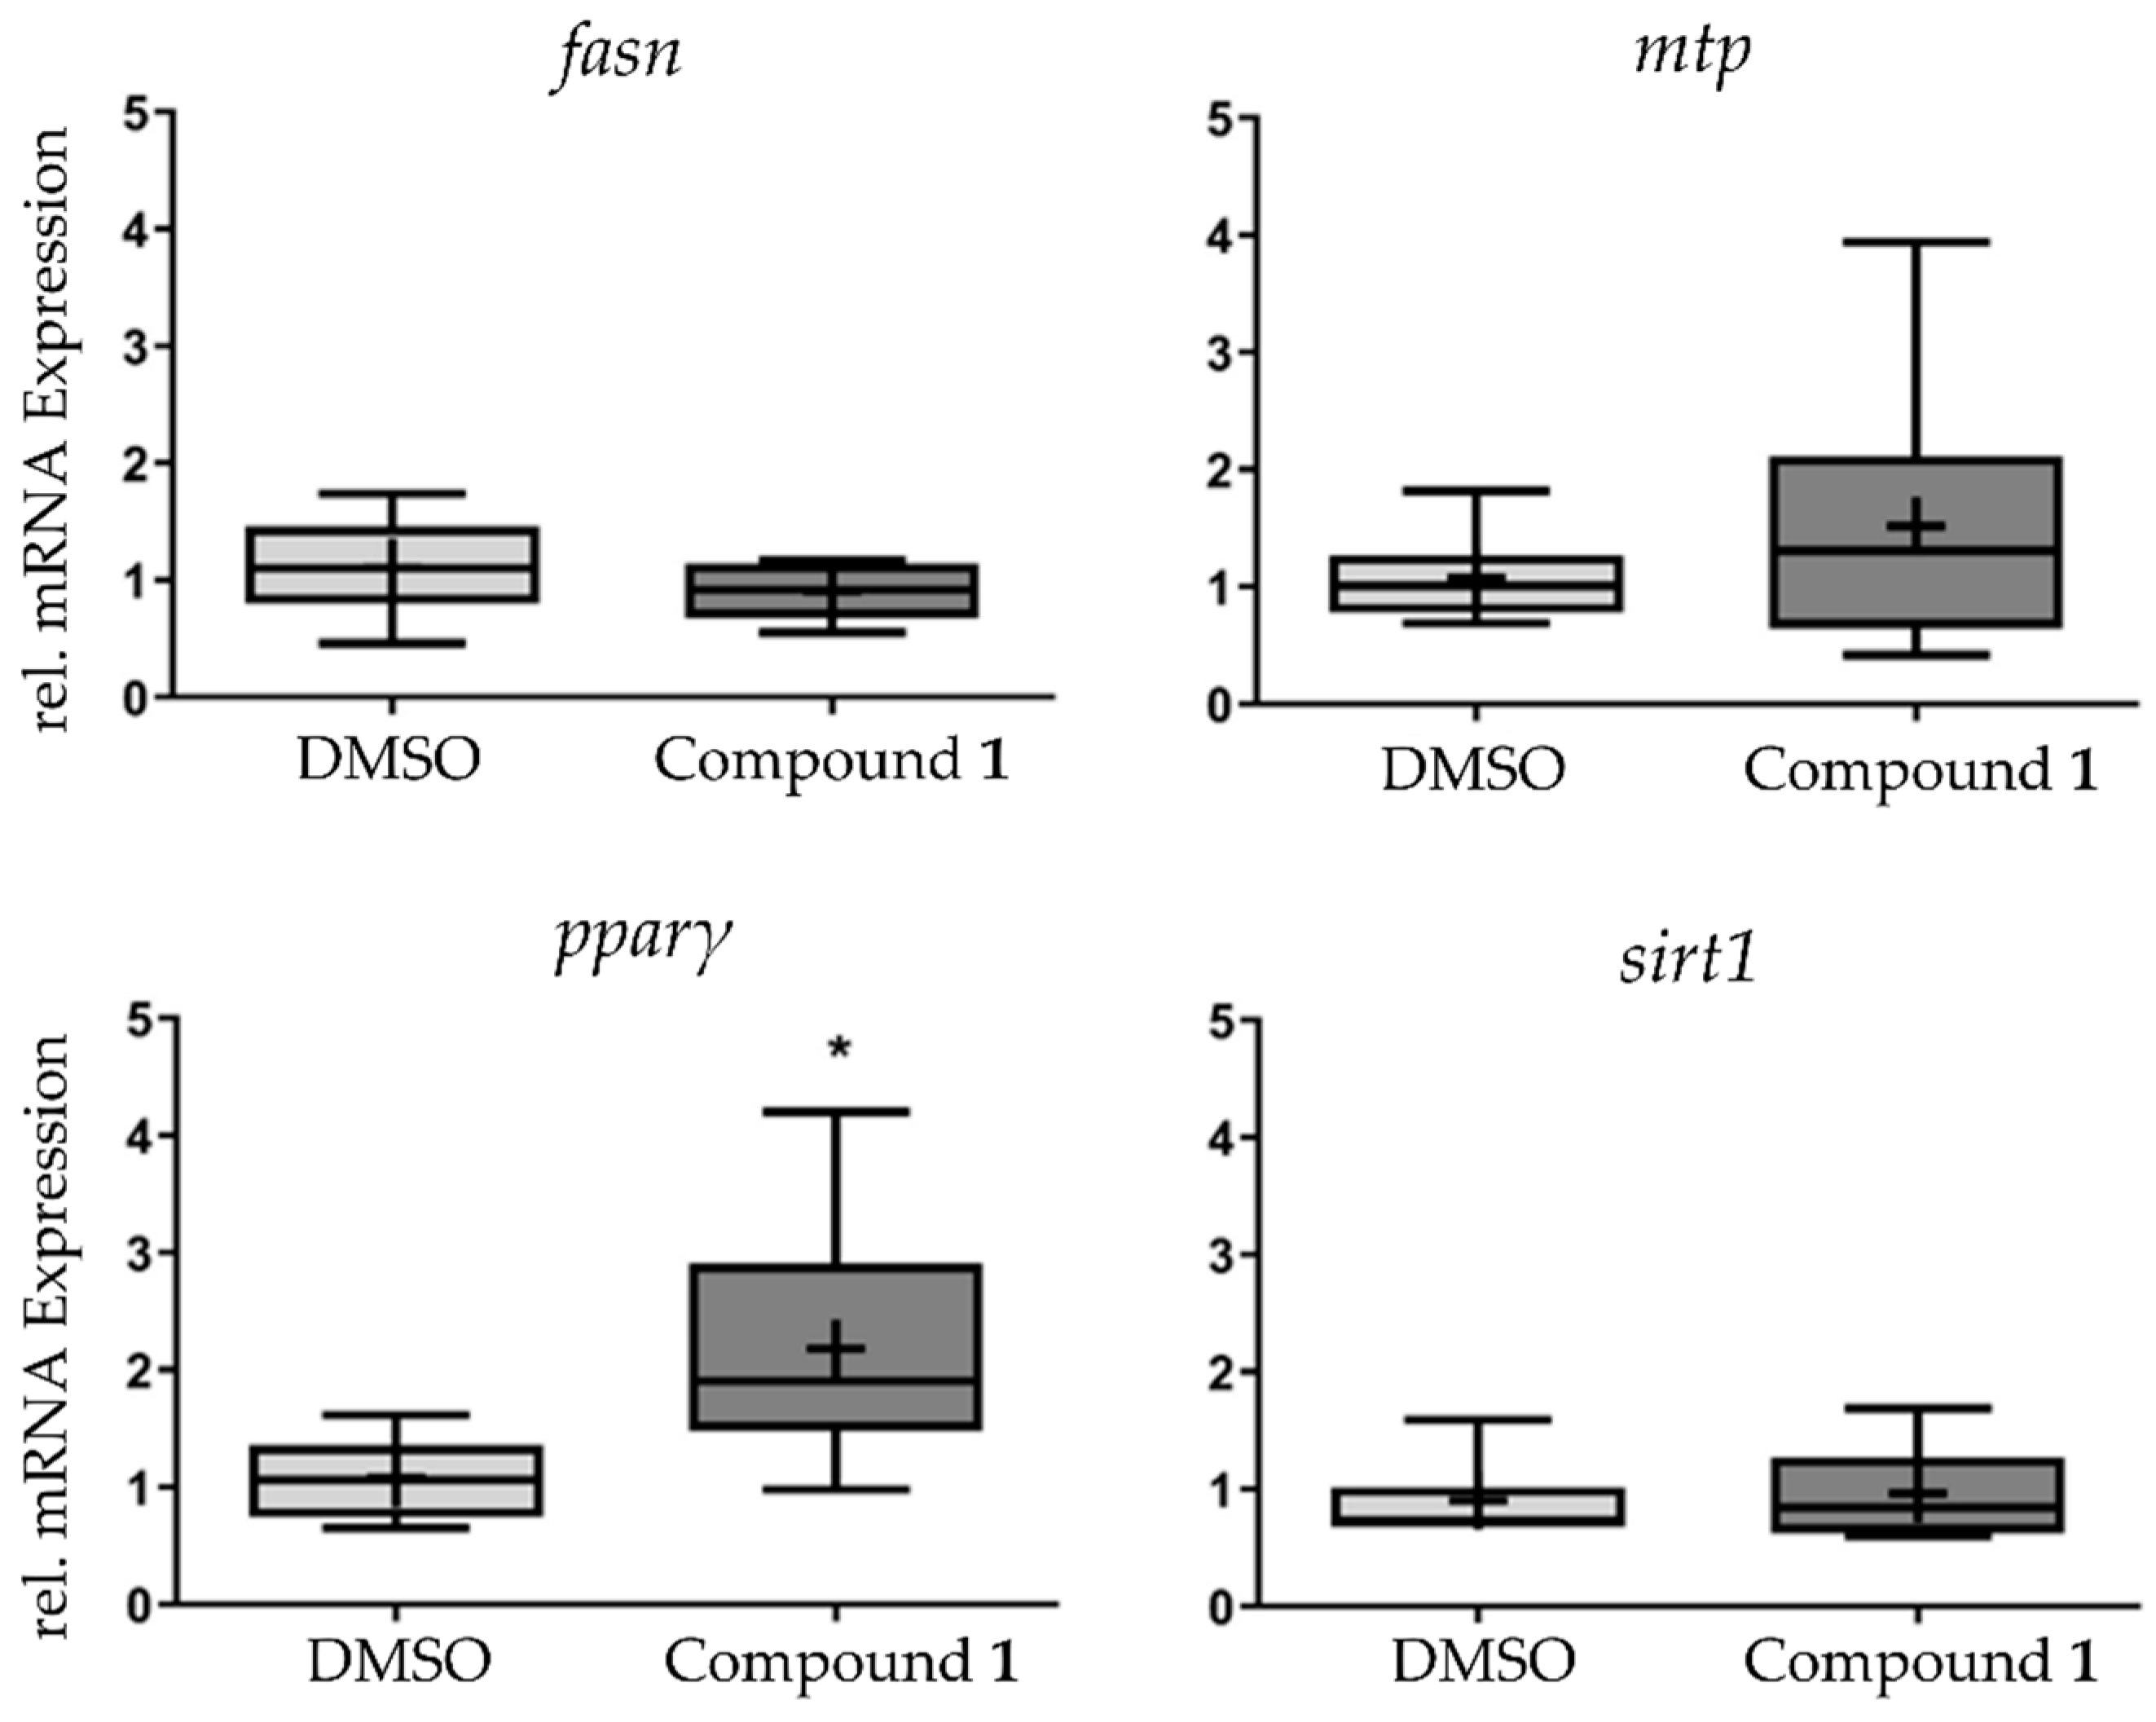
2.5. qPCR Indicates PPARγ for 1

In order to study the effects of 1 in lipid metabolism at the transcriptional level, the messenger RNA (mRNA) expression of fasn, mtp, pparγ, and sirt1 was analyzed in pools of zebrafish larvae, which were exposed to 1 at the EC50 concentration for 48h. Pparγ mRNA was increased two-fold in response to exposure, while the other genes did not show any significant alteration of their mRNA expression level (Figure 5).

2.6. Quantification in Different Source Material of 1

To understand whether metabolite 1 could be found in biomass suitable for human consumption, the presence of the compound was analyzed by LC-ESI-MS in methanolic extyracts derived from various algae- and plant-based materials. When compared to the strain producing 1, i.e., Cyanobium sp. LEGE 07175 (100%), Spirulina sp. biomass contained a slightly higher amount of 1 (120.4%), while lower values were observed for Chlorella vulgaris (18.0%), spinach (14.7%), and cabbage (33.0%), as shown in Figure 6.

3. Discussion

Chlorophylls are among the most abundant biological molecules on earth, essential for photosynthesis and ubiquitous in photoautotrophic organisms including cyanobacteria. Chlorophylls are porphyrins, which comprise closed and completely conjugated rings, also referred to as tetrapyrroles. The structure of chlorophyll a, the most widely distributed chlorophyll in nature, features a chelated magnesium atom in the center of tetrapyrrole macrocycle, a characteristic isocyclic fifth ring (ring E) conjoined with ring C, a vinyl group at carbon-3, a ketone at carbon-131, a carbomethoxy group at carbon-132, and a propionic acid moiety at carbon-17 esterified with phytol [27,28,29,30]. Numerous structural alterations occur naturally for chlorophyll a, for example, the formation of magnesium-free pheophorbides and pheophytins, as well as metallo-chlorophyll derivatives. Pheophytin a and pheophorbide a possess some biological properties beneficial for human health including antioxidant properties [31], anti-inflammatory activity [31,32], anti-mutagenic activity [33], cytotoxic effects on cancer cells [34], antiviral activity against hepatitis C virus [35], antimicrobial activity [36], and induction of neuro-differentiation [37]. Regarding metabolic diseases, pheophytin a and pheophorbide a isolated from Laminaria japonica inhibited the formation of AGE (advanced glycation end-products) (half maximal inhibitory concentration (IC50) 228.71 µM and 49.43 µM, respectively) and of aldose reductase activity (IC50 >100 µM and 12.31 µM, respectively) [38]. Reduction of lipid content in differentiated murine 3T3-L1 preadipocytes was shown for a pheophytin (a and b)-rich extract of a plant at 100 µg/mL [39].
However, for the herein presented chlorophyll derivative 1, only a few bioactivities are known. For example, 132(S)-hydroxy-pheophytin a (compound 1) was shown to have some cytotoxicity (9.9–24.8 µM) on different cancer cells [40]. An anti-proliferative effect on LNCaP cells (prostate cancer) was shown for 1 with an IC50 of 20 µM [41]. A methanolic extract from a red alga containing 1 as a minor component amongst seven other compounds (major peaks were unidentified compounds) showed anti-inflammatory activity in vitro at 10 µg/mL [42]. Here, we observed for the first time the lipid-reducing activity of 1 and of the novel compound 2 in the zebrafish Nile red fat metabolism assay. Both effectively reduced the fluorescent staining of neutral lipids with EC50 concentrations of 8.9 and 15.5 µM, respectively. Interestingly, neither chlorophyll a nor chlorophyll b showed any activity in that same assay, which highlights the importance of the structural differences found in compounds 1 and 2 for the observed lipid-reducing activity. The zebrafish Nile red fat metabolism assay belongs to the category of small whole animal assays, which have a higher physiological relevance compared to the traditionally used cell assays. Zebrafish larvae were shown to react with known lipid modulator drugs in a similar manner as humans [18]. The zebrafish Nile red fat metabolism assay was already successfully used to identify structurally modified polyphenolic compounds with lipid-reducing activity with EC50 values of 0.07–1.67 µM [43], as well as anthraquinone compounds from a marine fungus with EC50 values of 0.17–0.95 µM [44]. In comparison to such studies, chlorophyll derivatives 1 and 2 showed lower potency (micromolar range). However, chlorophyll molecules are ubiquitous to photoautotrophic organisms, and may be easy to purify from sources with GRAS status (generally regarded as safe) for human consumption. Here, we quantified the more potent compound 1 by LC–MS/MS in various sources (Spirulina, Chlorella, cabbage, and spinach) in comparison to our cyanobacterial strain. Compound 1 is produced in a higher quantity in Spirulina, but is also present in lower quantity in cabbage, spinach, or Chlorella. This result is in line with a study that showed that, amongst chlorophylls, the hydroxy-pheophytins are present in low quantity in different microalgae species [45].
The differentiation of murine 3T3-L1 preadipocytes is one of the most used bioassays to identify compounds that interfere with adipogenesis or that act on differentiated adipocytes. In a comparative study utilizing 3T3-L1 adipocytes, zebrafish staining of neutral lipids and the diet-induced obese mice, an effect of chrysophanic acid was detected consistently in all three model systems [46]. Here, we intended to confirm the lipid-reducing activity of 1 and 2 observed for zebrafish larvae in another model system and selected 3T3-L1 preadipocytes. Since 3D cell culture systems present a physiologically relevant alternative to monolayer cell culture, we analyzed the possibility to grow multicellular spheroids (MCS) with 3T3-L1 cells and to induce their differentiation. A similar approach was chosen for immortalized preadipocytes, as well as primary cells from the stromal vascular fractions isolated from adipose tissue from human and mice [47]. Previously, spheroids of 3T3-L1 cells were formed by surface coatings of ELP-PEI (elastin-like polypeptide conjugated to polyethyleneimine), and such spheroids showed higher TG (triglycerides) content and uptake of FA (fatty acids) compared to monolayer cells [48]. The lipid-reducing activity of 1 and 2 was confirmed in MCS from 3T3-L1, as well as the higher potency of 1 that was chosen for the following analyses regarding its molecular mode of action. Toxicity and malformations were evaluated in the same zebrafish whole small animal assay, and, for both 1 and 2, no general toxicity or malformations were observed. Accordingly, exposure of MCS of differentiated 3T3-L1 did not show any significant viability reduction for both compounds.
In order to get initial insights into the mechanism of action of 1, lipolysis was analyzed in the MCS of differentiated 3T3-L1 cells, but such activity was not confirmed. The qPCR analysis of some target genes in zebrafish showed a two-fold induction of pparγ in response to 1. Peroxisome proliferator activated receptors are involved in the regulation of lipid and carbohydrate metabolism, and PPARγ plays a key role in adipocyte differentiation, lipid storage, and lipogenesis [49]. The yolk cells in zebrafish were shown to process lipids during development, and the exposure of zebrafish with a PPARγ antagonist changed the composition of the lipid profile of 5DPF larvae with increasing/decreasing effects on different lipid species, mainly phospholipids [50]. Studies in mice and clinical trials of PPARγ agonists as thiazolidinediones showed that PPARγ had a role on the distribution of body fat [51]. As a response to TZD (thiazolidinedione) treatment, the metabolically more harmful adipose tissue (the visceral adipose tissue) decreased, while subcutaneous adipose tissue increased, which in part explained the beneficial effects of TZD. Hypothetically, the observed pparγ induction in zebrafish in response to 1 may be responsible, to some degree, for the regulation of lipid distribution or alteration of lipid profiles, but our data are not conclusive in this regard. Future studies are needed to identify the mechanism of action of 1.
Recent studies indicated the existence of absorption and metabolization of oxidized chlorophyll derivatives in both in vitro and in vivo models, establishing a good indication for the future success of compound 1 as a nutraceutical. On the one hand, Chen and Roca demonstrated that oxidized derivatives have a preferential absorption in Caco-2 human intestinal cells (heterogeneous human epithelial colorectal adenocarcinoma cells) over phytylated and other chlorophylls [52]. On the other hand, Vieira et al. highlighted that derivatives with phytyl chains are available for absorption from dietary sources and accumulate to be further metabolized in mice liver [53].

4. Materials and Methods

4.1. General Experimental Procedures

One- and two-dimensional (1D and 2D) NMR spectra were acquired with a 400-MHz Bruker Avance III (Bruker, Karlsruhe, Germany) for samples in DMSO-d6 and with a 600-MHz Bruker Avance III HD frequency for samples in CDCl3 and DMSO-d6 (deuterated dimethyl sulfoxide). Both chemical shifts (1H and 13C) are expressed in δ (ppm), referenced to the solvent used, and the proton coupling constants J are given in hertz (Hz). Spectra were assigned using appropriate COSY, HSQC, HMBC, TOCSY, and ROESY sequences.
LC-ESI-HRMS analysis was performed on an UltiMate 3000 HPLC (Thermo Fisher Scientific, Waltham, MA, USA) using an ACE Ultracore 2.5 SuperC18 (ACE, United Kingdom), 75 × 2.1 mm inner diameter (id) and the column oven was set to 40 °C. The samples were eluted at 0.35 mL/min over a gradient of 99.5% solvent A (95% H2O, 5% MeOH, 0.1% v/v HCOOH) to reach 10% solvent B (95% isopropanol, 5% MeOH, 0.1% v/v HCOOH) for 0.5 min, followed by an increase to 60% solvent B for 8 min and by another increase to 90% for 1 min, maintaining those isocratic conditions for over 6 min and returning to the initial conditions for over 1.5 min, before equilibrating for a final 2 min. Analyses were done on a Q Exactive Focus Hybrid Quadrupole Orbitrap Mass Spectrometer (Thermo Fisher Scientific) in the negative and positive ion mode (switching) and controlled by Xcalibur 4.1. The capillary voltage of the heated electrospray ionization (HESI) was set to 3.8 kV. The capillary temperature was 300 °C. The sheath gas and auxiliary gas flow rates were at 35 and 10 (arbitrary units as provided by the software settings).
LC-ESI-HRMS/MS analysis was performed using the same equipment and conditions mentioned previously but with the following gradient: 99.5% solvent A to reach 10% solvent B for 0.5 min, followed by an increase to 60% solvent B for 8 min and by another increase to 90% for 1 min, maintaining those isocratic conditions for over 9 min and returning to the initial conditions for 2 min, before equilibrating for a final 2 min. The UV absorbance of the eluate was monitored at 254 nm, 410 nm, and 665 nm and a full MS scan at the resolution of 70,000 FWHM (full width at half maximum; range of 150–2000 m/z), and data-dependent MS2 (ddMS2, Discovery mode) at the resolution of 17,500 FWHM (isolation window used was 3.0 amu and normalized collision energy was 35).
Reverse-phase HPLC data were obtained with a Waters Alliance e2695 instrument coupled with a PDA (photodiode array) detector (Mildford, MA, USA) for compound 2 and a Waters 1525 binary pump, coupled to a Waters 2487 detector (monitored wavelengths: 230 and 254 nm) for compound 1. The software Empower 2 was used for data interpretation.
Precoated silica gel plates (Merck, KGaA, 60 F-254, 0.5 mm) were used for preparative TLC with visualization under UV light (λ 254 nm).
The phase contrast and red fluorescence images of zebrafish bioassays were obtained with a Leica DM6000B microscope.

4.2. Cyanobacterial Growth, Extraction and Fractionation

Initial screening assays led to the selection of two cyanobacterial strains, Cyanobium sp. LEGE 07175 and Nodosilinea sp. LEGE 06001 isolated from the Portuguese coast [11] and maintained in the LEGEcc in CIIMAR, Matosinhos, Portugal. Strains were cultured in Z8 medium supplemented with marine tropical salt (25 g/L), at 25 °C, with a photoperiod of 14 h/10 h light and dark, respectively, and at a light intensity of 10–30 μmol photons∙m−2∙s−1. Cyanobium sp. LEGE 07175 cultures were grown in 20-L flasks with constant aeration and, at the exponential phase, cells were harvested through centrifugation, before being frozen and freeze-dried. For the Nodosilinea sp. LEGE 06001 strain, available freeze-dried biomass was used, which followed the same growth conditions. The biomass of LEGE 07175 (13 g) and LEGE 06001 (56.5 g) was extracted by repeated percolation with a warm mixture of CH2Cl2/MeOH (2:1, v/v), yielding a crude extract of 1.9 g and 8.74 g, respectively. Both crude extracts were fractionated by normal-phase (Si gel 60, 0.015–0.040 mm, Merck KGaA, Darmstadt, Germany) VLC (vacuum liquid chromatography) with an increasing polarity grade, from 90% n-hex to 100% EtOAc and 100% MeOH [12], giving a total of nine fractions each.

4.3. Compound 1 Isolation and Structure Elucidation

VLC fractions E and F (3:2 and 4:1 EtOAc/n-Hex, v/v; ethyl acetate/hexane) showed a lipid-reducing activity with the zebrafish assay; thus, they were pooled and further sub-fractionated by gravity column chromatography using Si gel 60 (0.040–0.063 mm, Merck KGaA, Darmstadt, Germany) as a stationary phase and a gradient of increasing polarity from 1:3 EtOAc/n-hex (v/v) to MeOH producing 12 fractions. The sub-fractions E4 to E6, eluted in 1:3 to 2:3 EtOAc/n-hex (v/v) demonstrated the previous bioactivity, so they were joined. Then, a SPE (solid-phase extraction) separation was performed, using an Si 5g cartridge (Strata SI-1, Phenomenex) and a gradient of 3:2 EtOAc/n-hex (v/v) to MeOH, yielding 14 fractions. Sub-fractions E4E and E4F eluted in 3:2 EtOAc/n-hex (v/v) demonstrated bioactivity and, thus, were submitted to HPLC using a Synergi 4u Fusion (250 × 10 mm 80 Å RP, Phenomenex, Torrance, California, USA) column and using a linear gradient from 7:3 MeCN (aq; acetonitrile) to MeCN for 30 min, before being maintained for 30 min at MeCN (3 mL/min flow). Compound 1 was isolated as the major component at 60 min RT (real-time), yielding 17 mg of pure compound. It was then subjected to LRMS analysis, with a chromatographic column Luna-C18 (250 mm × 4.6 mm, 5 µm, 100 Å, Phenomenex). Samples were eluted at 0.8 mL/min with a gradient starting with 80% H2O/MeCN and passing to 100% MeCN in 20 min before maintaining in isocratic conditions for 10 min and returning to the initial conditions for 3 min, followed by 5 min of stabilizing. The monoisotopic mass value 887.33 m/z appeared to be the major compound. Through a search of this mass, a hit was found, corresponding to 132-hydroxy-pheophytin a. Then, 1D and 2D NMR analysis, together with HR-ESI-MS and MS/MS analysis, was performed to confirm the hit (Figures S1–S7, Supplementary Materials).
132-hydroxy-pheophytin a (1): green dark powder, HR-ESI-MS m/z 887.5697 [M + H] +, m/z 909.5493 [M + Na] +, C55H74N4O6. HR-ESI-MS/MS m/z 869.5542 [M − OH] +, m/z 609.2696 [M − phytol] +, m/z 591.2602 [M − OH − phytol]+. 13C NMR (101 MHz, DMSO-d6) δ 192.53 (C-131), 172.88 (C-173), 172.46 (C-133), 168.67 (C-19), 160.59 (C-14), 156.19 (C-16), 153.93 (C-1), 151.07 (C-6), 147.35 (C-3), 147.29 (C-11), 146.71 (C-13), 145.42 (C-9), 143.79 (C-8), 141.79 (C-P3), 138.47 (C-4), 135.18 (C-2), 133.78 (C-7), 130.34 (C-31), 128.08 (C-12), 120.01 (C-32), 118.05 (C-P2), 109.61 (C-15), 106.97 (C-10), 99.65 (C-5), 93.24 (C-20), 89.88 (C-132), 60.40 (C-P1), 52.19 (C-134), 48.81 (C-17), 48.66 (C-18), 36.65-23.65 (C-P4-P14), 29.93 (C-171), 29.90 (C-172), 22.76 (C-181), 22.54 (C-P151), 22.45 (C-P16), 19.58 (C-P71), 19.50 (C-P111), 18.88 (C-81) 17.72 (C-82), 15.84 (C-P31), 12.53 (C-121), 12.25 (C-21), 10.87 (C-71) ppm.
1H NMR (400 MHz, DMSO-d6) δ 9.70 (1H, s, H-10), 9.35 (1H, s, H-5), 8.53 (1H, s, H-20), 8.14 (1H, dd, J = 17.7, 11.5 Hz, H-31), 7.24 (1H, s, H-132-OH), 6.23 (1H, dd, J = 17.8, 1.8 Hz, H-32E), 6.02 (1H, dd, J = 11.6, 1.7 Hz, H-32Z), 5.06 (1H, m, H-P2), 4.53 (1H, m, H-17), 4.47 (1H, m, H-18), 4.37 (2H, d, J = 7.1 Hz, H-P1), 3.79 (2H, q, J = 7.6 Hz, H-81), 3.61 (3H, s, H-121), 3.50 (3H, s, H-134), 3.30 (3H, s, H-21), 3.27 (1H, s, H-71), 2.68–1.75 (H-P4-P14), 2.3–1.8 (H-171-H-172), 1.68 (3H, t, J = 7.6 Hz, H-82), 1.55 (3H, d, J = 7.2 Hz, H-181), 0.82 (6H, d, J = 6.6 Hz, H-P151, H-P16), 0.77 (3H, d, J = 6.6 Hz, H-P71), 0.72 (3H, d, J = 6.6 Hz, H-P111) ppm.

4.4. Compound 2 Isolation and Structure Elucidation

Fraction E (35.27 mg), resulting from the VLC separation and eluted with n-hex/EtOAc (2:3, v/v), had the most interesting activity in the zebrafish bioassay, and was, thus, further fractionated over prepacked normal-phase SPE SiO2 cartridges (55 μm, 70 Å, 2 g, Phenomenex) using CH2Cl2/MeOH (from 1:0 to 0:1, v/v), resulting in seven sub-fractions (E1 to E7). Subsequently, sub-fraction E4 eluted with a mixture of CH2Cl2/MeOH (1:0 and 99:1, v/v) had the desirable bioactivity level. This sub-fraction was subjected to another round of SPE chromatography using n-hex/CH2Cl2 (from 7:3 to 0:1, v/v) and CH2Cl2/MeOH (from 1:0 to 0:1, v/v), to provide an additional six sub-fractions (E4A to E4F). The active fraction E4C was submitted to further fractionation through reverse-phase HPLC using a Luna-C18 column (250 mm × 10 mm, 10 µm, 100 Å, Phenomenex, Torrance, CA, USA). The elution was done with a mixture of MeCN/CH2Cl2 (1:1, v/v) in a flow of 3 mL/min for 25 min with a continuously polar gradient MeCN/CH2Cl2 (from 3:2 to 1:1, v/v). This separation afforded three sub-fractions and, according to the result of zebrafish bioassay, fraction E4C11 was further purified by preparative TLC using precoated silica gel plates with a mixture of MeOH/CH2Cl2 (0:1, v/v). The final purification yielded 0.3 mg of compound 2.
132-hydroxy-pheofarnesin a (2): brownish green amorphous solid, HR-ESI-MS m/z 817.4522 [M + H]+, calculated for C50H64N4O6 (816.4825), HR-ESI-MS/MS m/z 840.4339 [M + H + Na]+, 609.2697 [M + 2H – farnesyl]+, 591.2604 [M − OH − farnesyl]+, 13C and 1H NMR (600 MHz, CDCl3) data (see Table 1); for NMR and ESI-MS spectra, see Figures S8–S15 (Supplementary Materials).

4.5. Determination of 132-hydroxy-pheophytin a by LC–MS

For quantification and confirmation of 1, HRMS and HRMS/MS data of the extracts were acquired on an Accela HPLC fitted with a Synergi C18 column (4 μm, 80 A, 4.6 mm id × 250 mm, Phenomenex, Torrance, CA, USA), coupled to an Accela PDA detector, Accela autosampler, and Accela 600 pump, and to an LTQ OrbitrapTM XL hybrid spectrometer, controlled by LTQ Tune Plus 2.5.5 and Xcalibur 2.1 (Thermo Scientific). Firstly, 20 µL of each sample was injected and samples were eluted over a gradient of 10% solvent H2O (0.1% v/v HCOOH) to reach 100% solvent MeCN (0.1% HCOOH) for 20 min at a flow rate of 0.8 mL/min. The wavelengths were 235, 285, and 650 nm. The LTQ spectrometer was operated in positive ion mode, and the capillary voltage of the electrospray ionization source (ESI) was set to 3.1 kV. The capillary temperature was 300 °C. The sheath gas and auxiliary gas flow rates were at 40 and 10 (arbitrary unit as provided by the software settings). The capillary voltage was 36 V and the tube lens voltage was 85 V. MS data handling software (Xcalibur 2.1.0 QualBrowser software, Thermo Fischer Scientific) was used.
Five different samples were used to assess the production of 1: Cyanobium sp. LEGE07175 was obtained from the LEGEcc (as previously described); Spirulina sp. and Chlorella Vulgaris were commercially available; leaves of spinach and cabbage were bought from local supermarkets.
Approximately 1.0 g of powder from each sample was dissolved in 70 mL of MeOH (100%) by stirring for 2h twice at room temperature [54]. The supernatants were collected and dried by a rotatory evaporator to obtain crude extracts. Each extract was then prepared at a concentration of 1 mg/mL for LC–MS, and 0.2 mg/mL for MS/MS in MeOH (100%). A standard of 1 at 16 µg/mL (MeOH 100%) was also prepared for comparison with the samples prior to publication.
Xcalibur 2.1.0 software was used to search for 1 using a reference value interval of 887.50–888.50 m/z. The PDA chromatogram was analyzed at a wavelength of 428 nm, as it was the maximum of absorption of 1. Additionally, this software was used to confirm the presence of 1 in the five different samples through comparison of the mass fragmentation pattern (Figure S17, Supplementary Materials).

4.6. Zebrafish Nile Red Fat Metabolism Assay

The lipid-reducing activity of compounds was analyzed with the zebrafish Nile red assay as previously described [43,44]. An approval by an ethics committee was not necessary for the presented work, since chosen procedures are not considered animal experimentation according to the EC Directive 86/609/EEC for animal experiments. In brief, zebrafish embryos were raised from one DPF (days post fertilization) in egg water (60 µg/mL marine sea salt dissolved in distilled H2O) with 200 µM PTU (1-phenyl-2-thiourea) to inhibit pigmentation. From three DPF to five DPF, zebrafish larvae were exposed to cyanobacterial fractions at a final concentration of 10 µg/mL with daily renewal of water and fractions in a 48-well plate with a density of 6–8 larvae/well (n = 6–8). A solvent control (0.1% DMSO) and positive control (REV, resveratrol, final concentration 50 µM) were included in the assay. Neutral lipids were stained with Nile red overnight at the final concentration of 10 ng/mL. For imaging, the larvae were anesthetized with tricaine (MS-222, 0.03%) for 5 min and fluorescence analyzed with a fluorescence microscope (Olympus, BX-41, Hamburg, Germany). Fluorescence intensity was quantified in individual zebrafish larvae by ImageJ (http://rsb.info.nih.gov/ij/index.html). EC50 values of purified compounds and of chlorophyll a (chl a) and b (chl b) analytical standards (Sigma-Aldrich) were determined by dose–response curves in further assays by using a dilution series from 156 ng/mL to 10 µg/mL in seven dilution steps.

4.7. Differentiated Murine Preadipocytes Grown as Spheroids

Murine preadipocytes 3T3-L1 cell line (ATCC, USA) at 50,000 cells/mL were seeded in an Ultra-Low attachment 96-well plate in Dulbecco’s modified Eagle medium (DMEM, Invitrogen, Carlsbad, CA) supplemented with 10% fetal bovine serum (FBS), 1% penicillin/streptomycin, and 0.1% amphothericin B, and kept under 37 °C at 5% CO2 for five days. Differentiation was then induced on the newly formed spheroids of 3T3-L1 with DMEM supplemented with 10 µg/mL insulin (Sigma-Aldrich, St. Louis, USA), 250 nM dexamethasone (Sigma-Aldrich, St. Louis, MO, USA), and 500 µM isobutylmethylxanthine (Sigma-Aldrich) for three days. The differentiation medium was changed to a maintenance medium containing only insulin (10 µg/mL) on DMEM culture medium, for five days. Spheroids were then exposed to 1 and 2 at three different concentrations, 30 µg/mL, 15 µg/mL, and 7.5 µg/mL, over 48 h in two independent assays with six replicates each (n = 6). After exposure, spheroids were stained with Calcein AM (Life Technologies, Carlsbad, CA, USA ) 3 µM and Nile red 4 µM (Sigma-Aldrich, St. Louis, USA) for 1h, and then fluorescence was quantified in an Olympus BX41 coupled with an Olympus DP47 camera, and images were analyzed with Cell Profiller software [55] followed by statistical analysis.

4.8. Lipolysis

Lipolysis was evaluated by quantifying the free glycerol content present in 50 µL of the medium where 3T3-L1 organoids were exposed to 1 and 2 over 48 h. Then, 80 µL of free glycerol reagent was added (Sigma-Aldrich, St. Louis, USA), and the mixture was incubated at 37 °C for 5 min. Absorbance was recorded at 540 nm. A calibration curve with glycerol standard (0.052 mg/mL) and blank (deionized water) was performed in order to calculate glycerol content (mg/mL) according to the following equation:
(A sample − A blank)/(A standard − A blank) × standard concentration.

4.9. Real-Time PCR

Zebrafish larvae were exposed to 1 and 2 at EC50 concentration and to a solvent control group (DMSO 0.1%) for 48 h between 3DPF and 5DPF as described above. Eight biological replicates consisting of a pool of 10 zebrafish larvae each were sampled per group. The protocol for RNA extraction, quantification, and further processing for real-time PCR analysis followed the one described in Reference [43]. Target gene expression (fatty-acid synthase (FASN), sirtuin 1 (SIRT1), peroxisome proliferator activated receptor gamma (PPARγ), microsomal triglyceride transfer protein (MTP) was normalized to the combination of reference genes (beta-2 microglobulin, B2M/ elongation factor 1-alpha, EF1A). A multiple reference gene approach was chosen for normalization of mRNA expression in order to avoid quantification bias [56]. Real-time PCR was performed using the iQ5 real-time PCR machine (Bio-Rad) and samples were run as described in Reference [57].

4.10. Statistics

The data from bioactivity quantifications and mRNA expression are represented as box-whisker plots with values in 5–95 percentiles. The Gaussian distribution was tested by a Kolmogorov–Smirnov normality test (p value < 0.05), and homogeneity of variance was determined by Bartlett’s test. One-way ANOVA followed by Dunnett post hoc test (parametric distribution) and Kruskal–Wallis followed by Dunn’s post hoc test (non-parametric distribution) were used to compare the solvent control group (DMSO) and the fractions. Statistically significant differences were considered with p-values <0.05.
The data from dose–response curves were used to determine EC50 values for bioactivity level. Mean intensity fluorescence data were normalized to the mean values of the solvent control (100%) and to mean values of the 50 μM resveratrol positive control (0%), and concentrations of the compound were log-transformed. A non-linear regression was applied with a variable slope and least square fitting to obtain the dose–response curves.

5. Conclusions

A known and a novel chlorophyll derivative were discovered from marine cyanobacteria with significant lipid-reducing activities in the zebrafish Nile red fat metabolism assay and in MCS of differentiated 3T3-L1 adipocytes. The more potent compound 1 is produced in large quantities in Spirulina, which has the GRAS status for human consumption. Lipolysis is not involved in the lipid-reducing activity, but pparγ mRNA expression was altered. Regarding its biological properties and sources for production, 1 could be developed as a nutraceutical with lipid reduction activity in the future.

Supplementary Materials

The following are available online at https://www.mdpi.com/1660-3397/17/4/229/s1: Figures S1–S18, the NMR spectra and HR-ESI-MS and HR-ESI-MS/MS chromatograms of compounds 1 and 2.

Author Contributions

S.F., isolation of compound 1, bioactivity screening, qPCR, writing; N.G.S., isolation of compound 2, bioactivity screening, writing; M.L.S., spheroid activity and lipolysis; T.R. and F.R., quantification of compound 1 from different source materials; P.N.L., contribution for isolation and structural elucidation of compound 1; V.V., funding; M.A.R., contribution for isolation and structural elucidation of compound 2; R.U., supervision of bioactivity screening, mechanism of action, funding, and writing.

Funding

This research was funded by the European ERA-NET Marine Biotechnology project CYANOBESITY (ERA-MBT/0001/2015), financed by national funds through FCT (Foundation for Science and Technology, Portugal), and by the project INNOVMAR—Innovation and Sustainability in the Management and Exploitation of Marine Resources (reference NORTE-01-0145-FEDER-000035, within the research line NOVELMAR, supported by North Portugal Regional Operational Program (NORTE 2020) under the PORTUGAL 2020 Partnership Agreement through the European Regional Development Fund (ERDF). The research was additionally supported by the FCT strategic fund UID/Multi/04423/2019. Ralph Urbatzka, Pedro Leão, Maria Lígia Sousa, and Sara Freitas were supported by FCT grants SFRH/BPD/112287/2015, IF/01358/2014, SFRH/BD/108314/2015, and SFRH/BD/116009/2016, respectively.

Conflicts of Interest

The herein reported lipid-reducing activity of the two chlorophyll derivatives formed the basis for a patent application (20191000013283, INPI—Instituto Nacional da Propriedade Industrial), in which some of the authors of the present manuscript are co-inventors.

References

  1. Fu, C.; Jiang, Y.; Guo, J.; Su, Z. Natural products with anti-obesity effects and different mechanisms of action. J. Agric. Food Chem. 2016, 64, 9571–9585. [Google Scholar] [CrossRef] [PubMed]
  2. Castro, M.; Preto, M.; Vasconcelos, V.; Urbatzka, R. Obesity: The metabolic disease, advances on drug discovery and natural product research. Curr. Top. Med. Chem. 2016, 16, 2577–2604. [Google Scholar] [CrossRef] [PubMed]
  3. Fox, C.; Massaro, J.; Hoffmann, U.; Pou, K.; Maurovich-Horvat, P.; Liu, C.; Vasan, R.; Murabito, J.; Meigs, J.; Cupples, L.; et al. Abdominal visceral and subcutaneous adipose tissue compartments: Association Pereira DCR. Circulation 2007, 116, 39–48. [Google Scholar] [CrossRef] [PubMed]
  4. Kang, J.G.; Park, C.-Y. Anti-Obesity Drugs: A Review about Their Effects and Safety. Diabetes Obes. Metab. 2012, 36, 13–25. [Google Scholar] [CrossRef] [PubMed]
  5. Daneschvar, H.L.; Aronson, M.D.; Smetana, G.W. FDA-approved anti-obesity drugs in the United States. Am. J. Med. 2016, 129, e1–e6. [Google Scholar] [CrossRef]
  6. Inuzuka, T.; Yamamoto, K.; Iwasaki, A.; Ohno, O.; Suenaga, K.; Kawazoe, Y.; Uemura, D. An inhibitor of the adipogenic differentiation of 3T3-L1 cells, yoshinone A, and its analogs, isolated from the marine cyanobacterium Leptolyngbya sp. Tetrahedron Lett. 2014, 55, 6711–6714. [Google Scholar] [CrossRef]
  7. Blunt, J.W.; Carrol, A.R.; Copp, B.R.; Davis, R.A.; Keyzers, R.A.; Princep, M.R. Marine natural products. Nat. Prod. Rep. 2018, 35, 8–53. [Google Scholar] [CrossRef] [Green Version]
  8. Luzzatto-Knaan, T.; Garg, N.; Wang, M.; Glukhov, E.; Peng, Y.; Ackemann, G.; Amir, A.; Duggan, B.M.; Ryazanov, S.; Gerwick, L.; et al. Digitizing mass spectrometry data to explore the chemical diversity and distribution of marine cyanobacteria and algae. eLife 2017, 6, e24214. [Google Scholar] [CrossRef]
  9. Brito, A.; Gaifem, J.; Ramos, V.; Glukhov, E.; Dorrestein, P.C.; Gerwick, W.H.; Vasconcelos, V.M.; Mendes, M.V.; Tamagnini, P. Bioprospecting portuguese atlantic coast cyanobacteria for bioactive secondary metabolites reveals untapped chemodiversity. Algal Res. 2015, 9, 218–226. [Google Scholar] [CrossRef]
  10. Sharma, N.K.; Tiwari, S.P.; Tripathi, K.; Rai, A.K. Sustainability and cyanobacteria (blue-green algae): Facts and challenges. J. Appl. Phycol. 2011, 23, 1059–1081. [Google Scholar] [CrossRef]
  11. Ramos, V.; Morais, J.; Castelo-Branco, R.; Pinheiro, A.; Martins, J.; Regueiras, A.; Pereira, A.L.; Lopes, V.R.; Frazão, B.; Gomes, D.; et al. Cyanobacterial diversity held in microbial biological resource centers as a biotechnological asset: The case study of the newly established LEGE culture collection. J. Appl. Phycol. 2018, 30, 1437–1451. [Google Scholar] [CrossRef]
  12. Leão, P.N.; Costa, M.; Ramos, V.; Pereira, A.R.; Fernandes, V.C.; Domingues, V.F.; Gerwick, W.H.; Vasconcelos, V.M.; Martins, R. Antitumor Activity of Hierridin B, a Cyanobacterial Secondary Metabolite Found in both Filamentous and Unicellular Marine Strains. PLoS ONE 2013, 8, e69562. [Google Scholar] [CrossRef]
  13. Leão, P.N.; Nakamura, H.; Costa, M.; Pereira, A.R.; Martins, R.; Vasconcelos, V.; Gerwick, W.H.; Balskus, E.P. Biosynthesis-assisted structural elucidation of the bartolosides, chlorinated aromatic glycolipids from cyanobacteria. Angew. Chem. Int. Ed. Engl. 2015, 54, 11063–11067. [Google Scholar] [CrossRef] [PubMed]
  14. Afonso, T.B.; Costa, M.S.; Rezende de Castro, R.; Freitas, S.; Silva, A.; Schneider, M.P.C.; Martins, R.; Leão, P.N. Bartolosides E-K from a marine coccoid cyanobacterium. Nat. Prod. 2016, 79, 2504–2513. [Google Scholar] [CrossRef] [PubMed]
  15. Ribeiro, T.; Lemos, F.; Preto, M.; Azevedo, J.; Sousa, M.L.; Leão, P.N.; Campos, A.; Linder, S.; Vitorino, R.; Vasconcelos, V.; et al. Cytotoxicity of portoamides in human cancer cells and analysis of the molecular mechanisms of action. PLoS ONE 2017, 12, e0188817. [Google Scholar] [CrossRef] [PubMed]
  16. Nguyen, M.; Yang, E.; Neelkantan, N.; Mikhaylova, A.; Arnold, R.; Poudel, M.K.; Stewart, A.M.; Kalueff, A.V. Developing ‘integrative’ zebrafish models of behavioral and metabolic disorders. Behav. Brain Res. 2013, 256, 172–187. [Google Scholar] [CrossRef]
  17. Oka, T.; Nishimura, Y.; Zang, L.; Hirano, M.; Shimada, Y.; Wang, Z.; Umemoto, N.; Kuroyanagi, J.; Nishimura, N.; Tanaka, T. Diet-induced obesity in zebrafish shares common pathophysiological pathways with mammalian obesity. BMC Physiol. 2010, 10, 21. [Google Scholar] [CrossRef] [PubMed]
  18. Jones, K.S.; Alimov, A.P.; Rilo, H.L.; Jandacek, R.J.; Woollett, L.A.; Penberthy, W.T. A high throughput live transparent animal bioassay to identify non-toxic small molecules or genes that regulate vertebrate fat metabolism for obesity drug development. Nutr. Metab. 2008, 5, 1–11. [Google Scholar] [CrossRef]
  19. Jerz, G.; Arrey, T.N.; Wray, V.; Du, Q.; Winterhalter, P. Structural characterization of 132-hydroxy-(132-S)-phaeophytin-a from leaves and stems of Amaranthus tricolor isolated by high-speed countercurrent chromatography. Innov. Food Sci. Emerg. Technol. 2007, 8, 413–418. [Google Scholar] [CrossRef]
  20. Yaacob, N.S.; Yankuzo, H.M.; Devaraj, S.; Wong, J.K.M.; Lai, C.-S. Anti-Tumor Action, Clinical biochemistry profile and phytochemical constituents of a pharmacologically active fraction of S. crispus in NMU-Induced Rat Mammary Tumour Model. PLoS ONE 2015, 10, e0126426. [Google Scholar] [CrossRef]
  21. Lee, T.H.; Lu, C.K.; Kuo, Y.H.; Lo, J.M.; Lee, C.K. Unexpected novel pheophytin peroxides from the leaves of Biden Pilosa. Helv. Chim. Acta 2008, 91, 79–84. [Google Scholar] [CrossRef]
  22. Li, H.; Li, L.; Zheng, Q.; Kuroda, C.; Wang, Q. Phaeophytin analogues from Ligularia knorringiana. Molecules 2012, 17, 5219–5224. [Google Scholar] [CrossRef] [PubMed]
  23. Masuda, T.; Fujita, Y. Regulation and evolution of chlorophyll metabolism. Photochem. Photobiol. Sci. 2008, 7, 1131–1149. [Google Scholar] [CrossRef]
  24. Matsuo, A.; Ono, K.; Hamasaki, K.; Nozaki, H. Phaeophytins from a cell suspension culture of the liverwort Plagiochila ovalifolia. Phytochemistry 1996, 42, 427–430. [Google Scholar] [CrossRef]
  25. Nakatani, Y.; Ourisson, G.; Beck, J.P. Chemistry and biochemistry of chinese drugs. VII. Cytostatic pheophytins from silkworm excreta, and derived photocytotoxic pheophorbides. Chem. Pharm. Bull. 1981, 29, 2261–2269. [Google Scholar] [CrossRef] [PubMed]
  26. Desarzens, S.; Liao, W.H.; Mammi, C.; Caprio, M.; Faresse, N. Hsp90 blockers inhibit adipocyte differentiation and fat mass accumulation. PLoS ONE 2014, 9, e94127. [Google Scholar] [CrossRef] [PubMed]
  27. Aronoff, S. The chlorophylls—An introductory survey. In The Chlorophylls; Vernon, L.P., Seely, G.R., Eds.; Academic Press: New York, NY, USA, 1996; pp. 3–20. [Google Scholar]
  28. Scheer, H. Structure and occurrence of chlorophylls. In Chlorophylls; Scheer, H., Ed.; CRC Press: Boca Raton, FL, USA, 1991; pp. 3–30. [Google Scholar]
  29. Tanaka, R.; Tanaka, A. Tetrapyrrole biosynthesis in higher plants. Annu. Rev. Plant Biol. 2007, 58, 321–346. [Google Scholar] [CrossRef]
  30. Vavilin, D.V.; Vermaas, W.F. Regulation of the tetrapyrrole biosynthetic pathway leading to heme and chlorophyll in plants and cyanobacteria. Physiol. Plant 2002, 115, 9–24. [Google Scholar] [CrossRef] [PubMed]
  31. Kang, Y.-R.; Park, J.; Jung, S.K.; Chang, Y.H. Synthesis, characterization, and functional properties of chlorophylls, pheophytins, and Zn-pheophytins. Food Chem. 2018, 245, 943–950. [Google Scholar] [CrossRef]
  32. Subramoniam, A.; Asha, V.V.; Nair, S.A.; Sasidharan, S.P.; Sureshkumar, P.K.; Rajendran, K.N.; Karunagaran, D.; Ramalingam, K. Chlorophyll revisited: Anti-inflammatory activities of chlorophyll a and inhibition of expression of TNF-α gene by the same. Inflammation 2012, 35, 959–966. [Google Scholar] [CrossRef] [PubMed]
  33. Ferruzzi, M.; Böhm, V.; Courtney, P.; Schwartz, S. Antioxidant and antimutagenic activity of dietary chlorophyll derivatives determined by radical scavenging and bacterial reverse mutagenesis assays. J. Food Sci. Technol. 2002, 67, 2589–2595. [Google Scholar] [CrossRef]
  34. Zhao, Y.; Wang, X.; Wang, H.; Liu, T.; Xin, Z. Two new noroleanane-type triterpene saponins from the methanol extract of Salicornia herbacea. Food Chem. 2014, 151, 101–109. [Google Scholar] [CrossRef]
  35. Wang, S.-Y.; Tseng, C.-P.; Tsai, K.-C.; Lin, C.-F.; Wen, C.-Y.; Tsay, H.-S.; Sakamoto, N.; Tseng, C.-H.; Cheng, J.-C. Bioactivity-guided screening identifies pheophytin a as a potent anti-hepatitis C virus compound from Lonicera hypoglauca Miq. Biochem. Biophys. Res. Commun. 2009, 385, 230–235. [Google Scholar] [CrossRef] [PubMed]
  36. Gomes, R.A.; Teles, Y.C.; Pereira, F.D.; Rodrigues, L.A.; Lima, E.D.; Agra, M.D.; Souza, M.D. Phytoconstituents from Sidastrum micranthum (A. St.-Hil.) Fryxell (Malvaceae) and antimicrobial activity of pheophytin a. Braz. J. Pharm. Sci. 2015, 51, 861–867. [Google Scholar] [CrossRef]
  37. Ina, A.; Hayashi, K.-I.; Nozaki, H.; Kamei, Y. Pheophytin A, a low molecular weight compound found in the marine brown alga Sargassum fulvellum, promotes the differentiation of PC12 cells. Int. J. Dev. Neurosci. 2007, 25, 63–68. [Google Scholar] [CrossRef]
  38. Sharifuddin, Y.; Chin, Y.-X.; Lim, P.-E.; Phang, S.-M. Potential bioactive compounds from seaweed for diabetes management. Mar. Drugs 2015, 13, 5447–5491. [Google Scholar] [CrossRef]
  39. Semaan, D.G.; Igoli, J.O.; Young, L.; Gray, A.I.; Rowan, E.G.; Marrero, E. In vitro anti-diabetic effect of flavonoids and pheophytins from Allophylus cominia Sw. on the glucose uptake assays by HepG2, L6, 3T3-L1 and fat accumulation in 3T3-L1 adipocytes. J. Ethnopharmacol. 2018, 216, 8–17. [Google Scholar] [CrossRef]
  40. Cheng, H.H.; Wang, H.K.; Ito, J.; Bastow, K.F.; Tachibana, Y.; Nakanishi, Y.; Xu, Z.; Luo, T.Y.; Lee, K.H. Cytotoxic pheophorbide-related compounds from Clerodendrum calamitosum and C. cyrtophyllum. J. Nat. Prod. 2001, 64, 915–919. [Google Scholar] [CrossRef] [PubMed]
  41. Chen, R.; He, J.; Tong, X.; Tang, L.; Liu, M. The Hedyotis diffusa Willd. (Rubiaceae): A review on phytochemistry, pharmacology, quality control and pharmacokinetics. Molecules 2016, 21, 710. [Google Scholar] [CrossRef]
  42. Shu, M.H.; Appleton, D.; Zandi, K.; AbuBakar, S. Anti-inflammatory, gastroprotective and antiulcerogenic effects of red algae Gracilaria changii (Gracilariales, Rhodophyta) extract. BMC Complement. Altern. Med. 2013, 13, 61. [Google Scholar] [CrossRef]
  43. Urbatzka, R.; Freitas, S.; Palmeira, A.; Almeida, T.; Moreira, J.; Azevedo, C.; Afonso, C.; Correia-da-Silva, M.; Sousa, E.; Pinto, M.; et al. Lipid reducing activity and toxicity profiles of a library of polyphenol derivatives. Eur. J. Med. Chem. 2018, 151, 272–284. [Google Scholar] [CrossRef] [PubMed]
  44. Noinart, J.; Buttachon, S.; Dethoup, T.; Gales, L.; Pereira, J.A.; Urbatzka, R.; Freitas, S.; Lee, M.; Silva, A.M.S.; Pinto, M.M.M.; et al. A new ergosterol analog, a new bis-anthraquinone and anti-obesity activity of anthraquinones from the marine sponge-associated fungus Talaromyces stipitatus KUFA 0207. Mar. Drugs 2017, 16, 15. [Google Scholar] [CrossRef] [PubMed]
  45. Yao, L.; Gerde, J.A.; Lee, S.L.; Wang, T.; Harrata, K.A. Microalgae lipid characterization. J. Agric. Food Chem. 2015, 63, 1773–1787. [Google Scholar] [CrossRef] [PubMed]
  46. Lim, H.; Park, J.; Kim, H.-L.; Kang, J.; Jeong, M.-Y.; Youn, D.-H.; Jung, Y.; Kim, Y.-I.; Kim, H.-J.; Ahn, K.S.; et al. Chrysophanic acid suppresses adipogenesis and induces thermogenesis by activating AMP-activated protein kinase alpha in vivo and in vitro. Front. Pharmacol. 2016, 7, 476. [Google Scholar] [CrossRef] [PubMed]
  47. Klingelhutz, A.J.; Gourronc, F.A.; Chaly, A.; Wadkins, D.A.; Burand, A.J.; Markan, K.R.; Idiga, S.O.; Wu, M.; Potthoff, M.J.; Ankrum, J.A. Scaffold-free generation of uniform adipose spheroids for metabolism research and drug discovery. Sci. Rep. 2018, 8, 523. [Google Scholar] [CrossRef] [Green Version]
  48. Turner, P.A.; Harris, L.M.; Purser, C.A.; Baker, R.C.; Janorkar, A.V. A surface-tethered spheroid model for functional evaluation of 3T3-L1 adipocytes. Biotechnol. Bioeng. 2014, 111, 174–183. [Google Scholar] [CrossRef] [PubMed]
  49. Hihi, A.K.; Michalik, L.; Wahli, W. PPARs: Transcriptional effectors of fatty acids and their derivatives. Cell. Mol. Life Sci. 2002, 59, 790–798. [Google Scholar] [CrossRef]
  50. Fraher, D.; Sanigorski, A.; Mellett, N.A.; Meikle, P.J.; Sinclair, A.J.; Gibert, Y. Zebrafish embryonic lipidomic analysis reveals that the yolk cell is metabolically active in processing lipid. Cell Rep. 2016, 14, 1317–1329. [Google Scholar] [CrossRef]
  51. Chiarelli, F.; Di Marzio, D. Peroxisome proliferator-activated receptor-γ agonists and diabetes: Current evidence and future perspectives. Vasc. Health Risk Manag. 2008, 4, 297–304. [Google Scholar] [CrossRef]
  52. Chen, K.; Roca, M. In vitro bioavailability of chlorophyll pigments from edible seaweeds. J. Funct. Foods 2018, 41, 25–33. [Google Scholar] [CrossRef]
  53. Vieira, I.; Chen, K.; Ríos, J.J.; Benito, I.; Pérez-Gálvez, A.; Roca, M. First-Pass Metabolism of Chlorophylls in Mice. Mol. Nutr. Food Res. 2018, 17, e1800562. [Google Scholar] [CrossRef] [PubMed]
  54. Henriques, M.; Silva, A.; Rocha, J. Extraction and quantification of pigments from a marine microalga: A simple and reproducible method. Appl. Microbiol. 2007, 2, 586–893. [Google Scholar]
  55. Carpenter, A.E.; Jones, T.R.; Lamprecht, M.R.; Clarke, C.; Kang, I.H.; Friman, O.; Guertin, D.A.; Chang, J.H.; Lindquist, R.A.; Moffat, J.; et al. CellProfiler: Image analysis software for identifying and quantifying cell phenotypes. Genome Biol. 2006, 7, R100. [Google Scholar] [CrossRef] [PubMed]
  56. Urbatzka, R.; Galante-Oliveira, S.; Rocha, E.; Castro, L.F.; Cunha, I. Normalization strategies for gene expression studies by real-time PCR in a marine fish species, Scophthalmus maximus. Mar. Genom. 2013, 10, 17–25. [Google Scholar] [CrossRef] [PubMed]
  57. Freitas, S.; Martins, R.; Costa, M.; Leão, P.N.; Vitorino, R.; Vasconcelos, V.; Urbatzka, R. Hierridin B isolated from a marine cyanobacterium alters VDAC1, mitochondrial activity, and cell cycle genes on HT-29 colon adenocarcinoma cells. Mar. Drugs 2016, 14, 158. [Google Scholar] [CrossRef] [PubMed]
Figure 1. Planar structure of compounds 1 and 2.
Marinedrugs 17 00229 g001
Figure 2. Key 13C-1H HMBC, 1H-1H COSY, and 1H-1H TOCSY correlations for 2.
Marinedrugs 17 00229 g002
Figure 3. (A) Representation of the zebrafish Nile red fat metabolism assay. Strong fluorescence signal is present in zebrafish larvae from the solvent control around the yolk sac and stomach/intestine. Compounds 1 and 2 decreased the Nile red staining, in contrast to chlorophyll a and b. (B) Quantification of lipid-reducing activity in the zebrafish Nile red fat metabolism assay after exposure over 48 h. Solvent control was 0.1% dimethyl sulfoxide (DMSO) and positive control was 50 µM resveratrol (REV). Values are expressed as mean fluorescence intensity (MFI) relative to the DMSO group and are derived from six to eight individual larvae per treatment group. The data are represented as box-whisker plots from the fifth to 95th percentiles. Asterisks highlight significant altered fluorescence intensities that indicate changes of neutral lipid level (**** p < 0.0001; *** p < 0.001; ** p < 0.01; * p < 0.05).
Marinedrugs 17 00229 g003
Figure 4. Quantification of lipid content (Nile red) and viability (calcein AM) in differentiated 3T3-L1 spheroids after exposure to 1 and 2 over 48 h. (A) Results of quantification of fluorescence by CellProfiler software (mean ± SD). (B) Representative images from fluorescence microscopy. Statistical differences to the solvent control were analyzed by one-way ANOVA, followed by a Dunnett’s multiple comparison post-test (*** p <0.001, ** p < 0.01, * p < 0.05). (C) Quantification of free glycerol on the medium where 3T3-L1 organoids were exposed to 1 and 2 over 48 h. Data represent means ± SD. No significant alterations on free glycerol content in the medium were observed. Kolmogorov–Smirnov test was used to test normality of the data, followed by a Dunnett’s multiple comparison post-test (*** p <0.001, ** p < 0.01, * p < 0.05).
Marinedrugs 17 00229 g004
Figure 5. Analysis of messenger RNA (mRNA) expression of fasn, mtp, pparγ, and sirt1 after exposure to 1 at the half maximal effective concentration (EC50) for 48 h. Data are presented as box-whisker plots (5–95%) from n = 8 replicates, consisting of each replicate from a pool of 10 zebrafish larvae. Significant differences are presented as asterisks, * p < 0.05.
Marinedrugs 17 00229 g005
Figure 6. Comparative quantification of 1 in different materials. (A) Quantification data are shown as percentage relative to the producing strain of 1. Samples were prepared at 1 mg/mL in MeOH (100%). (B) LC-ESI-MS analysis of the selected samples showing the presence of 1 in all selected materials, compared to the standard (compound 1) retention time. The peaks selected for analysis had a mass range of m/z 887.5593–887.5793 and the following retention times: Compound 1, 29.67 min; LEGE 07175, 30.27 min; Spirulina sp., 29.41 min; Chlorella vulgaris, 29.54 min; spinach, 29.42 min; and cabbage, 28.97 min.
Marinedrugs 17 00229 g006
Table 1. 1H and 13C (600 MHz) data (δ, ppm) of compound 2 at 600 MHz in CDCl3 (deuterated chloroform).
PositionδH (J in Hz)δCPositionδH (J in Hz)δC
1 141.315 102.0/100.4 2
2 131.516 166.3
2 13.44 s11.5174.07 dd (7.4)53.1
3 133.417 12.56 dd (7.7)
1.83 dd (9.1)
30.7
3 18.03 dd (11.5, 17.8)128.317 22.46 m
2.17 m
31.7
3 26.35 d (18.7)
6.19 d (11.4)
122.1173 173.4
4 135.9184.46 m (7.8)49.7
59.56 s99.118 11.59 m21.7
6 155.719 171
7 136.6208.71 s93.3
7 13.28 s10.8F14.5 m 4.44 m (6.8)60.8
8 145.6F25.14 t (6.5)117.1
8 13.77 m
3.64 m
19.0F3
8 21.72 t (7.7)17.0F3 11.61 s15.8
9 149.9F41.89 m (7.7)39.9
109.77 s103.4F51.29 m (7.4)22-24 1
11 128.8F61.01 m36.6
12 131.5F71.33 m32.1
12 13.90 s11.9F7 10.8 m19.2
13 133.2F82.35 t (7.5)32.6
13 1 1F91.65 m (7.3)24.3
13 2-OH6.11 s110.4/102.0 2F101.11 m38.9
133 170.8F111.51 m27.4
134-OCH33.76 s53.4F11 10.85 m (6.6)22.1
14 140.2F120.85 m (6.6)22.1
1 13C spectra signal not detected or very-low-intensity signal. 2 Assignment undetermined due lack of specific correlations.

