Figure 1.
Molecular organization of the SARS-CoV-2 envelope (coronavirus credit: Maria Voigt/RCSB PDB). The spikes (colored pale green) protruding at the surface of the virus consist of homotrimers of the S-glycoprotein.
Figure 1.
Molecular organization of the SARS-CoV-2 envelope (coronavirus credit: Maria Voigt/RCSB PDB). The spikes (colored pale green) protruding at the surface of the virus consist of homotrimers of the S-glycoprotein.
Figure 2.
Molecular modeling of lectin from Grateloupia chiangii. (A) Lateral view of the ribbon diagram of the modeled lectin from Grateloupia chiangii (GCL), in complex with mannose (M, colored purple). The lectin dimer consists of the association of two differently oriented protomers exhibiting a β-trefoil fold. Man residues occupying the three CBS of the second protomer are represented. (B) Network of hydrogen bonds (black dashed lines) anchoring Man (M) to the amino acid residues Q31, N35, and Y39, forming the CBS-I of GCL. Aromatic residues Y39 and Y56 participating in stacking interactions with the pyranose ring of Man, are colored orange. (C) Molecular surface (colored slate green) at the CBS-I of GCL, forming a depression (delineated by a yellow dashed line) harboring the Man (M, colored purple) linked by a network of hydrogen bonds (black dashed lines) to Q31, N35, and Y39 residues, and stacking interactions with Y39 and Y56 residues (colored orange).
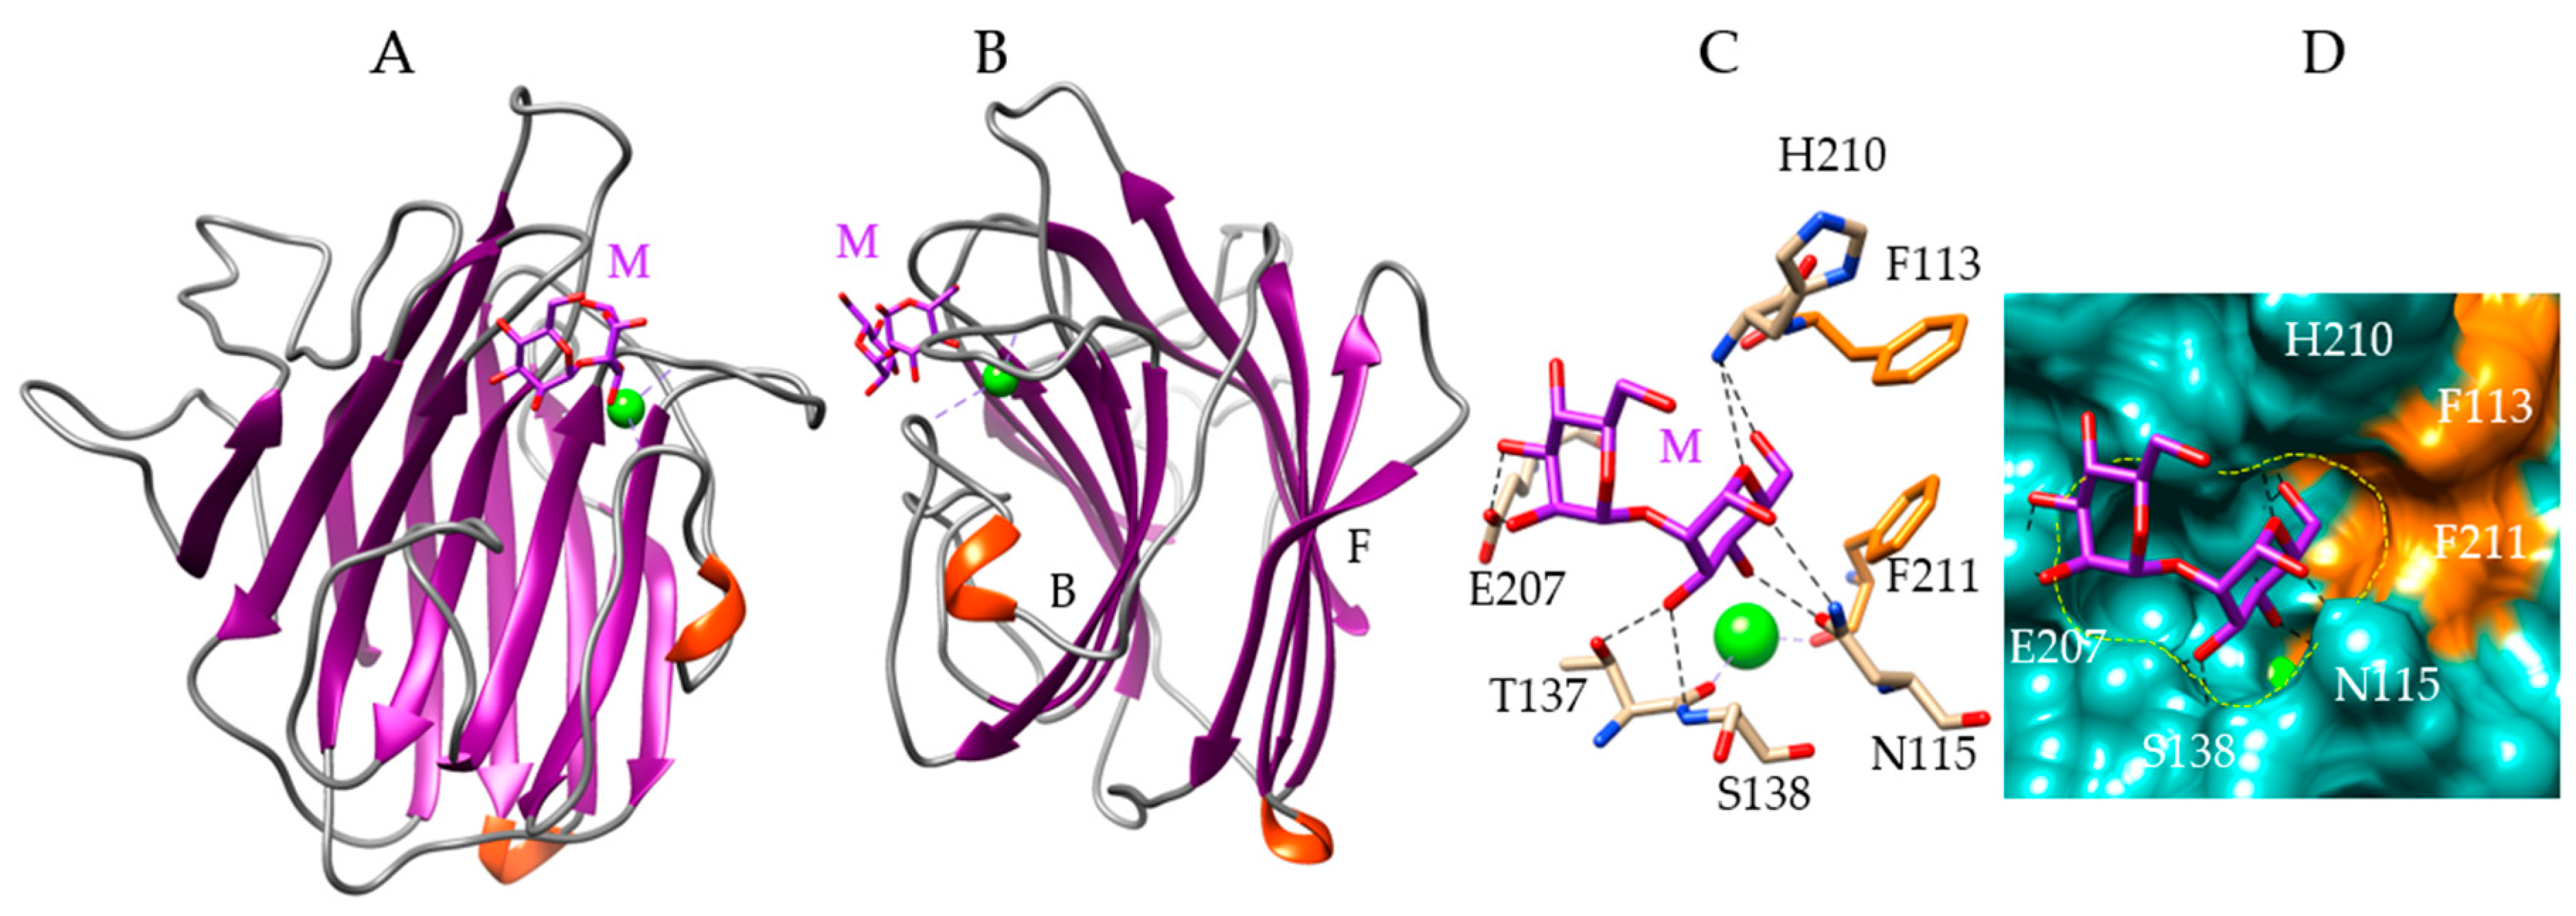
Figure 3.
Molecular modeling of Porphyra umbilicalis lectin. (A,B) Back face (A) and lateral view (B) of the ribbon diagram of the modeled Porphyra umbilicalis lectin (PUL) in complex with a dimannoside Manα1,2Man (M, colored purple). The calcium ion is colored green. The front (F) and back (B) faces of the β-sandwich are indicated in B. (C) Network of hydrogen bonds (black dashed lines) anchoring the dimannoside Manα1,2Man (M) to the amino acid residues forming the CBS of the PUL. Aromatic residues F113 and F211 interacting with the dimannoside by stacking interactions, are colored orange. (D) Molecular surface (colored slate green) at the CBS of PUL forming a depression (delineated by a yellow dashed line) harboring the dimannoside (M, colored purple) linked by a network of hydrogen bonds (black dashed lines) to N115, T137, S138, E207, and H210 residues, and stacking interactions with F113 and F211 residues (colored orange). The calcium ion is colored green.
Figure 4.
Molecular modeling of griffithsin. (A,B) Lateral (A) and front view (B) of the ribbon diagram of the domain-swapped griffithsin, in complex with mannose (M) (PDB code 2GUD). (C) Network of hydrogen bonds (black dashed lines) anchoring mannose (M) to the amino acid residues forming the CBS of griffithsin. Aromatic residues Y28 and Y110 participating in stacking interactions with the pyranose ring of Man, are colored orange. (D) Molecular surface (colored slate green) at the CBS of griffithsin forming a depression (delineated by a yellow dashed line) harboring the Man (M, colored purple) linked by a network of hydrogen bonds (black dashed lines) to G26, S27, Y28, D30, and G44 residues, and stacking interactions with Y28 and Y110 residues (colored orange).
Figure 5.
Molecular modeling of griffithsin. (A) Front view of the ribbon diagram of a domain of griffithsin, in complex with dimannoside Manα1,6Man (M, colored purple) (PDB code 2HYQ). (B) Network of hydrogen bonds (black dashed lines) anchoring the dimannoside (M) to the amino acid residues forming the CBS of griffithsin. Aromatic residues Y28 and Y110 participating in stacking interactions with the dimannoside, are colored orange. (C) Molecular surface (colored slate green) at the CBS of griffithsin forming a depression (delineated by a yellow dashed line) harboring the dimannoside (M, colored purple) linked by a network of hydrogen bonds (black dashed lines) to G26, S27, Y28, D30 and G44 residues, and stacking interactions with Y28 and Y110 residues (colored orange). Note the absence of contact between the second Man residue of the dimannoside and the CBS of griffithsin.
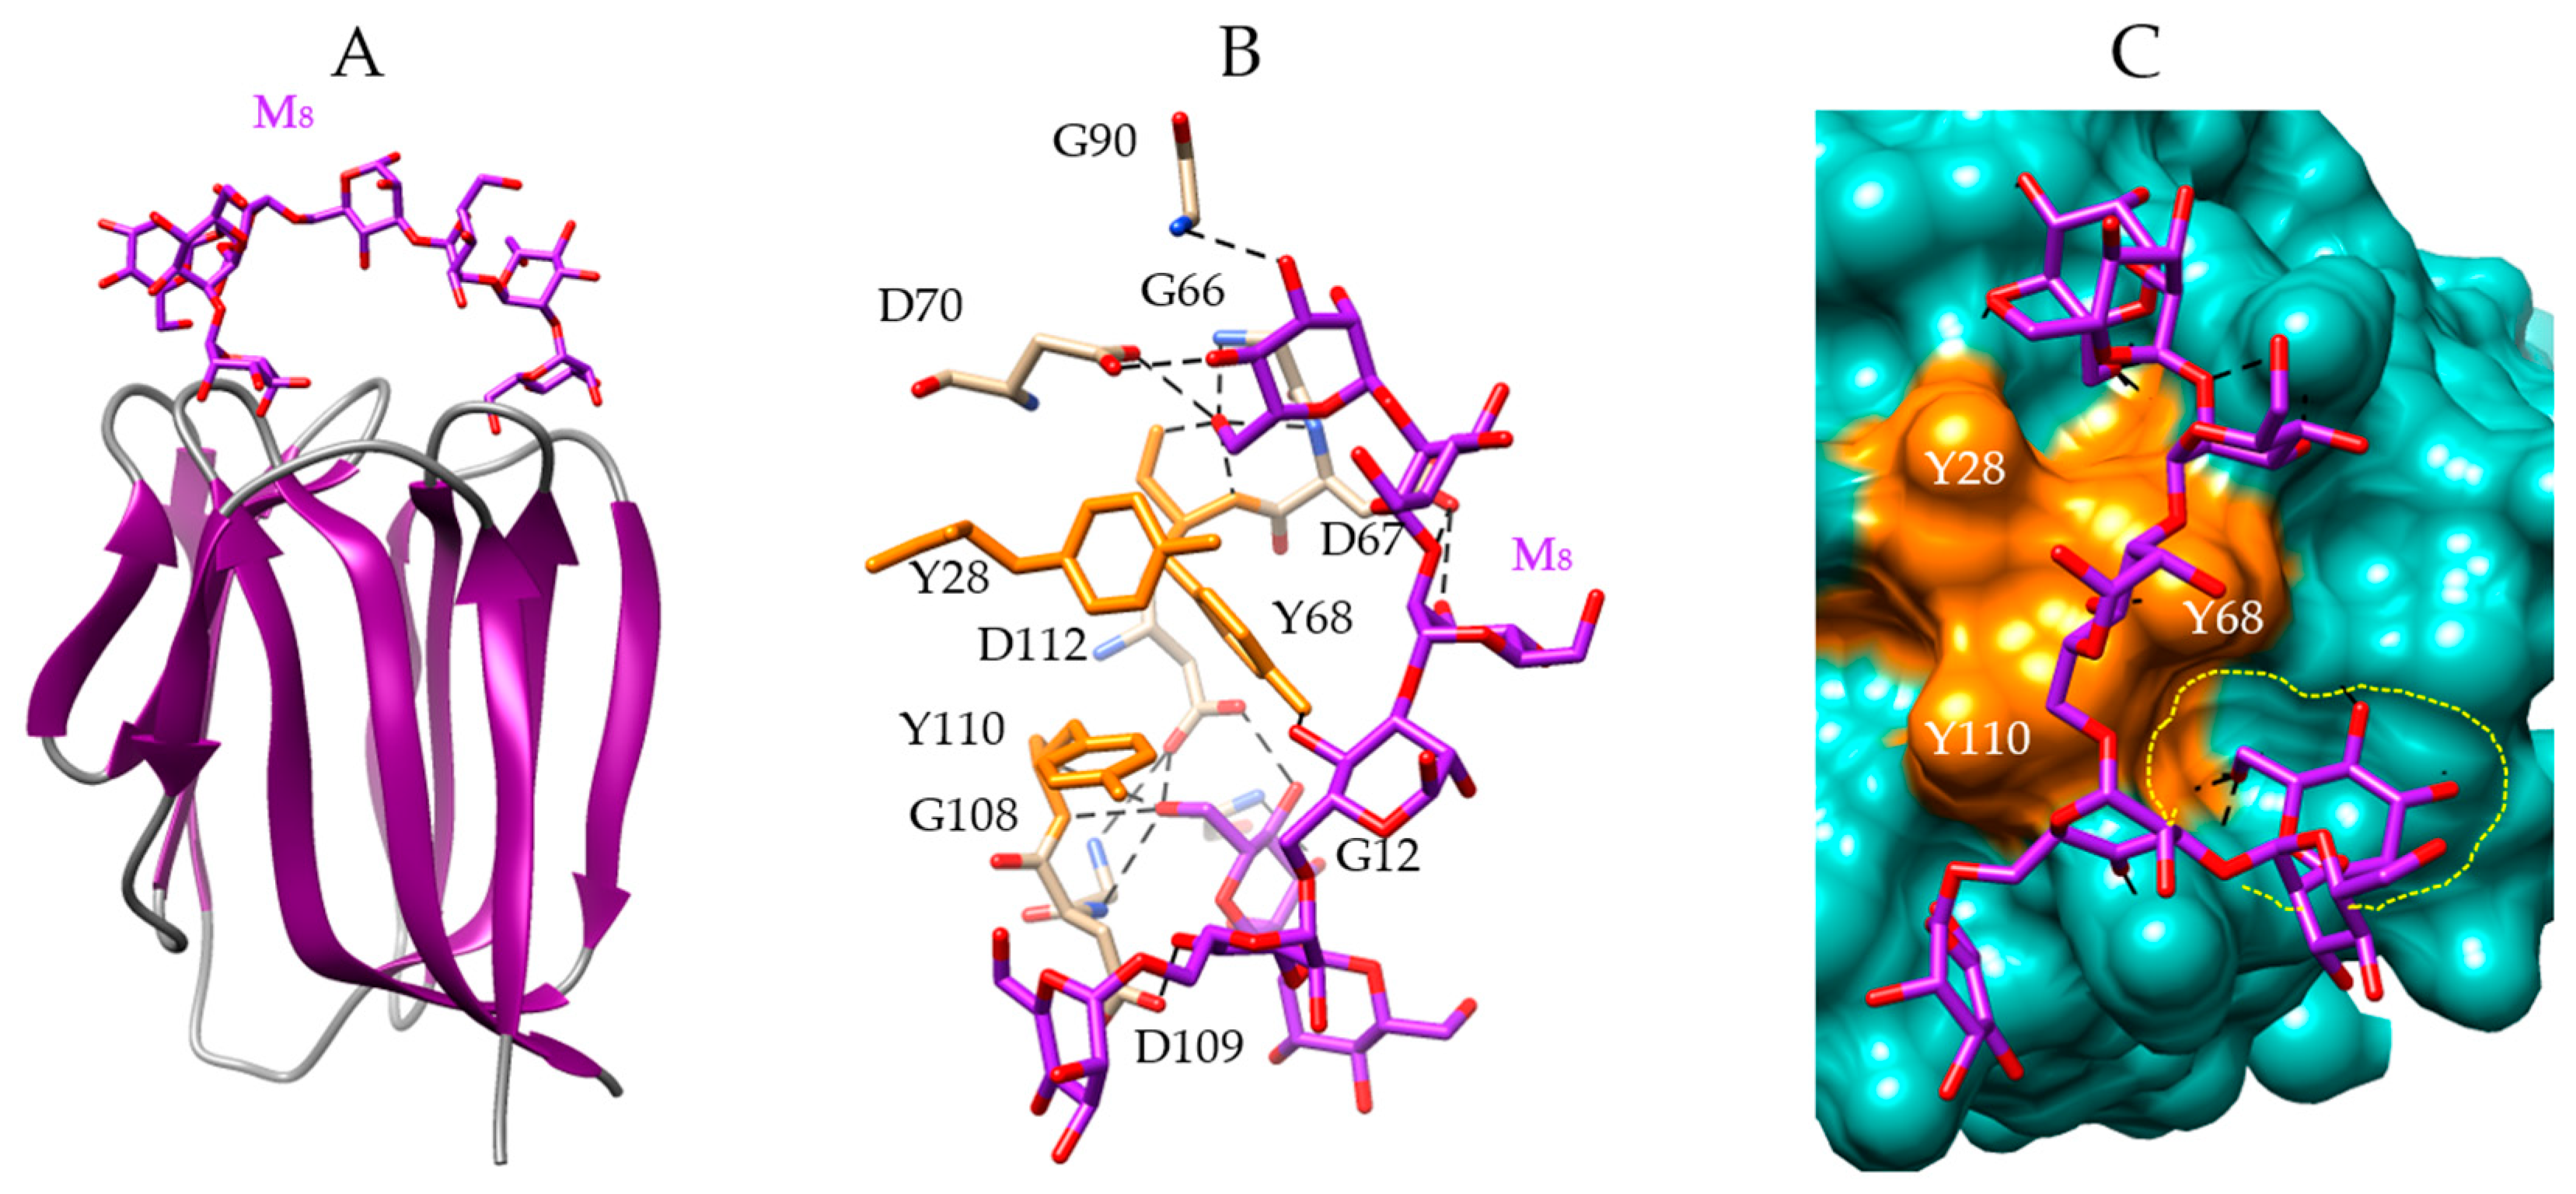
Figure 6.
Anchoring of Man8 to griffithsin. (A) Lateral view of the ribbon diagram of griffithsin in complex with a high-mannose branched chain (M8, colored purple) (PDB code 3LL2). (B) Network of hydrogen bonds (black dashed lines) anchoring M8 to the amino acid residues forming CBS-I (G12), CBS-II (G66, D67, Y68, D70), and CBS-III (G90, G108, D109, Y110, D112) of griffithsin. Aromatic residues Y28, Y68 and Y110 participating in stacking interactions with the M8, are colored orange. (C) Molecular surface (colored slate green) at the CBS-II and CBS-III of griffithsin, forming a depression (delineated by a yellow dashed line) harboring M8 (M8, colored purple) linked by a network of hydrogen bonds (black dashed lines) to G12, G66, D67, Y68, D70, G90, G108, D109, and D112 residues, and stacking interactions with Y28, Y68, and Y110 residues (colored orange).
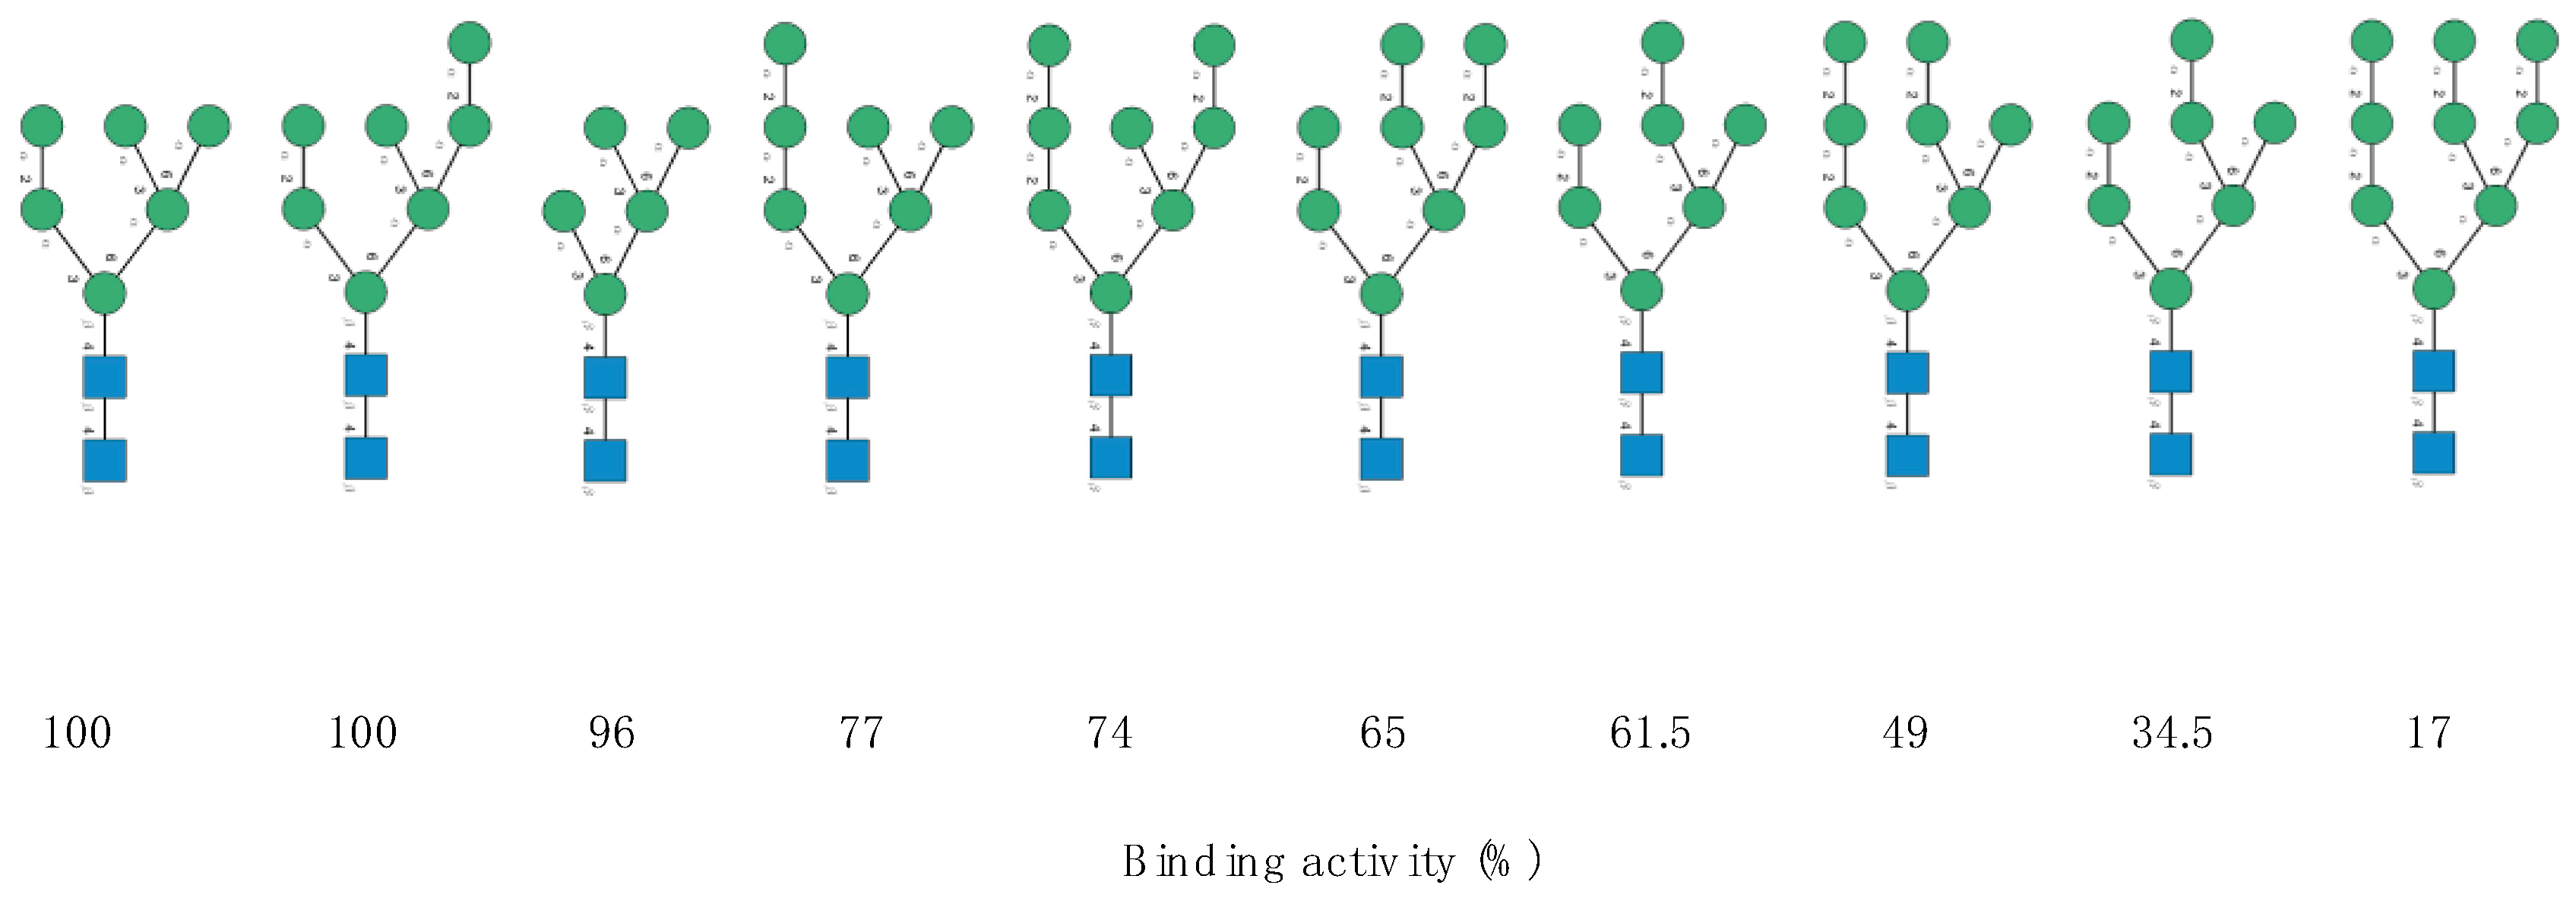
Figure 7.
Structure of the high-mannose type
N-glycans assayed by Sato et al. (2011) to measure the oligosaccharide-binding specificity of KAA-2 from the red alga
Kappaphycus avalvarezii. The high-mannose
N-glycans are aligned according to their decreasing binding activity (expressed as %) towards KAA-2 (adapted from [
10]). Symbols used to represent
N-glycans: blue squares:
N-acetylglucosamine, green circles: mannose.
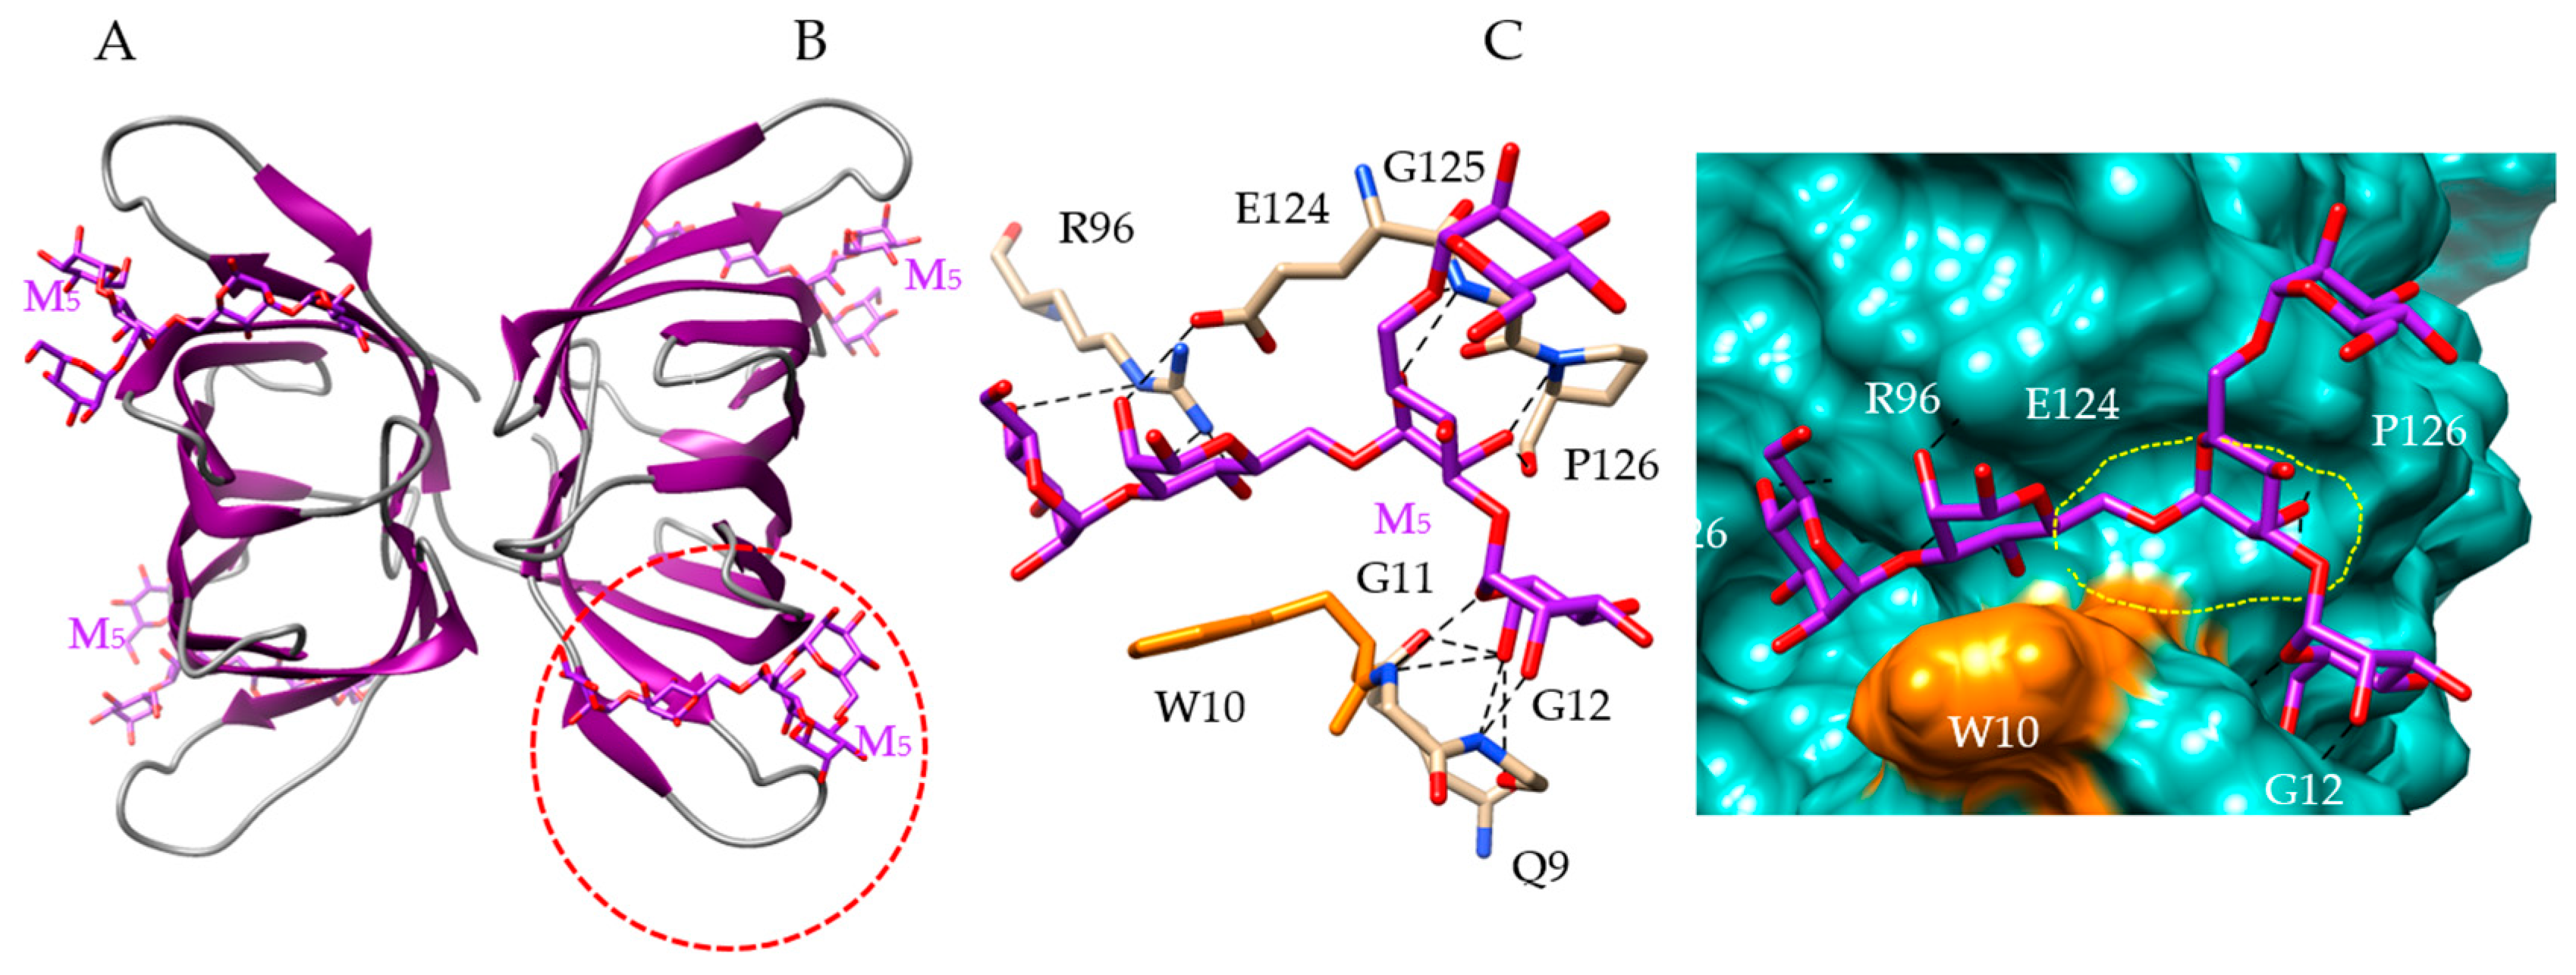
Figure 8.
Molecular modeling of Kappaphycus alvarezii lectin. (A) Lateral view of the ribbon diagram of the modeled KAA-2 from Kappaphycus alvarezii, in complex with a pentamannoside chain (M5, colored purple). (B) Network of hydrogen bonds (black dashed lines) anchoring M5 to the amino acid residues Q9, G11, G12, R96, E124, G125 and P126 forming the CBS (red dashed circle) of KAA-1. The aromatic residue W10 which also participates in stacking interaction with M5, is colored orange. (C) Molecular surface (colored slate green) at the CBS of KAA-2, forming a large depression (delineated by a yellow dashed line) harboring M5 (M5, colored purple) linked by a network of hydrogen bonds (black dashed lines) to Q9, G11, G12, R96, E124, G125 and P126 residues, and a stacking interaction with W10 residue (colored orange).
Figure 9.
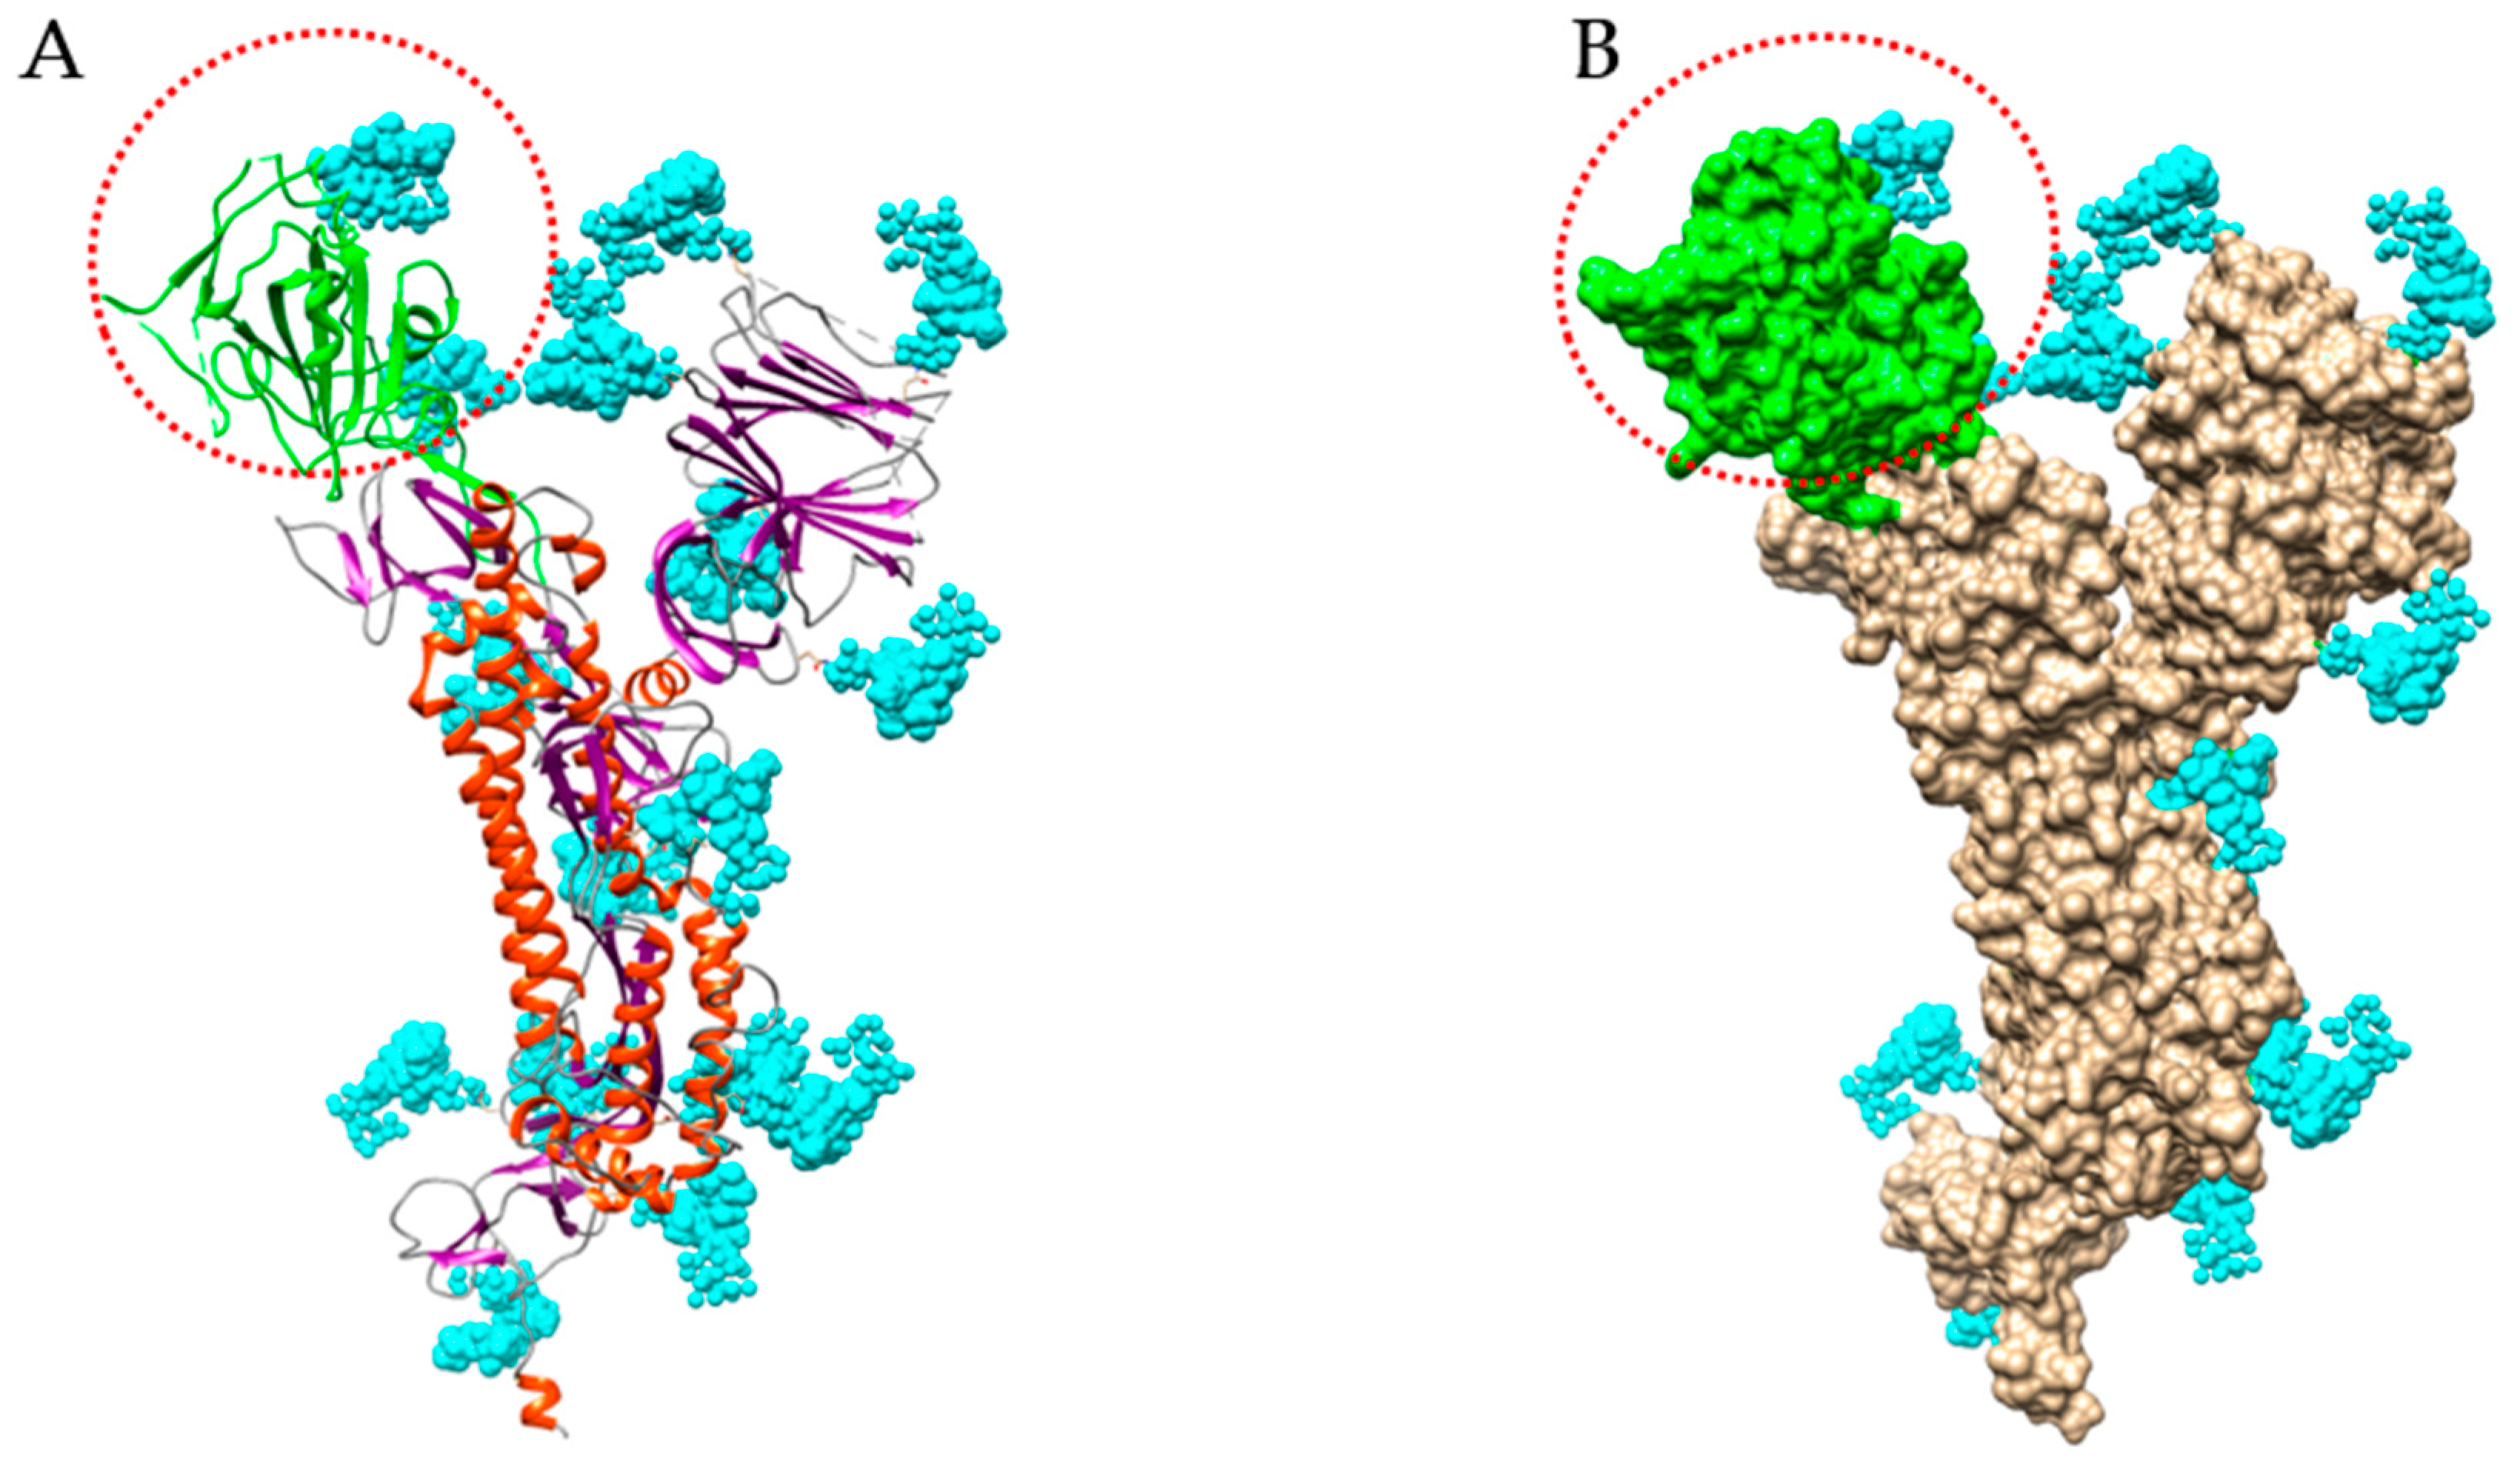
Structure of S-glycoprotein of SARS-CoV-2. (A) Ribbon diagram of the heavily glycosylated S-glycoprotein of SARS-CoV-2 (PDB code 6VXX). The RBD bearing 2 N-glycans is colored green and circled by a red dotted line. N-glycans (biantennary core (GlcNAc)2(Man)5) are colored cyan. (B) Molecular surface representation of the glycosylated S-glycoprotein of SARS-CoV-2. The molecular surface of RBD is colored green.
Figure 9.
Structure of S-glycoprotein of SARS-CoV-2. (A) Ribbon diagram of the heavily glycosylated S-glycoprotein of SARS-CoV-2 (PDB code 6VXX). The RBD bearing 2 N-glycans is colored green and circled by a red dotted line. N-glycans (biantennary core (GlcNAc)2(Man)5) are colored cyan. (B) Molecular surface representation of the glycosylated S-glycoprotein of SARS-CoV-2. The molecular surface of RBD is colored green.
Figure 10.
Diversity of the
N-glycans of the biantennary complex type (left frame) and high-mannose type (upper right frame), and
O-glycans (lower right frame), identified in the S-glycoprotein forming the spikes at the surface of the SARS-CoV-2 envelope [
26]. Symbols used to represent the
N- and
O-glycans: blue squares:
N-acetylglucosamine (GlcNAc), green circles: mannose (Man), yellow circles: galactose (Gal), red triangle: fucose (Fuc), purple diamonds: sialic acid (Neu5Ac), yellow square:
N-acetylgalactosamine (GalNAc).
Figure 11.
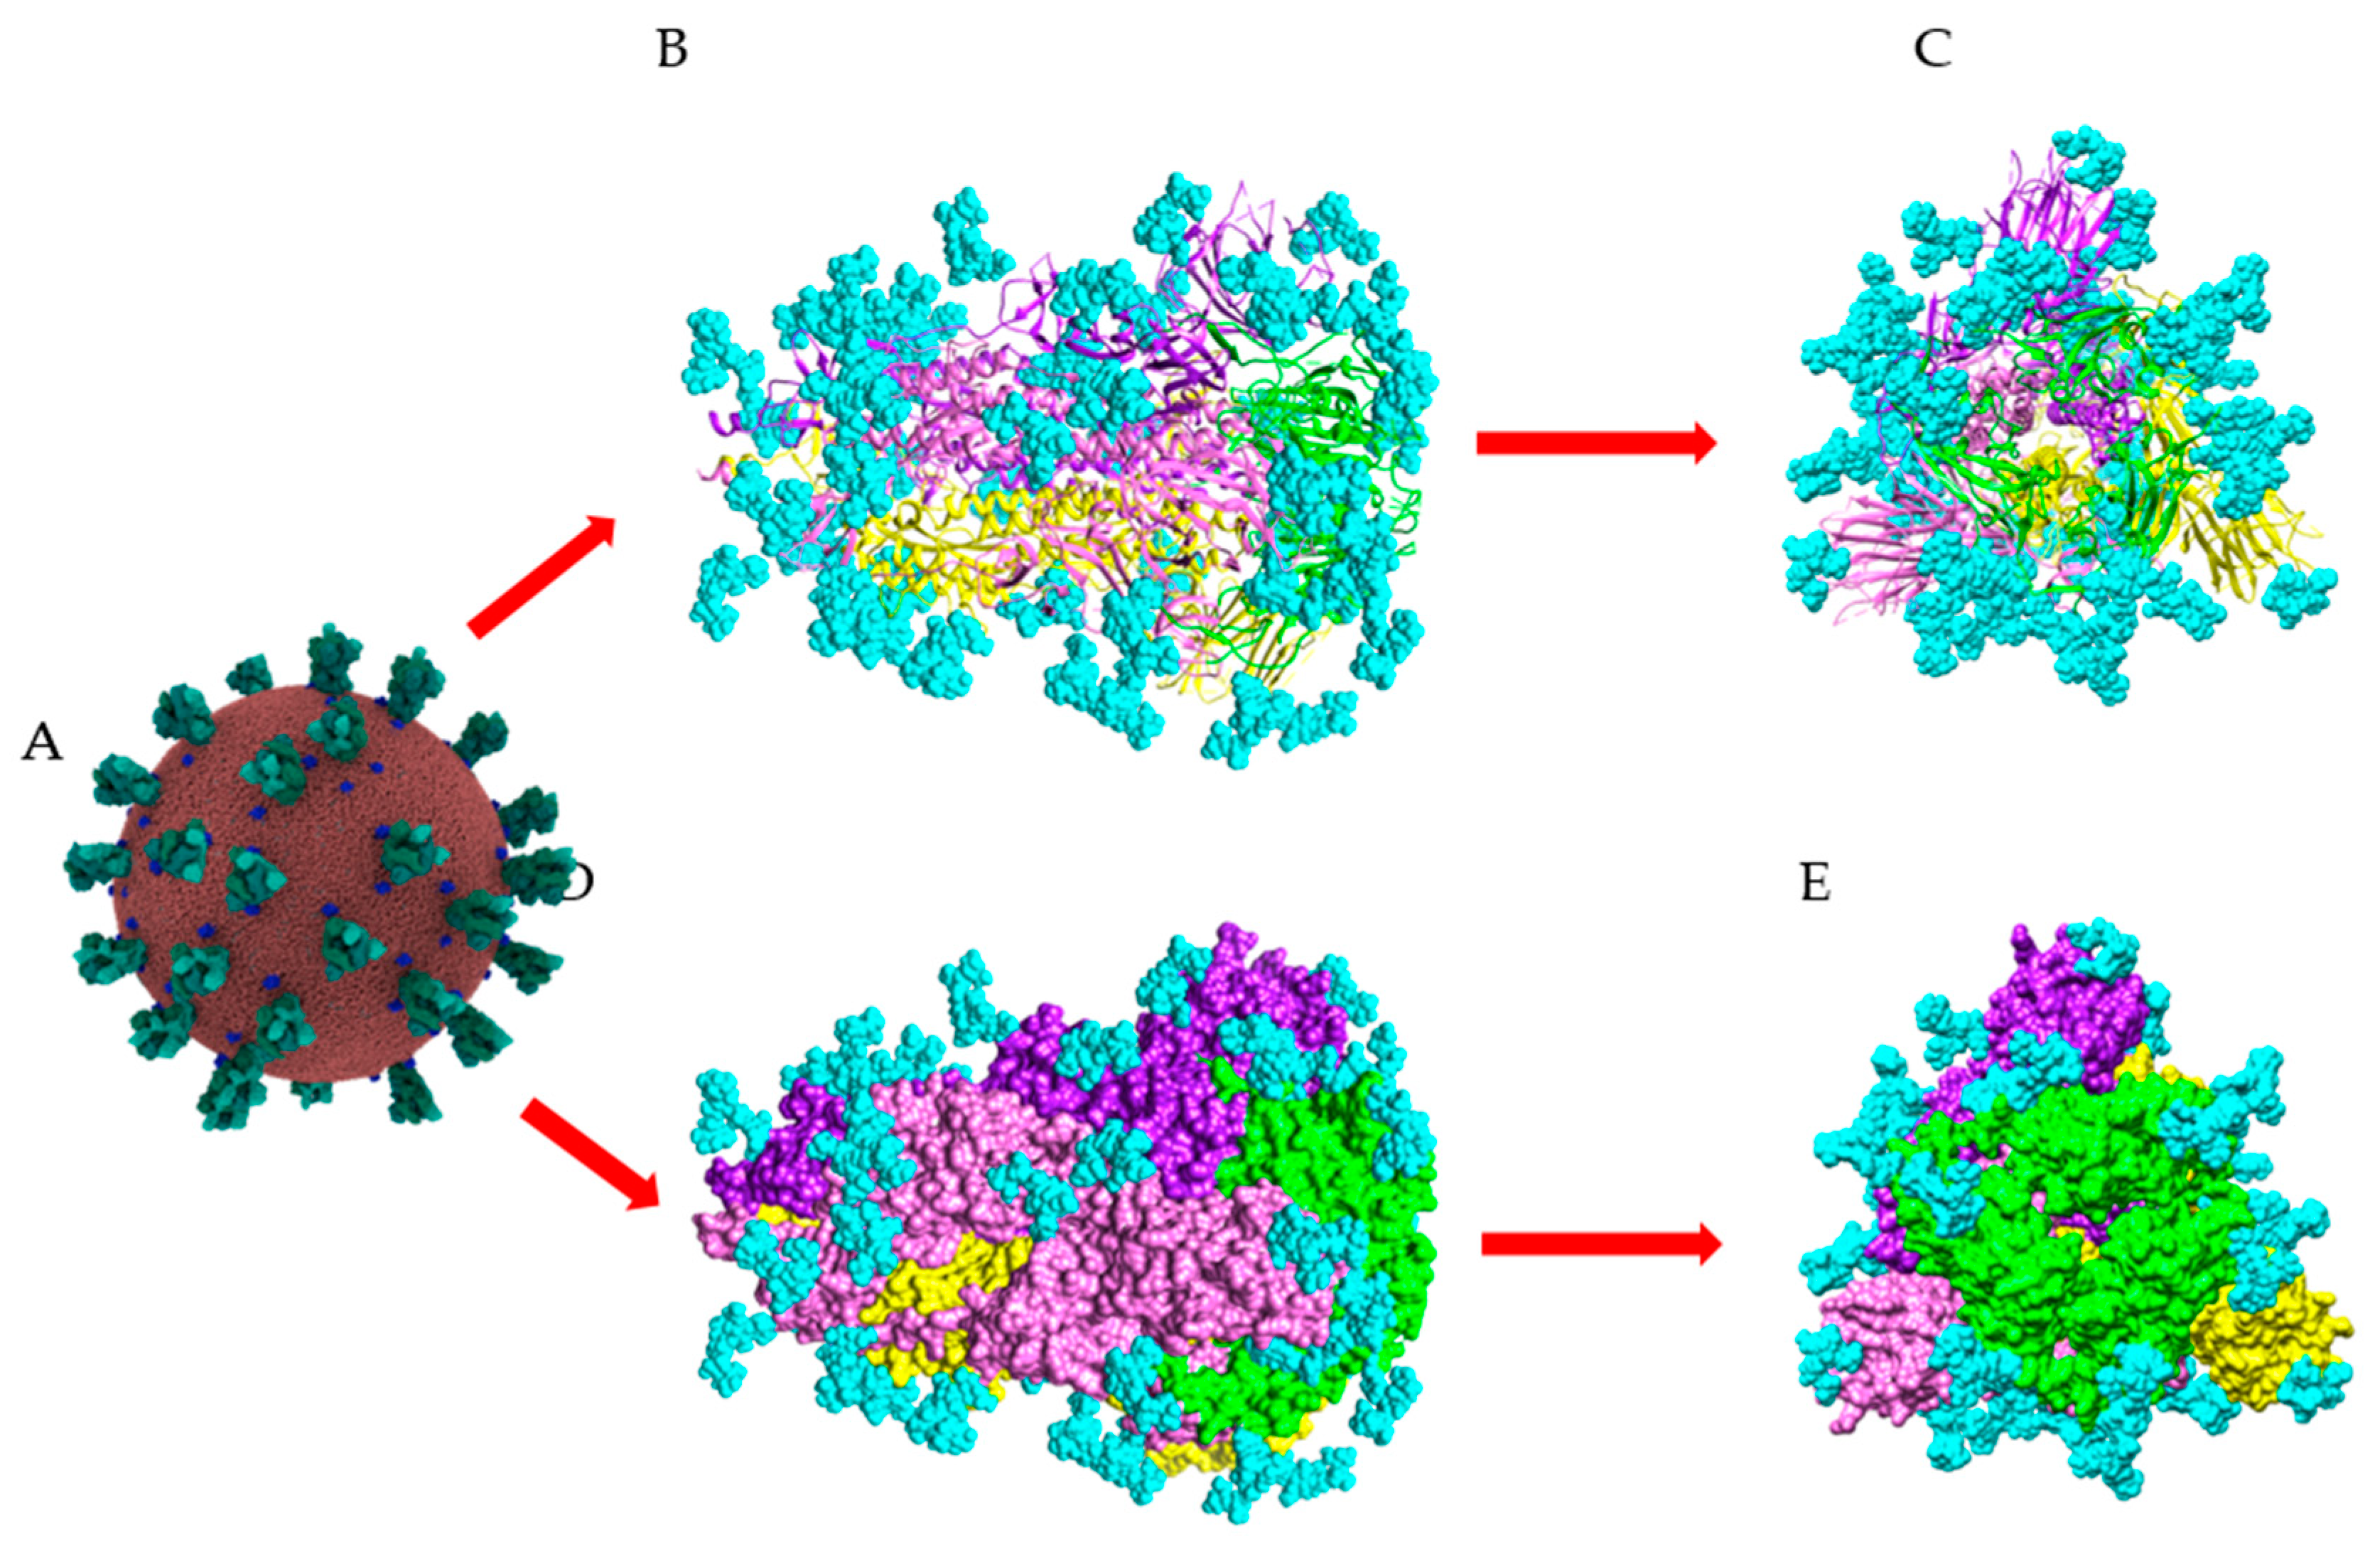
Surface glycosylation of SARS-CoV-2 virus. (A) Overall structure of SARS-CoV-2 showing the spikes (colored green) arrayed on the surface of the virus (Coronavirus Credit: Maria Voigt/RCSB PDB). (B,D) Sagital views of the ribbon diagram (B) and the molecular surface (D), showing the structural organization of the spike (PDB code 6ZGE). The three S-glycoproteins forming the SARS-CoV-2 spike are colored yellow, pink, and purple, respectively. The RBD in each S-glycoprotein is colored green. (C,E) Front views of the ribbon diagram (C) and the molecular surface (E), showing the structural organization of the spike. N-glycan chains occupying the putative N-glycosylation sites in the three S-glycoproteins, are colored cyan and represented in spheres.
Figure 11.
Surface glycosylation of SARS-CoV-2 virus. (A) Overall structure of SARS-CoV-2 showing the spikes (colored green) arrayed on the surface of the virus (Coronavirus Credit: Maria Voigt/RCSB PDB). (B,D) Sagital views of the ribbon diagram (B) and the molecular surface (D), showing the structural organization of the spike (PDB code 6ZGE). The three S-glycoproteins forming the SARS-CoV-2 spike are colored yellow, pink, and purple, respectively. The RBD in each S-glycoprotein is colored green. (C,E) Front views of the ribbon diagram (C) and the molecular surface (E), showing the structural organization of the spike. N-glycan chains occupying the putative N-glycosylation sites in the three S-glycoproteins, are colored cyan and represented in spheres.
Figure 12.
Comparative analysis of the binding activity (expressed as %) of the Man-specific lectins KAA-2 from
Kappaphycus alvarezii, HLR-40 from
Halimeda renschii, BCA from the green alga
Boodlea coacta, and OAA from the blue-green alga (cyanobacterium) OAA from
Oscillatoria agardhii (adapted from Mu et al. [
14] and Sato et al. [
11,
16]). Symbols used to represent high-mannose glycans: blue squares: N-acetylglucosamine, green circles: mannose. High-mannose glycans identified in the S-glycoprotein of the SARS-CoV-2 are indicated by a red star.
Figure 13.
Glycosylation pattern of the monomeric S-glycoprotein of SARS-CoV-2. (
A) High-mannose type glycans (colored yellow) of the monomeric S-glycoprotein of SARS-CoV-2 susceptible to be specifically recognized by Man-specific lectins KAA-2 and HRL-40 from the red algae
Kappaphycus alvarezii [
10,
13] and
Halimeda ronschii [
14], and OAA from the blue-green alga (cyanobacterium)
Oscillatoria agarddhii [
16], are well exposed at the top of the protein. Other complex
N-glycans decorating the monomer weakly or not recognized by the lectins, are colored cyan. (
B) High-mannose type glycans (colored yellow) of the monomeric S-glycoprotein of SARS- CoV-2 susceptible to be specifically recognized by the Manα1,2-specific lectin BCA from the green alga
Boodlea coacta [
11]. Other complex
N-glycans decorating the monomer weakly or not recognized by BCA, are colored cyan.
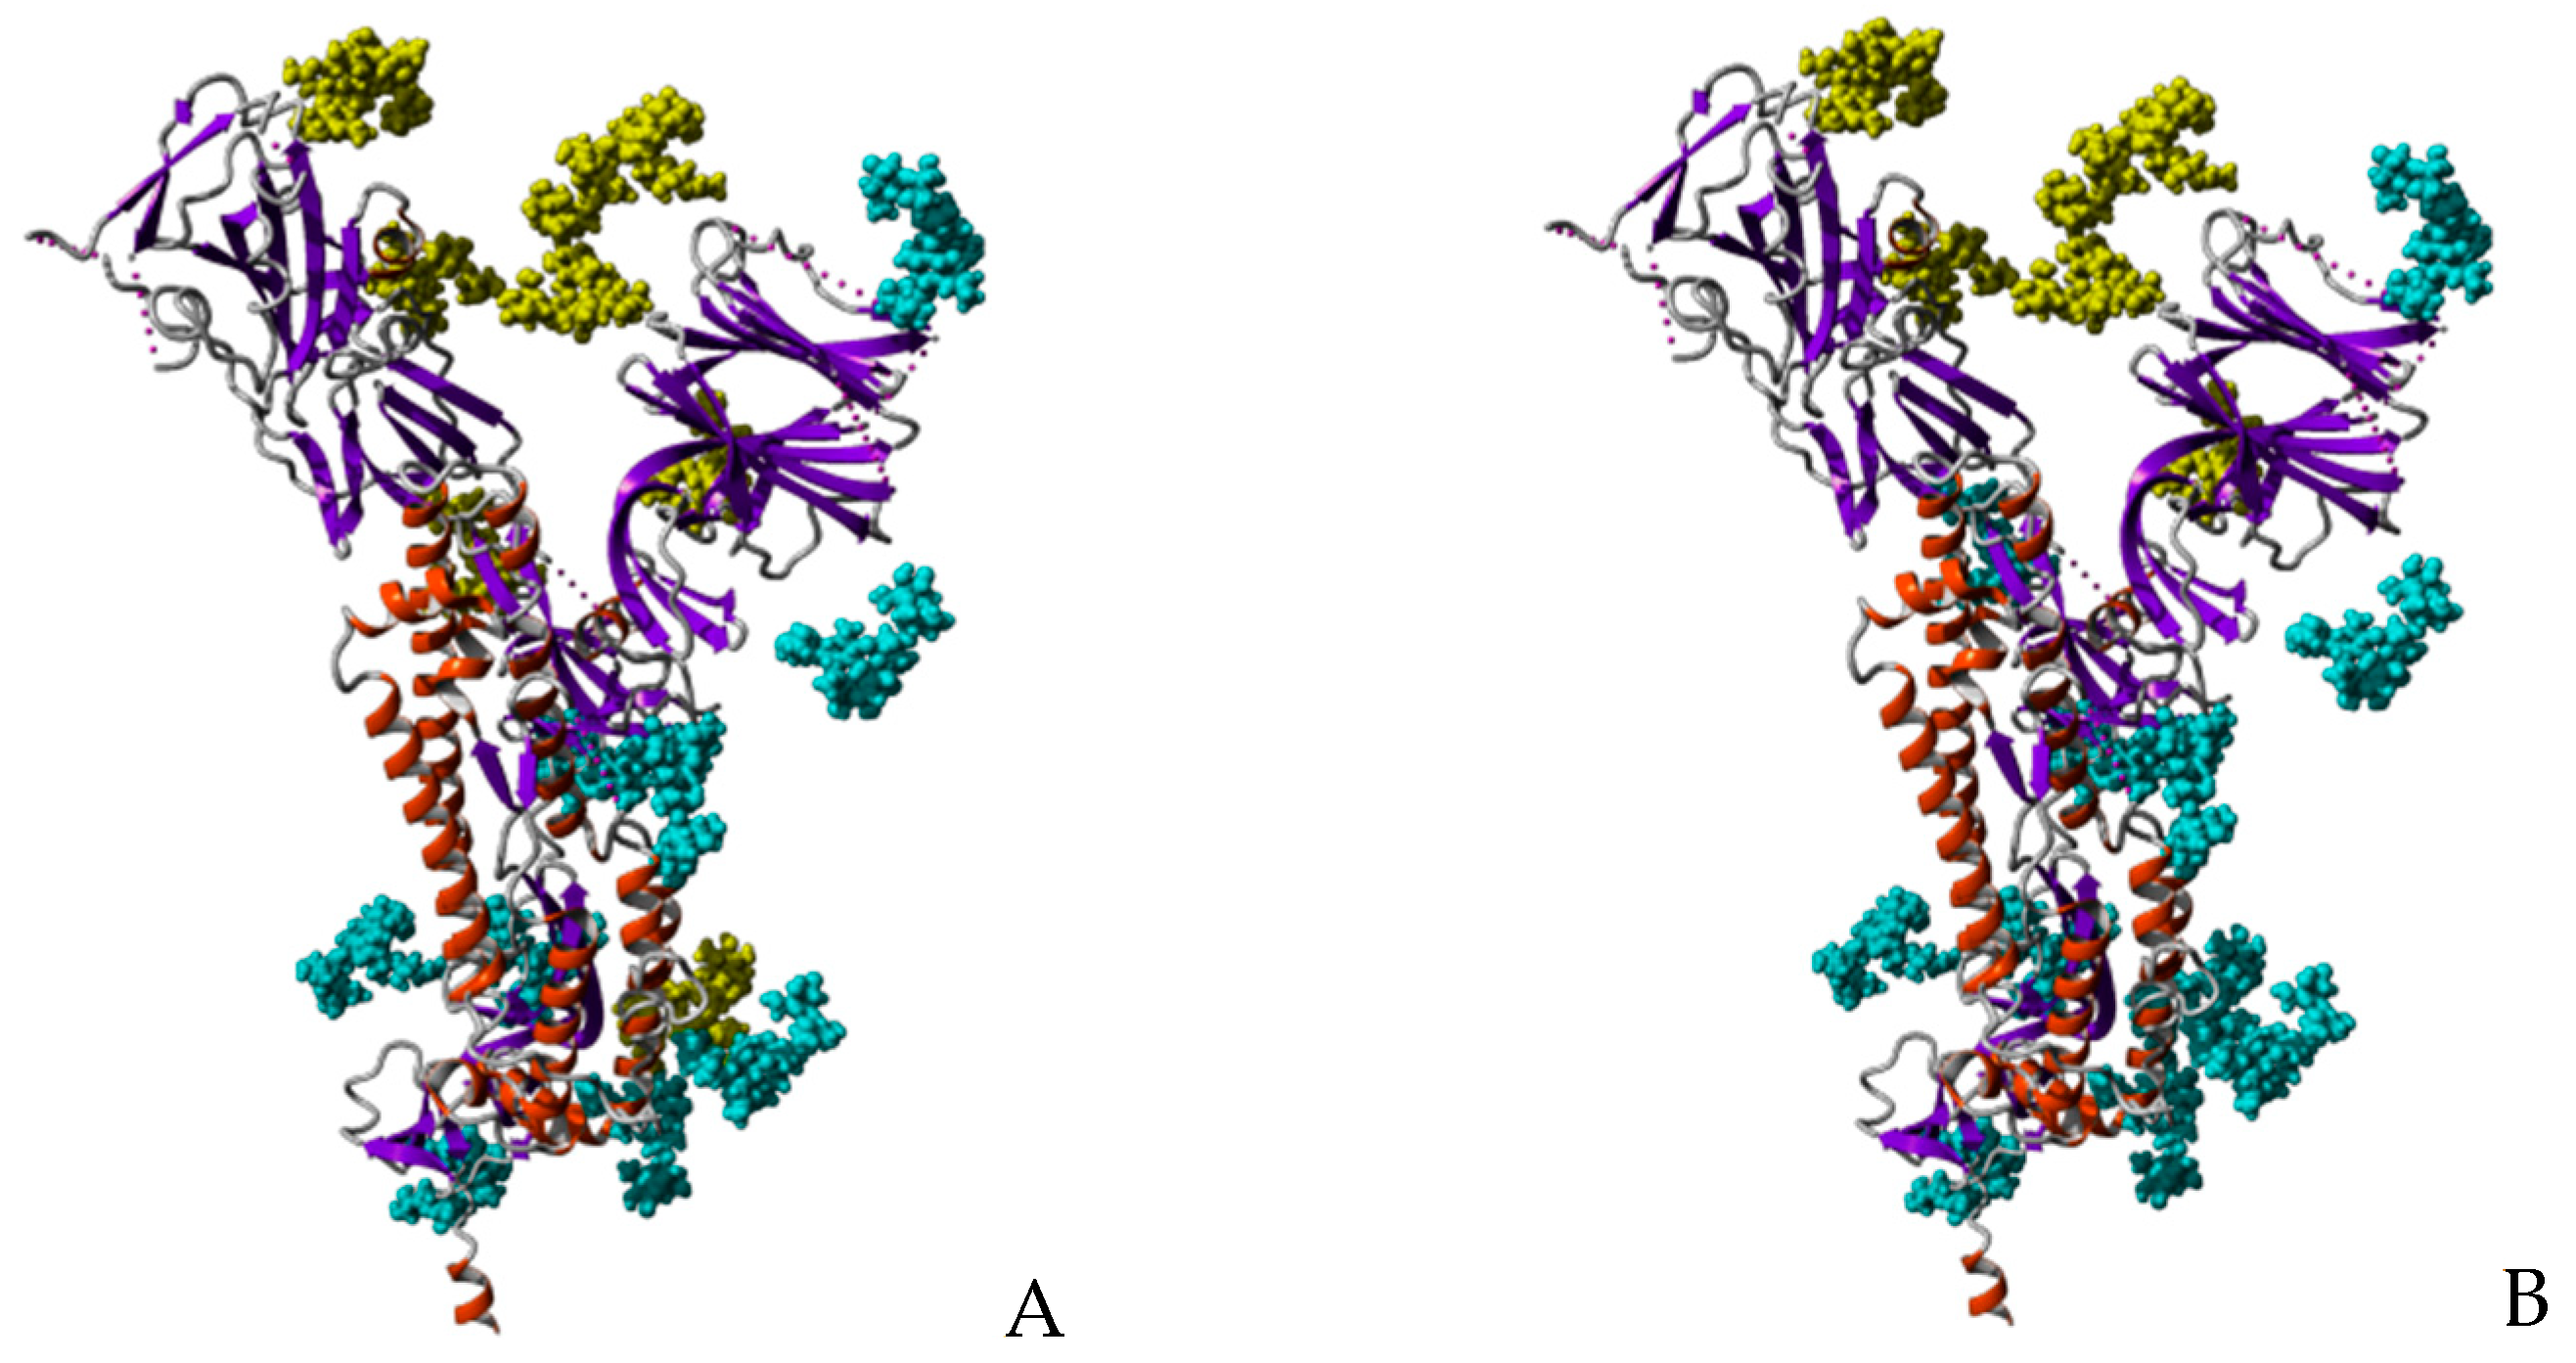
Figure 14.
Glycosylation of trimeric S-glycoprotein of SARS-CoV-2. (
A) Front view of the trimeric S-glycoprotein of SARS-CoV-2 showing the high-mannose type glycans (colored yellow) specifically recognized by Man-specific lectins KAA-2 and HRL-40 from the red algae
Kappaphycus alvarezii [
10,
13] and
Halimeda renschii [
14], and OAA from the blue-green alga (cyanobacterium)
Oscillatoria agarddhii [
16]. Other complex
N-glycans decorating the monomer weakly or not recognized by the lectins, are colored cyan. (
B) Front view of the trimeric S-glycoprotein of SARS-CoV-2 showing the high-mannose type glycans (colored yellow) specifically recognized by the Manα1,2-specific lectin BCA from the green alga
Boodlea coacta [
11]. Other complex
N-glycans decorating the monomer weakly or not recognized by BCA, are colored cyan.
Figure 15.
Ribbon diagram of the monomeric S-glycoprotein of SARS-CoV-2 showing the buried character of the O-glycosylated T323 and S325 amino acid residues (red dashed circle). High-mannose type glycans recognized by Man-specific seaweed lectins are colored yellow. Another exposed O-glycosylated T678 occurs in the S-glycoprotein (red arrow). Other often sialylated complex type N-glycans, well exposed at the surface of the S-glycoprotein monomer, are colored blue.
Table 1.
List of Man-specific seaweed lectins.
Table 1.
List of Man-specific seaweed lectins.
| Seaweed Family | Seaweed Species | Lectin | Structural Scaffold | Ref. |
|---|
| Red algae | Agardhiella subulata | ASL-1, | β-barrel | [7] |
| ASL-2 | β-barrel |
| Carpopeltis flabellata | CFA | unknown | [36] |
| Eucheuma amakusaensis | EAA-1 | β-barrel | [37] |
| EAA-2 | β-barrel |
| EAA-3 | β-barrel |
| Eucheuma cottonii | ECA-1 | β-barrel | [37] |
| ECA-2 | β-barrel |
| Eucheuma denticulatum | EDA-1 | β-barrel | [38] |
| EDA-2 | β-barrel |
| Eucheuma serra | ESA-1 | β-barrel | [39,40] |
| ESA-2 | β-barrel |
| Gracilaria bursa-pastoris | GBPL | unknown | [41] |
| Grateloupia chiangii | GCL | β-prism II | [15] |
| Griffthsia sp. | griffithsin | β-barrel | [8] |
| Kappaphycus alvarezii | KAA-2 | β-barrel | [10] |
| Kappaphycus striatum | KSA-2 | β-barrel | [38] |
| Meristiella echinocarpa | MEL | β-barrel | [42] |
| Meristotheca papulosa | MPA-1 | β-barrel | [42] |
| MPA-2 | β-barrel |
| Solieria filiformis | SfL-1 | β-barrel | [12] |
| SfL-2 | β-barrel |
| Solieria robusta | SrL | β-barrel | [3] |
| Hydropuntia (Gracilaria) fisheri | HFA | β-sandwich | [43] |
| Porphyra umbilicalis | NgL | β-sandwich | [44] |
| Yellow-green algae | Nannochloropsis gaditana | BU14 | β-sandwich | [45] |
| Green algae | Boodlea coacta | BCA | β-prism II | [11,46] |
| Bryopsis plumosa | BPL-2 | MFP2-like scaffold | [47] |
| Enteromorpha prolifera | EPL-1/2 | unknown | [48] |
| Halimeda renschii | HRL40-1/2 | unknown | [14] |
| Ostreococcus tauri | OtL | β-sandwich | [49] |
Table 2.
List of GalNAc/T/Tn-specific seaweed lectins.
Table 2.
List of GalNAc/T/Tn-specific seaweed lectins.
| Seaweed Family | Seaweed Species | Lectin | Structural Scaffold | Ref. |
|---|
| Rhodophyceae | Aglaothamnion oosumiense | AOL1 | unknown | [56] |
| Chlorophyceae | Codium fragile | CFL | unknown | [57,58] |
Table 3.
List of Neu5Ac-specific seaweed lectins.
Table 3.
List of Neu5Ac-specific seaweed lectins.
| Seaweed Family | Seaweed Species | Lectin | Structural Scaffold | Ref. |
|---|
| Rhodophyceae | Gracilaria tikvahiae | GTL | unknown | [59] |
| Palmaria palmata | PPL | unknown | [60] |
| Solieria chordalis | ScL | β-barrel | [61] |
| Phaeophyceae | Fucus vesiculosus | ? * | unknown | [62] |
Table 4.
List of the RBD (Receptor-binding domain) and S-GPT (S-Glycoprotein trimer) solved by either X-ray radiocrystallography and/or cryo-electron miscroscopy (Cryo-Em). Tbp: to be published (atomic coordinates available at the PDB but results are unpublished by the authors).
Table 4.
List of the RBD (Receptor-binding domain) and S-GPT (S-Glycoprotein trimer) solved by either X-ray radiocrystallography and/or cryo-electron miscroscopy (Cryo-Em). Tbp: to be published (atomic coordinates available at the PDB but results are unpublished by the authors).
| RBD/S-GPT | PDB Code | RX/Cryo-Em | Resolution (Å) | Ref. |
|---|
| RBD | 6W41 | RX | 3.084 Å | [64] |
| RBD | 6XC2, 6XC3, 6XC4, 6XC7 | RX | 2.3 Å–3.11 Å | [65] |
| RBD | 6XDG | Cryo-Em | 3.9 Å | [66] |
| RBD | 6XE1 | RX | 2.75 Å | [67] |
| RBD | 6YLA, 6YM0, 6YOM | RX, Cryo-Em | 2.42 Å–4.36 Å | Tbp |
| RBD | 6YZ7, 6Z2M, 6ZH9 | RX | 2.71 Å–3.31 Å | Tbp |
| RBD | 6ZCZ, 6ZER, 6ZFO | RX, Cryo-Em | 2.65 Å–4.4 Å | [68] |
| RBD | 7BWJ | RX | 2.85 Å | [69] |
| RBD | 7BZ5 | RX | 1.84 Å | [70] |
| RBD | 7C01 | RX | 2.88 Å | [28] |
| RBD | 7C8V | RX | 2.15 Å | Tbp |
| RBD | 7JMP | RX | 1.712 Å | [71] |
| S-GPT | 6VYB | Cryo-Em | 3.2 Å | [72] |
| S-GPT | 6WPT | Cryo-Em | 3.1 Å–3.7 Å | [73] |
| S-GPT | 6X2A | Cryo-Em | 2.9 Å–3.6 Å | [74] |
| S-GPT | 6X6P | Cryo-Em | 3.22 Å | [29] |
| S-GPT | 6X79 | Cryo-Em | 2.9 Å | [75] |
| S-GPT | 6XCN | Cryo-Em | 3.42 Å–3.66 Å | [76] |
| S-GPT | 6XEY | Cryo-Em | 3.27 Å | [77] |
| S-GPT | 6XF5,6XF6 | Cryo-Em | 3.45 Å–4.0 Å | Tbp |
| S-GPT | 6XKL | Cryo-Em | 3.21 Å | [78] |
| S-GPT | 6XLU,6XM0,6XM3,6XM4,6XM5 | Cryo-Em | 2.4 Å–3.1 Å | [31] |
| S-GPT | 6XR8 | Cryo-Em | 2.9 Å | [79] |
| S-GPT | 6XS6 | Cryo-Em | 3.7 Å | [80] |
| S-GPT | 6Z43 | Cryo-Em | 3.3 Å | Tbp |
| S-GPT | 6Z97 | Cryo-Em | 3.4 Å | [81] |
| S-GPT | 6ZDH | Cryo-Em | 3.7 Å | [68] |
| S-GPT | 6ZGE,6ZGH,6ZGG,6ZGI,6ZHD | Cryo-Em | 2.6 Å–6.8 Å | Tbp |
| S-GPT | 6ZOX,6ZOY,6ZOZ,6ZP0,6ZP1,6ZP2 | Cryo-Em | 3.0 Å–3.5 Å | [29] |
| S-GPT | 6ZOW,6ZP5, 6ZP7 | Cryo-Em | 3.0 Å–3.3 Å | [82] |
| S-GPT | 6ZWV | Cryo-Em | 3.5 Å | [83] |
| S-GPT | 7BYR | Cryo-Em | 3.84 Å | [84] |
| S-GPT | 7CN9 | Cryo-Em | 4.7 Å | [85] |
| S-GPT | 7JJI | Cryo-Em | 3.6 Å | [86] |
Table 5.
List of seaweed lectins tested for their antiviral properties against enveloped viruses possessing exposed glycans.
Table 5.
List of seaweed lectins tested for their antiviral properties against enveloped viruses possessing exposed glycans.
| Seaweed Family | Lectin | Virus | Glycan Recognized | Ref. |
|---|
| Rhodophyceae | ESA-2 (Eucheuma serra) | Influenza | High-mannose | [12] |
| GCL (Grateloupia chiangii) | Influenza | High-mannose | [15] |
| Herpes |
| Griffithsin (Griffithsia sp.) | HIV-1 | High-mannose | [8] |
| Hepatitis C |
| SARS-CoV | [9] |
| HRL-40 (Halimeda renschii)) | Influenza | High-mannose | [14] |
| KAA-2 (Kappaphycus alvarezii) | Influenza | High-mannose | [10] |
| HIV-1 | [13] |
| Chlorophyceae | BCA (Boodlea coacta) | Influenza | High-mannose | [11] |
| HIV-1 |
| * Cyanobacteria | MVN (Microcystis aeruginosa) | HIV-1 | High-mannose | [22] |
| MVL (Microcystis viridis) | HIV-1 | High-mannose | [23] |
| CV-N (Nostoc ellipsosprum) | HIV-1 | High-mannose | [17,18] |
| Herpes | [18] |
| Ebola | [19] |
| Hepatitis C | [20] |
| Influenza | [21] |
| OAA (Oscillatoria agardhii) | HIV-1 | High-mannose | [16] |
| SVN (Scytonema varium) | HIV-1 | High-mannose | [24] |


