
Improving Determination of Pigment Contents in Microalgae Suspension with Absorption Spectroscopy: Light Scattering Effect and Bouguer–Lambert–Beer Law

 , , , ,
Abstract
:
1. Introduction
2. Results and Discussion
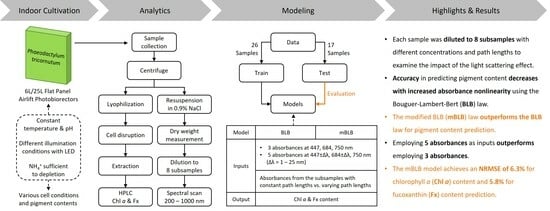
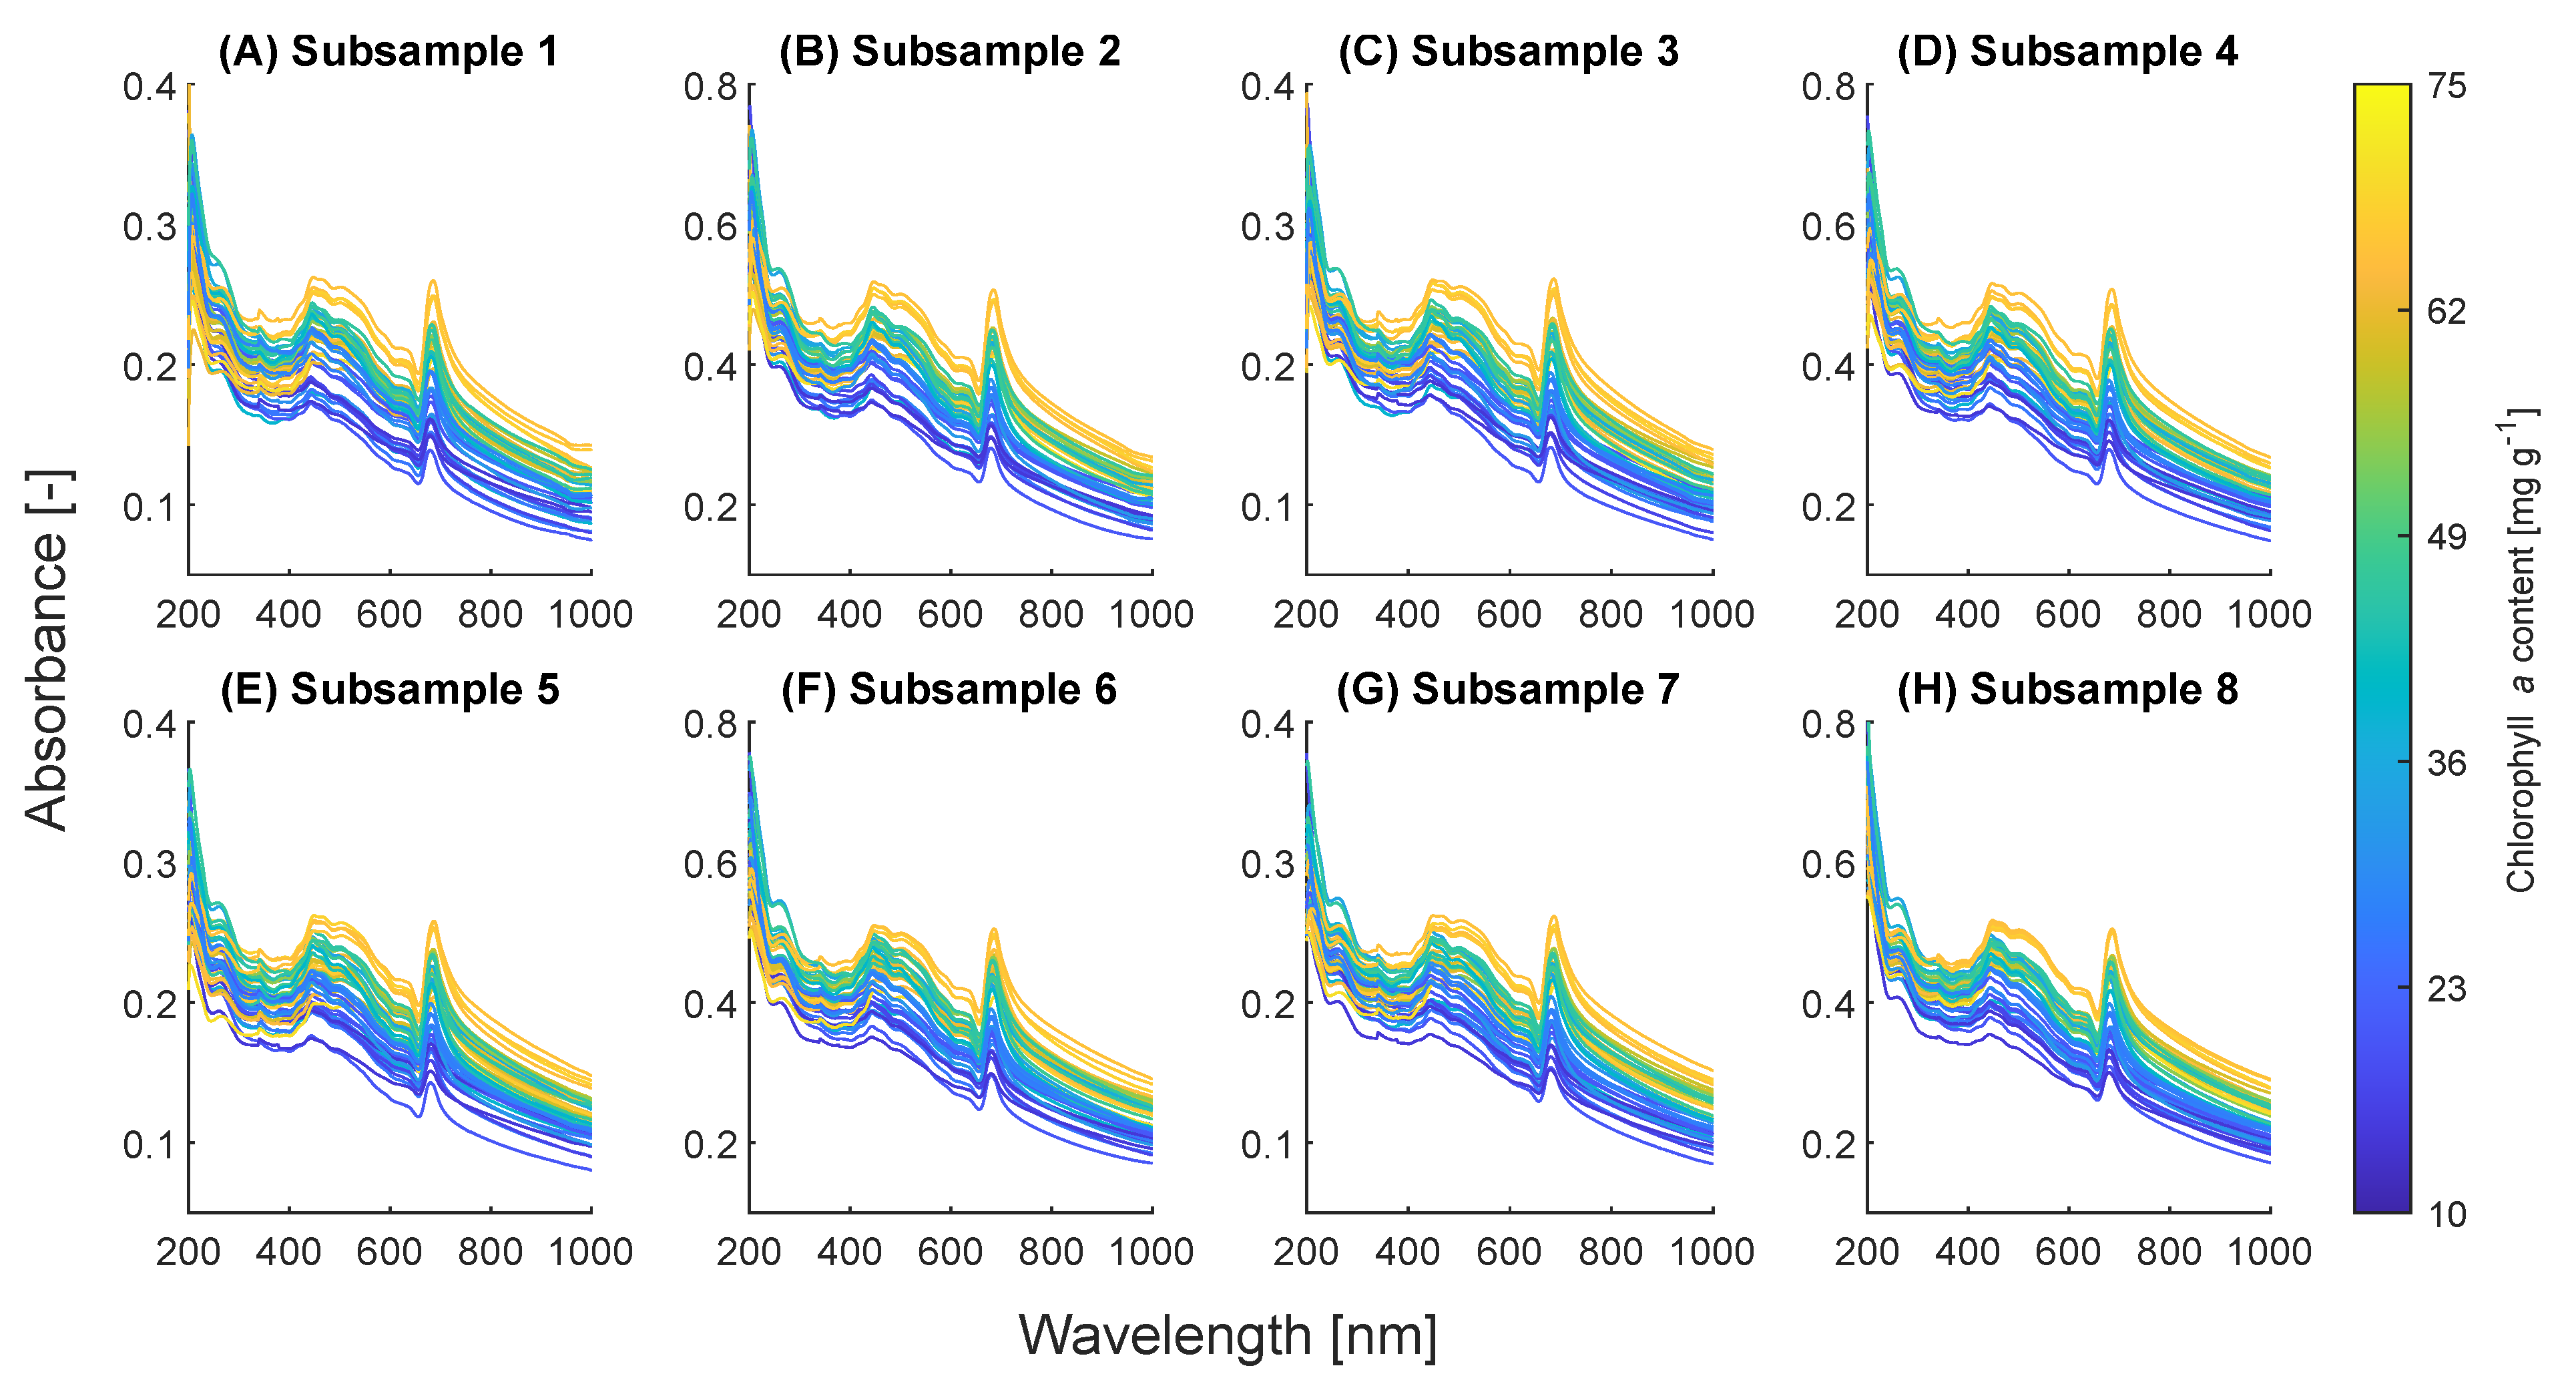
2.1. Spectral Shift with Pigment Content
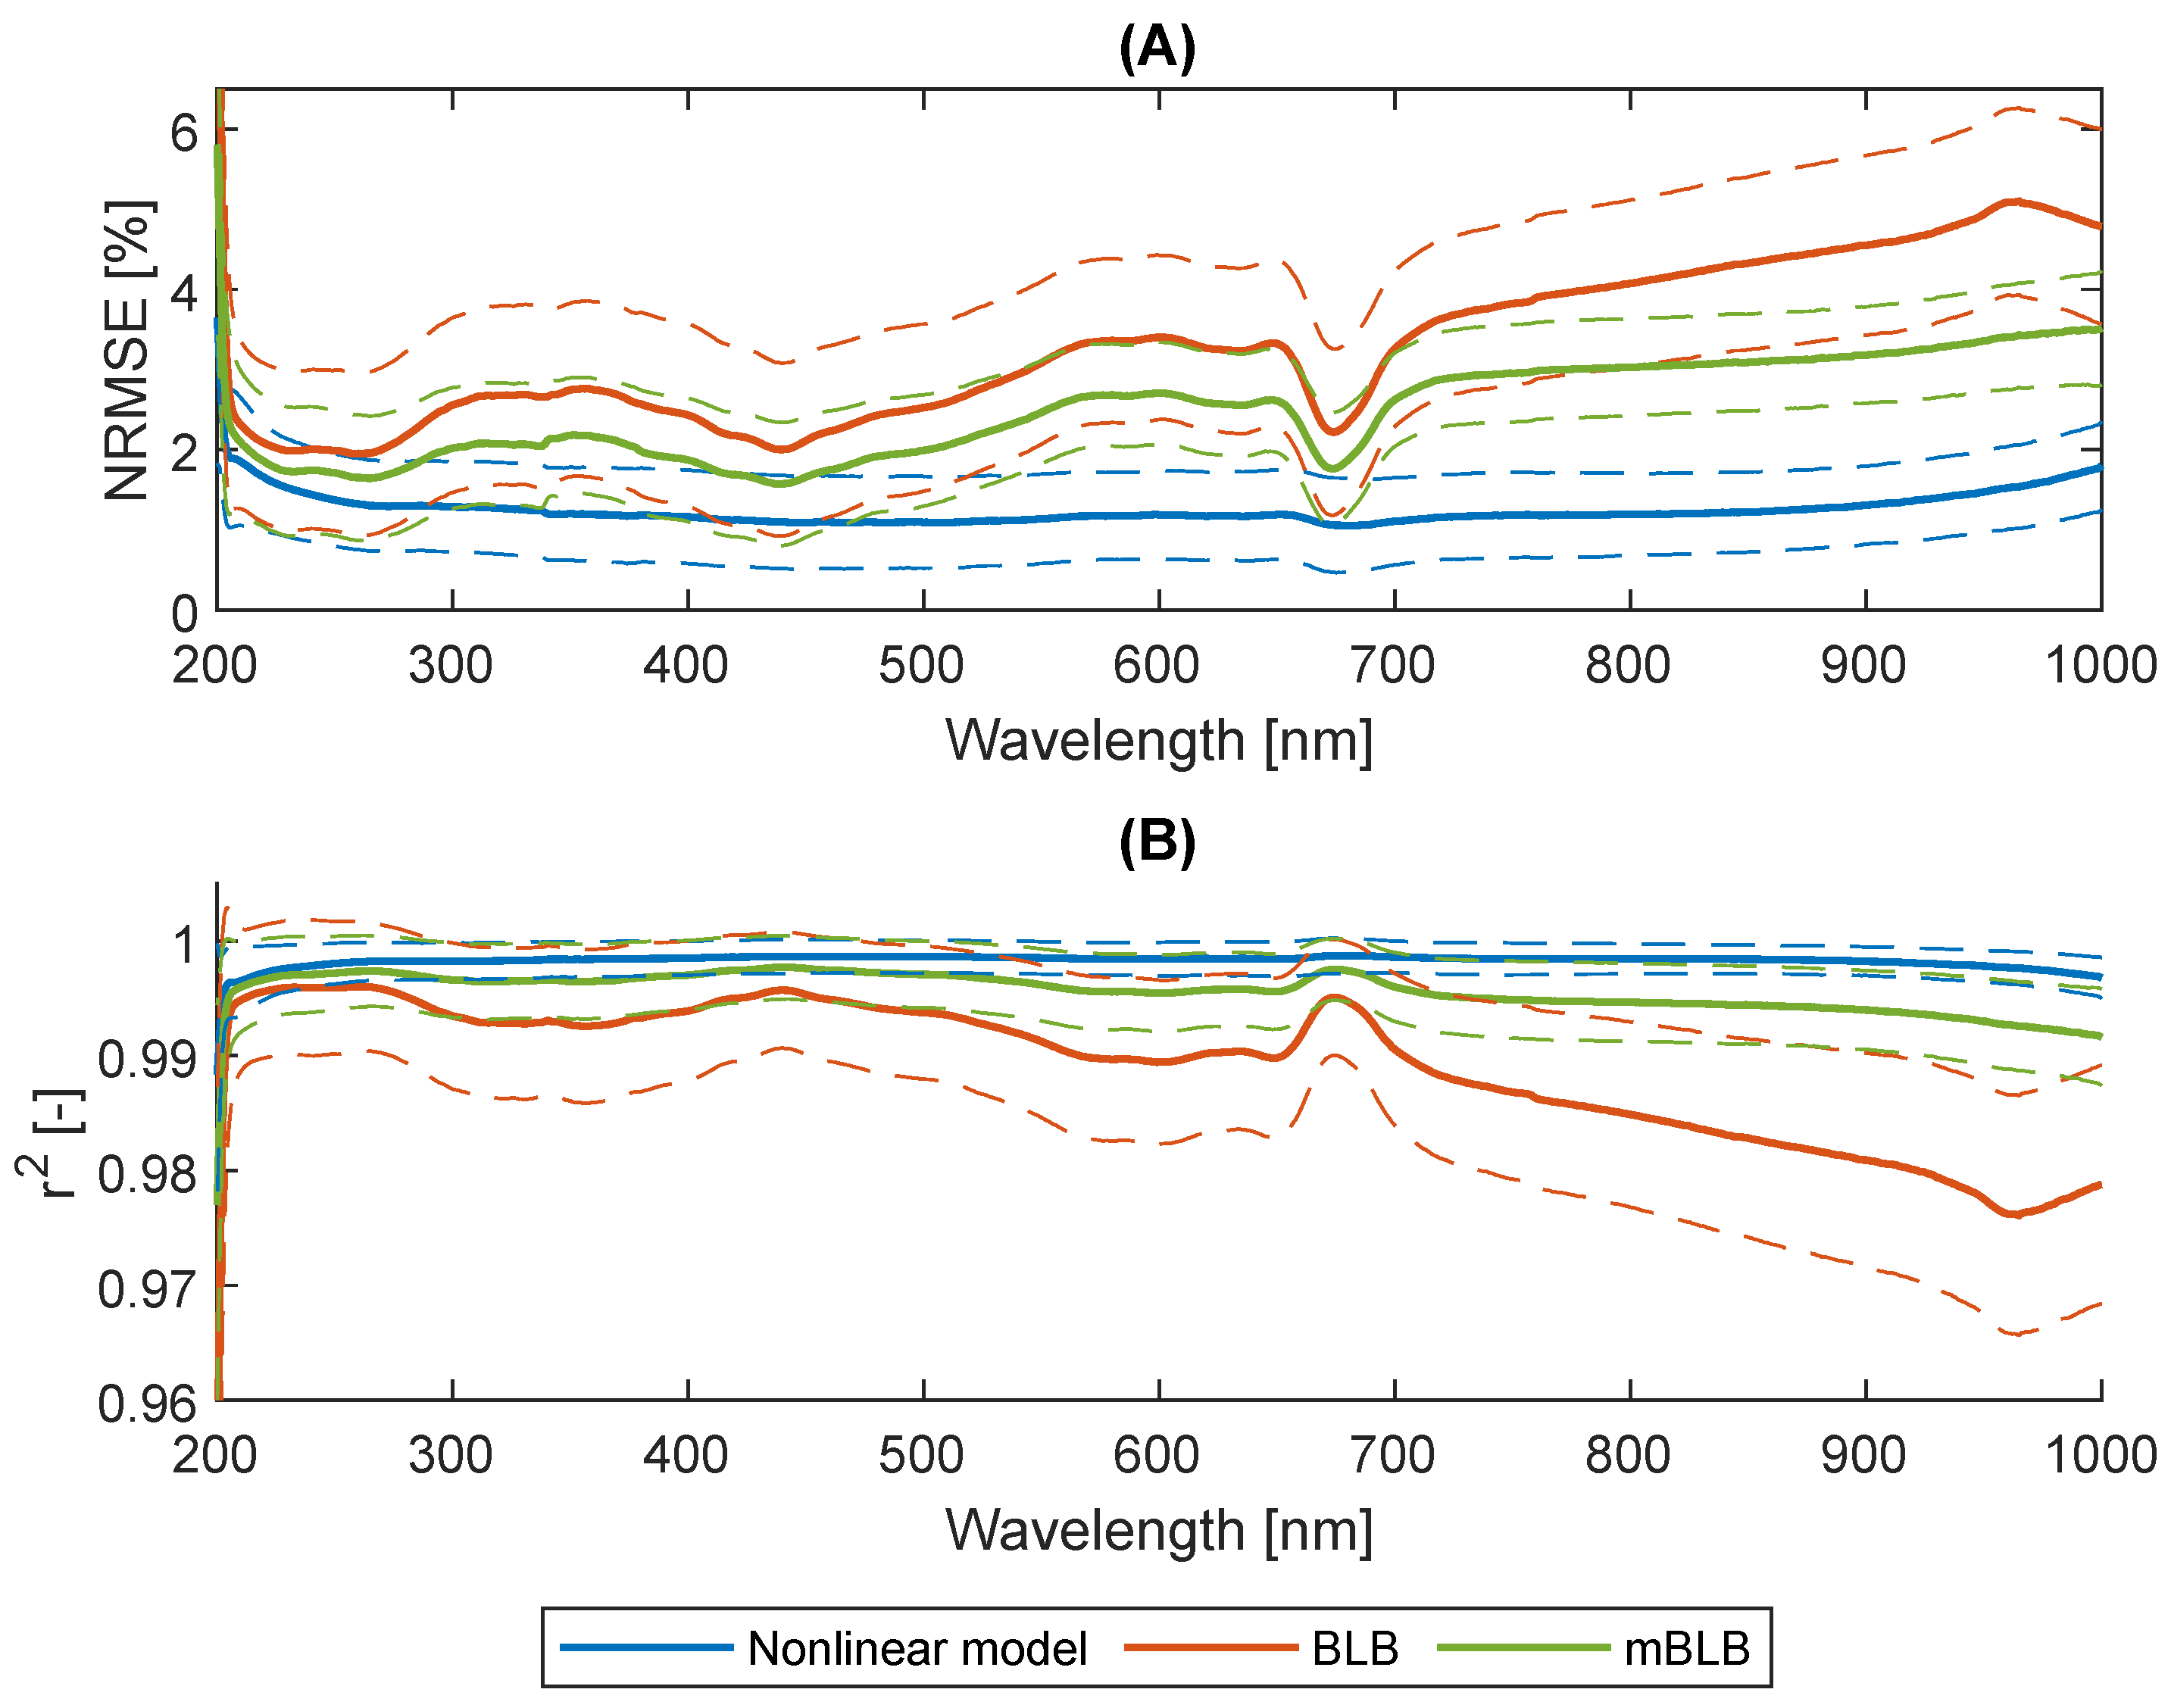
2.2. Nonlinearity of Absorbances
2.3. Wavelengths Selection
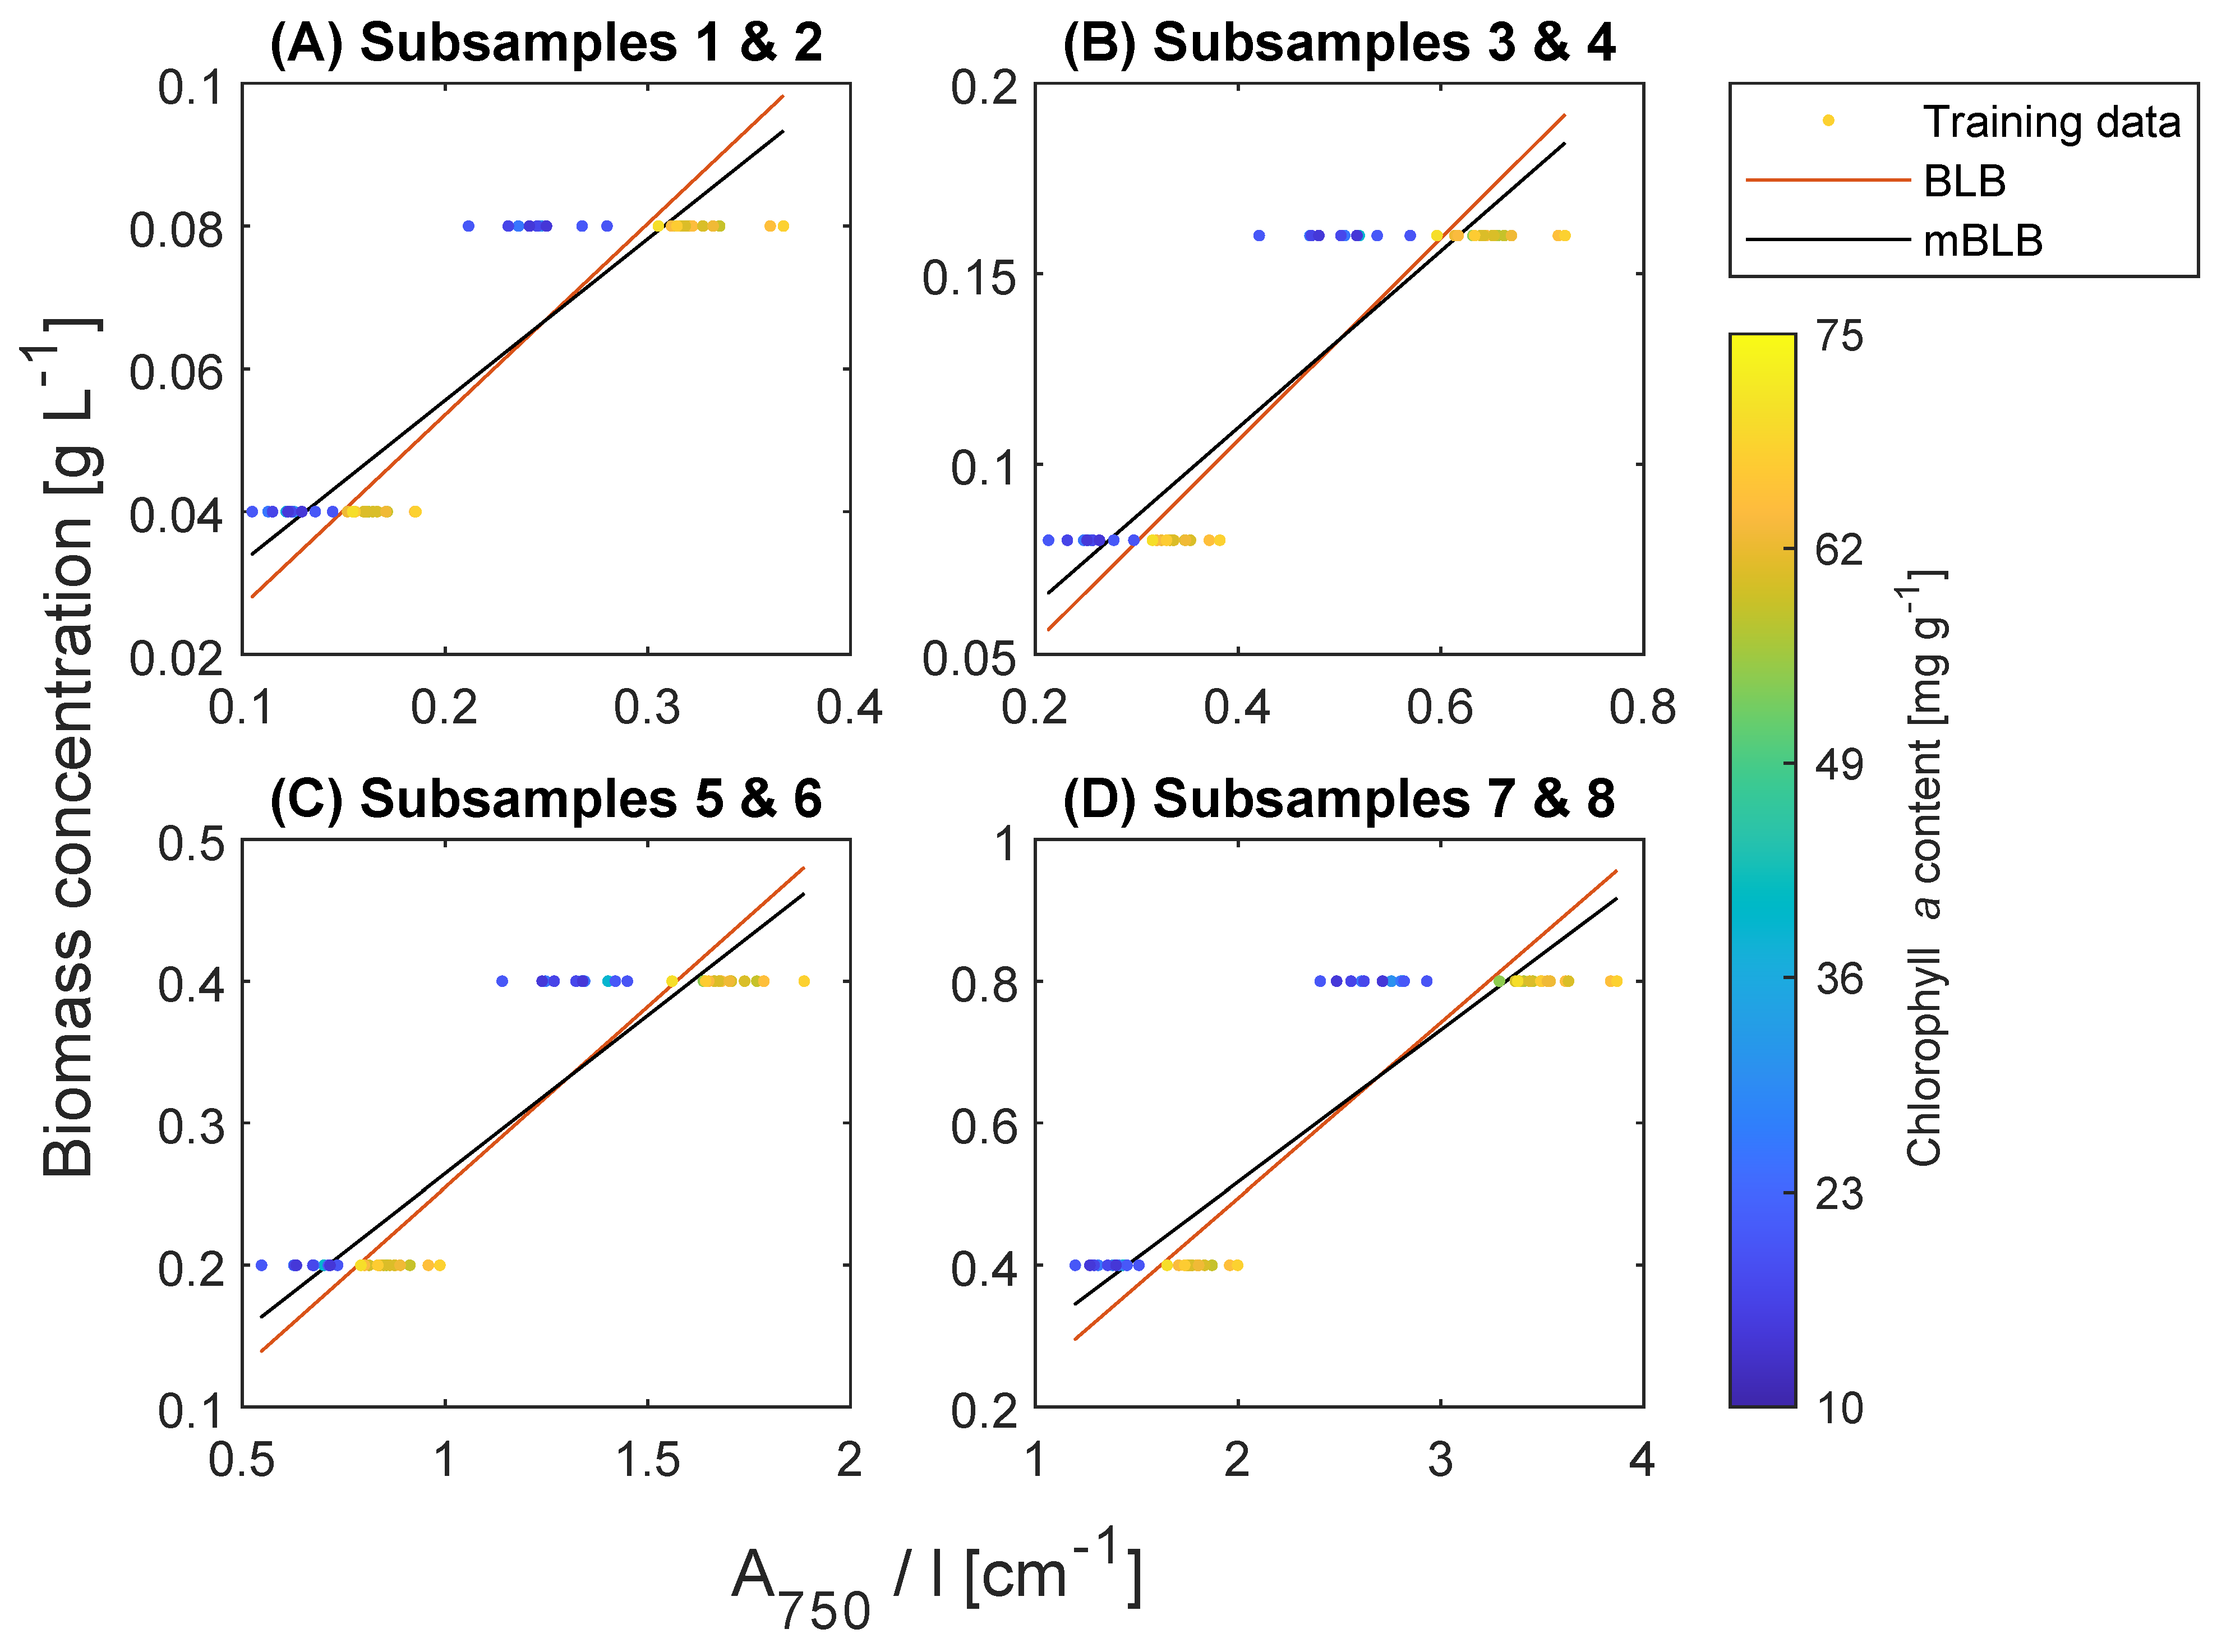
2.4. Biomass Concentration Prediction
2.5. Pigment Content Prediction
3. Materials and Methods
3.1. Cultivation of Phaeodactylum tricornutum
3.2. Measurement Procedure with UV-Vis Spectrophotometer
3.3. Determination of Chlorophyll a and Fucoxanthin Contents by HPLC
3.4. Data Analysis and Model Fitting
3.4.1. Absorbance Prediction
3.4.2. Pigment Content Prediction
4. Conclusions
Author Contributions
Funding
Institutional Review Board Statement
Data Availability Statement
Acknowledgments
Conflicts of Interest
Abbreviations
| Chl a | Chlorophyll a |
| Fx | Fucoxanthin |
| FCP | Fucoxanthin chlorophyll a/c binding protein |
| HPLC | High-performance liquid chromatography |
| BHT | Butylated hydroxytoluene |
| BLB | The Bouguer–Lambert–Beer law |
| mBLB | The modified Bouguer–Lambert–Beer model |
| SAG | The Culture Collection of Algae at Göttingen |
| FPA | Flat-panel airlift |
| PBR | Photobioreactor |
| PLC | Programmable logic controller |
| The squared Pearson correlation coefficient | |
| The coefficient of determination | |
| NRMSE | The normalized root mean square error |
References
- Li, Y.; Chen, M.; Li, Y.; Chen, M. Novel chlorophylls and new directions in photosynthesis research. Funct. Plant Biol. 2015, 42, 493–501. [Google Scholar] [CrossRef]
- Lehmuskero, A.; Skogen Chauton, M.; Boström, T. Light and photosynthetic microalgae: A review of cellular- and molecular-scale optical processes. Prog. Oceanogr. 2018, 168, 43–56. [Google Scholar] [CrossRef]
- Kuczynska, P.; Jemiola-Rzeminska, M.; Nowicka, B.; Jakubowska, A.; Strzalka, W.; Burda, K.; Strzalka, K. The xanthophyll cycle in diatom Phaeodactylum tricornutum in response to light stress. Plant Physiol. Biochem. 2020, 152, 125–137. [Google Scholar] [CrossRef]
- Wang, W.; Yu, L.J.; Xu, C.; Tomizaki, T.; Zhao, S.; Umena, Y.; Chen, X.; Qin, X.; Xin, Y.; Suga, M.; et al. Structural basis for blue-green light harvesting and energy dissipation in diatoms. Science 2019, 363, eaav0365. [Google Scholar] [CrossRef]
- da Silva Ferreira, V.; Sant’Anna, C. Impact of culture conditions on the chlorophyll content of microalgae for biotechnological applications. World J. Microbiol. Biotechnol. 2017, 33, 20. [Google Scholar] [CrossRef]
- Rocha, D.H.A.; Pinto, D.C.G.A.; Silva, A.M.S. Macroalgae Specialized Metabolites: Evidence for Their Anti-Inflammatory Health Benefits. Mar. Drugs 2022, 20, 789. [Google Scholar] [CrossRef]
- Winarto, J.; Song, D.G.; Pan, C.H. The Role of Fucoxanthin in Non-Alcoholic Fatty Liver Disease. Int. J. Mol. Sci. 2023, 24, 8203. [Google Scholar] [CrossRef]
- Sayuti, N.H.; Muhammad Nawawi, K.N.; Goon, J.A.; Mokhtar, N.M.; Makpol, S.; Tan, J.K. A Review of the Effects of Fucoxanthin on NAFLD. Nutrients 2023, 15, 1954. [Google Scholar] [CrossRef]
- Kim, S.M.; Jung, Y.J.; Kwon, O.N.; Cha, K.H.; Um, B.H.; Chung, D.; Pan, C.H. A Potential Commercial Source of Fucoxanthin Extracted from the Microalga Phaeodactylum tricornutum. Appl. Biochem. Biotechnol. 2012, 166, 1843–1855. [Google Scholar] [CrossRef]
- Bigagli, E.; D’Ambrosio, M.; Cinci, L.; Niccolai, A.; Biondi, N.; Rodolfi, L.; Dos Santos Nascimiento, L.B.; Tredici, M.R.; Luceri, C. A Comparative In Vitro Evaluation of the Anti-Inflammatory Effects of a Tisochrysis lutea Extract and Fucoxanthin. Mar. Drugs 2021, 19, 334. [Google Scholar] [CrossRef]
- Lee, A.H.; Shin, H.Y.; Park, J.H.; Koo, S.Y.; Kim, S.M.; Yang, S.H. Fucoxanthin from microalgae Phaeodactylum tricornutum inhibits pro-inflammatory cytokines by regulating both NF-κB and NLRP3 inflammasome activation. Sci. Rep. 2021, 11, 543. [Google Scholar] [CrossRef] [PubMed]
- Pajot, A.; Hao Huynh, G.; Picot, L.; Marchal, L.; Nicolau, E. Fucoxanthin from Algae to Human, an Extraordinary Bioresource: Insights and Advances in up and Downstream Processes. Mar. Drugs 2022, 20, 222. [Google Scholar] [CrossRef] [PubMed]
- Derwenskus, F.; Weickert, S.; Lewandowski, I.; Schmid-Staiger, U.; Hirth, T. Economic evaluation of up- and downstream scenarios for the co-production of fucoxanthin and eicosapentaenoic acid with P. tricornutum using flat-panel airlift photobioreactors with artificial light. Algal Res. 2020, 51, 102078. [Google Scholar] [CrossRef]
- Lichtenthaler, H.K. [34] Chlorophylls and carotenoids: Pigments of photosynthetic biomembranes. In Methods in Enzymology; Plant Cell Membranes; Academic Press: Cambridge, MA, USA, 1987; Volume 148, pp. 350–382. [Google Scholar] [CrossRef]
- Gille, A.; Trautmann, A.; Posten, C.; Briviba, K. Bioaccessibility of carotenoids from Chlorella vulgaris and Chlamydomonas reinhardtii. Int. J. Food Sci. Nutr. 2016, 67, 507–513. [Google Scholar] [CrossRef] [PubMed]
- Eriksen, N.T.; Iversen, J.J.L. On-line determination of pigment composition and biomass in cultures of microalgae. Biotechnol. Technol. 1995, 9, 49–54. [Google Scholar] [CrossRef]
- Shao, Y.; Pan, J.; Zhang, C.; Jiang, L.; He, Y. Detection in situ of carotenoid in microalgae by transmission spectroscopy. Comput. Electron. Agric. 2015, 112, 121–127. [Google Scholar] [CrossRef]
- Wang, L.J.; Fan, Y.; Parsons, R.; Hu, G.R.; Zhang, P.Y.; Li, F.L. A Rapid Method for the Determination of Fucoxanthin in Diatom. Mar. Drugs 2018, 16, 33. [Google Scholar] [CrossRef] [PubMed]
- Pilát, Z.; Bernatová, S.; Ježek, J.; Šerý, M.; Samek, O.; Zemánek, P.; Nedbal, L.; Trtílek, M. Raman microspectroscopy of algal lipid bodies: β-carotene quantification. J. Appl. Phycol. 2012, 24, 541–546. [Google Scholar] [CrossRef]
- Gao, F.; Sá, M.; Teles (Cabanelas, ITD), I.; Wijffels, R.H.; Barbosa, M.J. Production and monitoring of biomass and fucoxanthin with brown microalgae under outdoor conditions. Biotechnol. Bioeng. 2021, 118, 1355–1365. [Google Scholar] [CrossRef]
- Lian, L.; Hu, X.; Huang, Z.; Hu, L.; Xu, L. Pigment analysis based on a line-scanning fluorescence hyperspectral imaging microscope combined with multivariate curve resolution. PLoS ONE 2021, 16, e0254864. [Google Scholar] [CrossRef]
- Vinh, T.Q.; Trung, T.N.; Balasus, J.; Sharma, S.; Hegemann, T.; Greulich, S.; Khanh, T.Q.; Kaldenhoff, R. Light reflection spectra as a tool for direct and real-time determination of biomass and pigments in the microalgae Microchloropsis salina. Light. Res. Technol. 2021, 53, 171–184. [Google Scholar] [CrossRef]
- Thrane, J.E.; Kyle, M.; Striebel, M.; Haande, S.; Grung, M.; Rohrlack, T.; Andersen, T. Spectrophotometric Analysis of Pigments: A Critical Assessment of a High-Throughput Method for Analysis of Algal Pigment Mixtures by Spectral Deconvolution. PLoS ONE 2015, 10, e0137645. [Google Scholar] [CrossRef] [PubMed]
- Macdonald Miller, S.; Abbriano, R.M.; Segecova, A.; Herdean, A.; Ralph, P.J.; Pernice, M. Comparative Study Highlights the Potential of Spectral Deconvolution for Fucoxanthin Screening in Live Phaeodactylum tricornutum Cultures. Mar. Drugs 2021, 20, 19. [Google Scholar] [CrossRef] [PubMed]
- Yeh, Y.C.; Haasdonk, B.; Schmid-Staiger, U.; Stier, M.; Tovar, G.E.M. A novel model extended from the Bouguer-Lambert-Beer law can describe the non-linear absorbance of potassium dichromate solutions and microalgae suspensions. Front. Bioeng. Biotechnol. 2023, 11. [Google Scholar] [CrossRef] [PubMed]
- Kocsis, L.; Herman, P.; Eke, A. The modified Beer–Lambert law revisited. Phys. Med. Biol. 2006, 51, N91–N98. [Google Scholar] [CrossRef]
- Butler, T.O.; Padmaperuma, G.; Lizzul, A.M.; McDonald, J.; Vaidyanathan, S. Towards a Phaeodactylum tricornutum biorefinery in an outdoor UK environment. Bioresour. Technol. 2022, 344, 126320. [Google Scholar] [CrossRef]
- Gao, F.; Teles, I.; Ferrer-Ledo, N.; Wijffels, R.H.; Barbosa, M.J. Production and high throughput quantification of fucoxanthin and lipids in Tisochrysis lutea using single-cell fluorescence. Bioresour. Technol. 2020, 318, 124104. [Google Scholar] [CrossRef]
- Truong, T.Q.; Park, Y.J.; Koo, S.Y.; Choi, J.H.; Enkhbayar, A.; Song, D.G.; Kim, S.M. Interdependence of fucoxanthin biosynthesis and fucoxanthin-chlorophyll a/c binding proteins in Phaeodactylum tricornutum under different light intensities. J. Appl. Phycol. 2023, 35, 25–42. [Google Scholar] [CrossRef]
- Morel, A.; Bricaud, A. Theoretical results concerning light absorption in a discrete medium, and application to specific absorption of phytoplankton. Deep Sea Res. Part A Oceanogr. Res. Pap. 1981, 28, 1375–1393. [Google Scholar] [CrossRef]
- Chioccioli, M.; Hankamer, B.; Ross, I.L. Flow Cytometry Pulse Width Data Enables Rapid and Sensitive Estimation of Biomass Dry Weight in the Microalgae Chlamydomonas reinhardtii and Chlorella vulgaris. PLoS ONE 2014, 9, e97269. [Google Scholar] [CrossRef]
- Schmid-Staiger, U.; Preisner, R.; Trösch, W.; Marek, P. Kultivierung von Mikroalgen im Photobioreaktor zur stofflichen und energetischen Nutzung. Chem. Ing. Tech. 2009, 81, 1783–1789. [Google Scholar] [CrossRef]
- Bergmann, P.; Ripplinger, P.; Beyer, L.; Trösch, W. Disposable Flat Panel Airlift Photobioreactors. Chem. Ing. Tech. 2013, 85, 202–205. [Google Scholar] [CrossRef]
- Bergmann, P.; Trösch, W. Repeated fed-batch cultivation of Thermosynechococcus elongatus BP-1 in flat-panel airlift photobioreactors with static mixers for improved light utilization: Influence of nitrate, carbon supply and photobioreactor design. Algal Res. 2016, 17, 79–86. [Google Scholar] [CrossRef]
- Mann, J.E.; Myers, J. On Pigments, Growth, and Photosynthesis of Phaeodactylum Tricornutum12. J. Phycol. 1968, 4, 349–355. [Google Scholar] [CrossRef] [PubMed]
- Meiser, A.; Schmid-Staiger, U.; Trösch, W. Optimization of eicosapentaenoic acid production by Phaeodactylum tricornutumin the flat panel airlift (FPA) reactor. J. Appl. Phycol. 2004, 16, 215–225. [Google Scholar] [CrossRef]
- Derwenskus, F.; Schäfer, B.; Müller, J.; Frick, K.; Gille, A.; Briviba, K.; Schmid-Staiger, U.; Hirth, T. Coproduction of EPA and Fucoxanthin with P. tricornutum—A Promising Approach for Up- and Downstream Processing. Chem. Ing. Tech. 2020, 92, 1780–1789. [Google Scholar] [CrossRef]
- Kraay, G.W.; Zapata, M.; Veldhuis, M.J.W. Separation of Chlorophylls C1c2, and C3 of Marine Phytoplankton by Reversed-Phase-C18-High-Performance Liquid Chromatography1. J. Phycol. 1992, 28, 708–712. [Google Scholar] [CrossRef]
- Kramer, R. Chemometric Techniques for Quantitative Analysis; CRC Press: Boca Raton, FL, USA, 1998. [Google Scholar]


| BLB | mBLB | ||||||||
|---|---|---|---|---|---|---|---|---|---|
| Subsample | NRMSE | NRMSE | |||||||
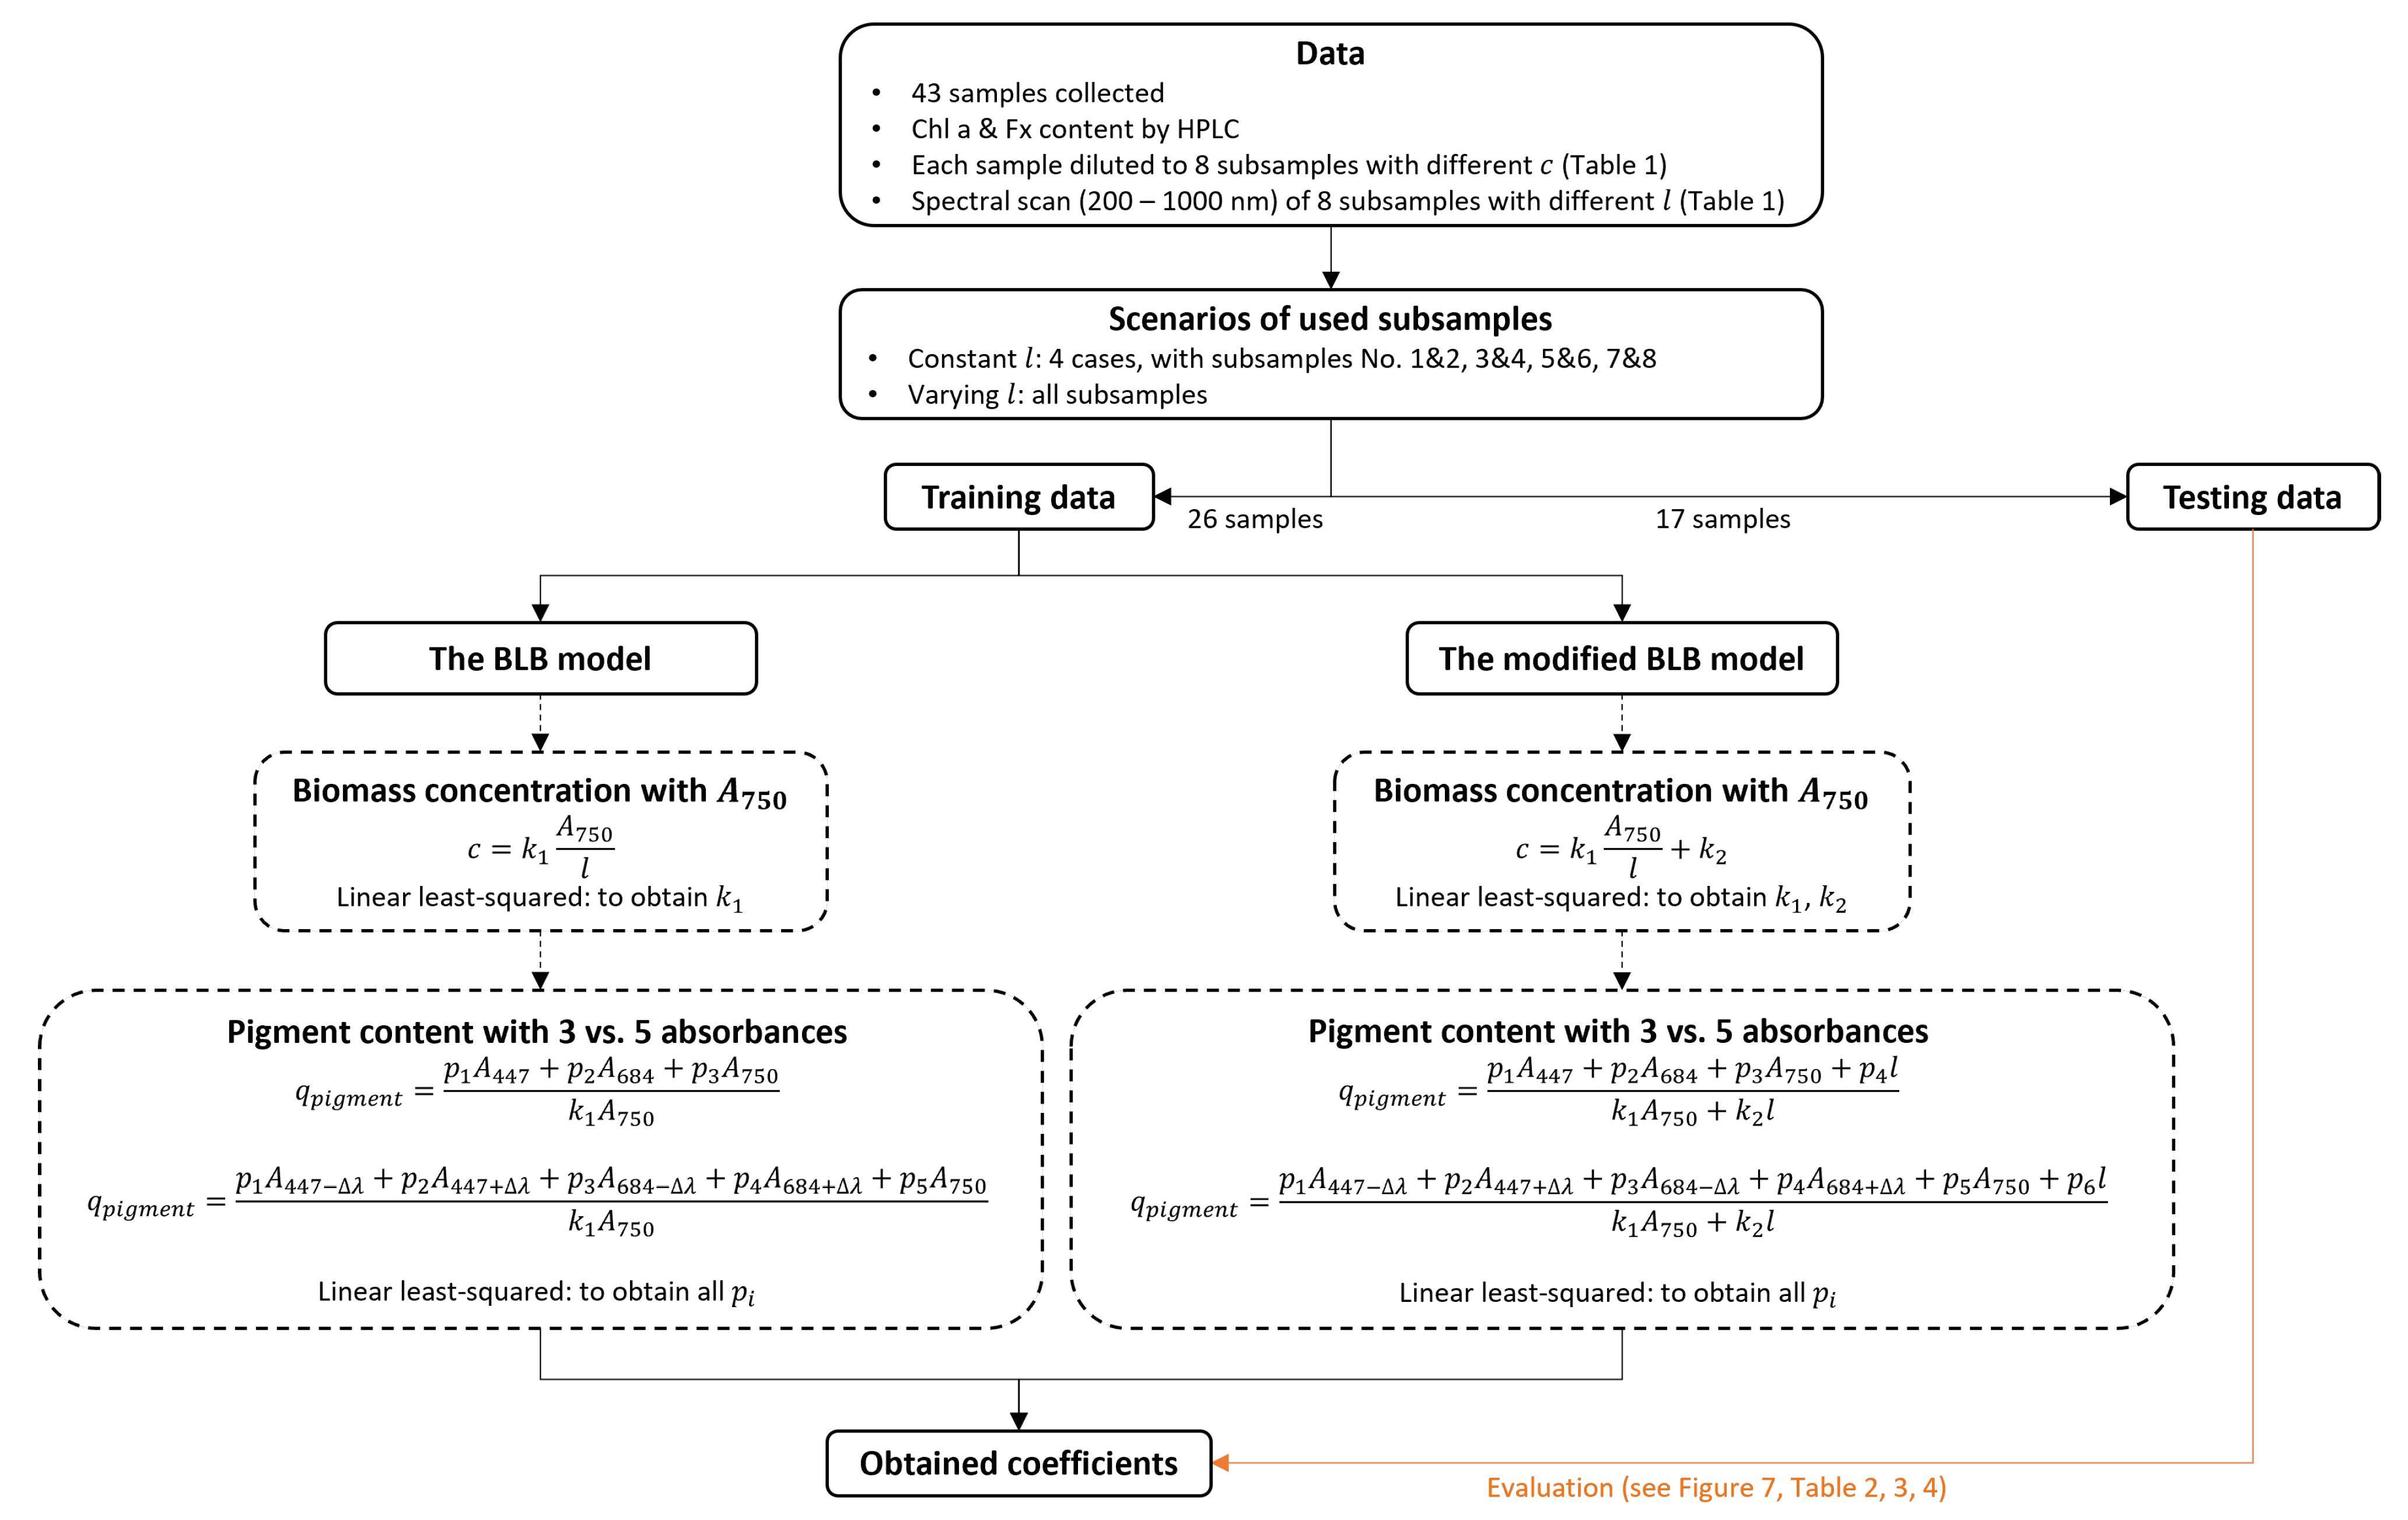
| No. 1 and 2 | 52 | 34 | 0.2678 | 0.8894 | 0.1181 | 0.2262 | 0.0103 | 0.8894 | 0.1200 |
| No. 3 and 4 | 52 | 34 | 0.2655 | 0.8828 | 0.1222 | 0.2319 | 0.0084 | 0.8828 | 0.1204 |
| No. 5 and 6 | 52 | 34 | 0.2547 | 0.8963 | 0.1168 | 0.2228 | 0.0083 | 0.8963 | 0.1148 |
| No. 7 and 8 | 52 | 34 | 0.2472 | 0.8978 | 0.1108 | 0.2139 | 0.0089 | 0.8978 | 0.1125 |
| All | 208 | 136 | 0.2492 | 0.9761 | 0.1431 | 0.2156 | 0.0090 | 0.9748 | 0.1442 |
| Subsample | NRMSE | |||||||||
|---|---|---|---|---|---|---|---|---|---|---|
| No. 1 and 2 | 52 | 34 | −114.23 | 104.91 | −44.44 | 94.93 | −39.58 | 0.16 | 0.9629 | 0.0630 |
| No. 3 and 4 | 52 | 34 | −134.90 | 125.88 | −37.10 | 86.37 | −38.71 | 0.30 | 0.9532 | 0.0715 |
| No. 5 and 6 | 52 | 34 | −73.16 | 63.06 | −69.52 | 115.61 | −33.52 | 0.61 | 0.9415 | 0.0769 |
| No. 7 and 8 | 52 | 34 | −71.53 | 62.81 | −79.37 | 118.50 | −26.85 | 1.04 | 0.9435 | 0.0796 |
| All | 208 | 136 | −77.27 | 69.34 | −68.79 | 111.91 | −32.48 | 0.14 | 0.9467 | 0.0749 |
| Subsample | NRMSE | |||||||||
|---|---|---|---|---|---|---|---|---|---|---|
| No. 1 and 2 | 52 | 34 | −15.07 | 15.86 | −19.15 | 10.39 | 9.90 | 0.06 | 0.9597 | 0.0581 |
| No. 3 and 4 | 52 | 34 | −11.33 | 12.63 | −21.52 | 12.12 | 9.80 | 0.06 | 0.9599 | 0.0600 |
| No. 5 and 6 | 52 | 34 | −10.89 | 11.96 | −20.61 | 11.50 | 9.66 | 0.09 | 0.9552 | 0.0660 |
| No. 7 and 8 | 52 | 34 | −6.21 | 9.96 | −31.23 | 4.93 | 24.42 | 0.17 | 0.9565 | 0.0628 |
| All | 208 | 136 | −9.70 | 10.61 | −20.13 | 12.56 | 8.24 | 0.07 | 0.9515 | 0.0651 |
| Subsample | No. 1 | No. 2 | No. 3 | No. 4 | No. 5 | No. 6 | No. 7 | No. 8 |
|---|---|---|---|---|---|---|---|---|
| c (−1) | 0.04 | 0.08 | 0.08 | 0.16 | 0.2 | 0.4 | 0.4 | 0.8 |
| l (cm) | 1 | 1 | 0.5 | 0.5 | 0.2 | 0.2 | 0.1 | 0.1 |
Disclaimer/Publisher’s Note: The statements, opinions and data contained in all publications are solely those of the individual author(s) and contributor(s) and not of MDPI and/or the editor(s). MDPI and/or the editor(s) disclaim responsibility for any injury to people or property resulting from any ideas, methods, instructions or products referred to in the content. |
© 2023 by the authors. Licensee MDPI, Basel, Switzerland. This article is an open access article distributed under the terms and conditions of the Creative Commons Attribution (CC BY) license (https://creativecommons.org/licenses/by/4.0/).
Share and Cite
Yeh, Y.-C.; Ebbing, T.; Frick, K.; Schmid-Staiger, U.; Haasdonk, B.; Tovar, G.E.M. Improving Determination of Pigment Contents in Microalgae Suspension with Absorption Spectroscopy: Light Scattering Effect and Bouguer–Lambert–Beer Law. Mar. Drugs 2023, 21, 619. https://doi.org/10.3390/md21120619
Yeh Y-C, Ebbing T, Frick K, Schmid-Staiger U, Haasdonk B, Tovar GEM. Improving Determination of Pigment Contents in Microalgae Suspension with Absorption Spectroscopy: Light Scattering Effect and Bouguer–Lambert–Beer Law. Marine Drugs. 2023; 21(12):619. https://doi.org/10.3390/md21120619
Chicago/Turabian StyleYeh, Yen-Cheng, Tobias Ebbing, Konstantin Frick, Ulrike Schmid-Staiger, Bernard Haasdonk, and Günter E. M. Tovar. 2023. "Improving Determination of Pigment Contents in Microalgae Suspension with Absorption Spectroscopy: Light Scattering Effect and Bouguer–Lambert–Beer Law" Marine Drugs 21, no. 12: 619. https://doi.org/10.3390/md21120619
APA StyleYeh, Y.-C., Ebbing, T., Frick, K., Schmid-Staiger, U., Haasdonk, B., & Tovar, G. E. M. (2023). Improving Determination of Pigment Contents in Microalgae Suspension with Absorption Spectroscopy: Light Scattering Effect and Bouguer–Lambert–Beer Law. Marine Drugs, 21(12), 619. https://doi.org/10.3390/md21120619