Article

Regulation of the Spontaneous Augmentation of NaV1.9 in Mouse Dorsal Root Ganglion Neurons: Effect of PKA and PKC Pathways

1
Technical Center, Hiroshima University, Hiroshima, 734-8551, Japan
2
Department of Neurophysiology, Graduate School of Biomedical Sciences, Hiroshima University, Hiroshima, 734-8551, Japan
*
Authors to whom correspondence should be addressed.
Mar. Drugs 2010, 8(3), 728-740; https://doi.org/10.3390/md8030728
Submission received: 15 January 2010 / Revised: 8 February 2010 / Accepted: 18 March 2010 / Published: 19 March 2010
(This article belongs to the Special Issue Tetrodotoxin 2011)

Abstract

:
Sensory neurons in the dorsal root ganglion express two kinds of tetrodotoxin resistant (TTX-R) isoforms of voltage-gated sodium channels, NaV1.8 and NaV1.9. These isoforms play key roles in the pathophysiology of chronic pain. Of special interest is NaV1.9: our previous studies revealed a unique property of the NaV1.9 current, i.e., the NaV1.9 current shows a gradual and notable up-regulation of the peak amplitude during recording (“spontaneous augmentation of NaV1.9”). However, the mechanism underlying the spontaneous augmentation of NaV1.9 is still unclear. In this study, we examined the effects of protein kinases A and C (PKA and PKC), on the spontaneous augmentation of NaV1.9. The spontaneous augmentation of the NaV1.9 current was significantly suppressed by activation of PKA, whereas activation of PKA did not affect the voltage dependence of inactivation for the NaV1.9 current. On the contrary, the finding that activation of PKC can affect the voltage dependence of inactivation for NaV1.9 in the perforated patch recordings, where the augmentation does not occur, suggests that the effects of PMA are independent of the augmentation process. These results indicate that the spontaneous augmentation of NaV1.9 was regulated directly by PKA, and indirectly by PKC.

1. Introduction

Voltage-gated sodium channels (Na+ channels) mediate the transient increase in Na+ conductance that underlies the action potential of neurons and other excitable cells. In mammals, a family of Na+ channel α subunits (designated NaV1.1–NaV1.9) exhibit unique patterns of anatomical expression and varied functional and pharmacological properties [1,2].
Unmyelinated C-fibers originate from small primary afferent neurons of the dorsal root ganglion (DRG), and transmit nociceptive information to the central nervous system. Na+ currents expressed in small DRG neurons can be classified into two categories on the basis of their relative sensitivity to tetrodotoxin (TTX); the first, TTX-sensitive (TTX-S) Na+ currents and the second, TTX-resistant (TTX-R) Na+ currents. TTX-R Na+ currents can be further subdivided into the current mediated by NaV1.8, known as SNS [36], and the current mediated by NaV1.9, known as NaN [711].
The NaV1.9 current is characterized by a low activation threshold of about −60 mV and the depolarized steady-state inactivation (h) curve [7,1113]. From these observations, the NaV1.9 current may mainly regulate subthreshold excitability of small DRG neurons [7,10,11,13]. Our previous studies have demonstrated gradual and notable increase-decrease of the peak amplitude of the NaV1.9 current during whole-cell patch clamp recording (referred to as ‘spontaneous augmentation of NaV1.9’). The spontaneous augmentation of NaV1.9 was not observed in the presence intracellular ATP (3 mM) and by using nystatin-perforated patch clamp recording. These results suggest possible involvement of the intracellular environment in the spontaneous augmentation of NaV1.9 [11].
It is well known that protein kinases A and C (PKA and PKC), and phosphatases, as well as other proteins such as Ca2+-calmodulin-dependent kinase, growth-factor-dependent receptor tyrosine kinases, extracellular signal-regulated kinases and heterotrimeric G proteins, also modulate Na+ channels [1416]. At present, endogenous factors that regulate the spontaneous augmentation of NaV1.9 have not been identified. In sensory neurons, activation of PKA and PKC affects the biophysical properties of Na+ channels [1]. As a first step to the above issue, we focused on the possible involvement of the PKA and PKC pathways in the spontaneous augmentation of NaV1.9. For this purpose, in this study we examined the effects of activators and inhibitors of PKA and PKC on the spontaneous augmentation of NaV1.9, using NaV1.8 knock-out (KO) mice [5,11,13] to record the NaV1.9 current in isolation.

2. Results and Discussion

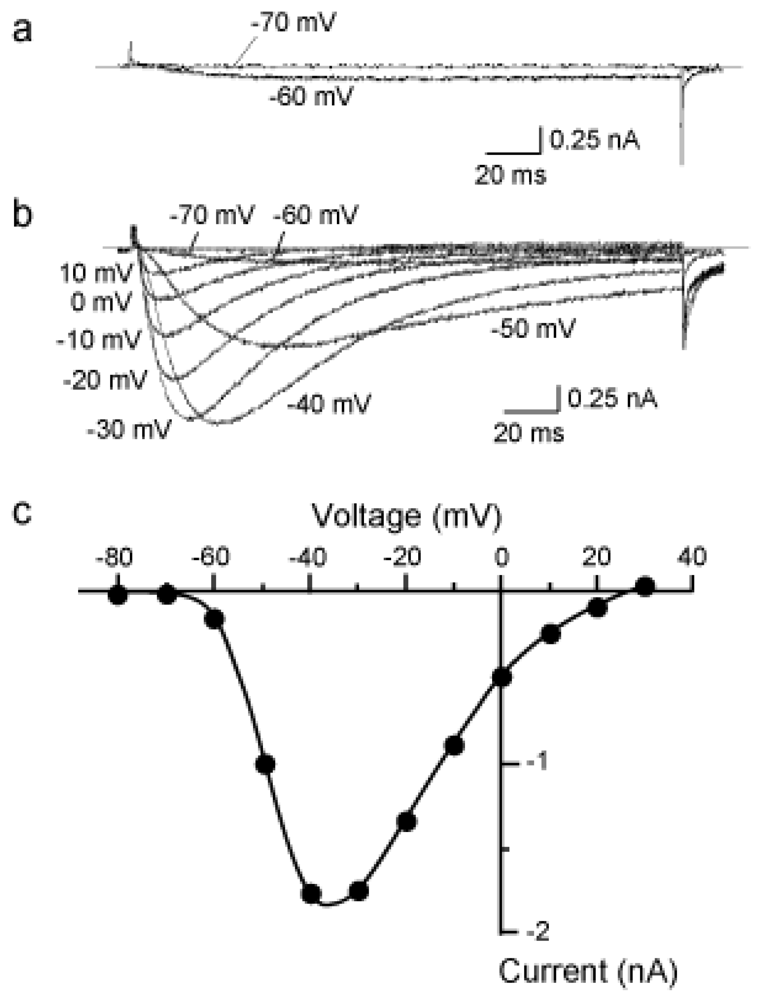
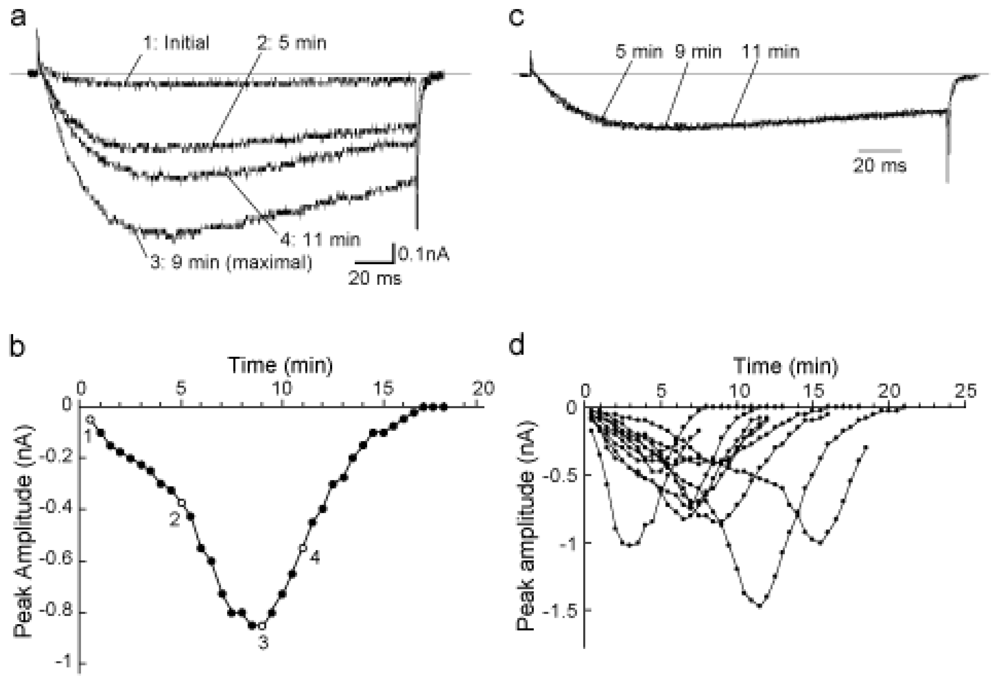
2.1. Characterization of the NaV1.9 current

The detailed properties of the NaV1.9 current was already described in our previous reports [11,13,17]. A typical example of the NaV1.9 currents is shown in Figure 1. Currents were evoked by a 200 ms test pulse (VT) from a holding potential (VH) of −80 mV. TTX-sensitive (TTX-S) Na+ currents were completely eliminated by 200 nM TTX contained in the external solution. The NaV1.9 current had an activation threshold at about −60 mV (Figure 1a), which was more negative than thresholds for Na+ currents mediated by NaV1.8 and other TTX-S Na+ currents (about −40 mV) [13]. Time courses of activation and inactivation of the NaV1.9 current were extremely prolonged, particularly at lower activation voltages (Figure 1b). Figure 1c illustrates the current-voltage relationship for the currents shown in Figure 1b.

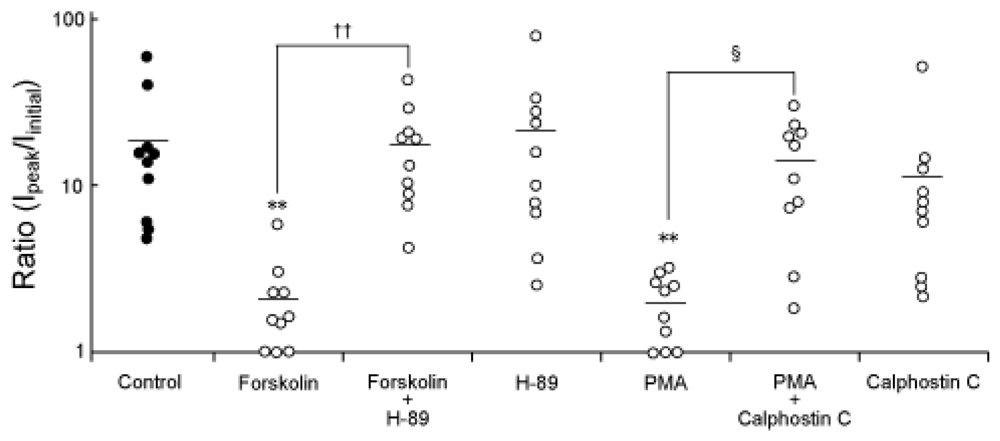
2.2. Modification of the spontaneous augmentation of NaV1.9 by PKA and PKC

As previously described [11,17], the peak amplitude of the NaV1.9 current remarkably increased during conventional whole-cell recording with control pipette solution. As shown in Figure 2, the peak amplitude of the NaV1.9 current gradually increased up to 18.7 ± 5.0-fold of the initial value (n = 10), and then diminished towards the initial value. The total duration of the spontaneous augmentation of NaV1.9 was 12.4 ± 1.7 min (n = 10). In addition, activation and inactivation kinetics of this current did not change during the spontaneous augmentation of NaV1.9 (Figure 2c).
Figure 3 summarizes the intensity changes of the spontaneous augmentation of NaV1.9, which were induced by compounds added to the pipette solution. In the presence of a PKA activator, forskolin (10 μM), the intensity of the spontaneous augmentation of NaV1.9 was significantly attenuated (2.1 ± 0.5-fold: n = 10). Although a PKA inhibitor, H-89 (10 μM). alone had no detectable effect on the intensity of the spontaneous augmentation of NaV1.9 (21.1 ± 7.3-fold: n = 10), the effect of forskolin was significantly inhibited by treatment with H-89 (17.3 ± 3.5-fold: n = 10). A PKC activator, PMA (100 nM), had significant suppressive effect on the intensity of the augmentation of NaV1.9 (2.0 ± 0.3-fold: n = 10). In the presence of a PKC inhibitor, calphostin C (100 nM), the effect of PMA on the augmentation of NaV1.9 was significantly inhibited (14.2 ± 2.8-fold: n = 10). Similarly to H-89, calphostin C alone had no discernable effect on the spontaneous augmentation of NaV1.9 (11.3 ± 4.4-fold: n = 10).

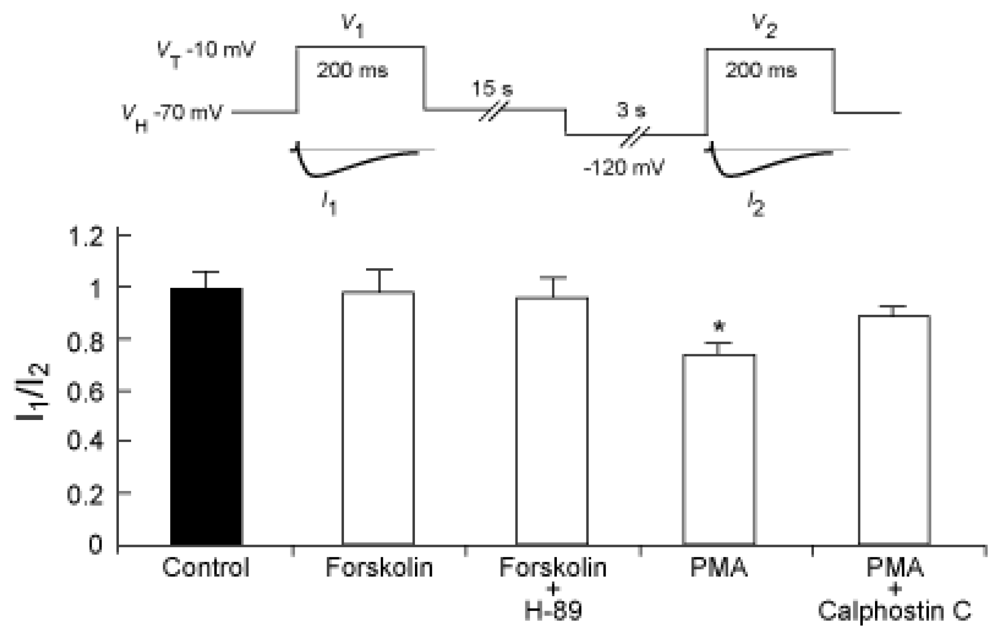
2.3. Possible involvement of PKA and PKC pathways in the voltage dependence of inactivation for the NaV1.9 current

We next examined the effects of forskolin and PMA on the voltage dependence of inactivation for the NaV1.9 current (Figure 4). The voltage dependence of inactivation was determined by measuring peak amplitudes of the NaV1.9 currents evoked by VT to −10 mV from VHs of −70 mV (I1) and −120 mV (I2) intermittently (every 1 minute), and then the ratio of I1/I2 obtained from each group was compared. Just after commencing recording, there were no significant differences between each group (data not shown). 10 minutes after commencing recording, the presence of forskolin (10 μM) alone, or the co-presence of forskolin and H-89 (10 μM), did not significantly change the ratios of I1/I2 (1.00 ± 0.08: n = 8, and 0.99 ± 0.06: n = 6, respectively) versus control (0.99 ± 0.07: n = 8). On the contrary, 100 nM PMA significantly reduced the ratio of I1/I2 (0.75 ± 0.07: n = 8) as compared to control. Calphostin C (100 nM) inhibited PMA-induced reduction of I1/I2 (0.91 ± 0.03: n = 5).

2.4. The effect of PMA on the h curve for the NaV1.9 current is reproducible under nystatin-perforated patch clamp recording

The spontaneous augmentation of NaV1.9 was prevented by using nystatin-perforated patch clamp recording [11]. Therefore, we further examined the effect of forskolin and PMA on the h (voltage dependence of steady-state inactivation) curve for the NaV1.9 current in such a situation. The NaV1.9 current was evoked by VT to 0 mV after various VPREs steps ranging from −120 mV to 10 mV in 10-mV steps for 3 s (see diagram of Figure 5). Figure 5 shows h curves for the NaV1.9 current before (control) and after application of 100 nM PMA or 10 μM forskolin for 10 min. The h curves were fitted to the Boltzmann equation:
I / I max = 1 / { 1 + exp [ ( V PRE - V 1 / 2 ) / k ] }
Where I is the peak amplitude of the NaV1.9 current obtained by VT, Imax is the peak amplitude of the NaV1.9 current evoked by VC, V1/2 is the half-maximum inactivation voltage, and k is the slope factor. We found significant differences (P < 0.05) between parameters obtained after PMA application (n = 5, V1/2 = −52.1 ± 5.4 mV, k = 5.17 ± 0.44 mV) versus control (n = 4, V1/2 = −44.7 ± 6.4 mV, k = 3.75 ± 0.15 mV). On the contrary, there was no significant change between values obtained after forskolin application (n = 5, V1/2 = −44.6 ± 2.1 mV, k = 4.44 ± 0.51 mV) from the control.

2.5. Discussion

The expression of the NaV1.9 current is confined to the subpopulation of primary afferent neurons with a small cell-body diameter similarly to the NaV1.8 current [48,10,11,18]. This observation suggests that NaV1.9 plays an important role in nociception, similar to NaV1.8. On the other hand, the electrophysiological properties of the NaV1.9 current differ notably from those of the NaV1.8 current, i.e., the NaV1.9 current has a more hyperpolarized activation threshold, much slower activation and inactivation kinetics, and a more depolarized h curve [11,13]. These observations suggest that the role of NaV1.9 in nociception may be distinct from that of NaV1.8.
It was reported that the sustained membrane depolarization (over several hundreds of milliseconds), which is resistant to TTX, is observed in myenteric ganglia [12]. In addition, we previously observed similar sustained membrane depolarization mediated by NaV1.9 in small DRG neurons [13]. The NaV1.9 current may have facilitatory functions in the generation of action potential. On the other hand, h curves for other Na+ currents are more depolarized than that of NaV1.9 [11,13]. Taking into consideration these properties, sustained activation of NaV1.9 may decrease the availability of other Na+ channels, and then conversely act to inhibit generation of action potential. Thus, the regulation of membrane potential by NaV1.9 may be facilitatory or inhibitory to generating an action potential, in a context-dependent manner.
In addition, we observed a sporadic and remarkable increase of the peak amplitude of the NaV1.9 current followed by decrease of the peak amplitude during whole-cell patch clamp recording (“spontaneous augmentation of NaV1.9”) [11]. We previously reported that the spontaneous augmentation of NaV1.9 was inhibited by recording with the nystatin-perforated patch clamp technique, and in the presence of intracellular ATP [11,17]. These results suggest a possible involvement of the intracellular environment in the spontaneous augmentation of NaV1.9.
Analyses of brain Na+ channels have shown that the cytoplasmic loop between domains DI and DII of Na+ channels possesses several shared PKA and PKC phosphorylation sites [1920]. In addition, the inactivation gate has a unique site for PKC phosphorylation [22,23]. In fact, activation of PKA reduces the peak amplitude of brain Na+ channels without the shift of the steady-state properties [20,24]. On the other hand, activation of PKC has regulatory effects on skeletal muscle Na+ channels [25], brain Na+ channels [26] and peripheral nerve Na+ channel expressed in Xenopus oocytes [27]. However, the effects of PKA and PKC on the spontaneous augmentation of NaV1.9 in sensory neurons have not been investigated.
First, we focused on the effect of PKA on the spontaneous augmentation of NaV1.9. The spontaneous augmentation of NaV1.9 was significantly suppressed in the presence of forskolin, and H-89 significantly inhibited this suppressive effect of forskolin (Figure 3). These results indicate that the spontaneous augmentation of NaV1.9 is suppressed by activation of PKA. It is well known that the amplitude of Na+ current is strongly affected by steady-state inactivation of the channel. However, forskolin did not change the h curve parameters for the NaV1.9 current in comparison with the control (Figures 4 and 5). This suggests that inhibition of the spontaneous augmentation of NaV1.9 by PKA activation was not due to the hyperpolarizing shift of the h curve for the NaV1.9 current.
Next, we focused on the effect of PKC on the spontaneous augmentation of NaV1.9. PMA significantly reduced the intensity of augmentation, and the effect of PMA was significantly suppressed by Calphostin C (Figure 3). However, application of PMA induced the hyperpolarizing shift of the voltage dependence of inactivation for the NaV1.9 current. Thus, apparent suppression of the spontaneous augmentation of NaV1.9 by PMA was largely due to hyperpolarizing shift of the h curve for the NaV1.9 current.
A similar phenomenon has also been reported by Baker et al., who showed that intracellular GTP [28] or activation of PKC [29] induces the up-regulation of the NaV1.9 current. There are distinct dissimilarities between the up-regulation reported by Baker et al. and the spontaneous augmentation of NaV1.9 described in the present study and also in our previous reports [11,13,17]. Namely, (1) the up-regulation reported by Baker et al. was observed in the presence of intracellular ATP. On the contrary, the spontaneous augmentation of NaV1.9 in our experiments occurred only in the absence of intracellular ATP. (2) the up-regulation reported by Baker et al. was mediated by intracellular GTP or activation of PKC. On the other hand, we find that intracellular GTP has no effect on the spontaneous augmentation of NaV1.9 (unpublished data). (3) Baker et al. showed only an increment of peak amplitude of the NaV1.9 current, and did not show the entire time course of the phenomenon [28,29]. The spontaneous augmentation of NaV1.9 was composed of an increase and a subsequent decrease of peak amplitude of the NaV1.9 current. From these observations, the up-regulation reported by Baker et al. may be distinct from the spontaneous augmentation of NaV1.9 in our studies.
A recent behavioral study showed that the PKA inhibitor, H-89, suppresses bee venom-induced mechanical hyperalgesia in rats [30], and the activation of PKA is conductive to the inflammatory mechanical hyperalgesia [31,32]. In addition, activity of specific PKC isozymes is increased in inflammatory-pain models in rats [3336]. From these observations, the NaV1.9 channel may be regulated not to increase the amplitude of the NaV1.9 current, i.e., the spontaneous augmentation of NaV1.9 under pathological condition by PKA and/or PKC activation.
Recently, it has been reported that NaV1.9 underlies nociceptive behavior after peripheral inflammation in NaV1.9 KO mice [37]. In addition, histochemical study on NaV1.9 channel proteins in axons of normal and complete Freund’s adjuvant-inflamed rats showed significant decrease of the proportion of NaV1.9-labeled unmyelinated axons, and no change in the proportion of labeled myelinated axons following inflammation [18]. Taken together, the NaV1.9 current contributes to pain signaling, and may alter under pathophysiological conditions.

3. Experimental Section

3.1. Isolation of single DRG neurons and cell culture

The protocols were approved by Hiroshima University Animal Ethics Committee. Dissociation of single DRG neurons and their culture was described previously. [11,13]. Briefly, adult mice were sacrificed by cervical dislocation under ethylcarbamate anesthesia (3 mg/g; Wako Pure Chemicals, Osaka, Japan). DRGs from all segments of the spinal cord were dissected from NaV1.8 KO mice [5] and desheathed in ice-cold Ca2+/Mg2+-free phosphate-buffered saline (PBS(−)). The isolated DRGs were incubated sequentially in PBS(−) containing 0.2% collagenase (Wako Pure Chemicals) and 0.1% trypsin (Sigma, St. Louis, Mo., USA), each for 20 min at 37 °C. DRGs were then dissociated by trituration with fire-polished Pasteur pipettes in culture medium composed of Dulbecco’s modified Eagle medium 10% (vol./vol.) heat-inactivated fetal calf serum.
The dissociated cells were plated on 35 mm plastic tissue-culture dishes pre-coated with 0.01% poly-l-lysine (Sigma) and maintained in culture medium supplemented with penicillin (100 IU/mL) and streptomycin (100 μg/mL). All cultured cells were maintained at 37 °C in 5% CO2/95% air. Cells were used for experiments after short-term culture (4–12 h after plating). At this time in culture, neurite outgrowth was not observed. We defined DRG neurons that were smaller than 25 μm in diameter as small neurons [13,28], and small neurons thus defined were used throughout the study.

3.2. Electrophysiology

Voltage clamp recordings were performed using an Axopatch 200A amplifier (Axon Instruments, Union City, CA, USA). The Na+ currents were recorded by using either the conventional whole-cell patch clamp technique [38] or the nystatin-perforated patch clamp technique [39] at room temperature (22–24 °C). Data were low-pass-filtered at 5 kHz with a four-pole Bessel filter and sampled digitally at 25–100 kHz. In some experiments, capacitive and leakage currents were subtracted digitally using the P-P/4 procedure [4].
The pipette (internal) solution contained 10 mM NaCl, 110 mM CsCl, 20 mM tetra-ethylammonium (TEA)-Cl, 2.5 mM MgCl2, 5 mM 4-2-hydroxylethyl-1-piperazine-ethanesulfonic acid (HEPES) and 5 mM ethylene glycol tetraacetic acid (EGTA). The pH of the pipette solution was adjusted to 7.0 with CsOH. Osmolarity was adjusted to 290 mosmol/kg with glucose. A part of the experiments were performed with the pipette solution containing phorbol 12-myristate 13-acetate (PMA), calphostin C, forskolin and H-89 (Sigma). For the pipette solution used in nystatin-perforated patch recordings, a stock solution containing 10mg/mL nystatin (Wako) was prepared and added to the pipette solution to final concentration of 500 μg/mL. Patch clamp pipettes were made from borosilicate capillary by using a PP-83 puller (Narishige, Tokyo, Japan) and heat-polished with MF-83 microforge (Narishige). The DC resistance of patch electrodes was 1–1.5 MΩ for the conventional whole-cell patch and 3–5 MΩ for the nystatin-perforated patch, respectively.
The external solution contained 100 mM NaCl, 30 mM TEA-Cl, 5 mM CsCl, 1.8 mM CaCl2, 1 mM MgCl2, 0.1 mM CdCl2, 5 mM HEPES, 25 mM glucose, 5 mM 4-aminopyrimidine (4-AP). The pH of the external solution was adjusted to 7.4 with HCl. TEA-Cl and 4-AP were added to abolish K+ currents and CdCl2 was added to abolish Ca2+ currents [4]. In addition, TTX (Sanko, Tokyo, Japan) was added to eliminate TTX-S Na+ currents. Osmolarity was adjusted to 290 mosmol/kg with glucose. A part of the experiments were performed with the external solution containing PMA and forskolin (Sigma). Liquid junction potentials between pipette and external solutions were compensated by adjusting the zero current potential to the liquid junction potential. Only cells showing an adequate voltage and space clamp [11] were used.
When measuring ion channel kinetics, it generally take a considerable time to execute the protocol, since a sufficient recovery period for the channel must be allowed between each test pulse (VT). For various reasons, the amplitudes of Na+ currents are not always constant during recording, e.g., due to run-down of the current or to instability of the seal condition. This can be checked by applying a control pulse (VC) before each VT. To avoid a possible time-dependent fluctuation of the analysis, VC to a fixed voltage as applied 15 s before VT or conditioning pre-pulse (VPRE). The amplitude of the current (IC) evoked by VC served as a calibrator. The results are given as mean ± standard error of the mean (S.E.M.). Statistical significance of differences was determined using Wilcoxon t-test and Mann-Whitney U-test. Differences were considered significant if P < 0.05.

4. Conclusions

The spontaneous augmentation of the NaV1.9 current was significantly suppressed by activation of PKA, whereas activation of PKA did not affect the voltage dependence of inactivation for the NaV1.9 current. On the contrary, the finding that activation of PKC can affect the voltage dependence of inactivation for NaV1.9 in the perforated patch recordings, where the augmentation does not occur, suggests that the effects of PMA are independent of the augmentation process. These results indicate that the spontaneous augmentation of NaV1.9 was regulated directly by PKA, and indirectly by PKC.

References

  1. Chahine, M; Ziane, R; Vijayaragaban, K; Okamura, Y. Regulation of NaV channels in sensory neurons. Trends Pharmacol Sci 2005, 26, 496–502. [Google Scholar]
  2. Cummins, TR; Rush, AM. Voltage-gated sodium channel blockers for the treatment of neuropathic pain. Expert Rev Neurother 2007, 7, 1597–612. [Google Scholar]
  3. Elliot, AA; Elliot, JR. Characterization of TTX-sensitive and TTX-resistant sodium currents in small cells from adult rat dorsal root ganglia. J Physiol 1993, 463, 39–56. [Google Scholar]
  4. Ogata, N; Tatebayashi, H. Kinetic analysis of two types of Na+ channels in rat dorsal root ganglia. J Physiol 1993, 466, 9–37. [Google Scholar]
  5. Akopian, AN; Souslova, V; England, S; Okuse, K; Ogata, N; Ure, J; Smith, A; Kerr, BJ; McMahon, SB; Boyce, H; Hill, R; Stanfa, LC; Dickerson, AH; Wood, JN. The tetrodotoxin-resistant sodium channel SNS has a specialized function in pain pathways. Nat Neurosci 1999, 2, 541–548. [Google Scholar]
  6. Renganathan, M; Cummins, TR; Waxman, SG. Contribution of NaV1.8 sodium channels to action potential electrogenesis in DRG neurons. J Neurophysiol 2001, 86, 629–640. [Google Scholar]
  7. Cummins, TR; Dib-Hajj, SD; Black, JA; Akopian, AN; Wood, JN; Waxman, SG. A novel persistent tetrodotoxin-resistant sodium current in sns-null and wild-type small primary sensory neurons. J Neurosci 1999, 19, 1–6. [Google Scholar]
  8. Dib-Hajj, SD; Tyrell, L; Escayg, A; Wood, PM; Meisler, MH; Waxman, SG. Coding sequence, genomic organization, and conserved chromosomal localization of the mouse gene Scn11a encoding the sodium channel NaN. Genomics 1999, 59, 309–318. [Google Scholar]
  9. Herzog, RI; Cummins, TR; Waxman, SG. Persistent TTX-resistant Na+ current affects resting potential and response to depolarization in stimulated spinal sensory neurons. J Neurophysiol 2001, 86, 1351–1364. [Google Scholar]
  10. Rugiero, F; Mistry, M; Sage, D; Black, JA; Waxman, SG; Crest, M; Clere, N; Delmas, P; Gola, M. Selective expression of a persistent tetrodotoxin-resistant Na+ current and NaV1.9 subunit in myenteric sensory neurons. J Neurosci 2003, 23, 2715–2725. [Google Scholar]
  11. Maruyama, H; Yamamoto, M; Matsutomi, T; Zheng, T; Nakata, Y; Wood, JN; Ogata, N. Electrophysiological characterization of the tetrodotoxin-resistant Na+ channel, NaV1.9, in mouse dorsal root ganglion neurons. Pflugers Arch 2004, 449, 76–87. [Google Scholar]
  12. Coste, B; Osorio, N; Padilla, O; Crest, M; Delmas, P. Gating and modulation of presumptive NaV1.9 channels in enteric and spinal sensory neurons. Mol Cell Neurosci 2004, 26, 123–134. [Google Scholar]
  13. Matsutomi, T; Nakamoto, C; Zheng, T; Kakimura, J; Ogata, N. Multiple types of Na+ currents mediate action potential electrogenesis in small neurons of mouse dorsal root ganglia. Pflugers Arch 2006, 453, 83–96. [Google Scholar]
  14. Lu, T; Lee, HC; Kabat, JA; Shibata, EF. Modulation of rat cardiac sodium channel by the stimulatory G protein α subunit. J Physiol 1999, 518, 371–384. [Google Scholar]
  15. Aley, KO; Messing, RO; Mochly-Rosen, D; Levine, JD. Chronic hypersensitivity for inflammatory nociceptor sensitization mediated by the epsilon isozyme of protein kinase C. J Neurosci 2000, 20, 4680–4685. [Google Scholar]
  16. Deschênes, I; Neyroud, N; DiSilvestre, D; Marbán, E; Yue, DT; Tomaselli, GF. Isoform-specific modulation of voltage-gated Na+ channels by calmodulin. Circ Res 2002, 90, E49–57. [Google Scholar]
  17. Zheng, T; Kakimura, J; Matsutomi, T; Nakamoto, C; Ogata, N. Prostaglandin E2 has no effect on two components of tetrodotoxin-resistant Na+ current in mouse dorsal Root ganglion. J Pharmacol Sci 2007, 103, 93–102. [Google Scholar]
  18. Coggeshall, RE; Tate, S; Carlton, SM. Differential expression of tetrodotoxin resistant sodium channels NaV1.8 and NaV1.9 in normal and inflamed rats. Neurosci Lett 2004, 355, 45–48. [Google Scholar]
  19. Murphy, BJ; Rossie, S; De Jongh, KS; Catterall, WA. Identification of the sites of selective phosphorylation and dephosphorylation of the rat brain Na+ channel α subunit by cAMP-dependent protein kinase and phosphoprotein phosphatases. J Biol Chem 1993, 268, 27355–27362. [Google Scholar]
  20. Smith, RD; Goldin, AL. Potentiation of rat brain sodium channel currents by PKA in Xenopus oocytes involves the I–II linker. Am J Physiol Cell Physiol 2000, 278, C638–645. [Google Scholar]
  21. Cantrell, AR; Tibbs, VC; Yu, FH; Murphy, BJ; Sharp, EM; Qu, Y; Catterall, WA; Scheuer, T. Molecular mechanism of convergent regulation of brain Na+ channels by protein kinase C and protein kinase A anchored to AKAP-15. Mol Cell Neurosci 2002, 21, 63–80. [Google Scholar]
  22. West, JW; Numann, R; Murphy, BJ; Scheuer, T; Catterall, WA. A phosphorylation site in the Na+ channel required for modulation by protein kinase C. Science 1991, 254, 866–868. [Google Scholar]
  23. Qu, Y; Rogers, JC; Tanada, TN; Catterall, WA; Scheuer, T. Phosphorylation of S1505 in the cardiac Na+ channel inactivation gate is required for modulation by protein kinase C. J Gen Physiol 1996, 108, 375–379. [Google Scholar]
  24. Li, M; West, JW; Lay, Y; Scheuer, T; Catterall, WA. Functional modulation of brain sodium channels by cAMP-dependent phosphorylation. Neuron 1992, 8, 1151–1159. [Google Scholar]
  25. Numann, R; Hauschka, SD; Catterall, WA; Scheuer, T. Modulation of skeletal muscle sodium channels in a satellite cell line by protein kinase C. J Neurosci 1994, 14, 4226–4236. [Google Scholar]
  26. Numann, R; Catterall, WA; Scheuer, T. Functional modulation of brain sodium channels by protein kinase C phosphorylation. Science 1991, 254, 115–118. [Google Scholar]
  27. Kausalia, V; Mohamed, B; Mohamed, C. Modulation of NaV1.7 and NaV1.8 Peripheral Nerve Sodium Channels by Protein Kinase A and Protein Kinase C. J Neurophysiol 2004, 91, 1556–1569. [Google Scholar]
  28. Baker, MD; Chandra, SY; Ding, Y; Waxman, SG; Wood, JN. GTP-induced tetrodotoxin-resistant Na+ current regulates excitability in mouse and rat small diameter sensory neurons. J Physiol 2003, 548, 373–382. [Google Scholar]
  29. Baker, MD. Protein kinase C mediates up-regulation of tetrodotoxin-resistant, persistent Na+ current in rat and mouse sensory neurons. J Physiol 2005, 567, 851–867. [Google Scholar]
  30. Chen, H; Lei, J; He, X; Qu, F; Wang, Y; Wen, W; You, H; Arendt-Nielsen, L. Peripheral involvement of PKA and PKC in subcutaneous bee venom-induced persistent nociception, mechanical hyperalgesia, and inflammation in rats. Pain 2008, 135, 31–36. [Google Scholar]
  31. Cunha, FQ; Teixera, MM; Ferreira, SH. Pharmacological modulation of secondary mediator systems - cyclic AMP and cyclic GMP - on inflammatory hyperalgesia. Br J Pharmacol 1999, 127, 671–678. [Google Scholar]
  32. Cunha, JM; Rae, GA; Ferreira, SH; Cunha, FQ. Endothelins induce ETB receptor-mediated mechanical hypernociception in rat hindpaw: roles of cAMP and protein kinase C. Eur J Pharmacol 2004, 501, 87–94. [Google Scholar]
  33. Khasar, SG; Lin, YH; Martin, A; Dadgar, J; McMahon, T; Wang, D; Hundle, B; Aley, KO; Isenberg, W; McCarter, G; Green, PG; Hodge, CW; Levine, JD; Messing, RO. A novel nociceptor signaling pathway revealed in protein kinase Cɛ mutant mice. Neuron 1999, 24, 253–260. [Google Scholar]
  34. Martin, WJ; Liu, H; Wang, H; Malmberg, AB; Basbaum, AI. Inflammation-induced up-regulation of protein kinase Cγ immunoreactivity in rat spinal cord correlates with enhanced nociceptive processing. Neuroscience 1999, 88, 1267–1274. [Google Scholar]
  35. Aley, KO; Martin, A; McMahon, T; Mok, J; Levine, JD; Messing, RO. Nociceptor sensitization by extracellular signal-regulated kinases. J Neurosci 2001, 21, 6933–6939. [Google Scholar]
  36. Igwe, OJ; Chronwall, BM. Hyperalgesia induced by peripheral inflammation is mediated by protein kinase C βII isozyme in the rat spinal cord. Neuroscience 2001, 104, 875–890. [Google Scholar]
  37. Priest, BT; Murphy, BA; Lindia, JA; Diaz, C; Abbadie, C; Ritter, AM; Liberator, P; Iyer, LM; Kash, SF; Kohler, MG; Kaczorowski, GJ; Maclntyre, DE; Martin, WJ. Contribution of the tetrodotoxin-resistant voltage-gated sodium channel NaV1.9 to sensory transmission and nociceptive behavior. Proc Natl Acad Sci USA 2005, 102, 9382–9387. [Google Scholar]
  38. Hamill, OP; Marty, A; Neher, E; Sakmann, B; Sigworth, FJ. Improved patch-clamp techniques for high-resolution current recordings from cells and cell-free membrane patches. Pflugers Arch 1981, 391, 85–100. [Google Scholar]
  39. Horn, R; Marty, A. Muscarinic activation of ionic currents measured by a new whole-cell recording method. J Gen Physiol 1988, 92, 145–159. [Google Scholar]
Figure 1. Typical examples of the tetrodotoxin-resistant (TTX-R) Na+ current mediated by NaV1.9. The NaV1.9 current was recorded from the small (diameter < 25 μm) dorsal root ganglion (DRG) neuron prepared from the NaV1.8 knock-out (KO) mouse. Currents were elicited by 200 ms test pulse (VT) from a holding potential (VH) of −80 mV. (a) The activation threshold for the NaV1.9 current. The NaV1.9 current could be activated at −60 mV, whereas VT to −70 mV failed to elicit. (b) A family of superimposed NaV1.9 currents evoked by VTs between −70 and +10 mV in 10-mV increments from VH of −80 mV. The external solution contained 200 nM TTX. Voltage labels attached to traces indicate VTs. (c) The current-voltage curve for the NaV1.9 current shown in panel (b). Peak amplitudes of the currents were plotted against VT.
Marinedrugs 08 00728f1
Figure 2. (a) Time courses of the NaV1.9 currents recorded with normal pipette solution. The NaV1.9 current was evoked by VT to −10 mV from VH of −80 mV, and command pulses were applied every 30 s. Then, selected traces were superimposed. (b) Typical example of the spontaneous augmentation of NaV1.9. Peak amplitudes of the NaV1.9 current were plotted as a function of time after onset of the spontaneous augmentation of NaV1.9. Numbers indicate the traces shown in panel (a). (c) Traces of the NaV1.9 currents shown in panel (a) were normalized and then superimposed. (d) Time courses of the NaV1.9 currents in all cases examined.
Marinedrugs 08 00728f2
Figure 3. Modification of the spontaneous augmentation of NaV1.9 by addition of the PKA activator forskolin and the PKC activator PMA to the pipette solution. The ordinate shows the ratio of maximal amplitude during recording to the initial amplitude of the NaV1.9 current (Imaximal/Iinitial). A ratio > 1 indicates the occurrence of the spontaneous augmentation of NaV1.9, whereas a ratio = 1 indicates no change or reduction of the peak amplitude of the NaV1.9 current. The plots are shown on a logarithmic scale. Circles indicate the ratios obtained for individual trials. Filled circles, control; open circles, treated groups. Horizontal bars indicate the mean values of each group. **P < 0.01 versus control, ††P < 0.01 versus forskolin, and §P < 0.05 versus PMA.
Marinedrugs 08 00728f3
Figure 4. The change of the voltage-dependence of inactivation for the NaV1.9 current by activation of PKC. The NaV1.9 currents were evoked by the pulse protocol shown in the diagram. We previously confirmed that the duration of VH for 3 s was sufficient to achieve steady state availability for NaV1.9 [11]. Peak amplitudes of the NaV1.9 currents (I1 and I2) were monitored for 10 min after commencing recording, and the resulting I1/I2 ratios were compared. *P < 0.05 versus control.
Marinedrugs 08 00728f4
Figure 5. The h curve for the NaV1.9 current under nystatin-perforated patch clamp recording. The diagram illustrates the pulse protocol. Two identical pulses to 0 mV for 200 ms were applied 15 s prior (VC) and immediately subsequent (VT) to the conditioning pre-pulse (VPRE) of −120 to 10 mV for 3 s from VH of −80 mV. VC was delivered to minimize the error arising from possible fluctuation of the current (see experimental section). The pulse protocol was applied every 40 s. The peak amplitude of the current (IT) evoked by VT was divided by the peak amplitude of the current (IC) evoked by VC. The ratio of IT/IC was normalized and plotted against VPRE. The h curve for NaV1.9 current was determined, before (control, filled circle) and 10 min after bath application of PMA (open circle) or forskolin (open square).
Marinedrugs 08 00728f5

