Article

Evaluation of Models Describing the Growth of Nalidixic Acid-Resistant E. coli O157:H7 in Blanched Spinach and Iceberg Lettuce as a Function of Temperature

1
Department of Food and Nutrition, Kyung Hee University, 1 Hoeki-dong, Dongdaemun-gu, Seoul 130-701, Korea
2
Department of Food and Nutrition, In Ha University, 253 younghyun-dong, Nam-Gu, Incheon 402-751, Korea
3
Food Microbiology Division, National Institute of Food and Drug Safety Evaluation, Ministry of Food and Drug Safety, Osong-eup 363-700, Korea
*
Author to whom correspondence should be addressed.
Int. J. Environ. Res. Public Health 2013, 10(7), 2857-2870; https://doi.org/10.3390/ijerph10072857
Submission received: 27 May 2013 / Revised: 1 July 2013 / Accepted: 3 July 2013 / Published: 9 July 2013
(This article belongs to the Special Issue Antimicrobial Resistance Prevention and Control)

Abstract

:
The aim of this study was to model the growth of nalidixic acid-resistant E. coli O157:H7 (E. coli O157:H7NR) in blanched spinach and to evaluate model performance with an independent set of data for interpolation (8.5, 13, 15 and 27 °C) and for extrapolation (broth and fresh-cut iceberg lettuce) using the ratio method and the acceptable prediction zone method. The lag time (LT), specific growth rate (SGR) and maximum population density (MPD) obtained from each primary model were modeled as a function of temperature (7, 10, 17, 24, 30, and 36 °C) using Davey, square root, and polynomial models, respectively. At 7 °C, the populations of E. coli O157:H7NR increased in tryptic soy broth with nalidixic acid (TSBN), blanched spinach and fresh-cut iceberg lettuce, while the populations of E. coli O157:H7 decreased in TSB after 118 h of LT, indicating the risk of nalidixic acid-resistant strain of E. coli O157:H7 contaminated in ready-to-eat produce at refrigerated temperature. When the LT and SGR models of blanched spinach was extended to iceberg lettuce, all relative errors (percentage of RE = 100%) were inside the acceptable prediction zone and had an acceptable Bf and Af values. Thus, it was concluded that developed secondary models for E. coli O157:H7NR in blanched spinach were suitable for use in making predictions for fresh cut iceberg lettuce, but not for static TSBN in this work.

1. Introduction

Fresh vegetables, such as radish sprouts, pre-packed spinach, and lettuce have been recognized as a major vehicle associated with outbreaks of illness caused by Escherichia coli O157:H7 [1,2]. In a USDA Agricultural Marketing Service survey, 29 spinach samples out of 2,328 fresh produce items available at terminal markets and wholesale distribution centers were identified as positive for pathogenic E. coli by mPCR [1]. A multistate outbreak of E. coli O157:H7 infections linked to Romaine lettuce was also reported in the USA [3]. The virulent strain of E. coli O104:H4 in beansprouts has killed 35 and sickened 3,256 in Europe [4]. A total of 33 ill persons infected with an outbreak of the strain E. coli O157:H7 which was linked to pre-packed leafy greens were also reported [5]. According to a report on foodborne outbreaks in Canada [6], the food vehicles most commonly implicated in outbreaks were leaf greens and herbs (26%), followed by seed sprouts (11%).
Predictive models that describe the behavior of E. coli O157:H7 have been developed in broth based on temperature, pH, and additives, such as salt and sodium nitrite [7,8,9,10,11,12]. As fresh produce has been identified as a vehicle for foodborne illness due to E. coli O157:H7 contamination, a complete predictive model for the growth of E. coli O157:H7 has only been developed for iceberg lettuce at constant temperatures ranging from 5 to 25 °C [13]. Recently, a combined growth-death model for E. coli O157:H7 in minimally processed leafy green vegetables using the data from 13 studies was developed [14]. The result showed that the Koseki and Isobe [13] data points, such as growth rate, were the highest of any of the published data sets at all temperatures with under prediction at low temperature, and over prediction at high temperature. Thus more predictive models for E. coli O157:H7 for various forms of produce, including fresh and processed produce, could be a valuable tool to estimate the microbial risk of such foods during distribution.
An important step in the development of predictive models is an evaluation of model performance, which involves goodness-of-fit, interpolation, and extrapolation (model extension). Data on the performance evaluation of interpolation are collected with the same strain, growth media, and modeling methods but by using different combinations of the independent variables that are within the response surface of the model. Also, data for performance evaluation of extrapolation (model extension) are collected in the same manner except that the growth medium or other strains are varied [15]. In general, the performance of a model is quantified using the ratio method [16] and the acceptable prediction zone method [17].
In the present study, we investigated and modeled the growth kinetics of nalidixic acid-resistant E. coli O157:H7 (E. coli O157:H7NR) in broth, blanched spinach, and fresh-cut iceberg lettuce. Additionally, the model performance of the blanched spinach model was evaluated with data not used during model development: an independent set of data for interpolation (at 8.5, 13, 15 and 27 °C) and for extrapolation (using broth and fresh-cut iceberg lettuce model) using the ratio method and the acceptable prediction zone method.

2. Experimental Section

2.1. Bacterial Strains

The strains of E. coli O157:H7 (NCTC12079 and ATCC35150) were maintained at −80 °C in tryptic soy broth (TSB, DIFCO, Sparks, MD, USA) that contained 20% glycerol (Sigma-Aldrich, St. Louis, MO, USA). In this work, we used a nalidixic acid-resistant E. coli O157:H7 strain to distinguish inocula from background microorganisms, including E. coli. The nalidixic acid-resistant strains were prepared according to the method of Inatsu et al. [18] and were designated as E. coli O157:H7NR. E. coli O157:H7 was grown in TSB supplemented with nalidixic acid (Sigma Chemical, St. Louis, MO, USA, 50 µg/mL TSBN). Cultures were incubated at 36 °C and transferred (1 loopful to 10 mL TSBN) three times at 24 h intervals and stored at −80 °C in TSBN containing 20% glycerol. Ten microliters of thawed stock culture was inoculated into a 50 mL Erlenmeyer flask containing 10 mL of TSBN, which was then sealed with a silicone cap and incubated at 36 °C for 24 h on rotary shaker (VS-8480SR, Vision, Daejeon, Korea) at 140 rpm. Viable cell counts ranged from 8.5–9.5 log(CFU/mL).

2.2. Preparation of Inocula for the Broth Model

A volume of TSBN (25 mL) was prepared in a 250 mL Erlenmeyer flask. Each TSBN sample was aseptically inoculated with the diluted starter of a mixture of two E. coli O157:H7NR strains (NCTC12079NR and ATCC35150NR) to give a target population of approximately 2.5–3.5 log(CFU/mL). Inoculated broths were then stored without agitation, which was comparable to the growth dynamics of the pathogen in a more static food medium [19].
To quantify growth during the storage period, diluted culture (100 µL) was plated onto tryptic soy agar (TSA, DIFCO) supplemented with 50 µg nalidixic acid/mL TSAN in duplicate, respectively, and incubated aerobically at 36 °C for 24 h. The colonies on TSAN plates were then counted and bacterial counts from duplicate plates were converted to log numbers.

2.3. Preparation and Inoculation of Blanched Spinach and Fresh-Cut Iceberg Lettuce

Bundled spinach (Spinacia oleracea L.) and wrapped iceberg lettuce (Lactuca sativa L.) stored at 10 °C were purchased from a local market in Seoul, Korea and transported to the lab within 1 h. The stems and roots of bundled spinach were removed and only spinach leaves were washed with running tap water and blanched in 100 °C water for 1 min. Blanched spinach was divided into individual 10 g portions and aseptically placed in Petri dishes. The surfaces of blanched spinach leaves were then inoculated uniformly with 100 µL of the diluted starter culture of a cocktail mixture of E. coli O157:H7NR strains using a sterile pipette to give a target population of approximately 2.5–3.5 log(CFU/g). The inoculated samples were then stored at 7, 10, 17, 24, 30 and 36 °C.
For inoculation of iceberg lettuce, the external, damaged iceberg lettuce leaves and core were discarded before washing. Lettuce leaves were individually washed twice with running tap water for 1 min then rinsed with sterilized distilled water for 1 min and cut into 10 g samples with a disinfected knife.
The fresh-cut lettuce leaves were immersed in inoculum suspension (2 L) for 3 min, which was prepared by transferring l mL of a cocktail mixture of E. coli O157:H7NR strains into 2 L of sterile distilled water. After drying in a bio-safety cabinet for 1 h, 10 g of inoculated sample was aseptically divided into sterile bags and stored at 7, 10, 17, 24, 30 and 36 °C. Each sample was homogenized (Stomacher, Interscience, Paris, France) for 2 min in 40 mL of 0.1% sterilized peptone water. One milliliter of homogenized sample was diluted in 9 mL of 0.1% sterilized peptone water. One hundred microliter aliquots of two dilutions of each sample were plated on TSAN in duplicate and incubated aerobically at 36 °C for 24 h. The colonies on duplicate plates of each sample were counted, and then converted to log numbers.

2.4. Experimental Designs

Blanched spinach, fresh-cut iceberg lettuce, and tryptic soy broth supplemented with 50 µg nalidixic acid (TSBN) were used for model development as a function of temperature. The performance of the models for lag time (LT), specific growth rate (SGR), and maximum population density (MPD) of E. coli O157:H7NR strains (a mixture of NCTC12079NR and ATCC35150NR) in blanched spinach and fresh-cut iceberg lettuce were confirmed with data obtained at temperatures not included in model development.
Additionally, models with different growth substrates including fresh-cut iceberg lettuce and TSBN were compared to the growth model developed with a mixture of E. coli O157:H7NR in blanched spinach for evaluation of applicability of the blanched spinach model for iceberg lettuce and TSBN (model extension).

2.5. Primary Modeling

Viable counts (log(CFU/g)) of E. coli O157:H7NR were graphed as a function of time and then iteratively fitted to the modified Gompertz model using GraphPad PRISM V4.0 (GraphPad Software, San Diego, CA, USA) to determine the lag time (LT), specific growth rate (SGR), and maximum population density (MPD). The model used was as follows:
Yt = N0 + C × exp{−exp[(2.718 × SGR/C) × (LT − t) + 1]}
where Yt is the viable cell count (log(CFU/g)) at time t(h), N0 is the initial log number of cells, C is the difference between the initial and final log cell numbers, SGR is the maximum specific growth rate (log(CFU/h)), LT is the lag time before growth, and t is the sampling time. The goodness-of-fit of the data was also evaluated based on the coefficient of determination (R2), which was provided by GraphPad Prism.

2.6. Secondary Modeling

LT, SGR, MPD values were graphed as a function of temperature and then fitted to the Davey, square root, and polynomial models, respectively. The Davey model used was as follows [20,21]:
Y = a + (b/T) + (c/T2)
where Y is LT(day), a, b, and c are regression coefficients without biological meaning, and T is temperature.
The square-root model used was as follows [22]:
√Y = b(T − Tmin)
where Y is SGR (log(CFU/day)), b is a regression coefficient, T is temperature, Tmin is the cardinal minimum growth temperature.
The second order polynomial model used was as follows [23]:
Y = a + bT + cT2
where Y is MPD (log(CFU)), a, b, and c are regression coefficients without biological meaning, and T is temperature.

2.7. Performance Evaluation of Blanched Spinach and Fresh-Cut Iceberg Lettuce Models

The performance of the models was quantified using the ratio method described by Ross [16] and an acceptable prediction zone method [17]. Prediction bias (Bf) and accuracy (Af) factors were calculated using the following equations [24].
Bf for LT = 10∑log(predicted/observed)/n
Af for LT = 10∑|log(predicted/observed)|/n
Bf for SGR = 10∑log(observed/predicted)/n
Af for SGR = 10|log(observed/predicted)|/n
where n is the number of prediction cases used in the calculation. Different ratios were used for LT and SGR, so that Bf less than 1 would represent fail-safe predictions. In addition, relative errors (RE) of individual prediction cases were calculated using the following equation [25]:
RE for LT (%) = [(predicted – observed)/predicted] × 100
RE for SGR (%) = [(observed – predicted)/predicted] × 100
The median relative error (MRE) and the mean absolute relative error (MARE) were also used to measure the prediction bias and accuracy of the model, respectively. In the acceptable prediction zone method, the percentage of RE (%RE) that is in an acceptable prediction zone (i.e., the ratio of the number of RE in the acceptable prediction zone to the total number of prediction cases) from −30 to 15% for SGR and −60 to 30% for LT, and −80 to 40% for MPD were calculated and used as a measure of model performance [15].

3. Results and Discussion

3.1. Development of a Predictive Growth Model for E. coli O157:H7NR in Blanched Spinach and Fresh-Cut Iceberg Lettuce as a Function of Temperature
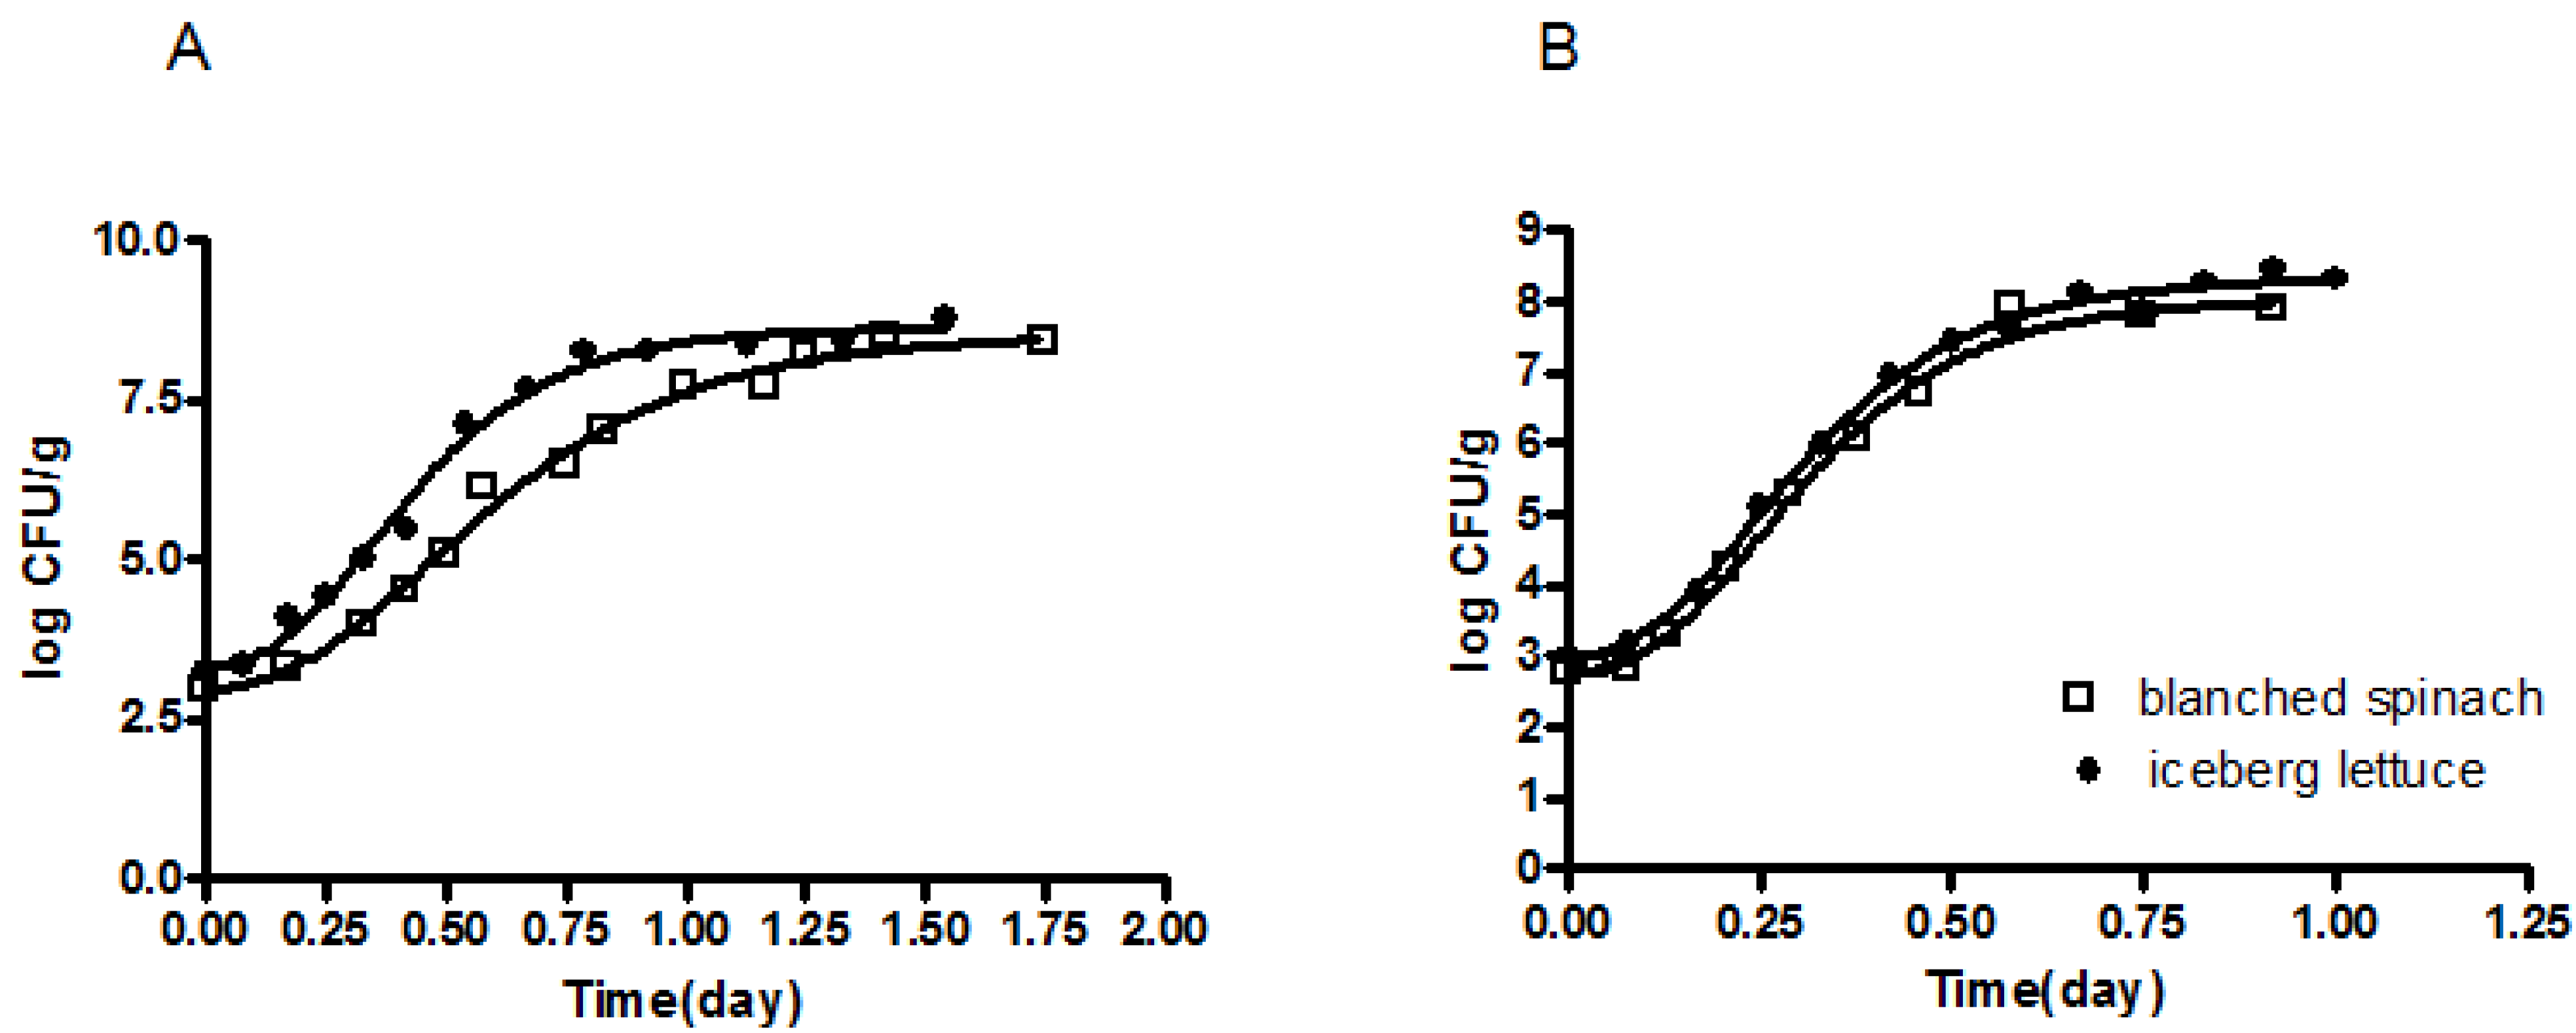
A modified Gompertz equation was used as the primary growth model for E. coli O157:H7NR in blanched spinach and fresh-cut iceberg lettuce, which were stored at 7, 10, 17, 24, 30 and 36 °C. Primary growth models for blanched spinach and fresh-cut iceberg lettuce were fitted well to a modified Gompertz equation with a high degree of goodness-of-fit (R2 = 0.9845 to 0.9988) (Figure 1).
Figure 1. Representative primary growth model for E. coli O157:H7NR in blanched spinach and fresh cut iceberg lettuce stored at (A) 24 and (B) 30°C.
Ijerph 10 02857 g001
The effect of temperature on the growth parameters derived from the primary model for blanched spinach and fresh-cut iceberg lettuce was compared (Table 1). The LT of a mixture of E. coli O157:H7NR increased as the temperature decreased. The LT of a mixture of E. coli O157:H7NR on blanched spinach stored at 7 °C was approximately 26 times longer than that stored at 36 °C. The SGR of a mixture of E. coli O157:H7NR at 10 °C and 24 °C was 35.2 and 2.2 times slower, respectively, compared to the SGR at 36 °C. In this study, LT and SGR of a mixture of E. coli O157:H7NR in iceberg lettuce was 40.08 h and 0.051 log(CFU/h), respectively, at 10 °C, which was lower than the LT (32.64 h) and was higher than SGR (0.03 log(CFU/h)) in iceberg lettuce model developed by [13]. Bharathi et al. [26] reported the growth data of an enterotoxigenic strain of E. coli D21 in minimally processed vegetables (carrot, cucumber and tomato) at a variety of initial inocula (4.3, 5.3 and 6.3 log(CFU/g)), storage temperatures (2, 9 and 16 °C) and storage times (2, 6 and 10 days). In their study, an increase in the viable population of E. coli was observed at only 9 and 16 °C. Recently, Khalil and Frank [27] reported that E. coli O157:H7 population was greater on spinach when compared with other leafy greens (parsley, cilantro) at 8 °C after 3 days of storage. In addition, E. coli O157:H7 did not grow on damaged Romaine leaves at 8 or 12 °C, but growth was observed at 15 °C. These results confirm that the minimum growth temperature and growth rate varies with the strain of inoculated organisms and quality condition of the vegetables. Palumbo et al. [28] also studied the minimum growth temperatures for 16 strains of E. coli O157:H7 in BHI broth using a temperature gradient incubator. The minimum growth temperatures varied for the 16 strains: 11.6 °C (two strains), 11.3 °C (one stain), 9.4 °C (five strains), 9.2 °C (seven strains), and 7.3 °C (one strain). In their work, only one strain out of 16 strains grew at temperatures below 8 °C. Rosso et al. [29] estimated 4.9 °C as the cardinal value of the minimum growth temperature for E. coli.
Table 1. Growth kinetics of primary models for a mixture of E. coli O157:H7NR in blanched spinach and fresh-cut iceberg lettuce.
Temperature (°C)LT xSGR yMPD z
SpinachLettuceSpinachLettuceSpinachLettuce
MeanSEMeanSEMeanSEMeanSEMeanSEMeanSE
763.361.6752.80.800.0040.000.0040.047.200.027.140.06
1028.320.2640.080.060.0050.000.0050.037.310.257.230.20
1710.800.878.880.090.0060.000.0080.007.810.038.040.02
243.600.134.280.210.0190.010.0150.058.060.048.180.08
302.640.052.640.340.0490.000.0510.008.040.038.270.13
362.400.192.400.020.1100.020.0920.028.800.148.410.17
x LT: Lag time (h); y SGR: Specific growth rate (log CFU/h); z MPD: Maximum population density (log).
In the present study, the growth of a mixture of E. coli O157:H7NR in blanched spinach was observed at 7 °C after 63h of LT and was observed in TSBN after 105.6h of LT. On the contrary of nalidixic acid-resistant strains E. coli O157:H7, it is observed that the populations of E. coli O157:H7 decreased after 118 h of LT at 7 °C in this study (data not shown). The maximum population density (MPD) of a mixture of E. coli O157:H7 NR in blanched spinach was reached at 7, 10, 17, 24, 30, and 36 °C on days of 12, 6, 3, 3, 1, and 1, respectively. However, the MPD of a mixture of E. coli O157:H7 NR on blanched spinach and fresh-cut iceberg lettuce was significantly decreased at 7 and 10 °C (p < 0.05), indicating that the growth of nalidixic acid-resistant E. coli O157:H7 was inhibited during refrigerated storage.
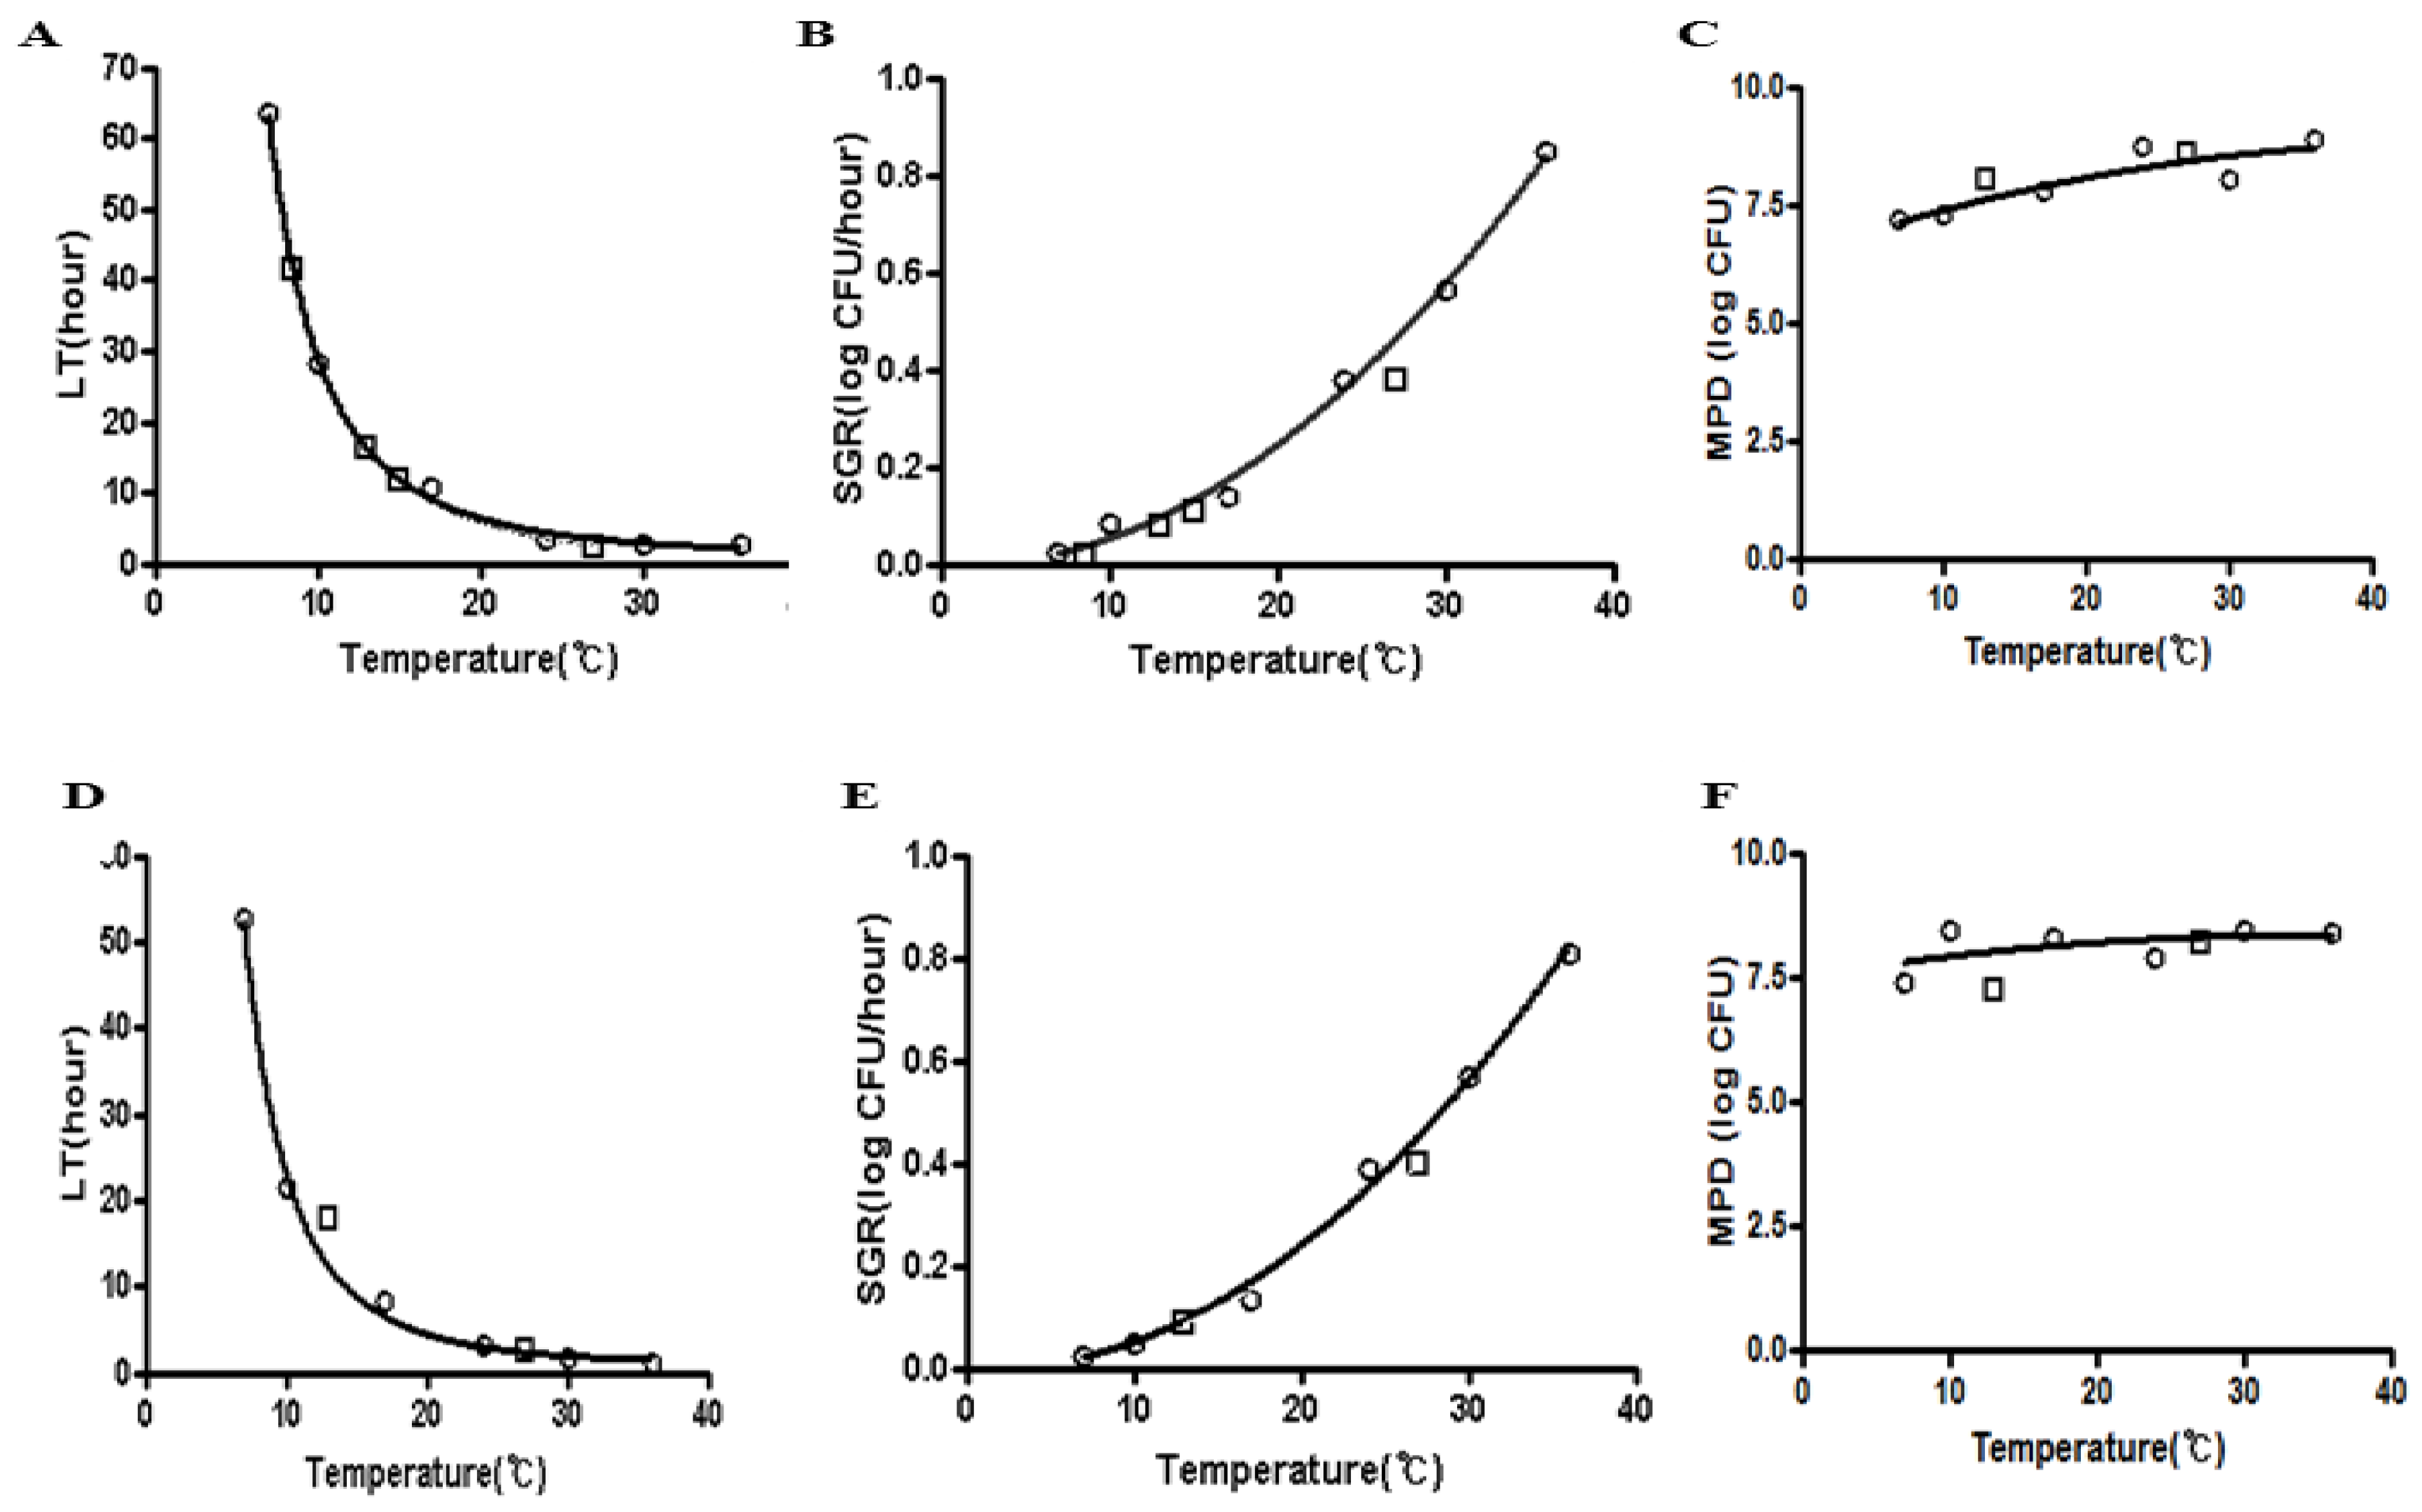
Figure 2. Secondary LT and SGR models of a mixture of E. coli O157:H7NR in blanched spinach and fresh-cut iceberg lettuce as a function of temperature (7 to 36 °C). (A) Spinach-LT. (B) Spinach-SGR. (C) Spinach-MPD. (D) Lettuce-LT. (E) Lettuce-SGR. (F) Lettuce-MPD. ○ Dependent data □ Independent data.
Ijerph 10 02857 g002
Secondary models were developed to describe the primary model parameters, LT and SGR, as a function of temperature. The Davey model for LT, square root model for SGR, and polynomial model for MPD were used for blanched spinach and fresh-cut iceberg lettuce as a function of temperature, where growth was possible (Figure 2).

3.2. Evaluation of Model Performance of Secondary Spinach Models for Interpolation and Extrapolation (Model Extension)

The secondary models were first evaluated for the ability to interpolate within the response surface using independent temperature data not used in model development, which were collected using the same experimental design at 8.5, 13, 15 and 27 °C for blanched spinach and 13 and 27 °C for fresh-cut iceberg lettuce. Figure 2 shows that secondary models fit to the LT and SGR data of a mixture of E. coli O157:H7NR in blanched spinach and fresh-cut iceberg lettuce as a function of temperature (7 to 36 °C). Both dependent and independent (interpolation) data were well fitted to the secondary models. Thus, the secondary models for LT and SGR had an acceptable goodness of fit and were validated for interpolation. Bias factor (Bf) and accuracy factor (Af) with independent data were also calculated (Table 2). An acceptable range of Bf of 0.7–1.15 and a range of 0.9–1.05 is considered to be good [16]. The LT, SGR, and MPD models for blanched spinach including interpolation data had Bf of values of 1.01, 0.89, and 0.97, respectively, which indicated that the model predicted an LT, SGR, and MPD that was 1% lower, 11% higher, and 3% lower, respectively, than the actual experimental values.
Table 2. Performance of secondary growth models for a mixture of E. coli O157:H7NT in blanched spinach and fresh-cut iceberg lettuce for interpolation.
DatasetModelBf aMRE bAf cMARE d%RE e
SpinachLT f1.010.011.160.1490
SGR g0.89−0.131.150.12100
MPD h0.97−0.021.040.03100
LettuceLT i0.950.011.130.13100
SGR j0.96−0.021.090.08100
MPD k1.000.001.020.02100
a Bf: bias factor; b MRE: median relative error; c Af: Accuracy factor; d MARE: mean absolute relative error; e %RE: percentage of relative error that is in an acceptable prediction zone from −30% to 15% for SGR, −60 to 0% for LT, and −80 to 40% for MPD; f LT = 2.00 + (−93.55/T) + (3,655.2/T2); g SGR = {0.0054(T − 1.177)}2; h MPD = 6.187 + 0.1377T − 0.001686T2; i LT = −0.12 + (−17.50/T) + (2,383.68/T2); j SGR = {0.0053(T − 1.263)}2; k MPD = 7.148 + 0.0350T + 0.0000633T2.
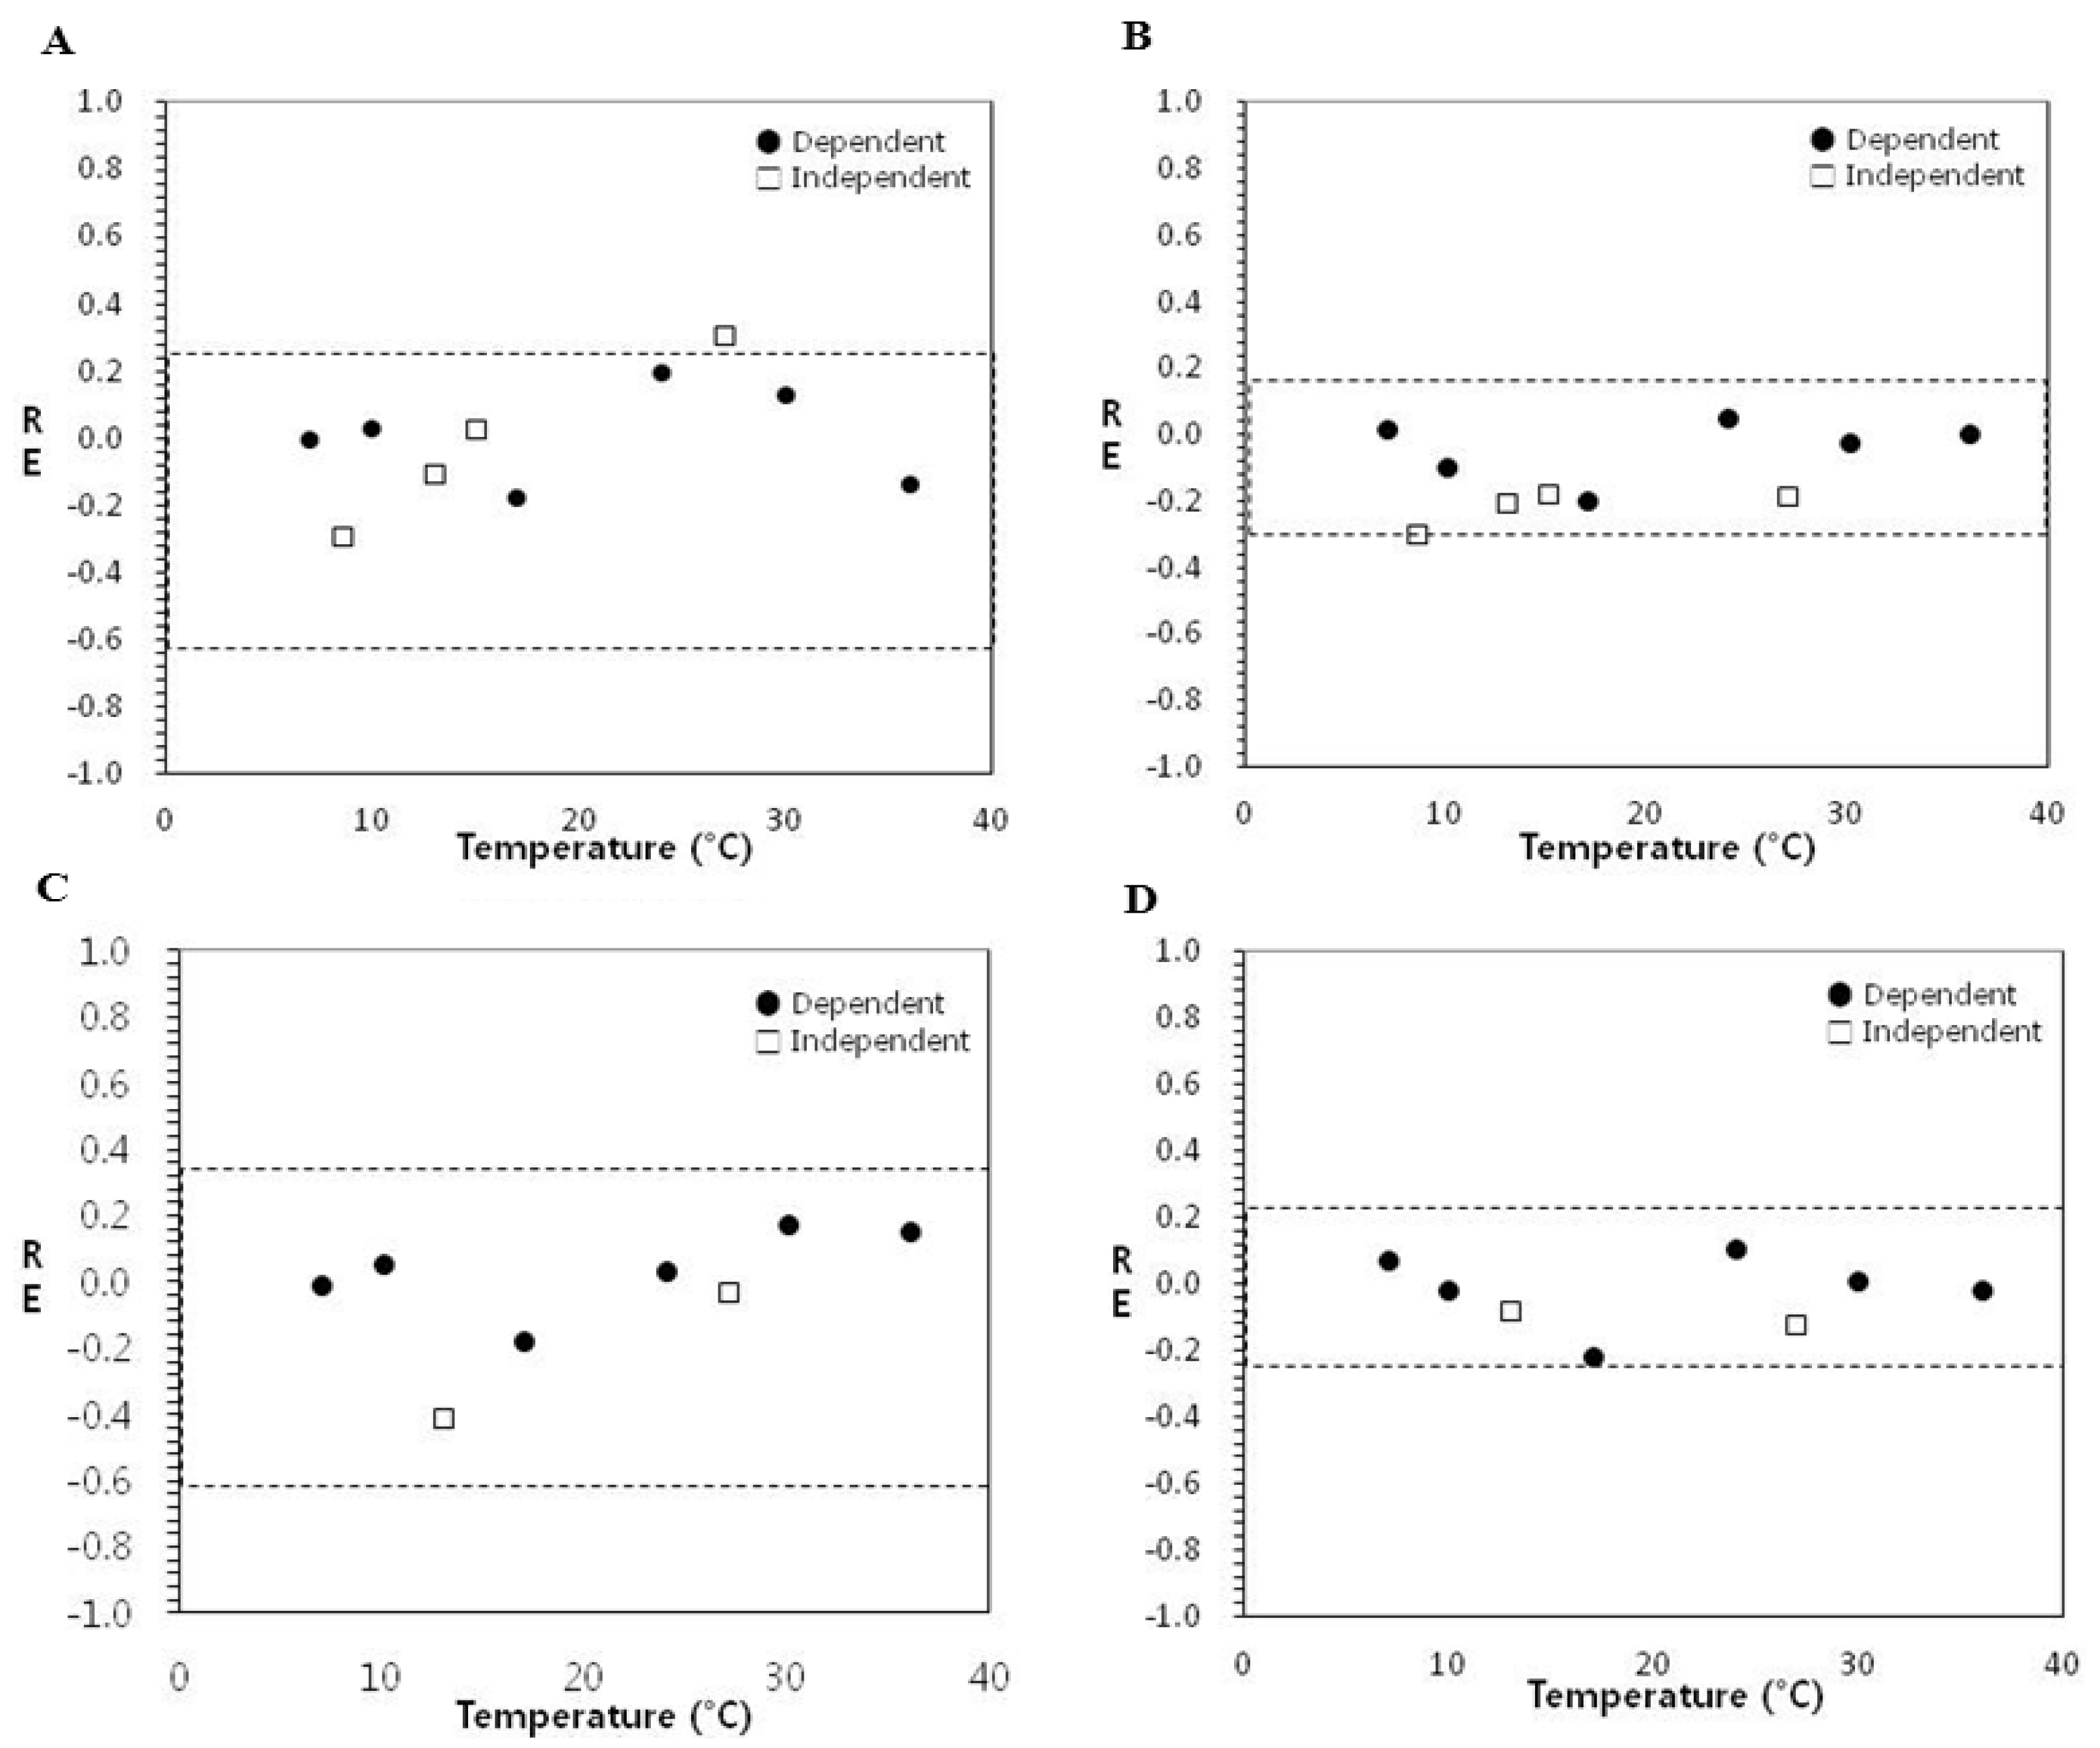
Figure 3 shows the relative error (RE) plots with an acceptable prediction zone for lag time (LT) and specific growth rate (SGR). The LT model for an acceptable prediction zone was twice as wide (−0.6 to 0.3) as the acceptable prediction zone for the SGR model (−0.3 to 0.15) [15]. In the LT model of blanched spinach for dependent (model development) and independent (interpolation) data, 9 of 10 relative errors (percentage of RE = 90%) were inside the acceptable prediction zone (Figure 3(A)). On the other hand, all relative errors for SGR were inside the acceptable prediction zone (Figure 3(B)) and thus validated for interpolation (percentage of RE = 100%). Also, in the LT and SGR models for fresh-cut iceberg lettuce, all relative errors were inside the acceptable prediction zone (Figure 3(C,D)) and the performance was acceptable for interpolation (percentage of RE = 100%) as shown in Table 2.
Figure 3. Acceptable prediction zone analysis of the goodness of fit of the secondary model for lag time (LT) and specific growth rate (SGR). RE values are mean (n=3). (A) Spinach-LT. (B) Spinach-SGR. (C) Lettuce-LT. (D) Lettuce-SGR.
Ijerph 10 02857 g003
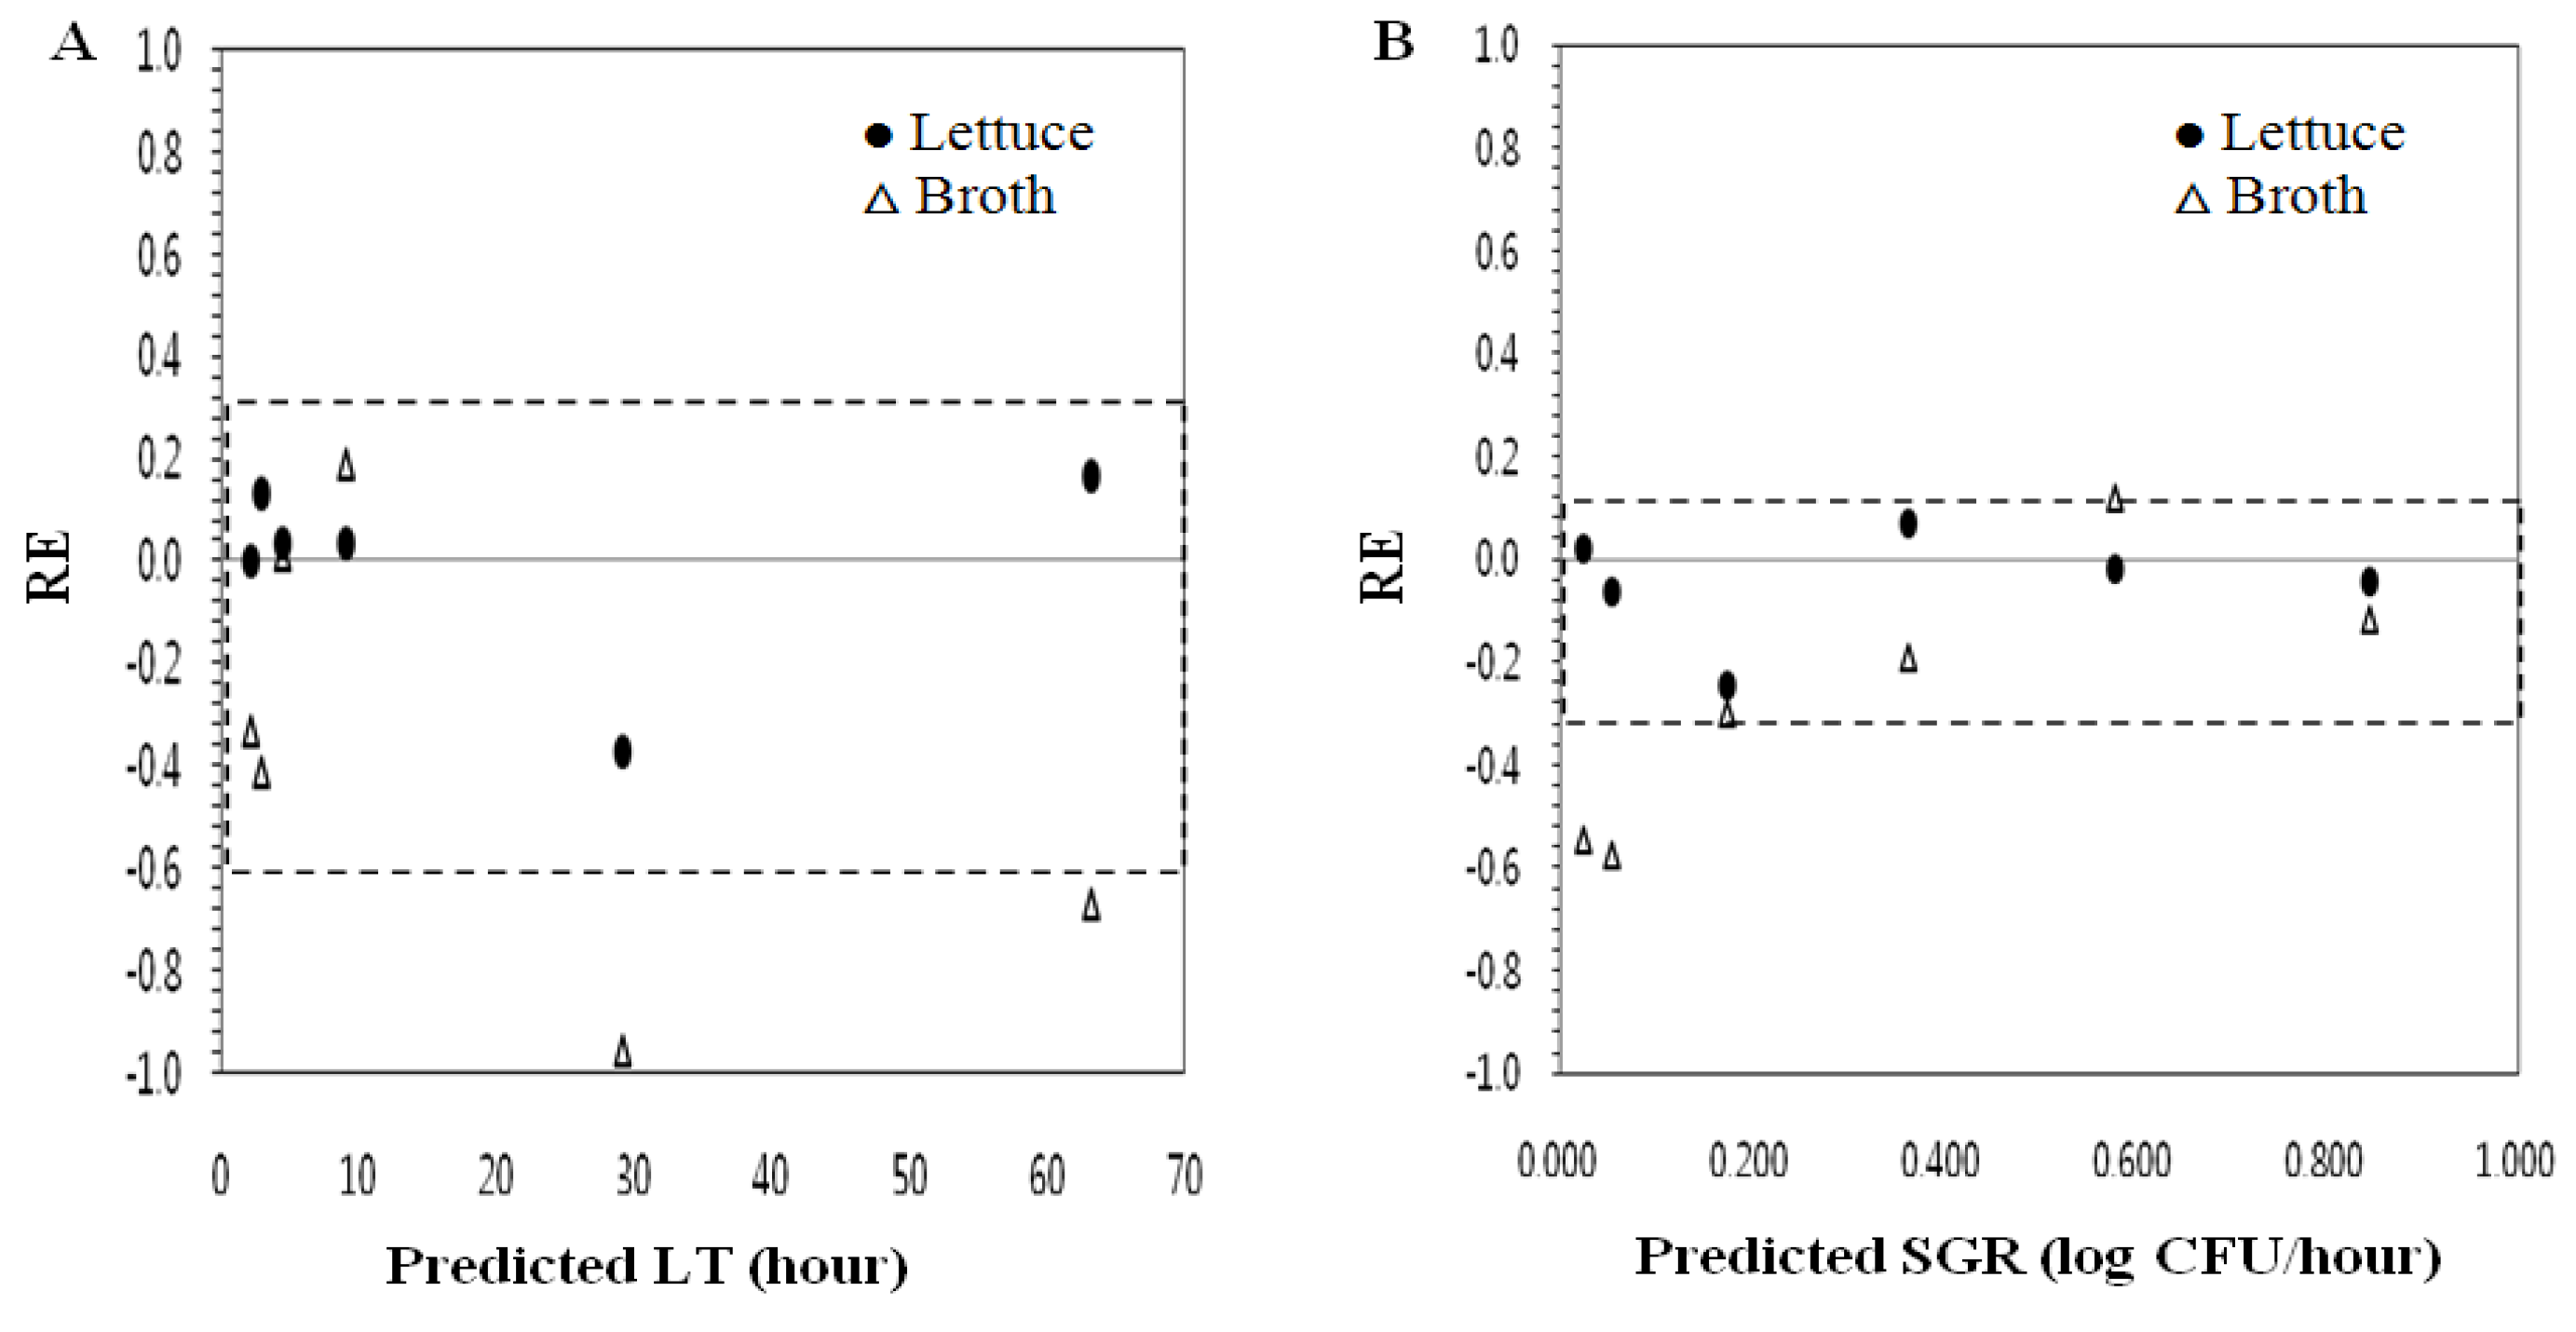
Model performance to test the possibility of extension of the model (extrapolation) to include other substrates was evaluated using independent sets of data obtained with different substrates. Fresh-cut iceberg lettuce and TSBN were used for extension for E. coli O157:H7NR growth model for blanched spinach. In the LT model developed with blanched spinach, the Bf and Af values for extrapolation to fresh-cut iceberg lettuce were 1.01 and 1.12, respectively (Table 3). The predictions of the LT model for extrapolation to fresh-cut iceberg lettuce were acceptable as six of six relative errors (RE) were inside the acceptable prediction zone (percentage of RE = 100%; Figure 4(A) and Table 3). On the other hand, the LT model for extrapolation to broth had a Bf value of 0.77 and Af value of 1.40 (Table 3). These results indicated that the LT model developed for blanched spinach was unacceptable with broth (TSBN) model and suitable for fresh-cut iceberg lettuce. When the SGR model of blanched spinach was extended to iceberg lettuce, all relative errors (percentage of RE = 100%) were inside the acceptable prediction zone (Figure 4(B)) and had an acceptable Bf value of 0.95 and Af value of 1.09. However, the SGR model for extension to TSBN had 50% relative errors (RE), and Bf and Af values of 0.69 and 1.51, respectively (Table 3), indicating that the SGR model of blanched spinach was suitable to fresh-cut iceberg lettuce, but not suitable to TSBN, which was stored without agitation. Previous studies have reported that models prepared in liquid media may not give reliable predictions for growth of pathogens on foods [30,31,32]. Tamplin [30] observed immediate growth of E. coli in nonsterile ground beef, without the 49 h lag time predicted from the broth model of USDA Pathogen Modeling Program or the 12 h lag time predicted at 12 °C, reported by Walls and Scott [32]. Ross [31] also reported inhibition of MPD from E. coli in non-sterile minced beef, which was not observed in broth.
Table 3. Performance of secondary growth models for a mixture of E. coli O157:H7NT in blanched spinach for extrapolation.
DatasetModelBf aMRE bAf cMARE d% RE e
LettuceLT f1.010.031.120.12100
SGR g0.95−3.041.090.08100
BrothLT0.77−0.371.400.4333
SGR0.69−24.681.510.3150
a Bf: Bias factor; b MRE: Median relative error; c Af: Accuracy factor; d MARE: Mean absolute relative error; e %RE: The percentage of relative error that is in an acceptable prediction zone from −30% to 15% for SGR and −60 to 30% for LT; f LT: Lag time (h); g SGR: Specific growth rate (log(CFU/h)).
Figure 4. Relative error (RE) plots with an acceptable prediction zone analysis of lag time (LT) and specific growth rate (SGR) data used in evaluation of extrapolation. (A) LT. (B) SGR.
Ijerph 10 02857 g004
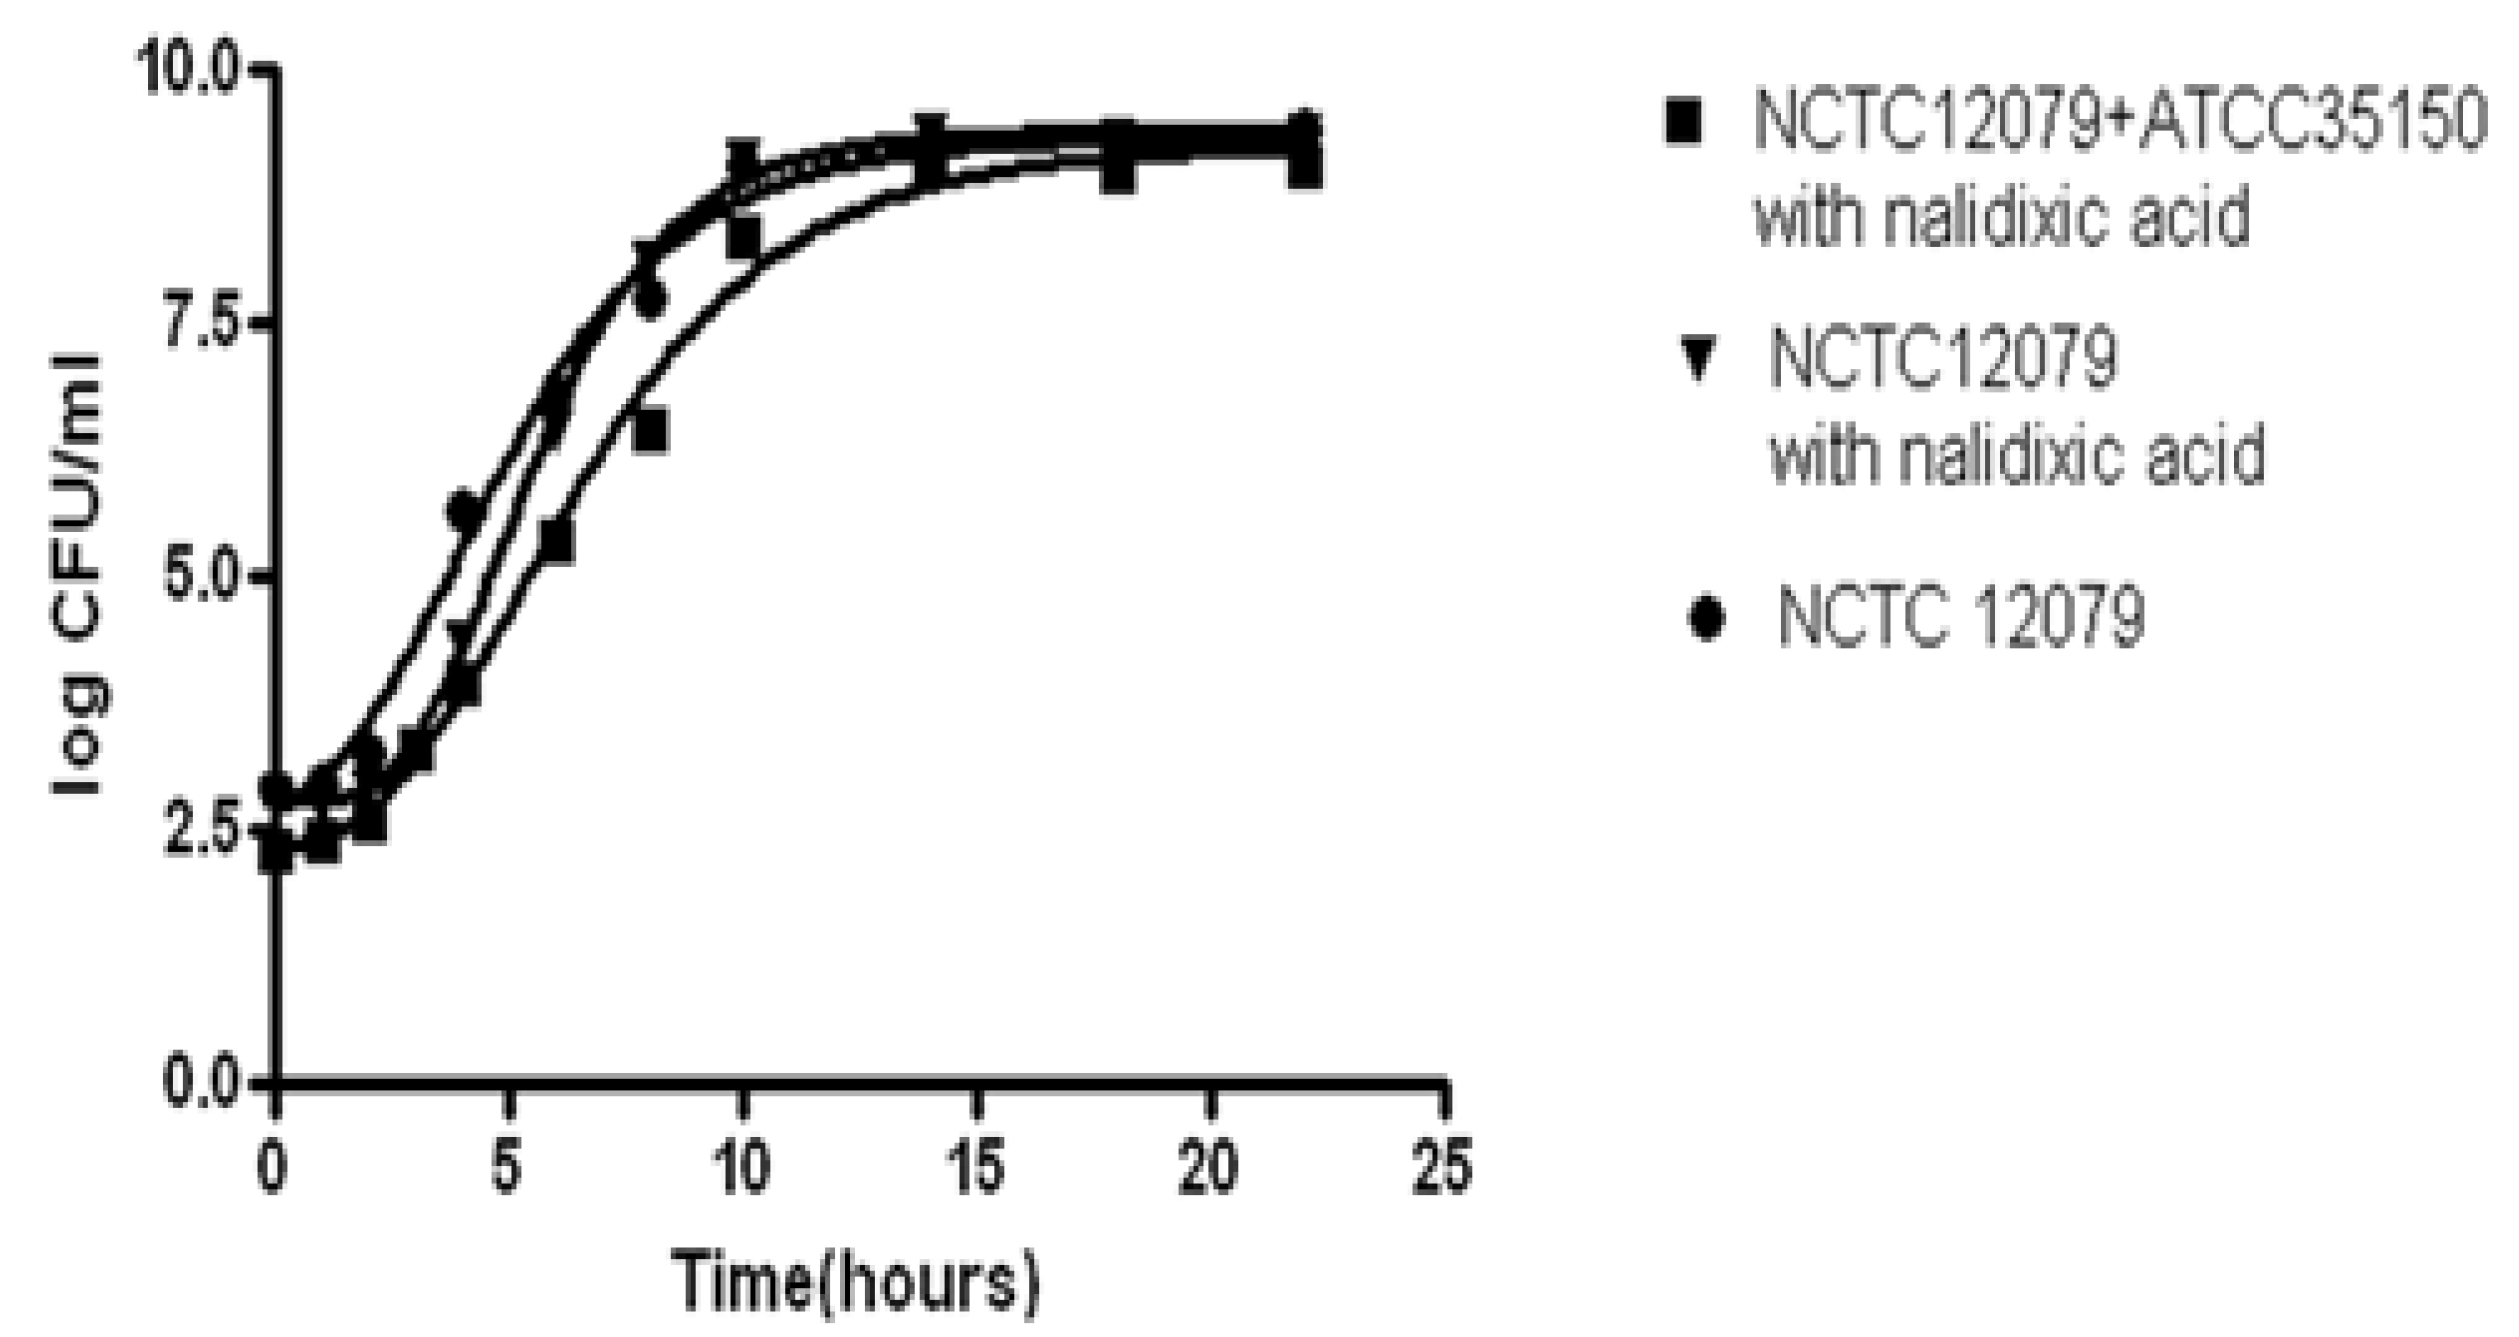
A well-known strategy for modeling is to choose the fastest growing strain in the environmental conditions investigated, because the fastest growing strain will dominate the growth in food products [33]. McMeekin et al. [23] also recommended independent modeling of several different strains before choosing the strain that grows fastest under the environment conditions of most interest. Salter et al. [34] compared the growth of the nonpathogenic E. coli M23 with the growth of pathogenic strains of E. coli O157:H7 and found only small differences in the growth responses of these two strains. They also found that a model based on E. coli M23 was able to describe the growth of pathogenic strains of E. coli O157:H7. In the present study, we also compared the growth kinetics of a mixture of two E. coli O157:H7NR strains (NCTC12079NR and ATCC35150NR) to a single strain (NCTC12079NR) of E. coli O157:H7NR and an E. coli O157:H7 parent strain (NCTC 12079). The growth kinetics of nalidixic acid-resistant strain of E. coli O157:H7 were not significantly different from those of E. coli O157:H7 parent strain in broth as the increase in temperature (Figure 5).
Figure 5. Comparison of growth curves of a mixture of two E. coli O157:H7NR strains (NCTC12079NR and ATCC35150NR) and E. coli O157:H7NR strain (NCTC12079NR) and E. coli O157:H7 parent strain in broth at 36 °C.
Ijerph 10 02857 g005

4. Conclusions

The developed secondary LT, SGR, and MPD models were able to reliably predict the growth of a mixture of E. coli O157:H7NR in blanched spinach, which were also suitable for use in making predictions for fresh-cut iceberg lettuce, but not for static broth (TSAN). In addition, the populations of E. coli O157:H7NR increased in blanched spinach, fresh-cut iceberg lettuce, and broth at 7 °C, while the growth of parent E. coli O157:H7 strain was not observed in at 7 °C. These results indicate the risk of nalidixic acid-resistant strain of E. coli O157:H7 contamination in ready-to-eat produce at refrigerated temperatures. Additionally, before we used nalidixic acid-resistant strains of E. coli O157:H7 in this study to develop models for produces, their growth kinetics in broth at 7 to 36 °C were compared and found to be similar to those of parent E. coli O157:H7 strain from which they were derived. Thus the results of the current study also provide the growth characteristics of nalidixic acid-resistant E. coli O157:H7 in blanched and fresh-cut produces at various temperatures, which will be also useful information for microbial risk assessment and strategies for management of pathogenic E. coli in produce during distribution at the retail market level.

Acknowledgments

This research was supported by the Korea Food Drug Administration Research Grant (10162-055).

Conflict of Interest

The authors declare no conflict of interest.

References

  1. USDA Microbiological Data Program-Progress Update and 2009 Data Summary. Available online: http://www.ams.usda.gov/AMSv1.0/getfile?dDocName=STELPRDC5088761 (accessed on 27 May 2013).
  2. Berger, C.N.; Sodha, S.V.; Shaw, R.K.; Griffin, P.M.; Pink, D.; Hand, P.; Frankel, G. Fresh fruit and vegetables as vehicles for the transmission of human pathogens. Environ. Microbiol. 2010, 12, 2385–2397. [Google Scholar] [CrossRef]
  3. CDC Investigation Update: Multistate Outbreak of E. coli O157:H7 Infections Linked to Romaine Lettuce. Available online: http://www.cdc.gov/ecoli/2011/ecoliO157/romainelettuce/032312/index.html (accessed on 23 March 2013).
  4. Harrington, R. Germany Finally Confirms Source of Deadly E. coli Outbreak. Available online: http://www.foodproductiondaily.com/Quality-Safety/Germany-finally-confirms-source-of-deadly-E.coli-outbreak (accessed on 13 June 2013).
  5. CDC Multistate Outbreak of Shiga Toxin-producing Escherichia coli O157:H7 Infections Linked to Organic Spinach and Spring Mix Blend. Available online: http://www.cdc.gov/ecoli/2012/O157H7-11-12/index.html (accessed on 10 December 2012).
  6. Kozak, G.K.; MacDonald, D.; Landry, L.; Farber, J.M. Foodborne outbreaks in Canada linked to produce: 2001 through 2009. J. Food Prot. 2013, 76, 173–183. [Google Scholar]
  7. Ross, T.; Ratkowsky, D.A.; Mellefont, L.A.; McMeekin, T.A. Modelling the effects of temperature, water activity, pH and lactic acid concentration on the growth rate of Escherichia coli. Int. J. Food Microbiol. 2003, 82, 33–43. [Google Scholar] [CrossRef]
  8. Presser, K.A.; Ratkowsky, D.A.; Ross, T. Modelling the growth rate of Escherichia coli as a function of pH and lactic acid concentration. Appl. Environ. Microbiol. 1997, 63, 2355–2360. [Google Scholar]
  9. Sutherland, J.P.; Bayliss, A.J.; Braxton, D.S.; Beaumont, A.L. Predictive modelling of Escherichia coli O157:H7: Inclusion of carbon dioxide as a fourth factor in a pre-existing model. Int. J. Food Microbiol. 1997, 37, 113–120. [Google Scholar] [CrossRef]
  10. Kovarova, K.; Zehnder, A.J.; Egli, T. Temperature-dependent growth kinetics of Escherichia coli ML 30 in glucose-limited continuous culture. J. Bacteriol. 1996, 178, 4530–4539. [Google Scholar]
  11. Sutherland, J.P.; Bayliss, A.J.; Braxton, D.S. Predictive modelling of growth of Escherichia coli O157:H7: The effects of temperature, pH and sodium chloride. Int. J. Food Microbiol. 1995, 25, 29–49. [Google Scholar] [CrossRef]
  12. Buchanan, R.L.; Bagi, L.K.; Goins, R.V.; Phillips, J.G. Response surface models for the growth kinetics of Escherichia coli O157:H7. Food Microbiol. 1993, 10, 303–315. [Google Scholar] [CrossRef]
  13. Koseki, S.; Isobe, S. Prediction of pathogen growth on iceberg lettuce under real temperature history during distribution from farm to table. Int. J. Food Microbiol. 2005, 104, 239–248. [Google Scholar] [CrossRef]
  14. McKellar, R.C.; Delaquis, P. Development of a dynamic growth-death model for Escherichia coli O157:H7 in minimally processed leafy green vegetables. Int. J. Food Microbiol. 2011, 151, 7–14. [Google Scholar] [CrossRef]
  15. Oscar, T.P. Development and validation of primary, secondary, and tertiary models for growth of Salmonella typhimurium on sterile chicken. J. Food Prot. 2005, 68, 2606–2613. [Google Scholar]
  16. Ross, T. Indices for performance evaluation of predictive models in food microbiology. J. Appl. Bacteriol. 1996, 81, 501–508. [Google Scholar]
  17. Oscar, T.P. Validation of lag time and growth rate models for Salmonella typhimurium: Acceptable prediction zone method. Food Microbiol. Saf. 2005, 70, M129–M137. [Google Scholar]
  18. Inatsu, Y.; Bari, M.L.; Kawasaki, S.; Isshiki, K.; Kawamoto, S. Efficacy of acidified sodium chlorite treatments in reducing Escherichia coli O157:H7 on Chinese cabbage. J. Food Prot. 2005, 68, 251–255. [Google Scholar]
  19. Yoon, K.S.; Burnette, C.N.; Abou-Zeid, K.A.; Whiting, R.C. Control of growth and survival of Listeria monocytogenes on smoked salmon by combined potassium lactate and sodium diacetate and freezing stress during refrigeration and frozen storage. J. Food Prot. 2004, 67, 2465–2471. [Google Scholar]
  20. Daughtry, B.J.; Davey, K.R.; King, K.D. Temperature dependence of growth kinetics of food bacteria. Food Microbiol. 1997, 14, 21–30. [Google Scholar] [CrossRef]
  21. Oscar, T.P. Development and validation of a tertiary simulation model for predicting the potential growth of Salmonella typhimurium on cooked chicken. Int. J. Food Microbiol. 2002, 76, 177–190. [Google Scholar] [CrossRef]
  22. Ratkowsky, D.A.; Olley, J.; McMeekin, T.A.; Ball, A. Relationship between temperature and growth rate of bacterial cultures. J. Bacteriol. 1982, 149, 1–5. [Google Scholar]
  23. McMeekin, T.A.; Olley, J.; Ross, T. Predictive Microbiology: Theory and Application; John Wiley & Sons Ltd.: Hoboken, NJ, USA, 1993. [Google Scholar]
  24. Abou-Zeid, K.A.; Oscar, T.P.; Schwarz, J.G.; Hashem, F.M.; Whiting, R.C.; Yoon, K. Development and validation of a predictive model for Listeria monocytogenes Scott A as a function of temperature, pH, and commercial mixture of potassium lactate and sodium diacetate. J. Microbiol. Biotechnol. 2009, 19, 718–726. [Google Scholar]
  25. Delignette-Muller, M.L.; Rosso, L.; Flandrois, J.P. Accuracy of microbial growth predictions with square root and polynomial models. Int. J. Food Microbiol. 1995, 27, 139–146. [Google Scholar] [CrossRef]
  26. Bharathi, S.; Ramesh, M.N.; Varadaraj, M.C. Predicting the behavioural pattern of Escherichia coli in minimally processed vegetables. Food Control 2001, 12, 275–284. [Google Scholar] [CrossRef]
  27. Khalil, R.K.; Frank, J.F. Behavior of Escherichia coli O157:H7 on damaged leaves of spinach, lettuce, cilantro, and parsley stored at abusive temperatures. J. Food Prot. 2010, 73, 212–220. [Google Scholar]
  28. Palumbo, S.A.; Call, J.E.; Schultz, F.J.; Williams, A.C. Minimum and maximum temperatures for growth and verotoxin production by hemorrhagic strains of Escherichia coli. J. Food Prot. 1995, 58, 352–356. [Google Scholar]
  29. Rosso, L.; Lobry, J.R.; Flandrois, J.P. An unexpected correlation between cardinal temperatures of microbial growth highlighted by a new model. J. Theor. Biol. 1993, 162, 447–463. [Google Scholar] [CrossRef]
  30. Tamplin, M.L. Growth of Escherichia coli O157:H7 in raw ground beef stored at 10 °C and the influence of competitive bacterial flora, strain variation, and fat level. J. Food Prot. 2002, 65, 1535–1540. [Google Scholar]
  31. Ross, T. Predictive Food Microbiology Models in the Meat Industry; Meat and Livestock Australia (MLA): North Sydney, Australia, 1999; p. 196. [Google Scholar]
  32. Walls, I.; Scott, V.N. Validation of predictive mathematical models describing the growth of Escherichia coli O157:H7 in raw ground beef. J. Food Prot. 1996, 59, 1331–1335. [Google Scholar]
  33. Rasch, M. Experimental Design and Data Collection. Modelling Microbial Responses in Food; CRC Press: London, UK, 2004. [Google Scholar]
  34. Salter, M.A.; Ross, T.; McMeekin, T.A. McMeekin, Applicability of a model for non-pathogenic Escherichia coli for predicting the growth of pathogenic Escherichia coli. J. Appl. Microbiol. 1998, 85, 357–364. [Google Scholar]