Performance Evaluation of Public Non-Profit Hospitals Using a BP Artificial Neural Network: The Case of Hubei Province in China


Abstract
1. Introduction
2. Methods
2.1. Data Collection
2.2. Establishing the Evaluation System
2.2.1. Indicator Selection
2.2.2. Tendency Treatment



 is the minimum value of indicator j for all of the evaluation subjects, and
  is the maximum value of indicator j for all of the evaluation subjects. If the best standard value was not provided, we used X ± S as the best value (e.g., the daily number of clinic patients for each doctor).
2.2.3. Weight Definition

 . In addition, pij ln pij is defined as 0 if pij = 0.
  .
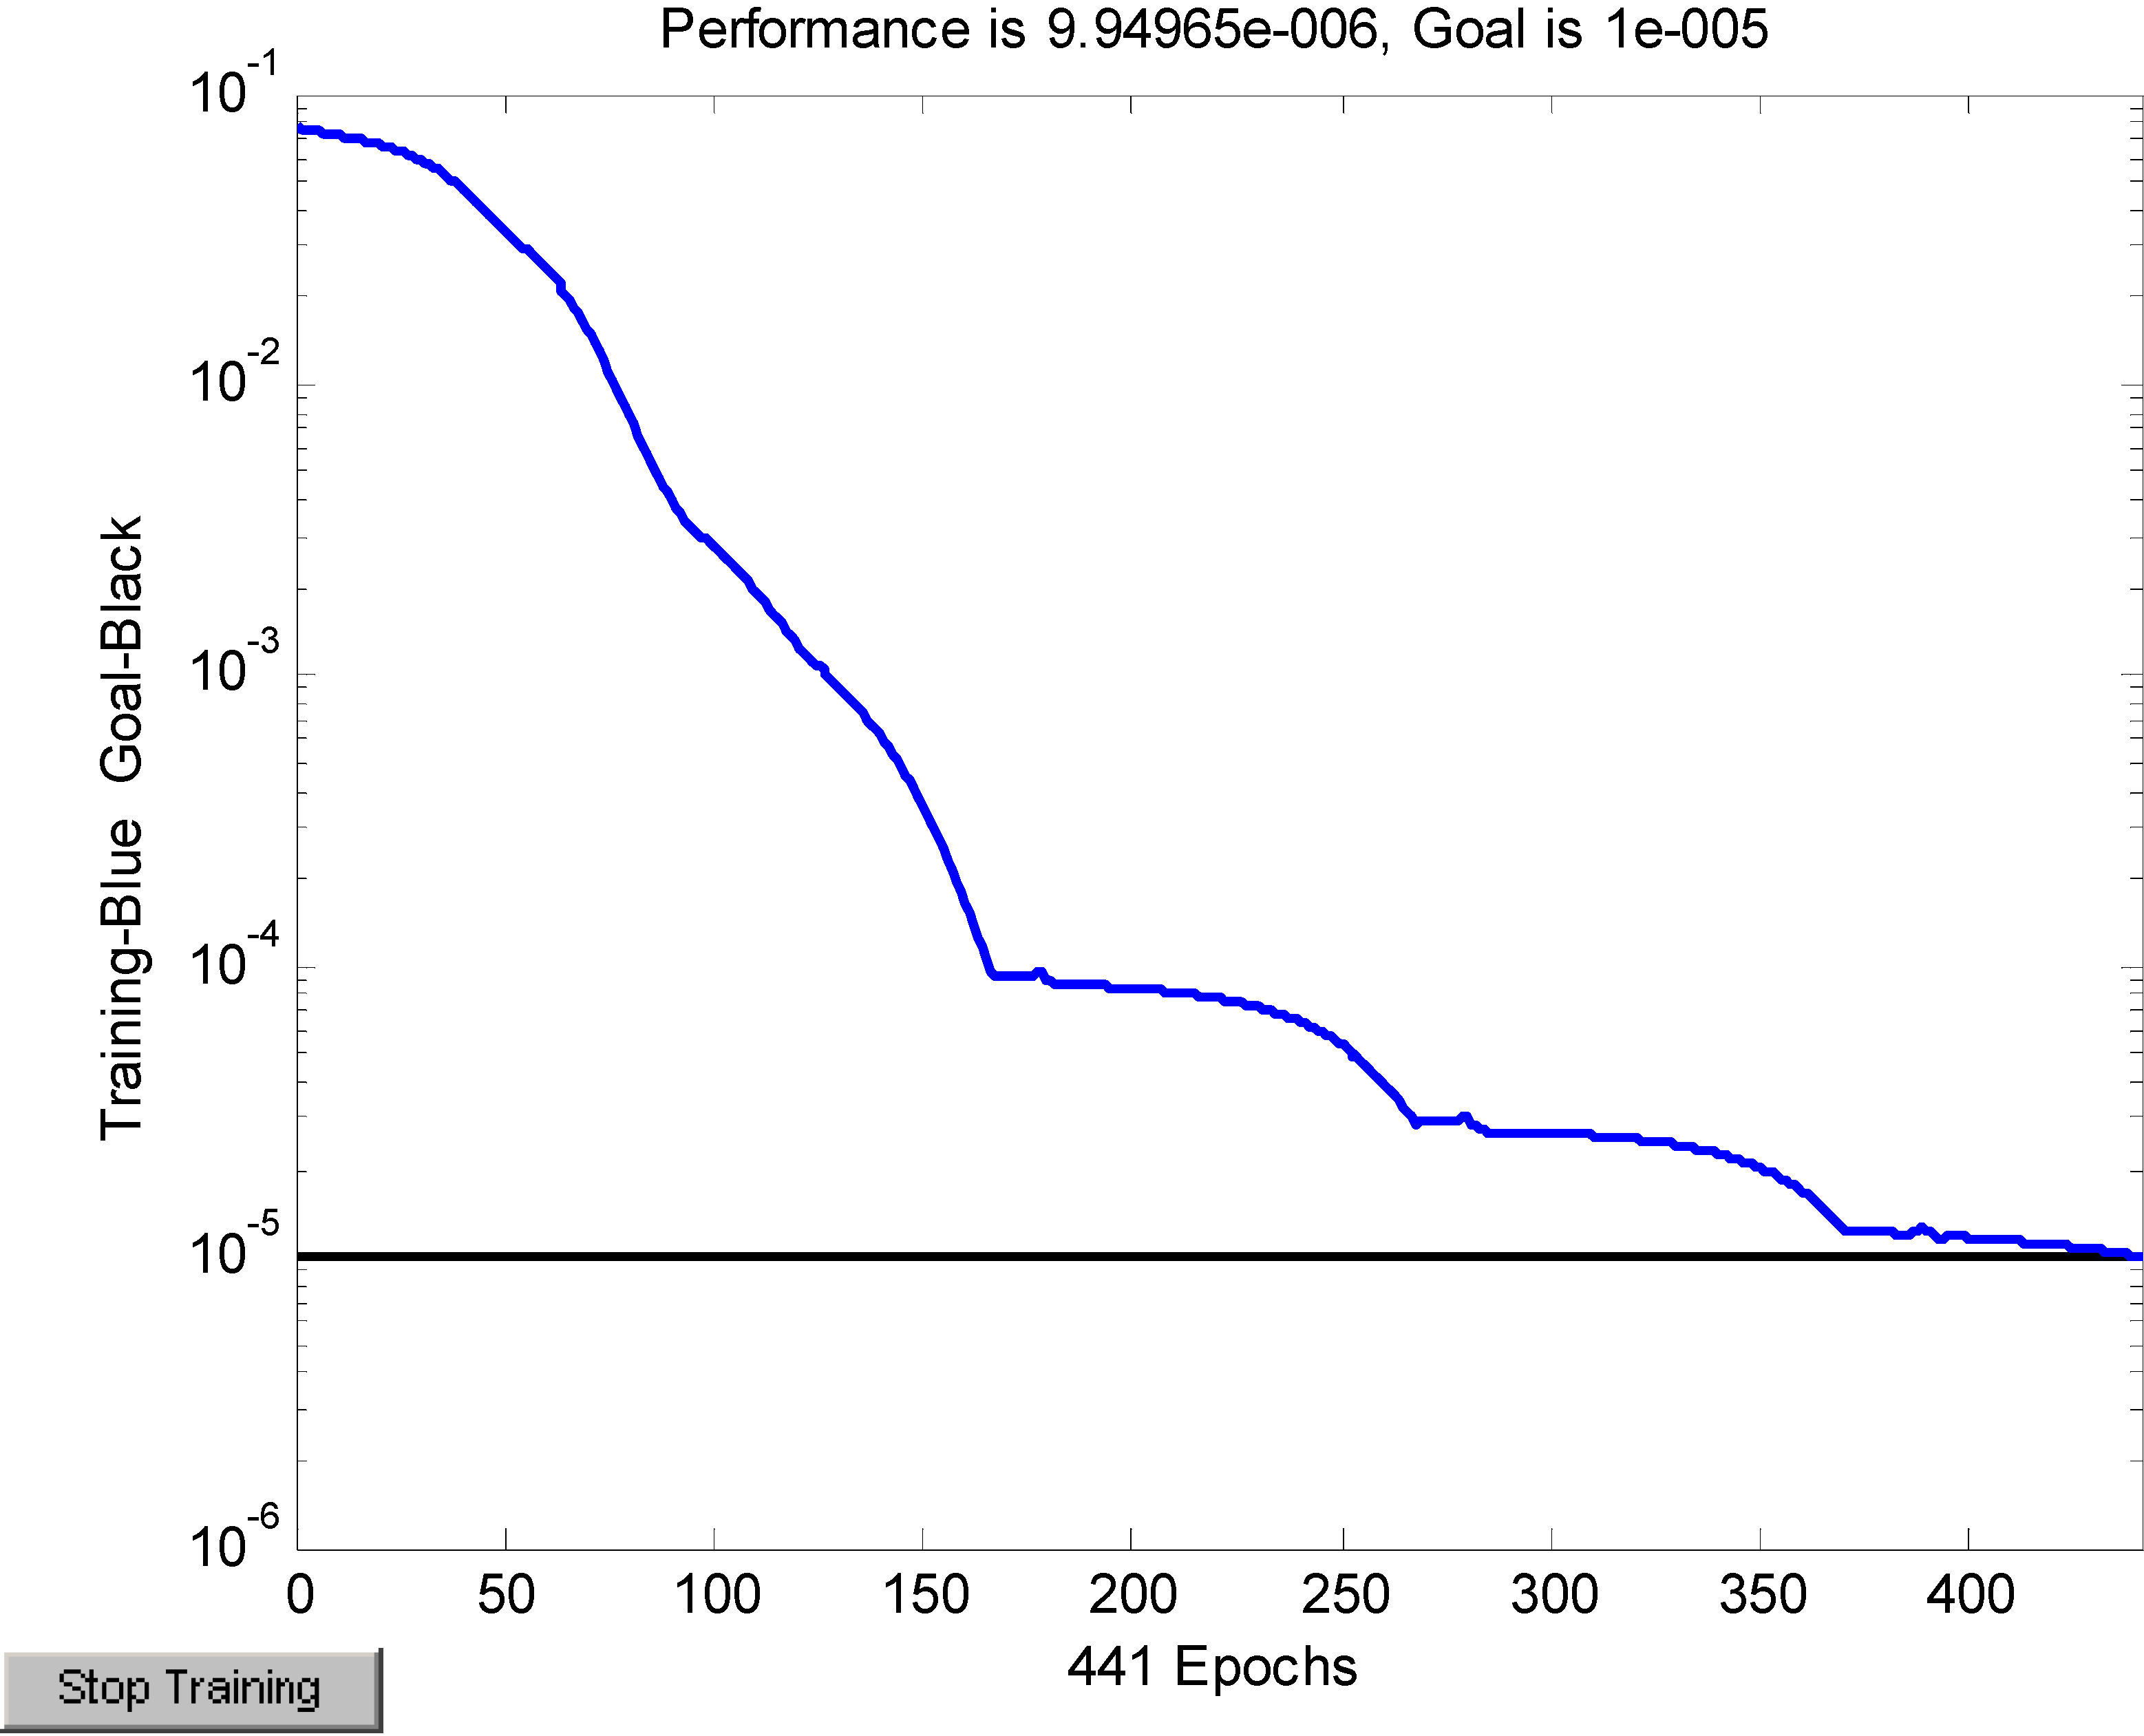
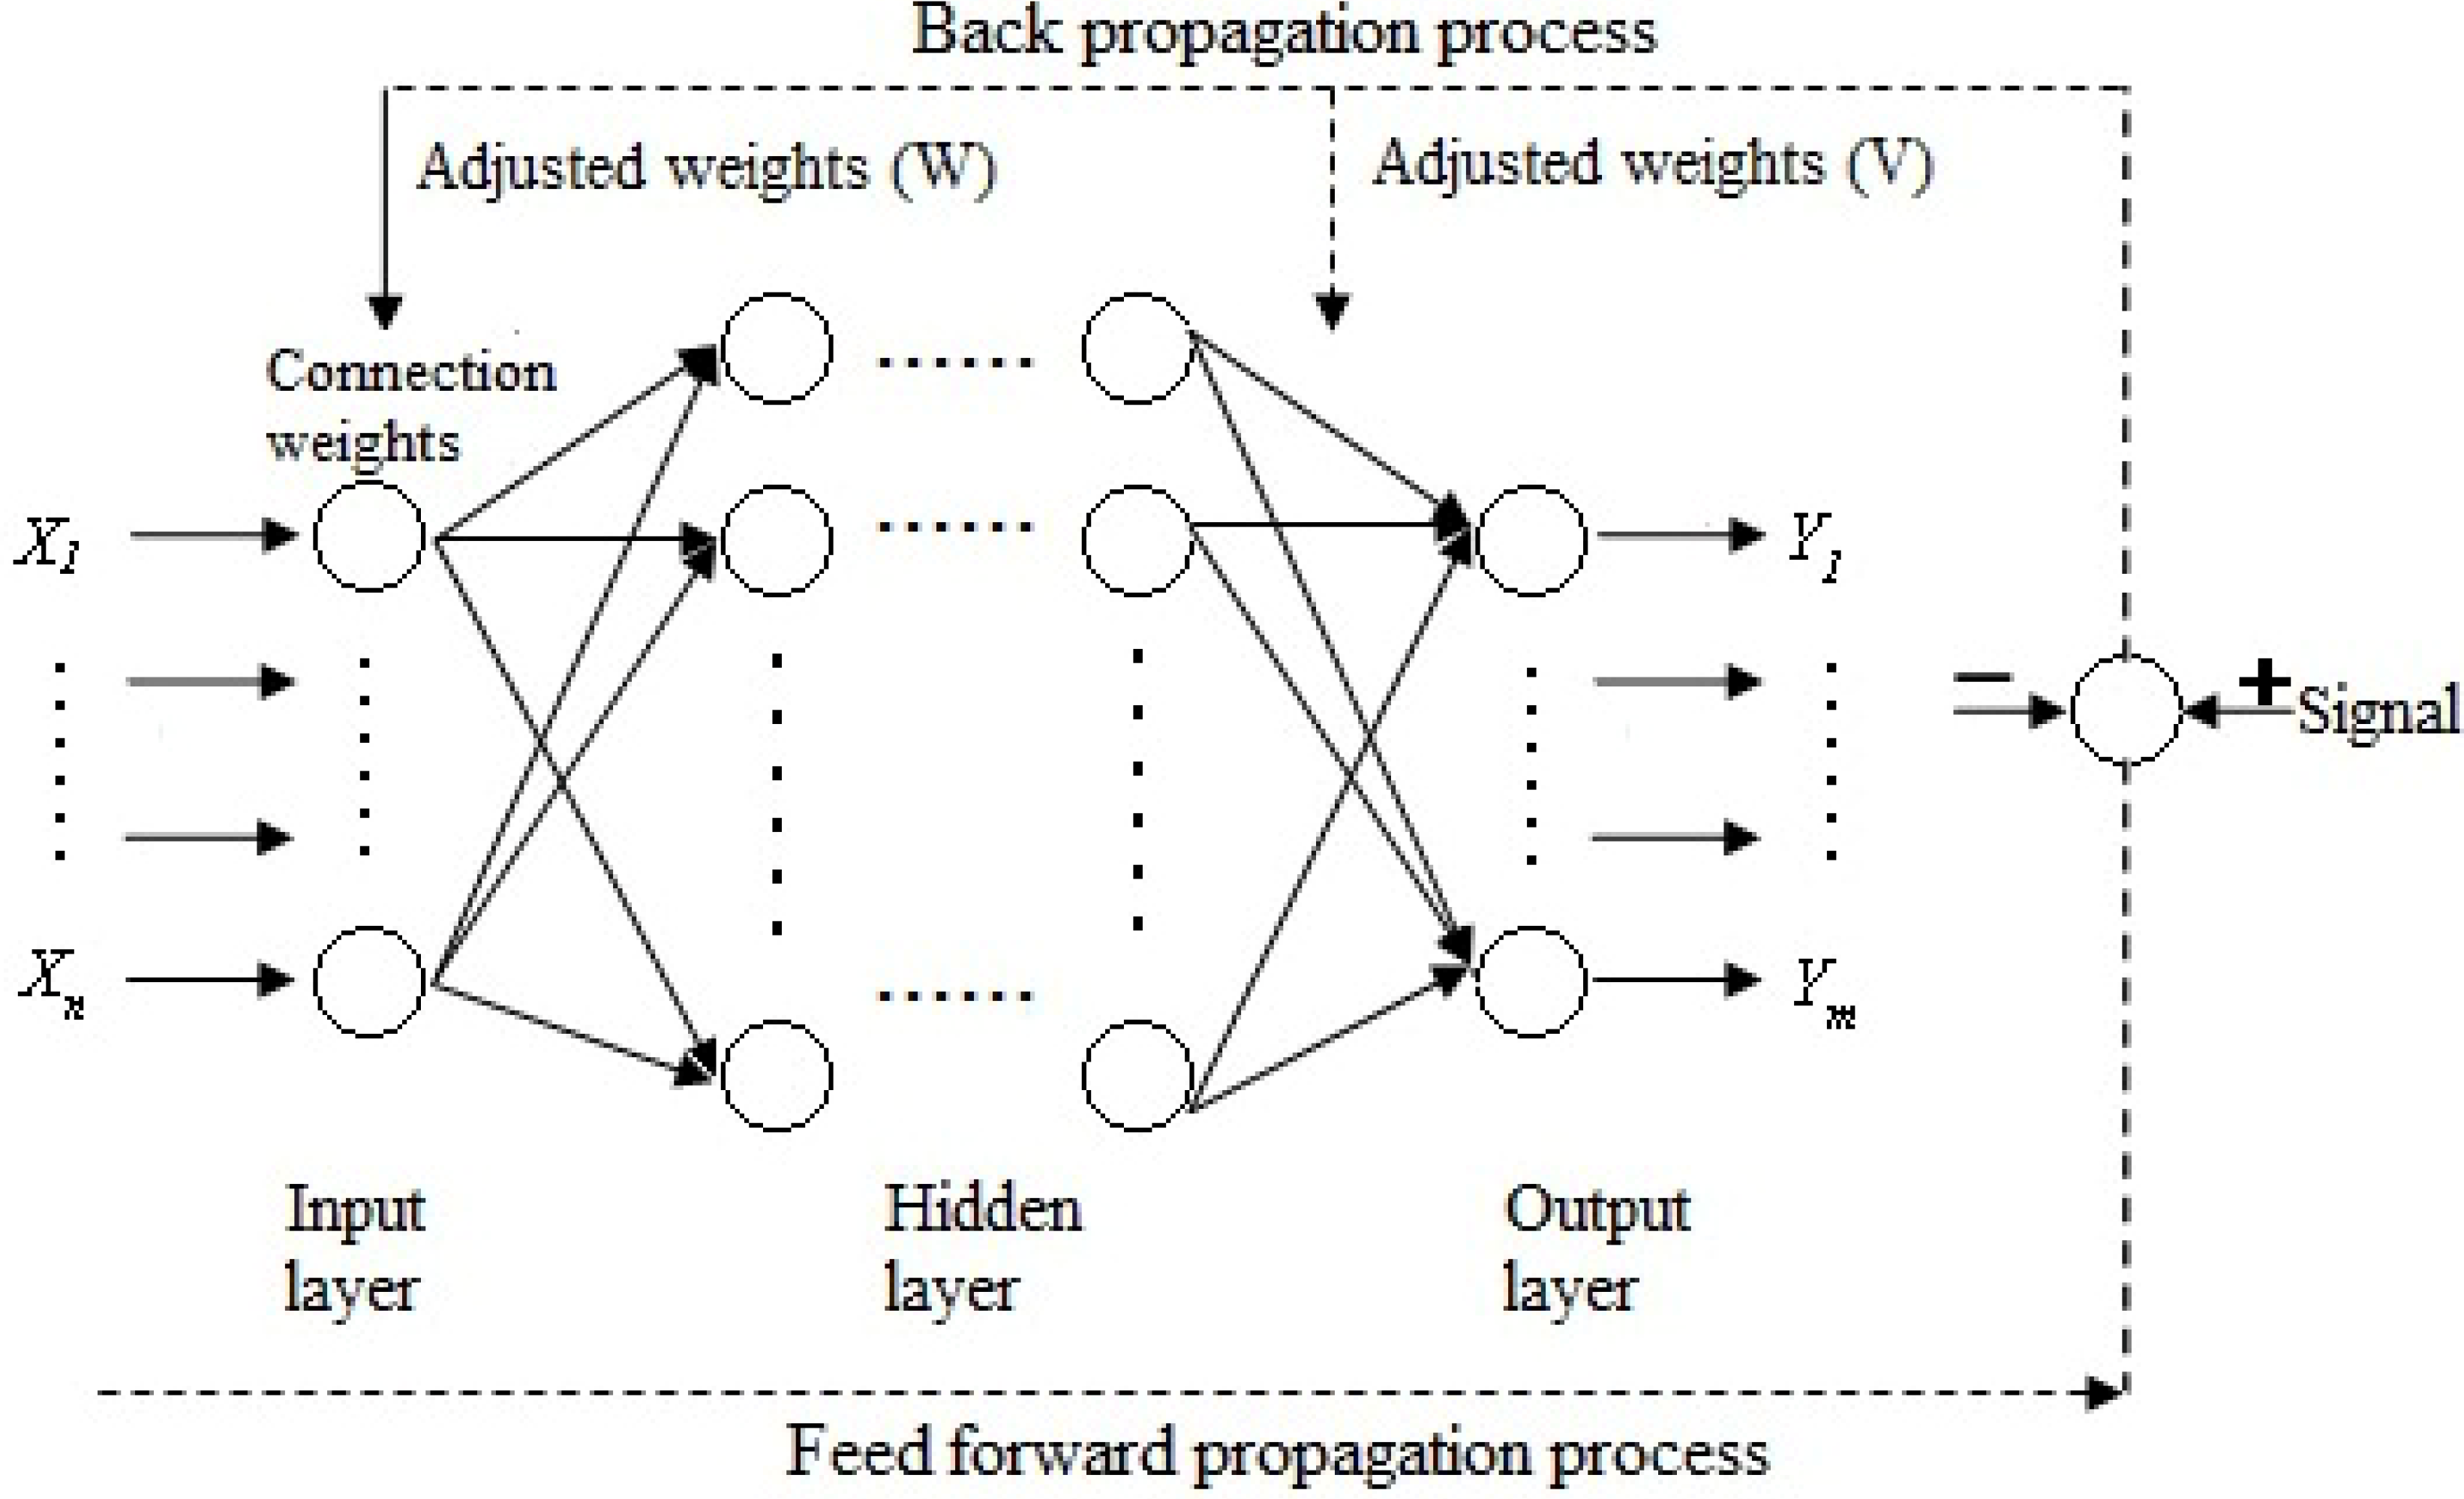
.2.3. Artificial Neural Networks






| Neuron number | R2 | RMSE | MAPE |
|---|---|---|---|
| 8 | 0.9647 | 0.0229 | 1.1064 |
| 9 | 0.9505 | 0.0266 | 1.4203 |
| 10 | 0.9783 | 0.0214 | 1.0858 |
| 11 | 0.9634 | 0.0258 | 1.4533 |
| 12 | 0.9753 | 0.0283 | 1.1695 |
| 13 | 0.9681 | 0.0238 | 0.9469 |
| 14 | 0.9473 | 0.0271 | 1.5162 |
| 15 | 0.9629 | 0.0249 | 0.9794 |
| 16 | 0.9548 | 0.0242 | 1.3341 |
| 17 | 0.9702 | 0.0221 | 1.0903 |
| Level 1 | Weight a | Level 2 | Weight a | Level 3,reference value | Weight b | Comprehensive weight | Index attribute |
|---|---|---|---|---|---|---|---|
| Input | 0.2 | Human Resources | 0.4 | Percentage of health technicians (%), ≥75% | 0.46 | 0.0365 | + |
| Doctors-nurses ratio, 1:2 | 0.54 | 0.0435 | 0 | ||||
| Equipment and facilities | 0.6 | Beds-nurses ratio, 1:0.4 | 0.39 | 0.0471 | 0 | ||
| Percentage of fixed assets in total assets (%) | 0.36 | 0.0437 | + | ||||
| Average number of open beds | 0.24 | 0.0293 | + | ||||
| Process | 0.15 | Nursing Management | 0.3 | The percentage of appropriate written nursing documents (%) | 0.54 | 0.0242 | + |
| Percentage of passing student in nurses’ training (%) | 0.46 | 0.0208 | + | ||||
| Physician management | 0.5 | Percentage of passing student in doctors’ training (%) | 0.25 | 0.0189 | + | ||
| Percentage of class A medical records in all medical records (%), ≥95% | 0.26 | 0.0193 | + | ||||
| The percentage of appropriate prescriptions (%) | 0.22 | 0.0162 | + | ||||
| Percentage of antibacterial prescription (%), 30–45% | 0.27 | 0.0205 | 0 | ||||
| Medical technology Management | 0.2 | Rate of CT inspection (%), ≥70% | 0.13 | 0.0039 | + | ||
| Rate of MRI inspection (%), ≥70% | 0.17 | 0.005 | + | ||||
| Rate of X-ray inspection (%), ≥70% | 0.17 | 0.0051 | + | ||||
| Clinical chemistry laboratory scoring | 0.18 | 0.0054 | + | ||||
| Hematology laboratory scoring | 0.11 | 0.0034 | + | ||||
| Immunology laboratory scoring | 0.12 | 0.0037 | + | ||||
| bacteriological laboratory scoring | 0.12 | 0.0035 | + | ||||
| Output | 0.45 | Quality | 0.4 | Therapeutic response rate (%) | 0.13 | 0.0234 | + |
| Proportion of inpatients diagnosed within 3 days (%) | 0.15 | 0.0273 | + | ||||
| Mortality (%) | 0.19 | 0.0349 | - | ||||
| Proportion of nurses with basic qualification (%), ≥90% | 0.12 | 0.0221 | + | ||||
| Success rate of rescue (%) | 0.13 | 0.0234 | |||||
| Incidence of nosocomial infection (%), ≤10% | 0.14 | 0.0251 | - | ||||
| Percentage of agreement between admission and discharge diagnoses (%), ≥95% | 0.13 | 0.0239 | + | ||||
| Efficiency | 0.25 | Medical institution bed utilization ratio (%), ≥90% | 0.19 | 0.0214 | + | ||
| Medical institution bed turnover ratio, ≥19 times per year | 0.29 | 0.0327 | + | ||||
| Daily number of clinic patients for each doctor | 0.19 | 0.0213 | 0 | ||||
| Daily number of hospitalization bed-days for each doctor | 0.16 | 0.0183 | 0 | ||||
| Average number of days in hospital, ≤15 days | 0.17 | 0.0187 | - | ||||
| Cost control | 0.15 | Average outpatient expenditures (Yuan) | 0.26 | 0.0176 | - | ||
| Average hospitalization expenditures (Yuan) | 0.25 | 0.0171 | - | ||||
| Average expenditures per bed per day (Yuan) | 0.23 | 0.0155 | - | ||||
| Percentage of medicine income of the total income, ≤45% | 0.26 | 0.0173 | - | ||||
| Financial balances | 0.2 | The asset-liability ratio (%) | 0.18 | 0.0165 | - | ||
| Percentage of expenditures in service revenue (Yuan) | 0.35 | 0.0314 | - | ||||
| Income generated by each staff member (Yuan) | 0.2 | 0.0181 | + | ||||
| Medical income per 100 Yuan of fixed assets (Yuan) | 0.27 | 0.024 | + | ||||
| Effect | 0.2 | Satisfaction | 0.35 | Patient satisfaction (%) | 1 | 0.07 | + |
| Medical Safety | 0.65 | Compensation as a percentage of total income (%) | 0.43 | 0.0554 | - | ||
| Medical accident rate per 10,000 inpatients | 0.57 | 0.0746 | - |
3. Results
| Hospital code | The 1st half of 2012 | |
|---|---|---|
| Ci | Rank | |
| H1 | 0.6436 | 2 |
| H2 | 0.6752 | 1 |
| H3 | 0.6369 | 3 |
| H4 | 0.6257 | 4 |
| H5 | 0.4945 | 9 |
| H6 | 0.4261 | 14 |
| H7 | 0.5101 | 7 |
| H8 | 0.4923 | 10 |
| H9 | 0.4913 | 11 |
| H10 | 0.4804 | 12 |
| H11 | 0.4996 | 8 |
| H12 | 0.5551 | 6 |
| H13 | 0.4621 | 13 |
| H14 | 0.5855 | 5 |

| Model | Public Hospital Performance |
|---|---|
| Structure | 41-10-1 |
| RMSE | 0.0392 |
| R2 | 0.9903 |
| Hospital code | Observed value | Prediction value | Absolute error | Relative error (%) |
|---|---|---|---|---|
| H1 | 0.6436 | 0.6377 | 0.0059 | 0.92 |
| H2 | 0.6752 | 0.6242 | 0.0510 | 7.55 |
| H3 | 0.6369 | 0.6225 | 0.0144 | 2.27 |
| H4 | 0.6257 | 0.5879 | 0.0378 | 6.03 |
| H5 | 0.4945 | 0.5405 | −0.0460 | 9.31 |
| H6 | 0.4261 | 0.4526 | −0.0265 | 6.22 |
| H7 | 0.5101 | 0.5374 | −0.0273 | 5.35 |
| H8 | 0.4923 | 0.5429 | −0.0506 | 10.29 |
| H9 | 0.4913 | 0.4674 | 0.0239 | 4.87 |
| H10 | 0.4804 | 0.5051 | −0.0247 | 5.15 |
| H11 | 0.4996 | 0.5619 | −0.0623 | 12.46 |
| H12 | 0.5551 | 0.5217 | 0.0334 | 6.01 |
| H13 | 0.4621 | 0.4817 | −0.0196 | 4.24 |
| H14 | 0.5855 | 0.6410 | −0.0555 | 9.47 |
4. Conclusions
Acknowledgments
Conflict of Interest
References
- Li, L.X.; Benton, W.C. Performance measurement criteria in health care organizations: Review and future research directions. Eur. J. Oper. Res. 1996, 93, 449–468. [Google Scholar] [CrossRef]
- Elizabeth, A.M.; Steven, M.A. Developing a clinical performance measure. Am. J. Prev. Med. 1998, 14, 14–21. [Google Scholar] [CrossRef]
- Maria, G.; Russell, M.; Peter, C.S. Assessing the performance of NHS hospital trusts: The role of “hard” and “soft” information. Health Policy 1999, 48, 119–134. [Google Scholar] [CrossRef]
- Tang, Y.H.; Xue, X.; Chen, J.C.; Jian, D.S.; Pan, L.J.; Qiu, F.; Cao, M.Q.; Wang, P.; Jiang, X.M.; Wang, J.J.; et al. The performance appraisal indicator system of public general hospitals based on balanced scorecard. Chin. Hosp. Manag. 2008, 28, 56–59. [Google Scholar]
- Cui, S.; Yang, J.L.; Li, Z.S.; Li, C.R. The study on performance evaluation of public hospital: The evaluation methods and indicator system. Chin. Health Econ. 2008, 27, 57–61. [Google Scholar]
- Wang, H.; Lin, Q.Y.; Xie, G. Discussion on establishment of key performance evaluation system for public hospital. Mod. Hosp. Manag. 2009, 5, 13–15. [Google Scholar]
- Wang, X.J. Theory and practice of KPI utility for hospital performance evaluation. Chin. J. Hosp. Adm. 2006, 6, 421–422. [Google Scholar]
- Zhao, J.S.; Li, L.; Zhu, Q. Study of using BSC for hospital management in China. Chin. Hosp. Manag. 2007, 27, 79–81. [Google Scholar]
- Ren, R. Theory and practice of hospital performance evaluation. Chin. Hosp. Manag. 2005, 25, 15–17. [Google Scholar]
- Wang, Y.L.; Zheng, J.G.; Wang, X. The summary of the domestic study on assessing knowledge management performance. J. Intell. 2010, 29, 93–97. [Google Scholar]
- Liang, J.; Jiang, W.; Li, X.H. An improvement on fuzzy comprehensive evaluation method and its use in urban traffic planning. J. Traffic Transp. Eng. 2002, 2, 68–72. [Google Scholar]
- Cao, M.X. Research on Grey Incidence Analysis Model and its Application. Master Thesis, Nanjing University of Aeronautics and Astronautics, Nanjing, China, January 2007. [Google Scholar]
- Wang, J.L.; Liu, S.F.; Qiu, G.H. Formation and application of a new grey incidence degree based on information aggregation. Syst. Eng. Electron. 2010, 32, 77–81. [Google Scholar]
- Wang, Z.X.; Dang, Y.G.; Cao, M.X. Weighted degree of grey incidence based on optimized entropy. Syst. Eng. Electron. 2010, 32, 774–783. [Google Scholar]
- Kuo, Y.M.; Liu, C.W.; Lin, K.H. Evaluation of the ability of an artificial neural network model to assess the variation of groundwater quality in an area of blackfoot disease in Taiwan. Water Res. 2004, 38, 148–158. [Google Scholar] [CrossRef]
- Patterson, D.W. Artificial Neural Networks; Prentice Hall: New York, NY, USA, 1996; pp. 10–25. [Google Scholar]
- Dayhoff, J.E.; Deleo, J.M. Artificial neural network: Opening the black box. Cancer 2001, 91, 1615–1635. [Google Scholar] [CrossRef]
- Green, M.; Bjork, J.; Forberg, J.; Ekelund, U.; Edenbrandt, L.; Ohlsson, M. Comparison between neural networks and multiple logistic regression to predict acute coronary syndrome in the emergency room. Artif. Intell. Med. 2006, 38, 305–318. [Google Scholar] [CrossRef]
- Abbod, M.F.; Catto, J.W.; Linkens, D.A.; Hamdy, F.C. Application of artificial intelligence to the management of urological cancer. J. Urol. 2007, 178, 1150–1156. [Google Scholar] [CrossRef]
- Cross, S.S.; Harrison, R.F.; Kennedy, R.L. Introduction to neural networks. Lancet 1995, 346, 1075–1079. [Google Scholar] [CrossRef]
- Hagan, M.T.; Demuth, H.B.; Beale, M. Neural Network Design, 1st ed.; PWS Publishing Co: Boston, MA, USA, 1996; pp. 134–157. [Google Scholar]
- Raoufy, M.R.; Vahdani, P.; Alavian, S.M.; Fekri, S.; Eftekhari, P.; Gharibzadeh, S. A novel method for diagnosing cirrhosis in patients with chronic hepatitis B: Artificial neural network approach. J. Med. Syst. 2011, 35, 121–126. [Google Scholar] [CrossRef]
- Dariani, S.; Keshavarz, M.; Parviz, M.; Raoufy, M.R.; Gharibzadeh, S. Modeling force-velocity relation in skeletal muscle isotonic contraction using an artificial neural network. Biosystems 2007, 90, 529–534. [Google Scholar] [CrossRef]
- Susan, M.G.; Peter, T.W.; Keong, L.; Timothy, W.B. The effect of location, strategy, and operations technology on hospital performance. J. Oper. Manag. 2002, 20, 63–75. [Google Scholar] [CrossRef]
- Anke, N.; Josiane, H.; Jean-Roger, L.G.; Eric, L. Measuring performance in health care: Case-mix adjustment by boosted decision trees. Artif. Intell. Med. 2004, 32, 97–113. [Google Scholar] [CrossRef]
- Berg, M.; Meijerink, Y.; Gras, M. Feasibility first: Developing public performance indicators on patient safety and clinical effectiveness for Dutch hospitals. Health Policy 2005, 75, 59–73. [Google Scholar] [CrossRef]
- Kovacst, J.M.; Malczewski, J.; Flores-Verdugo, F. Examining local ecological knowledge of hurricane impacts in a mangrove forest using an analytical hierarchy process (AHP) approach. J. Coast. Res. 2004, 20, 792–800. [Google Scholar]
- Zhang, R.Q.; Zhang, X.D.; Yang, J.Y.; Yuan, H. Wetland ecosystem stability evaluation by using Analytical Hierarchy Process (AHP) approach in Yinchuan Plain, China. Math. Comput. Model. 2013, 57, 366–374. [Google Scholar] [CrossRef]
- Mirvakili, S.M.; Faghihi, F.; Khalafi, H. Developing a computational tool for predicting physical parameters of a typical VVER-1000 core based on artificial neural network. Ann. Nuclear Energy 2012, 50, 82–93. [Google Scholar] [CrossRef]
- Zhe, W.; Fei, W.; Shi, S. Solar irradiance short-term prediction model based on BP neural network. Energy Procedia 2011, 12, 488–494. [Google Scholar] [CrossRef]
- Li, Z.; Luo, J.H.; Yang, S.Y. Forecasting box office revenue of movies with BP neural network. Expert Syst. Appl. 2009, 36, 6580–6587. [Google Scholar] [CrossRef]
- Wang, H.W. Partial Least-Squares Regression-Method and Applications; National Defence Industry Press: Beijing, China, 1999. [Google Scholar]
- Emilio, M.; Marco, B.; Elisa, R.; Marcello, L. Hydroxyl and acid number prediction in polyester resins by near infrared spectroscopy and artificial neural networks. Anal. Chim. Acta 2004, 511, 313–322. [Google Scholar] [CrossRef]
- Shi, F.; Wang, H.; Yu, L.; Hu, F. MATLAB Intelligence Algorithm: The 30 Cases, 1st ed.; Beijing University of Aeronautics and Astronautics Press: Beijing, China, 2011; pp. 237–245. [Google Scholar]
- Richard, L.; Mohammed, A.M.; David, S.; Richard, T. Use and misuse of process and outcome data in managing performance of acute medical care: Avoiding institutional stigma. Lancet 2004, 363, 1147–1154. [Google Scholar] [CrossRef]
© 2013 by the authors; licensee MDPI, Basel, Switzerland. This article is an open access article distributed under the terms and conditions of the Creative Commons Attribution license (http://creativecommons.org/licenses/by/3.0/).
Share and Cite
Li, C.; Yu, C. Performance Evaluation of Public Non-Profit Hospitals Using a BP Artificial Neural Network: The Case of Hubei Province in China. Int. J. Environ. Res. Public Health 2013, 10, 3619-3633. https://doi.org/10.3390/ijerph10083619
Li C, Yu C. Performance Evaluation of Public Non-Profit Hospitals Using a BP Artificial Neural Network: The Case of Hubei Province in China. International Journal of Environmental Research and Public Health. 2013; 10(8):3619-3633. https://doi.org/10.3390/ijerph10083619
Chicago/Turabian StyleLi, Chunhui, and Chuanhua Yu. 2013. "Performance Evaluation of Public Non-Profit Hospitals Using a BP Artificial Neural Network: The Case of Hubei Province in China" International Journal of Environmental Research and Public Health 10, no. 8: 3619-3633. https://doi.org/10.3390/ijerph10083619
APA StyleLi, C., & Yu, C. (2013). Performance Evaluation of Public Non-Profit Hospitals Using a BP Artificial Neural Network: The Case of Hubei Province in China. International Journal of Environmental Research and Public Health, 10(8), 3619-3633. https://doi.org/10.3390/ijerph10083619