Water Quality of a Reservoir and Its Major Tributary Located in East-Central Mexico

Abstract
:1. Introduction
2. Experimental Section
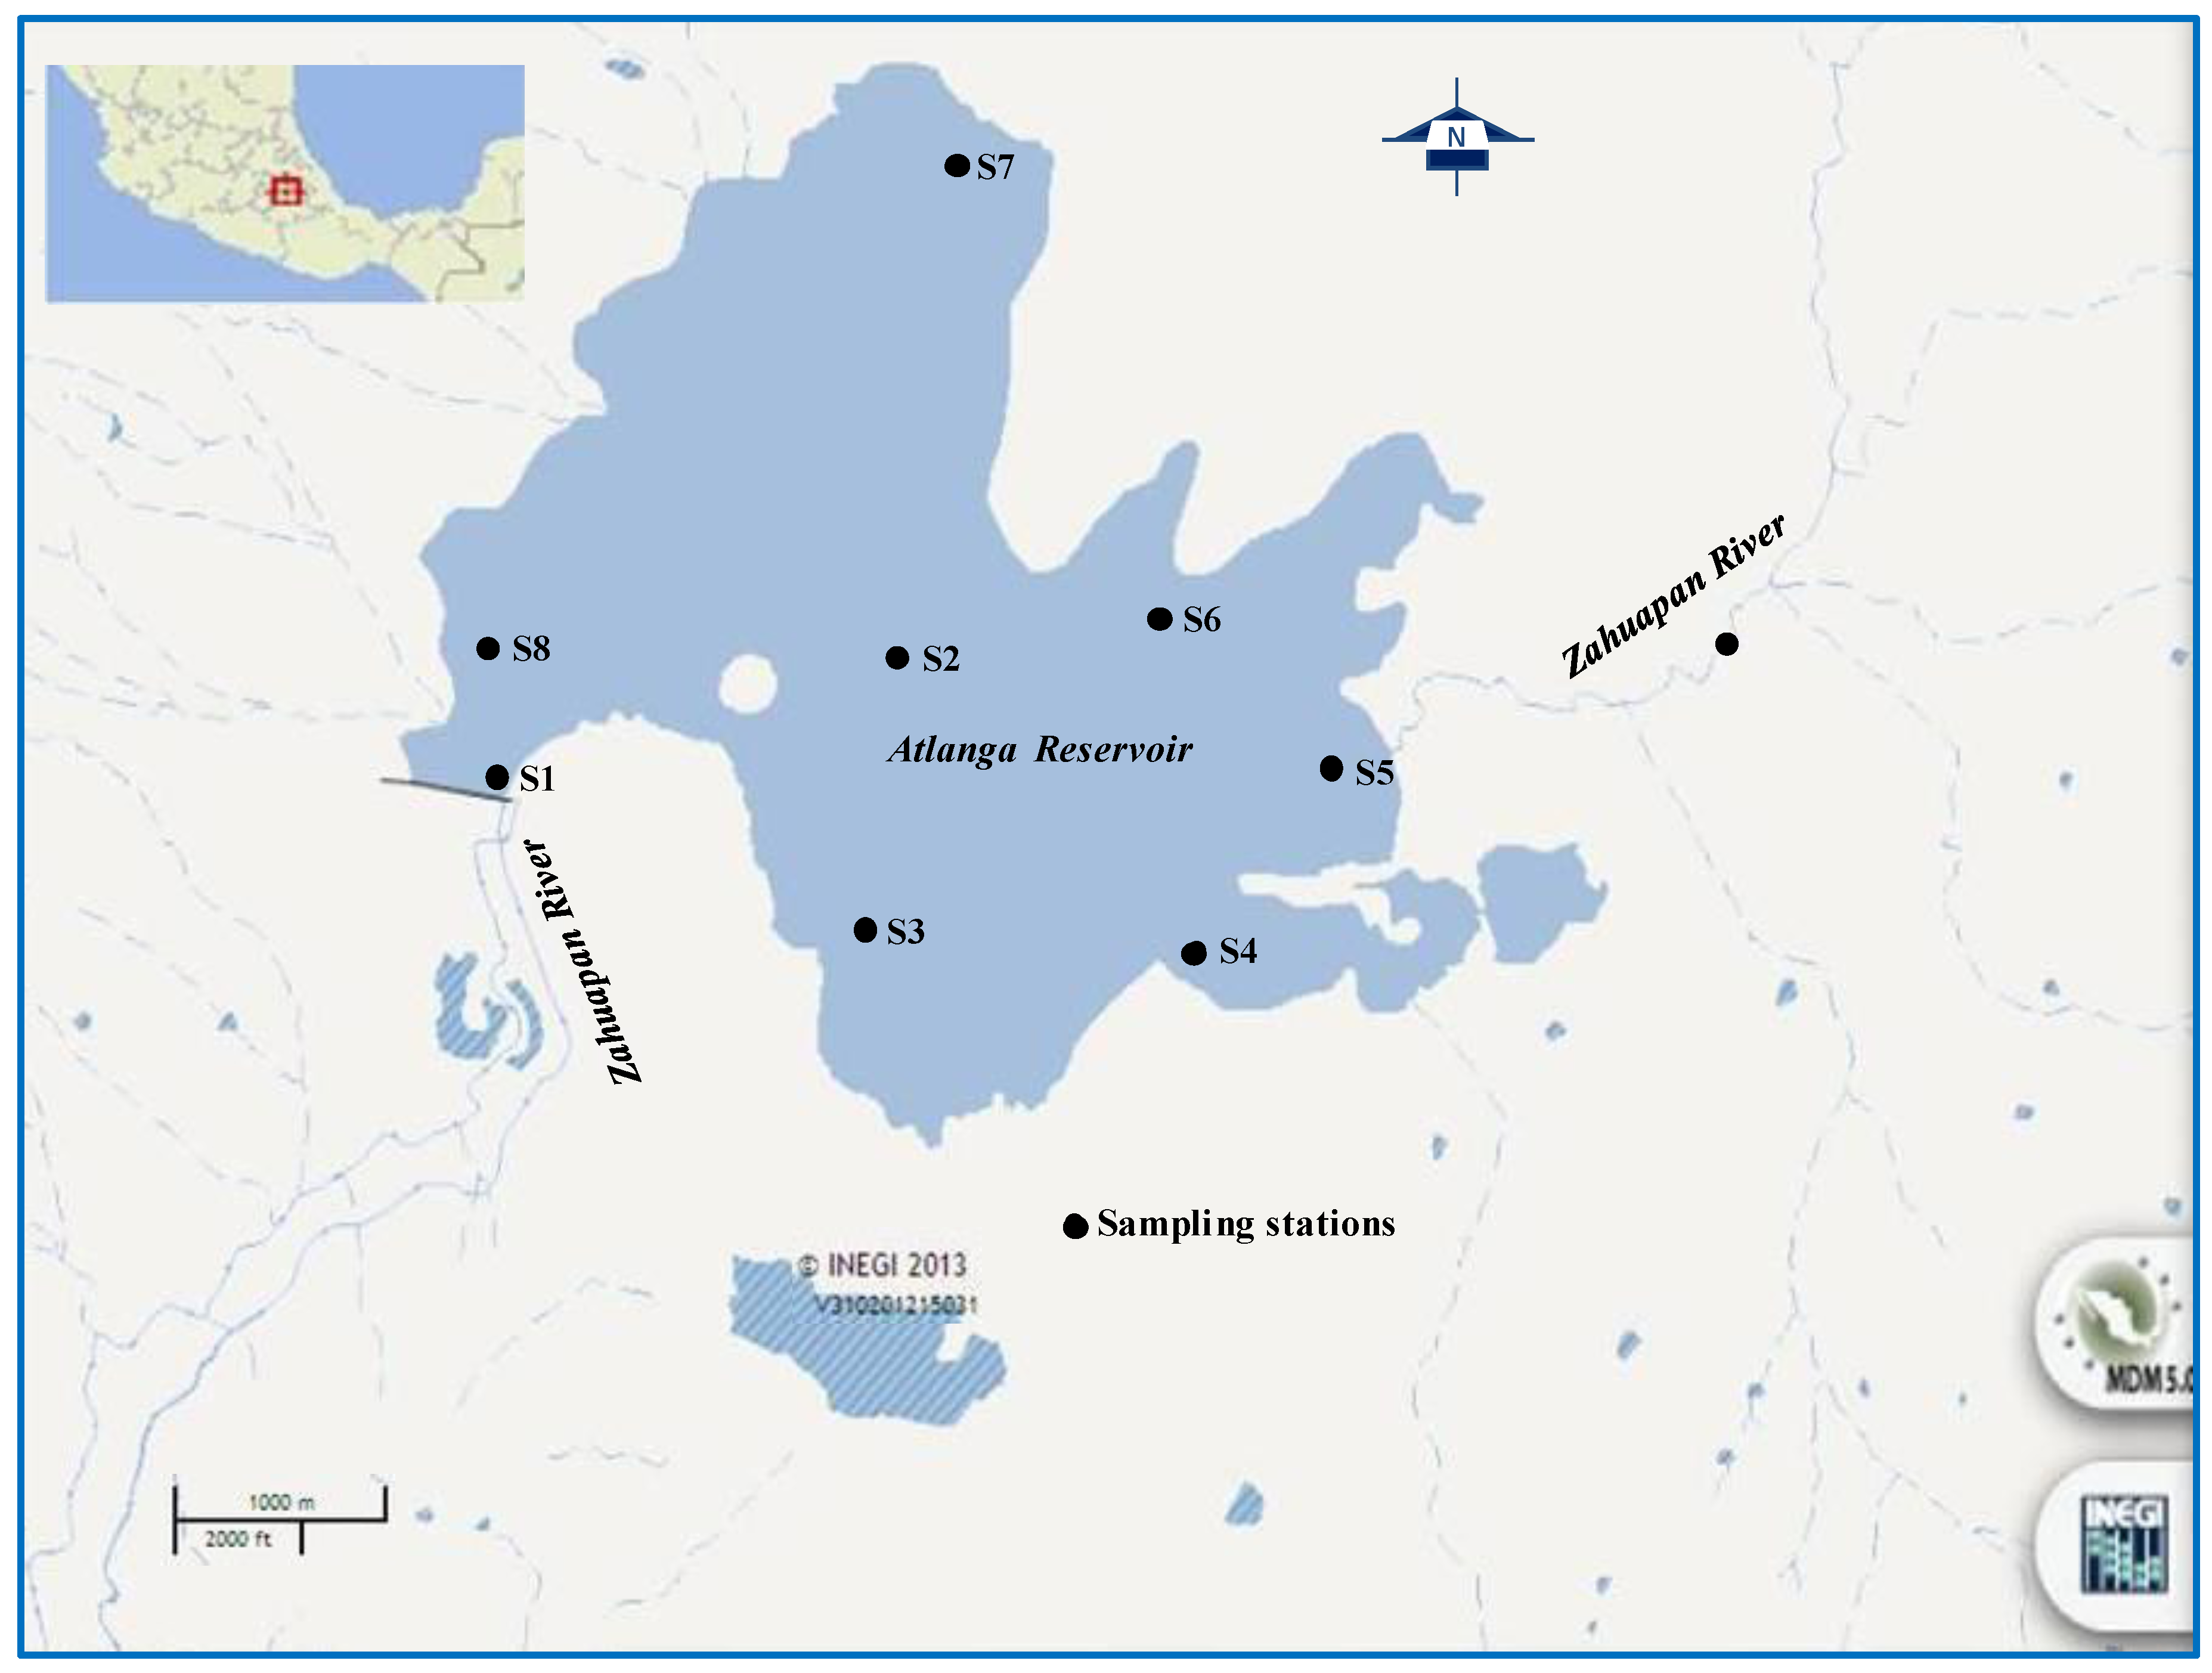
2.1. Study Area

2.2. Water Sampling
2.3. Sample Analysis
2.4. Data Analysis


| Parameter | Pi | Ci | ||||||||||
|---|---|---|---|---|---|---|---|---|---|---|---|---|
| 100 | 90 | 80 | 70 | 60 | 50 | 40 | 30 | 20 | 10 | 0 | ||
| DO | 4 | ≥7.5 | >7.0 | >6.5 | >6.0 | >5.0 | >4.0 | >3.5 | >3.0 | >2.0 | ≥1.0 | <1.0 |
| NH4+-N | 3 | <0.01 | <0.05 | <0.10 | <0.20 | <0.30 | <0.40 | <0.50 | <0.75 | <1.00 | ≤1.25 | >1.25 |
| OM | 3 | <5 | <10 | <20 | <30 | <40 | <50 | <60 | <80 | <100 | ≤150 | >150 |
| NO2− | 2 | <0.005 | <0.01 | <0.03 | <0.05 | <0.10 | <0.15 | <0.20 | <0.25 | <0.50 | ≤1.00 | >1.00 |
| NO3− | 2 | <0.5 | <2.0 | <4.0 | <6.0 | <8.0 | <10.0 | <15.0 | <20.0 | <50.0 | ≤100.0 | >100.0 |
| Transparency | 2 | >100 | >70 | >60 | >50 | >40 | >30 | >25 | >20 | >15 | ≥10 | <10 |
| Hardness | 1 | <25 | <100 | <200 | <300 | <400 | <500 | <600 | <800 | <1,000 | ≤1,500 | >1,500 |
| pH | 1 | 7 | 7–8 | 7–8.5 | 7–9 | 6.5–7 | 6–9.5 | 5–10 | 4–11 | 3–12 | 2–13 | 1–14 |
| PO43− | 1 | <0.16 | <1.60 | <3.20 | <6.40 | <9.60 | <16.0 | <32.0 | <64.0 | <96.0 | ≤160.0 | >160.0 |
| T | 1 | 21/16 | 22/15 | 24/14 | 26/12 | 28/10 | 30/5 | 32/0 | 36/−2 | 40/−4 | 45/−6 | >45/<−6 |
3. Results and Discussion
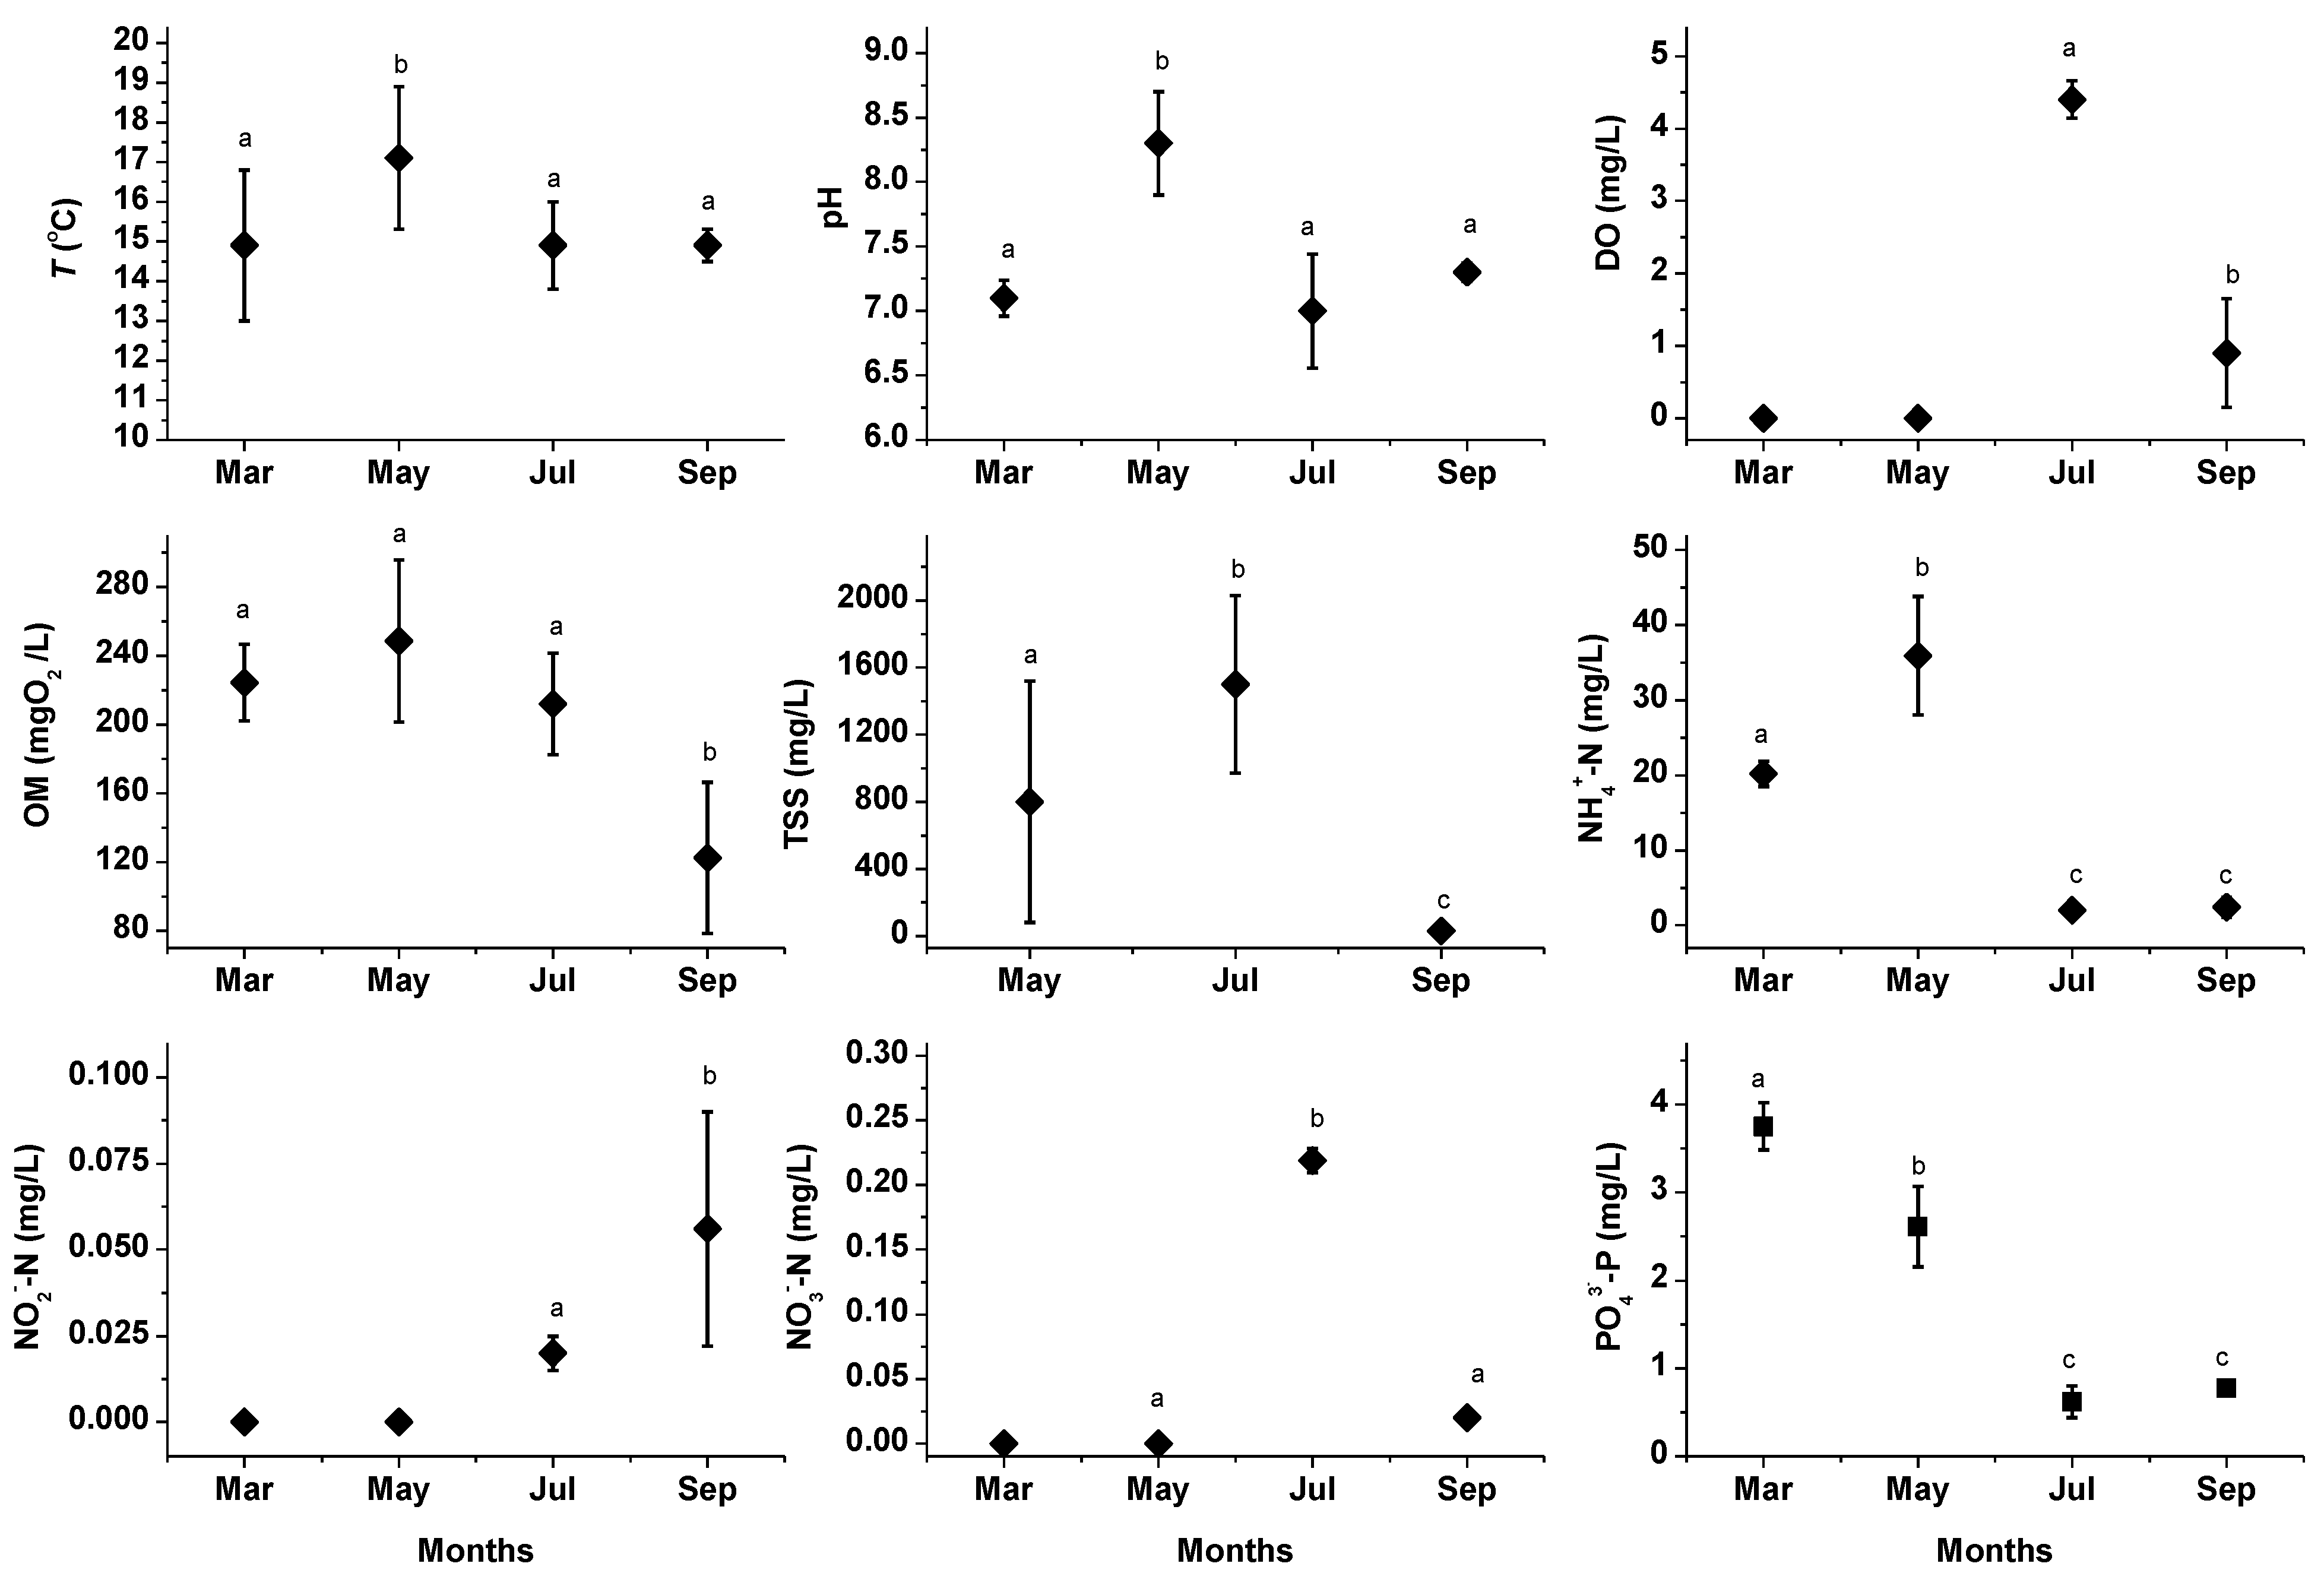
3.1. Tributary

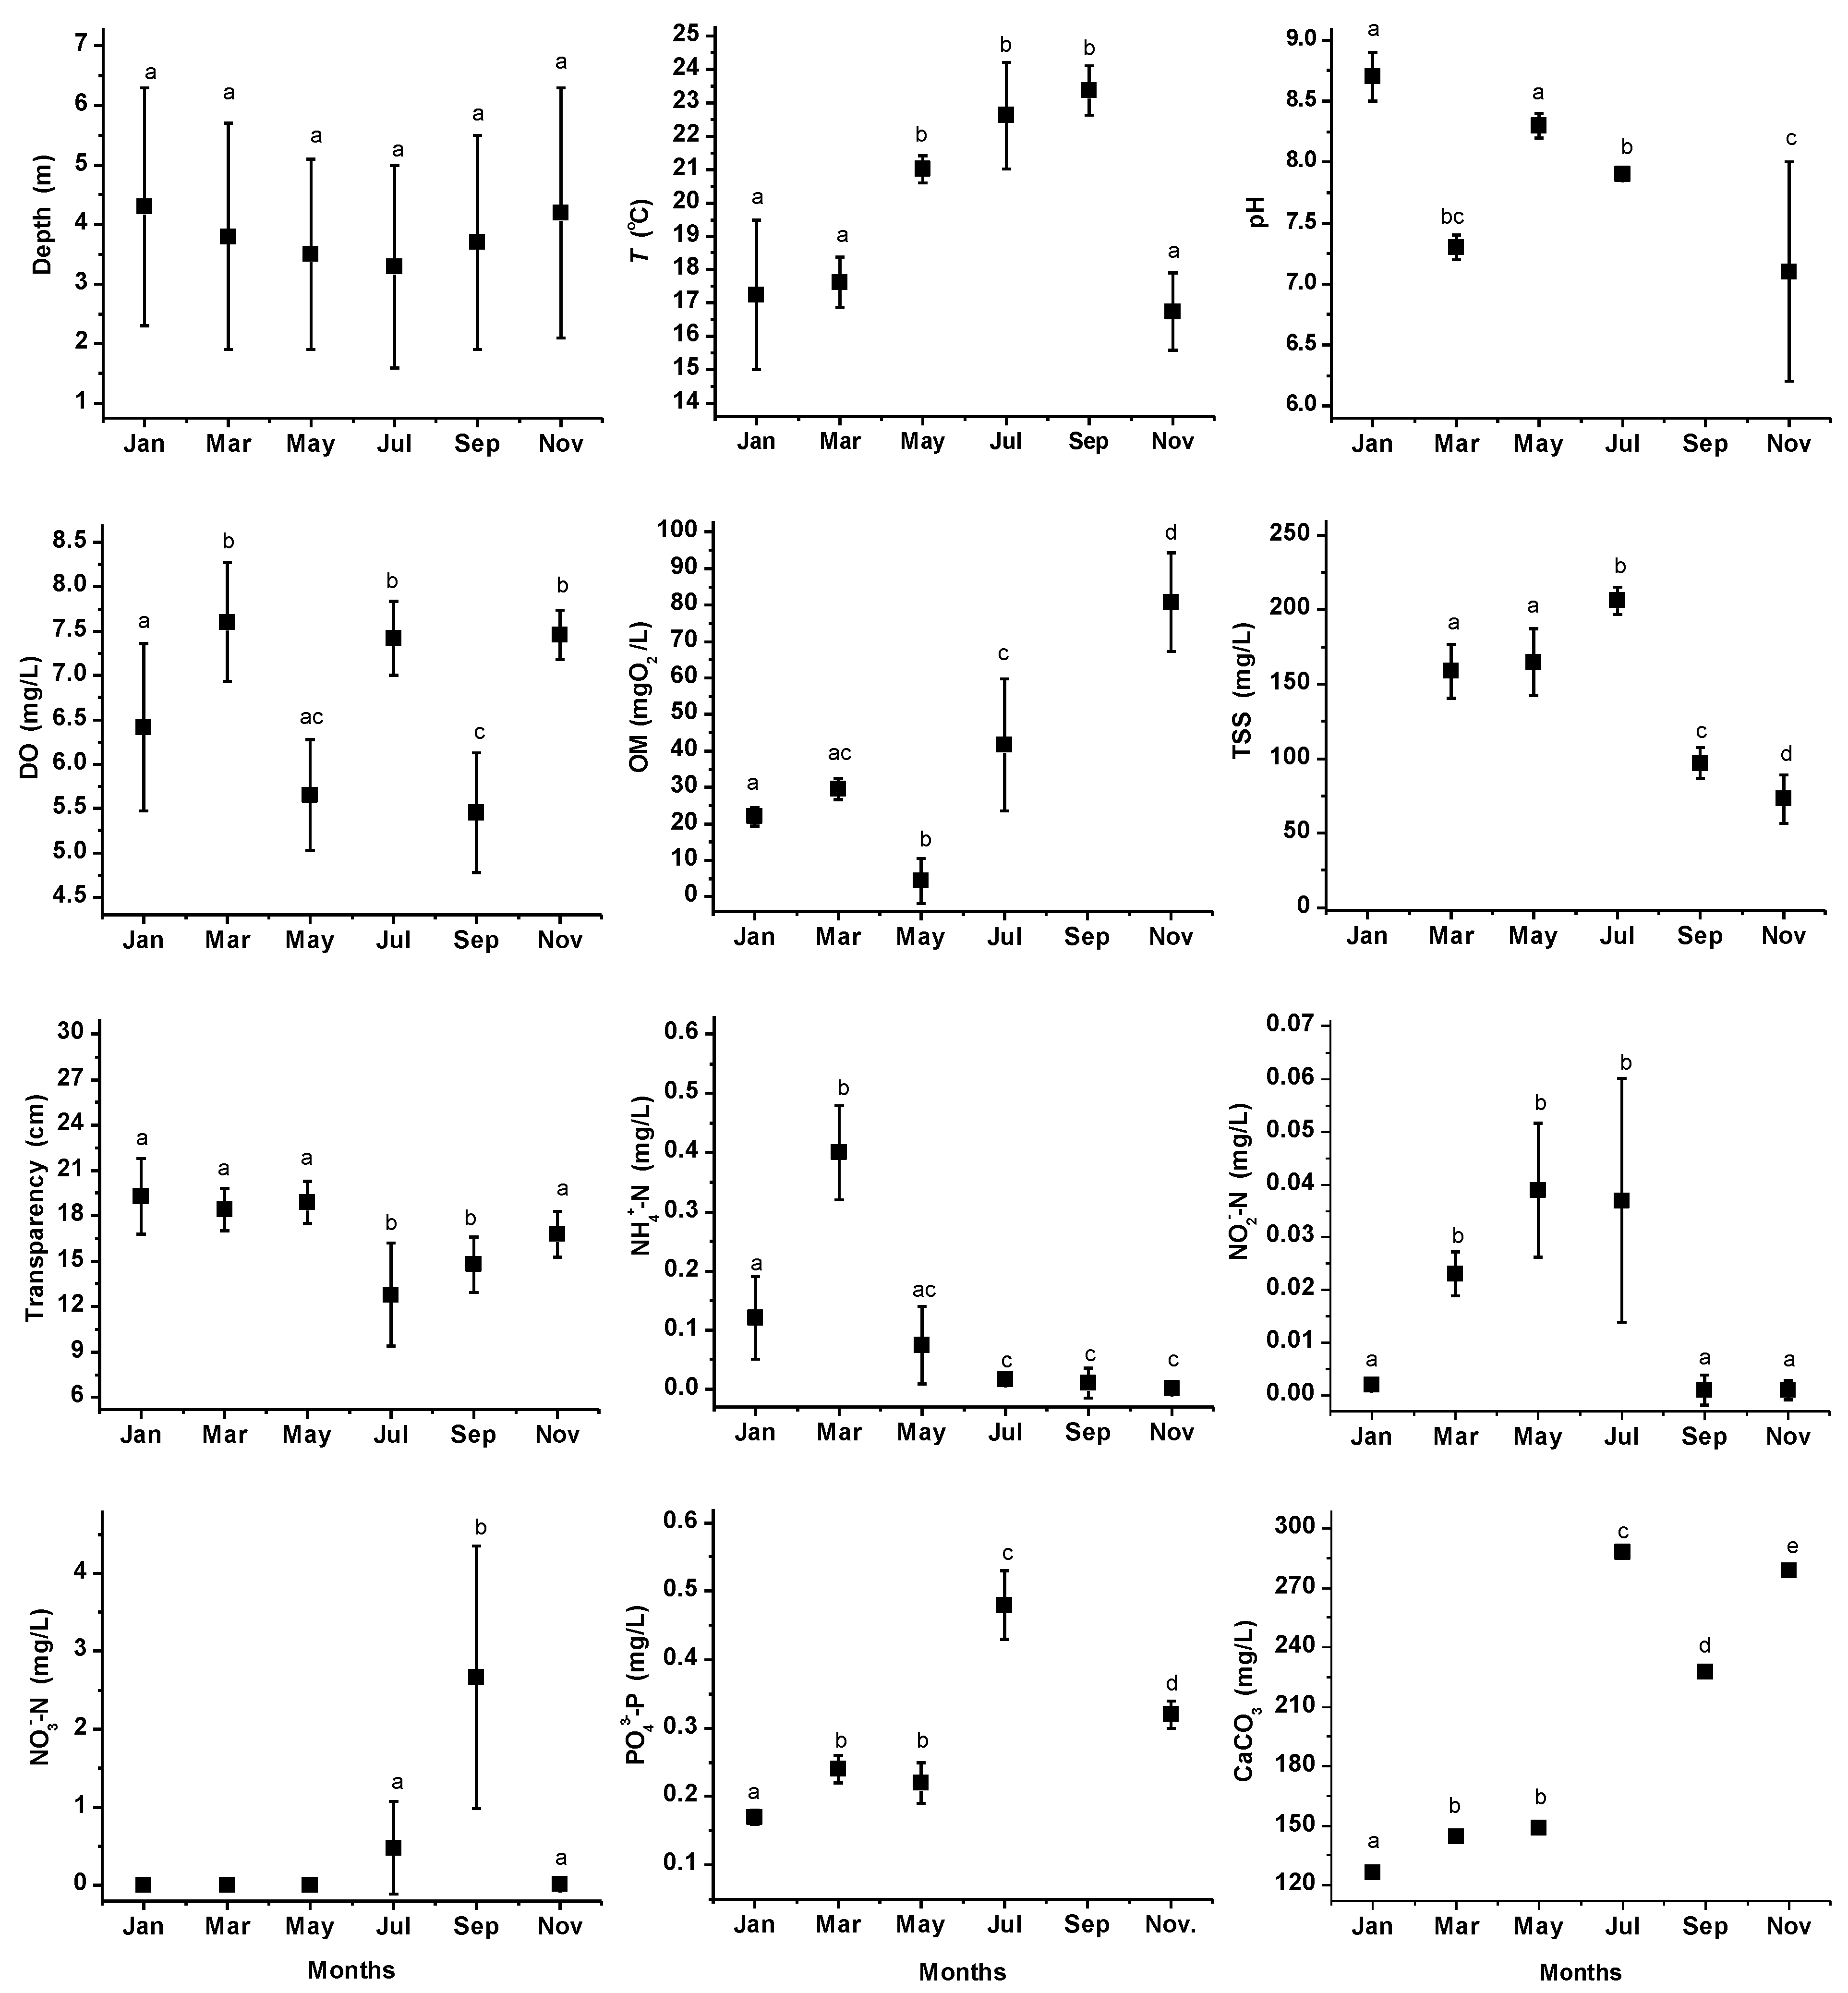
3.2. Reservoir

| Parameter | Sampling Stations | |||||||
|---|---|---|---|---|---|---|---|---|
| S1 | S2 | S3 | S4 | S5 | S6 | S7 | S8 | |
| Depth (m) | 6.0 | 6.2 | 3.6 | 2.5 | 0.9 | 2.5 | 4.5 | 4.2 |
| (0.7) | (0.5) | (0.8) | (0.5) | (0.3) | (0.5) | (0.3) | (1.2) | |
| T (°C) | 19.2 | 19.1 | 19.3 | 20.3 | 20.6 | 20.0 | 19.8 | 19.9 |
| (2.9) | (3.2) | (2.5) | (3.3) | (2.3) | (3.8) | (3.3) | (3.7) | |
| pH | 7.9 | 8.0 | 8.0 | 7.5 | 7.6 | 7.8 | 8.0 | 8.1 |
| (0.8) | (0.5) | (0.6) | (1.2) | (1.0) | (0.9) | (0.5) | (0.5) | |
| DO (mg/L) | 6.8 | 6.8 | 6.9 | 6.2 | 6.5 | 6.9 | 6.4 | 6.9 |
| (0.8) | (0.9) | (0.8) | (1.2) | (1.6) | (1.4) | (1.2) | (0.9) | |
| OM (mgO2/L) | 33.7 | 36.0 | 38.7 | 37.6 | 34.1 | 28.9 | 36.0 | 40.4 |
| (23.0) | (34.0) | (32.9) | (30.6) | (30.3) | (24.9) | (30.6) | (34.8) | |
| TSS (mg/L) | 134.4 | 144.3 | 147.1 | 151.3 | 144.6 | 135.0 | 126.8 | 135.5 |
| (51.8) | (44.0) | (46.6) | (65.5) | (56.8) | (67.4) | (56.1) | (54.8) | |
| Transparency (cm) | 17.3 | 15.7 | 18.0 | 16.8 | 15.6 | 15.7 | 17.2 | 18.2 |
| (1.2) | (3.4) | (2.2) | (2.3) | (4.1) | (3.3) | (4.3) | (3.7) | |
| NH4+-N (mg/L) | 0.13 | 0.09 | 0.09 | 0.07 | 0.12 | 0.11 | 0.09 | 0.13 |
| (0.15) | (0.16) | (0.12) | (0.12) | (0.19) | (0.16) | (0.16) | (0.20) | |
| NO2−-N (mg/L) | 0.013 | 0.011 | 0.023 | 0.016 | 0.021 | 0.018 | 0.019 | 0.018 |
| (0.021) | (0.015) | (0.024) | (0.018) | (0.018) | (0.018) | (0.021) | (0.021) | |
| NO3−-N (mg/L) | 0.32 | 0.14 | 0.47 | 0.61 | 0.36 | 0.79 | 0.65 | 0.88 |
| (0.5) | (0.2) | (1.2) | (1.5) | (0.07) | (1.7) | (1.6) | (1.8) | |
| PO43−-P (mg/L) | 0.28 | 0.28 | 0.28 | 0.25 | 0.29 | 0.29 | 0.31 | 0.31 |
| (0.12) | (0.13) | (0.13) | (0.10) | (0.10) | (0.12) | (0.14) | (0.15) | |
| CaCO3 (mg/L) | 204.0 | 202.2 | 203.8 | 204.5 | 202.7 | 205.0 | 199.6 | 197.0 |
| (69.5) | (74.3) | (72.6) | (70.6) | (73.6) | (78.1) | (70.4) | (66.4) | |
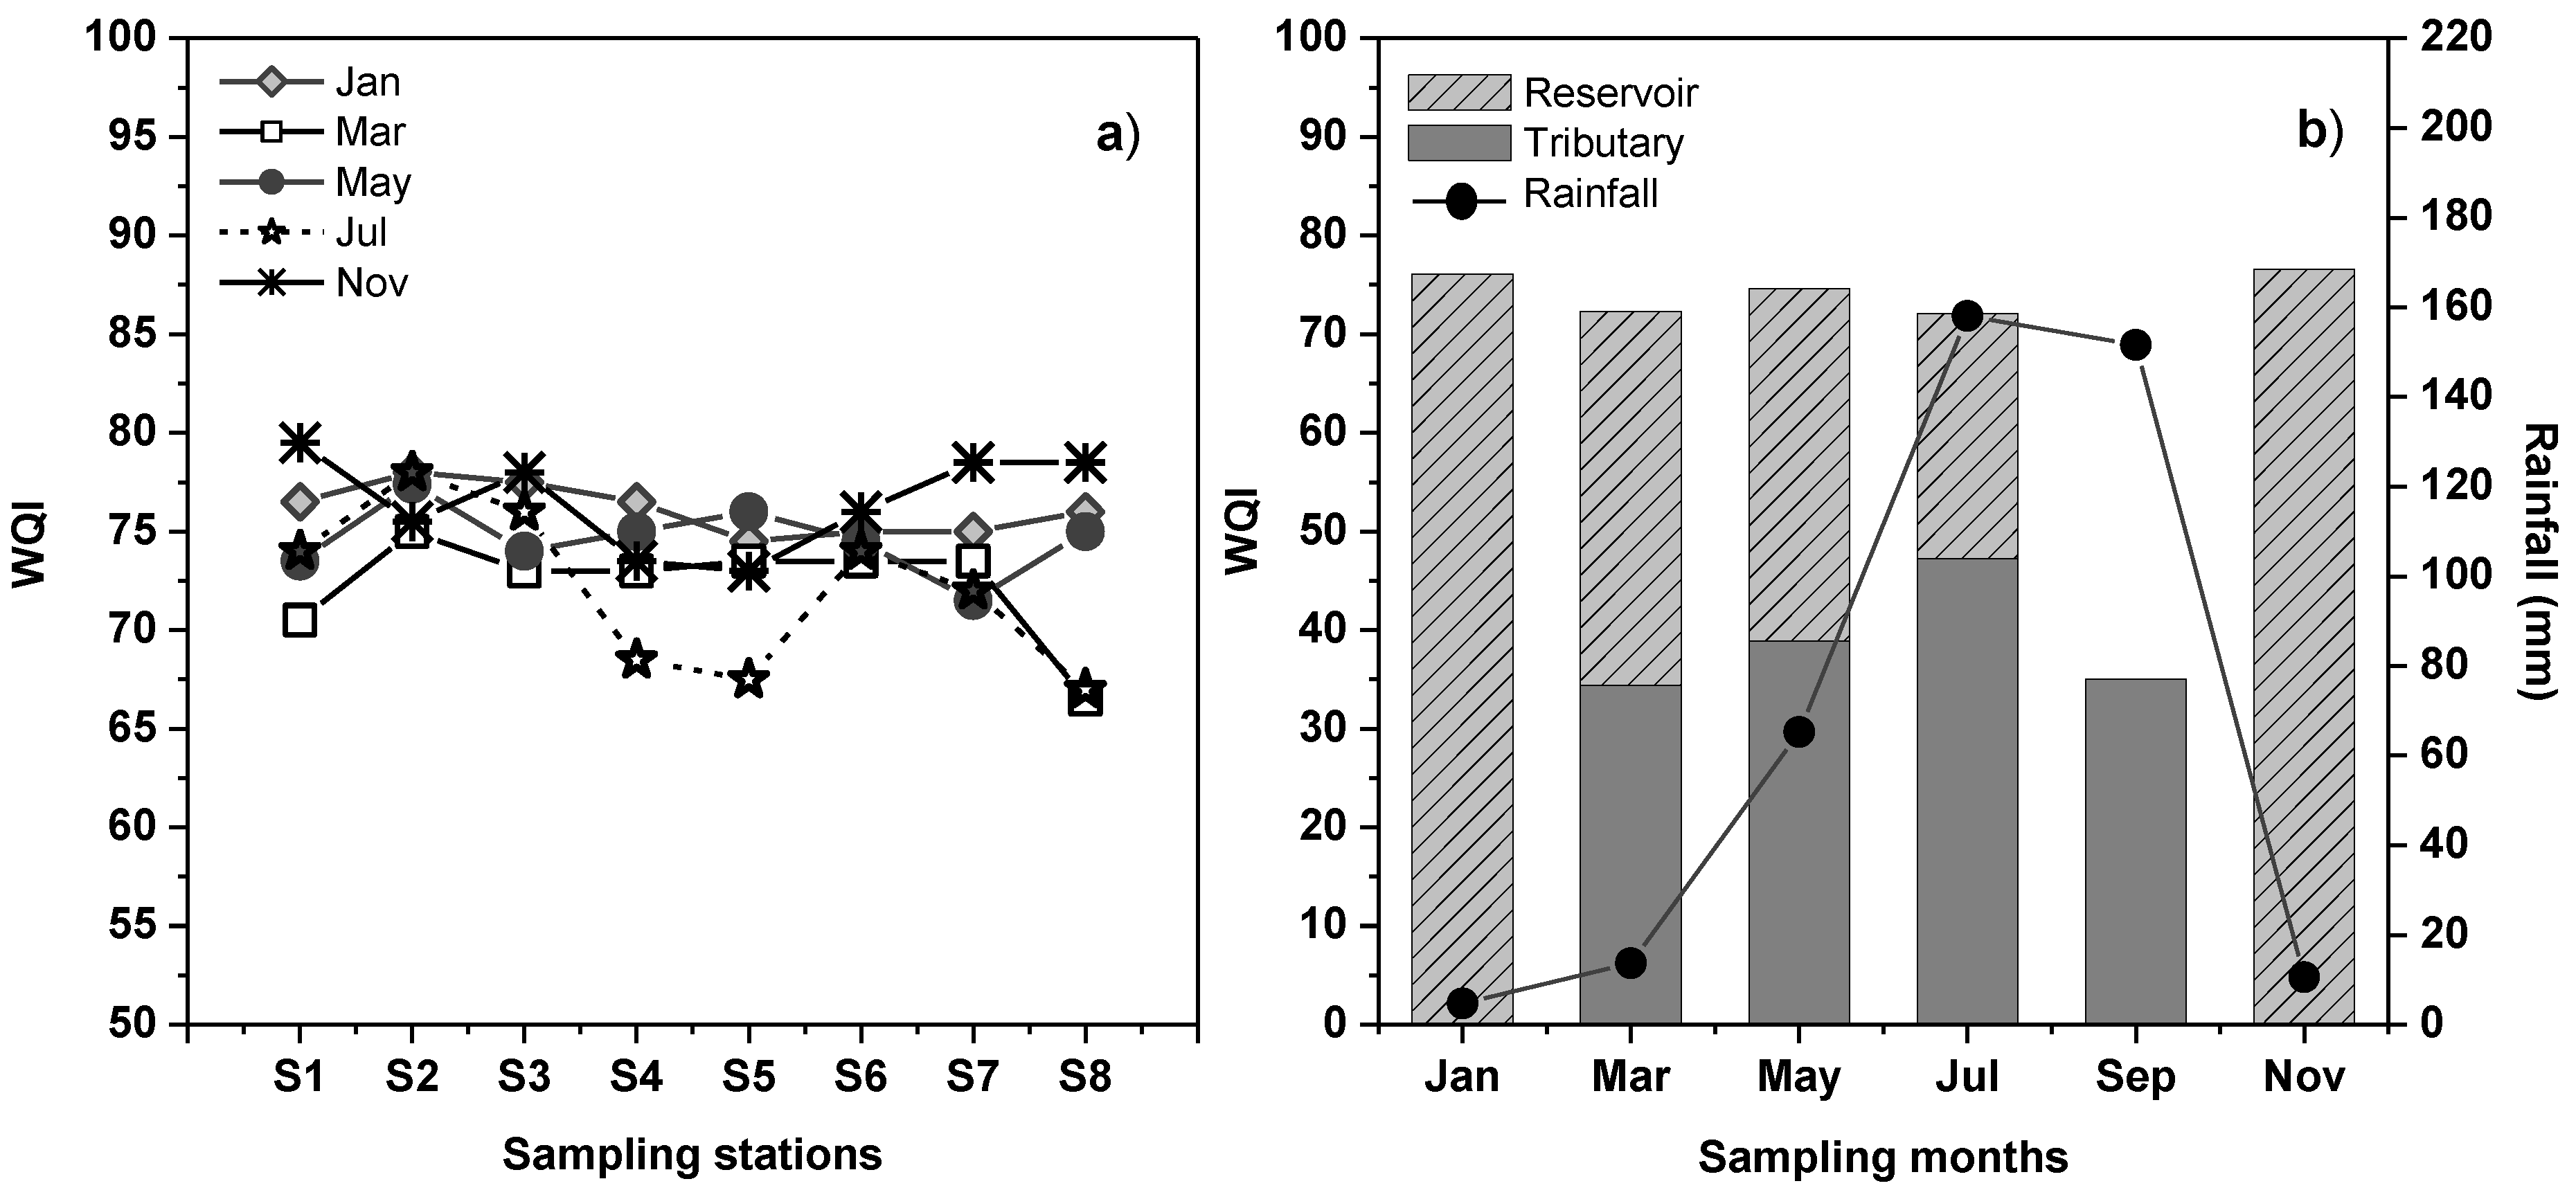
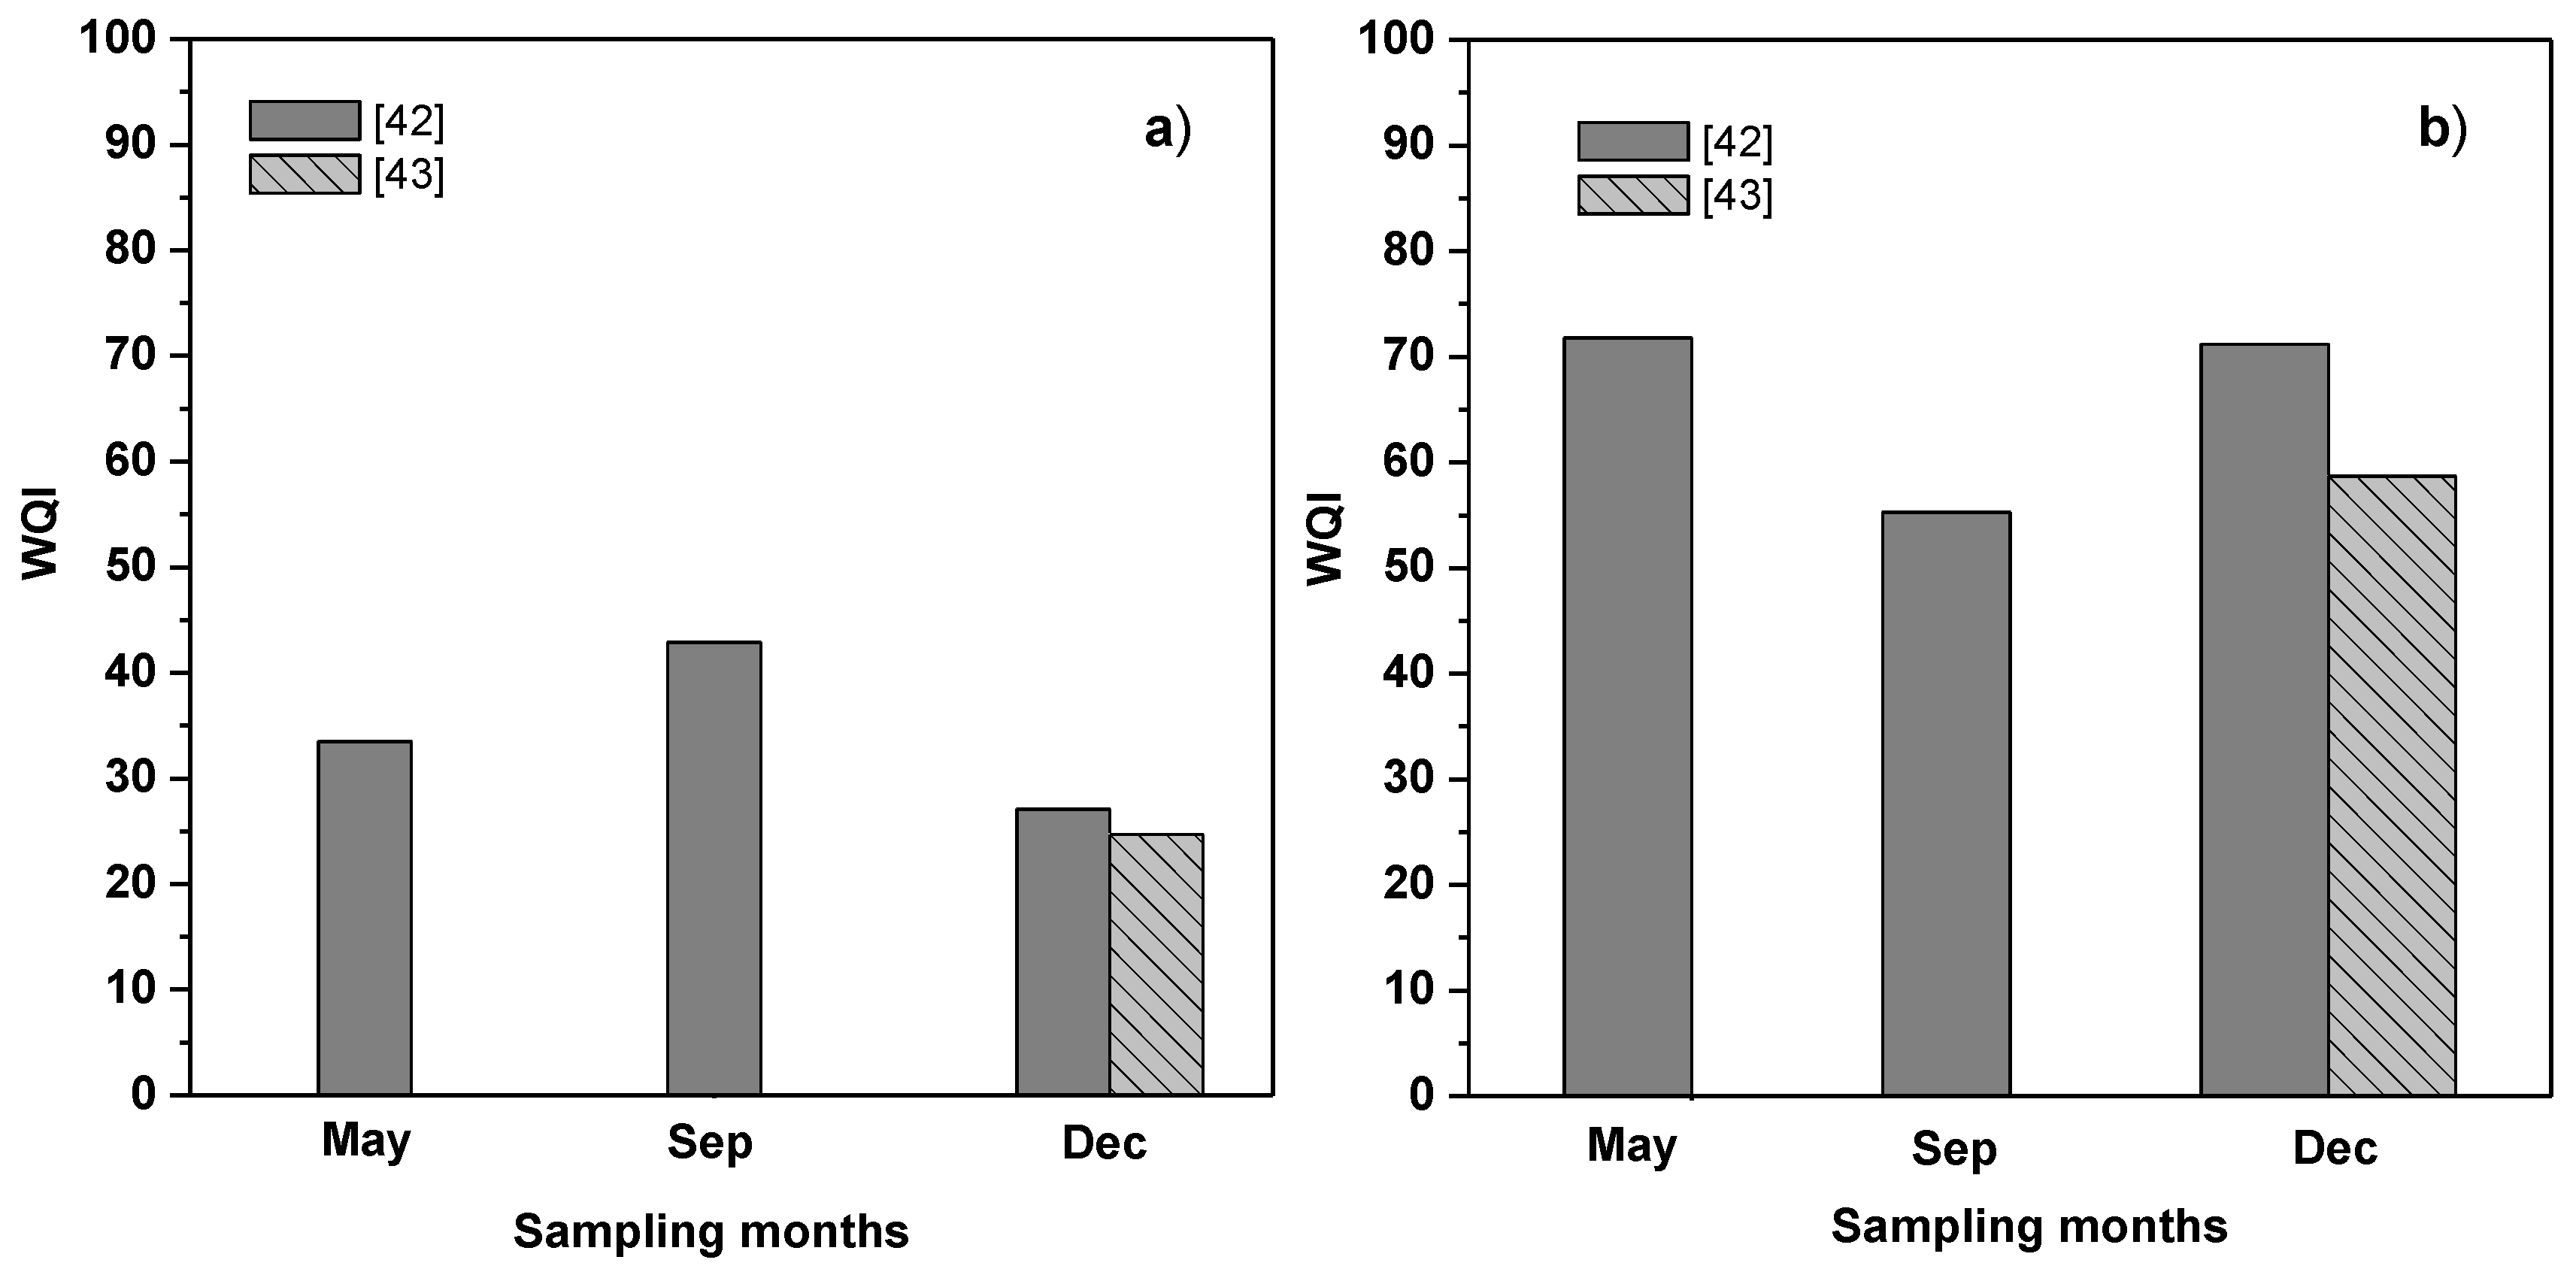
3.3. Water Quality Index


4. Conclusions
Acknowledgments
Author Contributions
Conflicts of Interest
References
- National Water Commission of Mexico. Statistics on Water in Mexico; Ministry of Environment and Natural Resources: México D.F., México, 2010; pp. 46–198. [Google Scholar]
- Demir, N.; Kirkagac, M.U. Plankton composition and water quality in a pond of spring origin in Turkey. Limnology 2005, 6, 189–194. [Google Scholar] [CrossRef]
- Nakashima, S.; Yamada, Y.; Tada, K. Characterization of the water quality of dam lakes on Shikoku Island, Japan. Limnology 2007, 8, 1–22. [Google Scholar] [CrossRef]
- Baldwin, D.S.; Gigney, H.; Wilson, J.S.; Watson, G.; Boulding, A.N. Drivers of water quality in a large water storage reservoir during a period of extreme drawdown. Water Res. 2008, 42, 4711–4724. [Google Scholar] [CrossRef]
- Fernández, C.; Parodi, R.E.; Cáceres, J.E. Limnological characteristics and trophic state of Paso de las Piedras Reservoir: An inland reservoir in Argentina. Lake Reserv. Manag. 2009, 14, 85–101. [Google Scholar] [CrossRef]
- Gikas, G.D.; Tsihrintzis, V.A.; Akratos, C.S.; Haralambidis, G. Water quality trends in Polyphytos Reservoir, Aliakmon River, Greece. Environ. Monit. Assess. 2009, 149, 163–181. [Google Scholar] [CrossRef]
- Varol, M.; Gökot, B.; Bekleyen, A.; Şen, B. Spatial and temporal variations in surface water quality of the dam reservoirs in the Tigris River Basin, Turkey. CATENA 2012, 92, 11–21. [Google Scholar] [CrossRef]
- Gutiérrez, M.; Borrego, P. Water quality assessment of the Rio Conchos, Chihuahua, Mexico. Environ. Int. 1999, 25, 573–583. [Google Scholar] [CrossRef]
- Rangel-Peraza, P.J.G.; de Anda, J.; González, F.F.; Erickson, D. Statistical assessment of water quality seasonality in large tropical reservoirs. Lake Reserv. Manag. 2009, 14, 315–323. [Google Scholar] [CrossRef]
- Rubio-Arias, H.; Contreras-Caraveo, M.; Manuel, Q.R.; Saucedo-Teran, R.A.; Pinales-Munguia, A. An overall water quality index (WQI) for a man-made aquatic reservoir in Mexico. Int. J. Environ. Res. Public Health 2012, 9, 1687–1698. [Google Scholar]
- Sánchez, E.; Colmenarejo, M.F.; Vicente, J.; Rubio, A.; García, M.G.; Travieso, L.; Borja, R. Use of the water quality index and dissolved oxygen deficit as simple indicators of watersheds pollution. Ecol. Indic. 2007, 7, 315–328. [Google Scholar] [CrossRef]
- tambuk-Giljanović, N. The pollution load by nitrogen and phosphorus in the Cetina River. Water Air Soil Pollut. 2010, 211, 49–60. [Google Scholar] [CrossRef]
- Flores-Tena, F.J.; Silva-Briano, M. A note on El Niagara, a polluted reservoir in Aguascalientes, Mexico. Hydrobiologia 1995, 308, 235–241. [Google Scholar] [CrossRef]
- Olvera-Viascán, V.; Bravo-Inclán, L.; Sánchez-Chávez, J. Aquatic ecology and management assessment in Valle de Bravo reservoir and its watershed. Aquat. Ecosyst. Health Manage. 1998, 1, 277–290. [Google Scholar]
- Merino-Ibarra, M.; Monroy-Ríos, E.; Vilaclara, G.; Castillo, F.S.; Gallegos, M.E.; Ramírez-Zierold, J. Physical and chemical limnology of a wind-swept tropical highland reservoir. Aquat. Ecol. 2008, 42, 335–345. [Google Scholar] [CrossRef]
- Barceló-Quintal, I.; López-Galván, E.; Solís-Correa, Hugo.; Domínguez-Mariani, E.; Gómez-Salazar, S. Water quality assessment of Jose Antonio Alzate Dam, the Lerma River and its tributaries in the State of Mexico, Mexico. J. Environ. Prot. 2012, 3, 878–888. [Google Scholar] [CrossRef]
- Ritter, O.W.; Jáuregui, O.E.; Guzmán, R.S.; Estrada, B.A.; Muñoz, N.H.; Suárez, S.J.; Corona, V.M.C. Ecological and agricultural productivity indices and their dynamics in a sub-humid/semi-arid region from central Mexico. J. Arid Environ. 2004, 59, 753–769. [Google Scholar] [CrossRef]
- Pérez-Rodríguez, R.; Badillo-Solís, A. Aves Acuáticas y su Entorno Limnológico en la Presa de Atlangatepec, Tlaxcala; (in Spanish). Universidad Autónoma Metropolitana, Unidad Xochimilco: México D.F., México, 1996; pp. 11–88. [Google Scholar]
- Bermúdez, R.E.; Cabrera, M.E.; Pérez, V.P.; Gutiérrez, Z.M.R. Pesquerías en Tres Cuerpos de Aguas Continentales de México; (in Spanish). Pérez, V.P.A., Cruz, S.L.E., Bermúdez, R.E.A., Cabrera, M.E., Gutiérrez, Z.M.R., Eds.; Instituto Nacional de Pesca, SAGARPA: México D.F., México, 2002; pp. 93–128. [Google Scholar]
- Pérez-Rodríguez, R. Estudio de Los Moluscos Bentónicos y Epifíticos de la Presa de Atlangatepec, Tlaxcala; (in Spanish). Universidad Autónoma Metropolitana, Unidad Xochimilco: México D.F., México, 1995; pp. 5–14. [Google Scholar]
- CONANP. Comisión Nacional de Áreas Naturales Protegidas. Humedales de México. Humedales de Importancia Internacional (Sitios RAMSAR). Available online: http://ramsar.conanp.gob.mx/docs/sitios/FIR_RAMSAR/Tlaxcala/Presa%20Atlangatepec/FIRAtlangatepec%20Rev4%2031Mayo2011(Conanp).doc (accessed on 21 November 2013).
- Muñoz-Nava, H.; Suárez-Sánchez, J.; Vera-Reyes, A.; Orozco-Flores, S.; Batlle-Sales, J.; Ortiz-Zamora, A.J.; Mendiola-Argüelles, J. Demanda bioquímica de oxígeno y población en la subcuenca del Río Zahuapan, Tlaxcala, México. Rev. Int. Contam. Amb. 2012, 28, 27–38. [Google Scholar]
- García-Nieto, G.E.; Carrizales-Yáñez, L.; Juárez-Santacruz, L.; García, G.E.; Hernández-Acosta, E.; Briones-Corona, E.; Vázquez-Cuencuecha, O.G. Lead and arsenic in the Alto Atoyac sub-basin in Tlaxcala, Mexico. Rev. Chapingo Ser. Cienc. Amb. 2011, 17, 7–17. [Google Scholar]
- Pesce, S.F.; Wunderlin, D.A. Use of water quality indices to verify the impact of Córdoba City (Argentina) on Suquía River. Water Res. 2000, 34, 2915–2926. [Google Scholar] [CrossRef]
- Jonnalagadda, S.B.; Mhere, G. Water quality of the Odzi River in the eastern highlands of Zimbabwe. Water Res. 2001, 35, 2371–2376. [Google Scholar] [CrossRef]
- Sánchez-Santillán, N.; Guzmán, R.S.; Sánchez-Trejo, R.; Ritter, O.W.; Lázaro-Chávez, M.E. La influencia de la oscilación de la temperatura del aire sobre el ecosistema de la Presa de Atlangatepec, Tlaxcala, México. Hidrobiológica 2004, 14, 75–84. [Google Scholar]
- INEGI en Internet. Instituto Nacional de Estadística y Geografía, México. Mapa Digital de México V5. Available online: http://www.inegi.org.mx (accessed on 5 February 2014).
- SEMARNAT. Sistema de Seguridad de Presas. Available online: http://201.116.60.136/inventario/tcapacidades_vaso.aspx?DSP,3639 (accessed on 24 April 2014).
- Instituto Nacional de Ecología. Análisis de la Información Hidrológica y de la Calidad del Agua Para el Intercambio de Aguas Claras por Aguas Residuales en la Región de Valsequillo., Puebla y Formulación de los Términos de Referencia Para el Distrito de Prevención y Control de la Contaminación del Agua del Río Atoyac; (in Spanish). Instituto Nacional de Ecología, Secretaría de Desarrollo Urbano y Ecología: México D.F., México; pp. 6–22.
- APHA-AWWA-WEF. Standard Methods for the Examination of Water and Wastewater, 21st ed.; American Public Health Association/American Water Works Association/Water Environment Federation: Washington, DC, USA, 2005. [Google Scholar]
- NMX-AA-072-SCFI-2001. Análisis de Agua—Determinación de Dureza Total en Aguas Naturales, Residuales y Residuales Tratadas—Método de Prueba; (in Spanish). Secretaría de Economía, Diario Oficial de la Federación: México D.F., México, 2001; pp. 1–14.
- Massoud, M.A. Assessment of water quality along a recreational section of the Damour River in Lebanon using the water quality index. Environ. Monit. Assess. 2012, 184, 4151–4160. [Google Scholar] [CrossRef]
- Criterios Ecológicos de Calidad del Agua CE-CCA-001/89; Secretaría de Desarrollo Urbano y Ecología, Diario Oficial de la Federación: México D.F., México, 1989; pp. 7–23.
- Yamada, Y.; Mito, Y.; Nakashima, S. Organic pollution in dammed river water in a low-precipitation region of Japan. Limnology 2010, 11, 267–272. [Google Scholar]
- Sandoval, V.A.M.; Pulido, F.G.; Monks, S.; Gordillo, M.A.J.; Villegas, V.E.C. Evaluación fisicoquímica, microbiológica y toxicológica de la degradación ambiental del Río Atoyac, México. Interciencia 2009, 34, 880–887. [Google Scholar]
- USGS Science for a Changing World. Available online: http://water.usgs.gov/owq/hardness-alkalinity.html (accessed on 27 January 2014).
- Chapman, D.; Kimstach, V. Selection of Water Quality Variables. In Water Quality Assessments—A Guide to Use of Biota, Sediments and Water in Environmental Monitoring; Chapman, D., Ed.; United Nations Educational, Scientific and Cultural Organization/World Health Organization/United Nations Environment Programme, E&FN Spon: London, UK, 1992; pp. 74–86. [Google Scholar]
- Bilotta, G.S.; Brazier, R.E. Understanding the influence of suspended solids on water quality and aquatic biota. Water Res. 2008, 42, 2849–2861. [Google Scholar] [CrossRef]
- Soares, M.C.S.; Marinho, M.M.; Azevedo, S.M.F.O.; Branco, C.W.C. Eutrophication and retention time affecting spatial heterogeneity in a tropical reservoir. Limnologica 2012, 197–203. [Google Scholar]
- Gordon, J.A.; Higgins, J.M. Fundamental Water Quality Processes. In Energy Production and Reservoir Water Quality: A Guide to the Regulatory, Technical, and Theoretical Basis for Required Studies; Martin, J., Edinger, J., Higgins, J., Gordon, J., Eds.; American Society of Civil Engineers: Reston, VA, USA, 2007. [Google Scholar]
- Kennedy, H.R.; Walker, W.W. Reservoir Nutrient Dynamics. In Reservoir Limnology: Ecological Perspectives; Thornton, K.W., Kimmel, B.L., Payne, F.E., Eds.; John Wiley & Sons, Inc.: New York, NY, USA, 1990; pp. 109–131. [Google Scholar]
- Hernández-Fydrych, V.C. Caracterización Física, Química y Microbiológica del Agua de Diversas Zonas del Cauce del Río Zahuapan, Tlaxcala; Licenciatura (Informe Servicio Social), Universidad Autónoma Metropolitana Unidad Xochimilco: México D.F., México, 2012. [Google Scholar]
- Comisión Estatal del Agua de Tlaxcala, Departamento de Normatividad, Laboratorio de Análisis de Calidad del Agua, Río Zahuapan-Diciembre-2011. Available online: http://www.ceat.gob.mx/portal/wp-content/uploads/2012/01/Rio-2011-DIC.pdf (accessed on 2 March 2012).
© 2014 by the authors; licensee MDPI, Basel, Switzerland. This article is an open access article distributed under the terms and conditions of the Creative Commons Attribution license (http://creativecommons.org/licenses/by/3.0/).
Share and Cite
Castilla-Hernández, P.; Del Rocío Torres-Alvarado, M.; Herrera-San Luis, J.A.; Cruz-López, N. Water Quality of a Reservoir and Its Major Tributary Located in East-Central Mexico. Int. J. Environ. Res. Public Health 2014, 11, 6119-6135. https://doi.org/10.3390/ijerph110606119
Castilla-Hernández P, Del Rocío Torres-Alvarado M, Herrera-San Luis JA, Cruz-López N. Water Quality of a Reservoir and Its Major Tributary Located in East-Central Mexico. International Journal of Environmental Research and Public Health. 2014; 11(6):6119-6135. https://doi.org/10.3390/ijerph110606119
Chicago/Turabian StyleCastilla-Hernández, Patricia, María Del Rocío Torres-Alvarado, José Antonio Herrera-San Luis, and Norma Cruz-López. 2014. "Water Quality of a Reservoir and Its Major Tributary Located in East-Central Mexico" International Journal of Environmental Research and Public Health 11, no. 6: 6119-6135. https://doi.org/10.3390/ijerph110606119