Physical Activity and the Perceived Neighbourhood Environment — Looking at the Association the Other Way Around


Abstract
:
1. Introduction
2. Methods
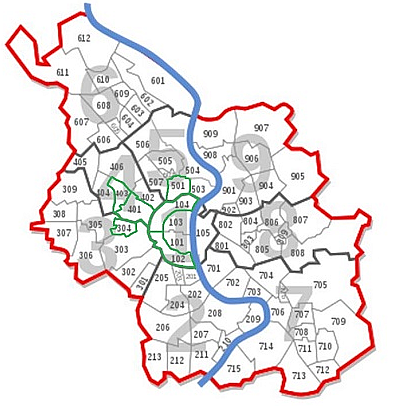
2.1. Study Design

| Characteristics | Cologne | Bickendorf | Braunsfeld | Ehrenfeld | Neustadt-North | Neustadt-South | Nippes |
|---|---|---|---|---|---|---|---|
| Size of city area in km2 | 405.17 | 2.31 | 1.68 | 3.72 | 3.49 | 2.82 | 3.00 |
| Percentage of recreational area in % | 10.4 | 6.7 | 1.2 | 4.3 | 23.1 | 16.0 | 22.6 |
| Inhabitants per km2 | 2557 | 7208 | 6383 | 9684 | 8215 | 13,564 | 11,587 |
| Inhabitants in total | 1,036,117 | 16,632 | 10,697 | 36,008 | 28,665 | 38,296 | 34,705 |
| Female, % | 51.2 | 50.9 | 53.4 | 49.9 | 49.4 | 49.9 | 51.9 |
| Mean age in city district | 41.9 | 40.1 | 43.6 | 39.2 | 41.1 | 38.7 | 40.3 |
| Percentage of people with migration background | 33.8 | 42.6 | 20.5 | 34.3 | 27.4 | 26.7 | 29.0 |
| Percentage of single or double houses in the city district | 59.6 | 54.3 | 39.1 | 17.4 | 9.7 | 7.0 | 24.6 |
| Number of flats | 541,692 | 7940 | 6286 | 20,859 | 19,049 | 24,370 | 19,557 |
| Size of living space per inhabitant | 37.6 | 32.9 | 45.9 | 34.1 | 42.3 | 38.5 | 36.8 |
| Number of cars per 1000 inhabitants from the age of 18 years | 493 | 404 | 580 | 391 | 487 | 353 | 361 |
| Rate of unemployment | 8.6 | 11.7 | 5.0 | 8.9 | 4.8 | 5.8 | 5.8 |

2.2. Study Population
| Characteristics | All | Bickendorf | Braunsfeld | Ehrenfeld | Neustadt-North | Neustadt-South | Nippes | |
|---|---|---|---|---|---|---|---|---|
| All (n) | 470 | 65 | 83 | 90 | 61 | 100 | 71 | |
| Male (n; %) | 222 (47.2) | 30 (46.2) | 41 (49.4) | 45 (50.0) | 30 (49.2) | 41 (41.0) | 35 (49.3) | |
| Female (n; %) | 248 (52.8) | 35 (53.8) | 42 (50.6) | 45 (50.0) | 31 (50.8) | 59 (59.0) | 36 (50.7) | |
| Age (years) | 35.5 ± 13.8 | 40.0 ± 15.7 | 30.6 ± 10.4 | 34.0 ± 11.9 | 33.3 ± 12.7 | 36.2 ± 11.7 | 40.0 ± 18.2 | |
| BMI (kg × m−2) | 23.7 ± 3.2 a | 23.1 ± 3.2 | 23.6 ± 2.9 b | 24.9 ± 4.1 c | 23.5 ± 2.9 d | 23.6 ± 3.1 e | 23.8 ± 2.8 | |
| Educational level (n; %) | ||||||||
| No graduation | 9 (1.9) | 1 (1.5) | 1 (1.2) | 3 (3.3) | 1 (1.6) | 3 (3.0) | - | |
| 10 years | 53 (11.3) | 20 (30.8) | 4 (4.8) | 4 (4.4) | 7 (11.5) | 15 (15.0) | 3 (4.2) | |
| 12 years | 98 (20.9) | 18 (27.7) | 11 (13.3) | 24 (26.7) | 12 (19.7) | 21 (21.0) | 12 (16.9) | |
| 13 years | 158 (33.6) | 16 (24.6) | 42 (50.6) | 28 (31.1) | 19 (31.1) | 26 (26.0) | 27 (38.0) | |
| ≥University degree | 140 (29.8) | 8 (12.3) | 25 (30.1) | 22 (24.4) | 21 (34.4) | 35 (35.0) | 29 (40.8) | |
| Missing values | 12 (2.6) | 2 (3.1) | - | 9 (10.0) | 1 (1.6) | - | - | |
| Income groups household net income/month (n; %) | ||||||||
| <€1000 | 134 (28.5) | 20 (30.8) | 36 (43.4) | 18 (20.0) | 24 (39.3) | 23 (23.0) | 13 (18.3) | |
| €1000–€2000 | 196 (41.7) | 38 (58.5) | 31 (37.3) | 38 (42.2) | 20 (32.8) | 25 (25.0) | 44 (62.0) | |
| >€2000 | 85 (18.1) | 1 (1.5) | 14 (16.9) | 17 (18.9) | 10 (16.4) | 29 (29.0) | 14 (19.7) | |
| Missing values | 55 (11.7) | 6 (9.2) | 2 (2.4) | 17 (18.9) | 7 (11.5) | 23 (23.0) | - | |
2.3. Measurements
2.3.1. Physical Activity
2.3.2. Environmental Variables
2.3.3. Socio-Demographic Variables
2.4. Data Analyses
3. Results
3.1. Descriptive Measures of PA
3.2. Descriptive Measures and Differences in Environmental Perception
| PA Characteristics | All (n = 470) | Bickendorf (n = 65) | Braunsfeld(n = 83) | Ehrenfeld (n = 90) | Neustadt-North (n = 61) | Neustadt-South (n = 100) | Nippes (n = 71) | |
|---|---|---|---|---|---|---|---|---|
| PA in transport and recreation (Mdn) (25th; 75th) | 330 (160; 510) | 300 (130; 450) | 510 (300; 870) | 233 (50; 365) | 240 (120; 405) | 300 (180; 446) | 360 (255; 630) | |
| Low PA in transport and recreation * (Mdn) (25th; 75th) | 165 (80; 240) | 165 (100; 240) | 330 (180; 465) | 50 (25; 123) | 120 (12; 180) | 180 (110; 250) | 263 (150; 320) | |
| High PA in transport and recreation ** (Mdn) (25th; 75th) | 510 (420; 740) | 460 (383; 570) | 870 (603; 1425) | 360 (328; 550) | 450 (360; 537) | 450 (390; 720) | 630 (480; 840) | |
| PA Median Split Groups | x ± s | PA Quartile Groups | x ± s |
|---|---|---|---|
| Density score | |||
| All | 1.0 ± 0.27 | ||
| Low PA | 0.99 ± 0.25 | 1st quartile | 1.01 ± 0.26 |
| High PA | 1.01 ± 0.29 | 4th quartile | 1.01 ± 0.31 |
| Ratio † | 1.02 | Ratio †† | 1.00 |
| Distance score | |||
| All | 1.0 ± 0.10 | ||
| Low PA | 0.98 ± 0.08 | 1st quartile | 0.96 ± 0.08 |
| High PA | 1.03 ± 0.10 | 4th quartile | 1.04 ± 0.10 |
| Ratio † | 1.05 *** | Ratio †† | 1.08 *** |
| Availability of sidewalks | |||
| All | 1.0 ± 0.17 | ||
| Low PA | 0.99 ± 0.16 | 1st quartile | 0.98 ± 0.16 |
| High PA | 1.01 ± 0.18 | 4th quartile | 1.03 ± 0.19 |
| Ratio † | 1.02 | Ratio †† | 1.05 |
| Availability of bike lanes | |||
| All | 1.0 ± 0.23 | ||
| Low PA | 0.96 ± 0.22 | 1st quartile | 0.96 ± 0.22 |
| High PA | 1.03 ± 0.25 | 4th quartile | 1.07 ± 0.25 |
| Ratio † | 1.07 ** | Ratio †† | 1.11 ** |
| Availability of infrastructure | |||
| All | 1.0 ± 0.15 | ||
| Low PA | 0.98 ± 0.14 | 1st quartile | 0.97 ± 0.13 |
| High PA | 1.02 ± 0.17 | 4th quartile | 1.05 ± 0.18 |
| Ratio † | 1.04 ** | Ratio †† | 1.08 *** |
| Maintenance of infrastructure | |||
| All | 1.0 ± 0.18 | ||
| Low PA | 0.99 ± 0.17 | 1st quartile | 0.97 ± 0.18 |
| High PA | 1.01 ± 0.19 | 4th quartile | 1.01 ± 0.21 |
| Ratio † | 1.02 | Ratio †† | 1.04 |
| Total safety | |||
| All | 1.0 ± 0.15 | ||
| Low PA | 1.0 ± 0.15 | 1st quartile | 0.99 ± 0.15 |
| High PA | 0.99 ± 0.15 | 4th quartile | 0.99 ± 0.16 |
| Ratio † | 0.99 | Ratio †† | 1.00 |
| Safety crime | |||
| All | 1.0 ± 0.17 | ||
| Low PA | 1.0 ± 0.18 | 1st quartile | 0.99 ± 0.19 |
| High PA | 1.0 ± 0.17 | 4th quartile | 1.0 ± 0.18 |
| Ratio † | 1.00 | Ratio †† | 1.01 |
| Safety traffic | |||
| All | 1.0 ± 0.19 | ||
| Low PA | 1.0 ± 0.18 | 1st quartile | 1.0 ± 0.19 |
| High PA | 0.99 ± 0.19 | 4th quartile | 0.98 ± 0.20 |
| Ratio † | 0.99 | Ratio †† | 0.98 |
| Pleasure | |||
| All | 1.0 ± 0.16 | ||
| Low PA | 1.01 ± 0.16 | 1st quartile | 1.0 ± 0.17 |
| High PA | 0.99 ± 0.17 | 4th quartile | 0.98 ± 0.18 |
| Ratio † | 0.99 | Ratio †† | 0.98 |
| Aesthetics | |||
| All | 1.0 ± 0.17 | ||
| Low PA | 1.02 ± 0.16 | 1st quartile | 1.0 ± 0.17 |
| High PA | 0.99 ± 0.17 | 4th quartile | 0.98 ± 0.18 |
| Ratio † | 0.97 | Ratio †† | 0.98 |
| Network | |||
| All | 1.0 ± 0.15 | ||
| Low PA | 0.97 ± 0.15 | 1st quartile | 0.95 ± 0.15 |
| High PA | 1.03 ± 0.15 | 4th quartile | 1.04 ± 0.15 |
| Ratio † | 1.06 *** | Ratio †† | 1.09 *** |
| Connectivity | |||
| All | 1.0 ± 0.16 | ||
| Low PA | 0.97 ± 0.16 | 1st quartile | 0.95 ± 0.17 |
| High PA | 1.03 ± 0.16 | 4th quartile | 1.04 ± 0.17 |
| Ratio † | 1.06 *** | Ratio †† | 1.09 *** |
| Home | |||
| All | 1.0 ± 0.41 | ||
| Low PA | 0.94 ± 0.40 | 1st quartile | 0.89 ± 0.37 |
| High PA | 1.06 ± 0.42 | 4th quartile | 1.15 ± 0.43 |
| Ratio † | 1.13 ** | Ratio †† | 1.29 *** |
| Work/Study | |||
| All | 0.97 ± 0.42 | ||
| Low PA | 0.90 ± 0.38 | 1st quartile | 0.89 ± 0.40 |
| High PA | 1.04 ± 0.45 | 4th quartile | 1.07 ± 0.49 |
| Ratio † | 1.16 ** | Ratio †† | 1.20 ** |
| PA median split groups | Bickendorf (n = 65) | Braunsfeld (n = 83) | Ehrenfeld (n = 90) | Neustadt-North (n = 61) | Neustadt-South (n = 100) | Nippes (n = 71) |
|---|---|---|---|---|---|---|
| Density score | ||||||
| All | 193.0 ± 38.1 | 188.4 ± 51.0 | 177.0 ± 47.4 | 126.0 ± 33.9 | 164.8 ± 47.0 | 173.1 ± 51.7 |
| Low PA | 192.2 ± 39.6 | 201.6 ± 45.2 | 162.4 ± 39.3 | 115.3 ± 14.7 | 173.0 ± 48.4 | 172.0 ± 53.3 |
| High PA | 193.9 ± 36.8 | 175.0 ± 53.6 | 191.6 ± 50.5 | 138.6 ± 44.6 | 155.5 ± 44.1 | 174.2 ± 50.8 |
| Ratio † | 1.01 | 0.87 * | 1.18 ** | 1.20 ** | 0.90 | 1.01 |
| Distance score | ||||||
| All | 24.4 ± 2.3 | 34.0 ± 3.4 | 31.2 ± 4.2 | 33.4 ± 2.8 | 36.8 ± 2.0 | 36.1 ± 3.3 |
| Low PA | 24.0 ± 2.3 | 33.3 ± 3.6 | 29.0 ± 2.4 | 32.4 ± 2.4 | 36.8 ± 1.6 | 35.7 ± 3.2 |
| High PA | 25.0 ± 2.2 | 34.4 ± 3.2 | 33.4 ± 4.4 | 34.6 ± 2.9 | 36.7 ± 2.4 | 36.5 ± 3.3 |
| Ratio † | 1.04 | 1.03 | 1.15 *** | 1.07 ** | 1.00 | 1.02 |
| Availability of sidewalks | ||||||
| All | 5.9 ± 1.0 | 6.0 ± 1.0 | 6.1 ± 1.2 | 5.7 ± 0.9 | 6.6 ± 0.9 | 6.0 ± 1.2 |
| Low PA | 5.9 ± 1.2 | 5.7 ± 0.7 | 6.2 ± 1.2 | 5.7 ± 0.9 | 6.6 ± 0.8 | 5.9 ± 1.0 |
| High PA | 5.9 ± 0.8 | 6.3 ± 1.1 | 6.0 ± 1.1 | 5.8 ± 1.0 | 6.6 ± 1.0 | 6.1 ± 1.3 |
| Ratio † | 1.00 | 1.11 * | 0.97 | 1.02 | 1.00 | 1.03 |
| Availability of bike lanes | ||||||
| All | 4.4 ± 1.3 | 6.0 ± 1.3 | 5.8 ± 1.3 | 4.7 ± 1.4 | 5.9 ± 1.0 | 5.6 ± 1.3 |
| Low PA | 4.3 ± 1.3 | 5.6 ± 1.2 | 5.5 ± 1.2 | 4.3 ± 1.1 | 6.0 ± 0.7 | 5.5 ± 1.4 |
| High PA | 4.6 ± 1.3 | 6.3 ± 1.4 | 6.0 ± 1.3 | 5.1 ± 1.5 | 5.8 ± 1.3 | 5.7 ± 1.1 |
| Ratio † | 1.07 | 1.13 * | 1.09 * | 1.19 * | 0.97 | 1.03 |
| Availability of infrastructure | ||||||
| All | 10.3 ± 1.5 | 12.0 ± 1.9 | 11.9 ± 1.9 | 10.4 ± 1.8 | 12.5 ± 1.5 | 11.6 ± 2.0 |
| Low PA | 10.1 ± 1.3 | 11.4 ± 1.5 | 11.8 ± 1.7 | 10.0 ± 1.4 | 12.5 ± 1.2 | 11.4 ± 2.1 |
| High PA | 10.5 ± 1.6 | 12.6 ± 1.9 | 12.0 ± 2.0 | 10.9 ± 2.2 | 12.3 ± 1.7 | 11.8 ± 1.9 |
| Ratio † | 1.04 | 1.11 ** | 1.02 | 1.09 | 0.98 | 1.04 |
| Maintenance of infrastructure | ||||||
| All | 9.0 ± 1.4 | 8.3 ± 1.6 | 7.3 ± 1.7 | 8.2 ± 1.6 | 8.9 ± 1.3 | 8.7 ± 1.4 |
| Low PA | 9.1 ± 1.3 | 8.6 ± 1.5 | 6.7 ± 1.4 | 8.0 ± 1.6 | 9.1 ± 0.9 | 8.4 ± 1.5 |
| High PA | 8.7 ± 1.5 | 8.1 ± 1.8 | 7.9 ± 1.7 | 8.4 ± 1.6 | 8.7 ± 1.5 | 9.0 ± 1.3 |
| Ratio † | 0.96 | 0.94 | 1.18 *** | 1.05 | 0.96 | 1.07 |
| Total safety | ||||||
| All | 15.9 ± 2.0 | 20.1 ± 3.3 | 17.7 ± 2.5 | 17.3 ± 2.4 | 18.2 ± 2.4 | 17.3 ± 3.2 |
| Low PA | 15.8 ± 2.3 | 20.4 ± 3.4 | 17.1 ± 2.2 | 16.8 ± 1.7 | 18.8 ± 2.5 | 17.7 ± 3.3 |
| High PA | 15.9 ± 1.7 | 19.7 ± 3.2 | 18.3 ± 2.7 | 17.8 ± 2.9 | 17.5 ± 2.3 | 16.8 ± 3.1 |
| Ratio † | 1.01 | 0.97 | 1.07 * | 1.06 | 0.93 * | 0.95 |
| Safety, crime | ||||||
| All | 8.7 ± 1.4 | 10.2 ± 1.5 | 8.8 ± 1.5 | 8.2 ± 1.3 | 9.2 ± 1.6 | 8.5 ± 2.0 |
| Low PA | 8.6 ± 1.5 | 10.4 ± 1.5 | 8.6 ± 1.5 | 7.8 ± 1.0 | 9.6 ± 1.5 | 8.8 ± 2.2 |
| High PA | 8.9 ± 1.2 | 10.0 ± 1.5 | 9.0 ± 1.5 | 8.7 ± 1.5 | 8.7 ± 1.6 | 8.3 ± 1.7 |
| Ratio † | 1.03 | 0.96 | 1.05 | 1.12 ** | 0.91 * | 0.94 |
| Safety, traffic | ||||||
| All | 7.2 ± 1.6 | 9.9 ± 2.0 | 8.9 ± 1.7 | 9.0 ± 1.6 | 9.0 ± 1.3 | 8.7 ± 1.8 |
| Low PA | 7.3 ± 1.6 | 10.0 ± 2.1 | 8.5 ± 1.5 | 9.0 ± 1.4 | 9.1 ± 1.4 | 9.0 ± 1.7 |
| High PA | 7.0 ± 1.7 | 9.7 ± 2.0 | 9.3 ± 1.7 | 9.1 ± 1.8 | 8.8 ± 1.0 | 8.5 ± 2.0 |
| Ratio † | 1.04 | 0.97 | 1.09 * | 1.01 | 0.97 | 0.94 |
| Pleasure | ||||||
| All | 9.5 ± 2.0 | 12.7 ± 2.0 | 10.4 ± 1.9 | 12.1 ± 1.4 | 12.1 ± 1.4 | 11.2 ± 2.0 |
| Low PA | 9.6 ± 1.9 | 12.8 ± 1.8 | 10.3 ± 2.1 | 12.3 ± 1.3 | 12.6 ± 1.2 | 11.2 ± 2.0 |
| High PA | 9.5 ± 2.2 | 12.6 ± 2.2 | 10.5 ± 1.7 | 11.9 ± 1.6 | 11.6 ± 1.5 | 11.1 ± 2.1 |
| Ratio † | 0.99 | 0.98 | 1.02 | 0.97 | 0.92 *** | 0.99 |
| Aesthetics | ||||||
| All | 7.1 ± 1.4 | 9.5 ± 1.5 | 8.2 ± 1.6 | 9.2 ± 1.1 | 9.1 ± 1.2 | 8.6 ± 1.5 |
| Low PA | 7.1 ± 1.3 | 9.5 ± 1.4 | 8.3 ± 1.7 | 9.3 ± 1.1 | 9.6 ± 0.9 | 8.6 ± 1.5 |
| High PA | 7.1 ± 1.5 | 9.6 ± 1.6 | 8.2 ± 1.5 | 9.1 ± 1.1 | 8.6 ± 1.2 | 8.6 ± 1.6 |
| Ratio † | 1.00 | 1.01 | 0.99 | 0.98 | 0.90 *** | 1.00 |
| Network | ||||||
| All | 12.3 ± 1.9 | 11.8 ± 1.9 | 11.5 ± 1.9 | 12.2 ± 1.6 | 11.6 ± 1.7 | 11.9 ± 1.9 |
| Low PA | 12.3 ± 2.0 | 11.1 ± 1.6 | 11.1 ± 1.7 | 12.1 ± 1.6 | 11.2 ± 1.7 | 11.6 ± 2.0 |
| High PA | 12.3 ± 1.8 | 12.5 ± 1.9 | 11.9 ± 2.0 | 12.4 ± 1.6 | 12.0 ± 1.6 | 12.2 ± 1.8 |
| Ratio † | 1.00 | 1.13 ** | 1.07 * | 1.02 | 1.07 * | 1.05 |
| Connectivity | ||||||
| All | 9.0 ± 1.5 | 8.8 ± 1.4 | 8.4 ± 1.6 | 8.8 ± 1.3 | 8.8 ± 1.2 | 8.7 ± 1.5 |
| Low PA | 8.9 ± 1.6 | 8.5 ± 1.2 | 8.0 ± 1.6 | 8.6 ± 1.4 | 8.7 ± 1.1 | 8.5 ± 1.6 |
| High PA | 9.3 ± 1.4 | 9.1 ± 1.6 | 8.8 ± 1.6 | 9.1 ± 1.2 | 9.0 ± 1.2 | 9.0 ± 1.4 |
| Ratio † | 1.04 | 1.12 * | 1.10 * | 1.06 | 1.03 | 1.06 |
| Home | ||||||
| All | 2.8 ± 0.8 | 3.1 ± 1.0 | 2.9 ± 1.1 | 2.2 ± 1.1 | 2.2 ± 0.9 | 2.4 ± 1.3 |
| Low PA | 2.6 ± 0.7 | 2.9 ± 1.0 | 3.0 ± 1.2 | 1.9 ± 0.9 | 2.0 ± 1.0 | 2.3 ± 1.2 |
| High PA | 3.0 ± 0.9 | 3.3 ± 0.9 | 2.8 ± 1.0 | 2.6 ± 1.2 | 2.3 ± 0.9 | 2.5 ± 1.3 |
| Ratio † | 1.15 | 1.14 | 0.93 | 1.37 ** | 1.15 | 1.09 |
| Work/Study | ||||||
| All | 3.2 ± 1.3 | 5.4 ± 2.3 | 3.6 ± 1.5 | 3.0 ± 1.5 | 3.5 ± 1.7 | 4.2 ± 1.5 |
| Low PA | 3.4 ± 1.5 | 4.7 ± 2.1 | 3.2 ± 1.2 | 2.8 ± 1.4 | 3.5 ± 1.6 | 3.5 ± 0.8 |
| High PA | 3.0 ± 1.0 | 6.1 ± 2.3 | 4.0 ± 1.7 | 3.3 ± 1.5 | 3.5 ± 1.9 | 4.7 ± 1.7 |
| Ratio † | 0.88 | 1.30 ** | 1.25 * | 1.18 | 1.00 | 1.34 ** |
3.3. Multiple Regression Analyses for the Dependent Variables of Environmental Perception
| Themes of Neighbourhood | Relative Values for All (n1 = 407; n2 = 338) | Bickendorf (n1 = 59; n2 = 50) | Braunsfeld (n1 = 81; n2 = 70) | Ehrenfeld (n1 = 66; n2 = 62) | Neustadt-North (n1 = 53; n2 = 45) | Neustadt-South (n1 = 77; n2 = 57) | Nippes (n1 = 71; n2 = 54) |
|---|---|---|---|---|---|---|---|
| Density score | R2 = 0.01 | R2 = 0.04 | Sex (−0.20) * PA (−0.40) *** R2 = 0.25 | Sex (−0.35) ** PA (0.33) ** R2 = 0.23 | R2 = 0.10 | Age (−0.27) * PA (−0.46) *** R2 = 0.31 | R2 = 0.04 |
| Distance score | Inc (−0.11) * PA (0.16) ** R2 = 0.06 | R2 = 0.04 | R2 = 0.11 | PA (0.25) * R2 = 0.17 | R2 = 0.14 | Edu (0.33) *, Inc (−0.31) * R2 = 0.11 | R2 = 0.07 |
| Availability of sidewalks | PA (0.15) ** R2 = 0.02 | R2 = 0.15 | PA (0.30) * R2 = 0.11 | Sex (0.31) * R2 = 0.14 | R2 = 0.05 | Edu (−0.34) * R2 = 0.08 | PA (0.25) * R2 = 0.17 |
| Maintenance of infrastructure | R2 = 0.01 | R2 = 0.04 | R2 = 0.04 | PA (0.44) ** R2 = 0.20 | R2 = 0.10 | PA (−0.38) ** R2 = 0.23 | R2 = 0.05 |
| Availability of bike lanes | PA (0.15) ** R2 = 0.04 | Sex (−0.31) * R2 = 0.14 | PA (0.29) * R2 = 0.15 | PA (0.30) * R2 = 0.12 | R2 = 0.11 | PA (−0.29) * R2 = 0.13 | PA (0.31) * R2 = 0.12 |
| Availability of infrastructure | Age (0.10) * PA (0.19) *** R2 = 0.05 | Sex (−0.35) * R2 = 0.16 | PA (0.37) ** R2 = 0.20 | R2 = 0.14 | R2 = 0.10 | R2 = 0.07 | PA (0.34) * R2 = 0.18 |
| Total safety | Age (−0.14) ** R2 = 0.03 | Inc (−043) ** R2 = 0.19 | PA (−0.27) * R2 = 0.12 | PA (0.37) ** R2 = 0.16 | PA (0.33) * R2 = 0.15 | Age (−0.42) ** R2 = 0.22 | Age (−0.13) R2 = 0.10 |
| Safety, crime | Age (−0.13) * R2 = 0.04 | R2 = 0.12 | R2 = 0.13 | PA (0.30) * R2 = 0.13 | PA (0.35) * R2 = 0.13 | Age (−0.32) * R2 = 0.16 | R2 = 0.11 |
| Safety, traffic | R2 = 0.01 | Inc (−0.33) * R2 = 0.13 | PA (−0.27) * R2 = 0.11 | PA (0.29) * R2 = 0.08 | Inc (0.34) * R2 = 0.15 | Age (−0.37) ** R2 = 0.14 | R2 = 0.10 |
| Pleasure | R2 = 0.01 | R2 = 0.09 | R2 = 0.07 | R2 = 0.02 | R2 = 0.08 | PA (−0.30) * R2 = 0.10 | R2 = 0.07 |
| Aesthetics | PA (−0.12) * R2 = 0.02 | R2 = 0.08 | R2 = 0.08 | R2 = 0.00 | Sex (−0.30) * R2 = 0.11 | PA (−0.35) ** R2 = 0.13 | R2 = 0.09 |
| Network | PA (0.14) ** R2 = 0.03 | R2 = 0.06 | PA (0.26) * R2 = 0.11 | Inc (−0.26) * R2 = 0.09 | R2 = 0.12 | Age (0.29) * R2 = 0.15 | PA (0.24) * R2 = 0.16 |
| Connectivity | PA (0.13) * R2 = 0.03 | R2 = 0.07 | R2 = 0.09 | Inc (−0.28) * R2 = 0.10 | PA (0.33) * R2 = 0.13 | R2 = 0.10 | R2 = 0.16 |
| Home | Edu (0.15) ** Inc (−0.12) * PA (0.16) ** R2 = 0.06 | Sex (−0.32) * PA (0.29) * R2 = 0.21 | R2 = 0.04 | Sex (0.31) * R2 = 0.11 | Edu (0.32) * R2 = 0.23 | PA (0.26) * R2 = 0.08 | PA (0.32) ** R2 = 0.17 |
| Work/Study | Inc (−0.32) *** PA (0.20) *** R2 = 0.16 | R2 = 0.06 | Sex (−0.26) * Inc (−0.53) *** PA (0.27) ** R2 = 0.46 | Inc (−0.37) ** R2 = 0.19 | Sex (0.31) * PA (0.49) ** R2 = 0.23 | Inc (−0.42) ** R2 = 0.18 | PA (0.35) * R2 = 0.23 |
4. Discussion
Limitations and Strengths
5. Conclusions
Acknowledgements
Author Contributions
Conflicts of Interest
References
- Global Status Report on Non Communicable Disease 2010; World Health Organisation: Geneva, Switzerland, 2011.
- Sallis, J.F.; Bowles, H.R.; Bauman, A.; Ainsworth, B.E.; Bull, F.C.; Craig, C.L.; Sjostrom, M.; de Bourdeaudhuij, I.; Lefevre, J.; Matsudo, V.; et al. Neighborhood environments and physical activity among adults in 11 countries. Amer. J. Prev. Med. 2009, 36, 484–490. [Google Scholar]
- Duncan, M.J.; Spence, J.C.; Mummery, W.K. Perceived environment and physical activity: A meta-analysis of selected environmental characteristics. Int J. Behav Nutr Phys. Act. 2005, 2. [Google Scholar] [CrossRef]
- Sallis, J.F.; Cervero, R.B.; Ascher, W.; Henderson, K.A.; Kraft, M.K.; Kerr, J. An ecological approach to creating active living communities. Annu. Rev. Public Health 2006, 27, 297–322. [Google Scholar] [CrossRef] [PubMed]
- Bauman, A.E.; Reis, R.S.; Sallis, J.F.; Wells, J.C.; Loos, R.J.F.; Martin, B.W. Correlates of physical activity: Why are some people physically active and others not? Lancet 2012, 380, 258–271. [Google Scholar] [CrossRef] [PubMed]
- Van Holle, V.; Deforche, B.; van Cauwenberg, J.; Goubert, L.; Maes, L.; van de Weghe, N.; de Bourdeaudhuij, I. Relationship between the physical environment and different domains of physical activity in european adults: A systematic review. BMC Public Health 2012, 12. [Google Scholar] [CrossRef] [Green Version]
- Humpel, N.; Marshall, A.L.; Leslie, E.; Bauman, A.; Owen, N. Changes in neighborhood walking are related to changes in perceptions of environmental attributes. Ann. Behav. Med. 2004, 27, 60–67. [Google Scholar] [CrossRef] [PubMed]
- Wallmann, B.; Spittaels, H.; de Bourdeaudhuij, I.; Froboese, I. The perception of the neighborhood environment changes after participation in a pedometer based community intervention. Int. J. Behav. Nutr. Phys. Act. 2012, 9. [Google Scholar] [CrossRef] [Green Version]
- Ries, A.V.; Dunsiger, S.; Marcus, B.H. Physical activity interventions and changes in perceived home and facility environments. Prev. Med. 2009, 49, 515–517. [Google Scholar] [CrossRef] [PubMed]
- Oberbürgermeister, D. Kölner Stadtteilinformationen—Zahlen. 2011. Available online: http://www.stadt-koeln.de/mediaasset/content/pdf15/stadtteilinformationen_2011.pdf (accessed on 6 August 2014).
- Koelngliederung.svg. Available online: http://commons.wikimedia.org/wiki/File%3AKoelngliederung.svg (accessed on 4 August 2014).
- World Health Organization. Global Physical Activity Questionnaire (GPAQ) Analysis Guide. Available online: http://www.who.int/entity/chp/steps/resources/GPAQ_Analysis_Guide.pdf (accessed on 4 August 2014).
- Armstrong, T.; Bull, F. Development of the world health organization global physical activity questionnaire (GPAQ). J. Public Health 2006, 14, 66–70. [Google Scholar] [CrossRef]
- World Health Organization. WHO Steps Analysis Programs. Available online: http://www.who.int/chp/steps/resources/database/en/ (accessed on 4 August 2014).
- Bull, F.C.; Maslin, T.S.; Armstrong, T. Global physical activity questionnaire (GPAQ): Nine country reliability and validity study. J. Phys. Act. Health 2009, 6, 790–804. [Google Scholar] [PubMed]
- Spittaels, H.; Foster, C.; Oppert, J.-M.; Rutter, H.; Oja, P.; Sjöström, M.; De Bourdeaudhuij, I. Assessment of environmental correlates of physical activity: Development of a european questionnaire. Int. J. Behav. Nutr. Phys. Act. 2009, 6. [Google Scholar] [CrossRef] [Green Version]
- Spittaels, H.; Verloigne, M.; Gidlow, C.; Gloanec, J.; Titze, S.; Foster, C.; Oppert, J.-M.; Rutter, H.; Oja, P.; Sjostrom, M.; et al. Measuring physical activity-related environmental factors: Reliability and predictive validity of the european environmental questionnaire alpha. Int. J. Behav. Nutr. Phys. Act. 2010, 7. [Google Scholar] [CrossRef] [Green Version]
- Bucksch, J.; Spittaels, H. Reliability and validity findings of the alpha environmental questionnaire in germany. J. Public Health 2011, 19, 417–423. [Google Scholar] [CrossRef]
- Cerin, E. Statistical approaches to testing the relationships of the built environment with resident-level physical activity behavior and health outcomes in cross-sectional studies with cluster sampling. J. Plan. Lit. 2011, 26, 151–167. [Google Scholar] [CrossRef]
- Frank, L.; Kavage, S. A national plan for physical activity: The enabling role of the built environment. J. Phys. Act. Health 2009, 6, S186–S195. [Google Scholar] [PubMed]
- Gebel, K.; Bauman, A.E.; Sugiyama, T.; Owen, N. Mismatch between perceived and objectively assessed neighborhood walkability attributes: Prospective relationships with walking and weight gain. Health Place 2011, 17, 519–524. [Google Scholar] [CrossRef] [PubMed]
- Humpel, N.; Owen, N.; Leslie, E. Environmental factors associated with adults’ participation in physical activity: A review. Amer. J. Prev. Med. 2002, 22, 188–199. [Google Scholar] [CrossRef]
- Williams, C.H. The Built Environment and Physical Activity: What is the Relationship? The Robert Wood Johnson Foundation: Princeton, NJ, USA, 2007. [Google Scholar]
- Tucker-Seeley, R.D.; Subramanian, S.V.; Li, Y.; Sorensen, G. Neighborhood safety, socioeconomic status, and physical activity in older adults. Amer. J. Prev. Med. 2009, 37, 207–213. [Google Scholar] [CrossRef]
- Giles-Corti, B.; Timperio, A.; Cutt, H.; Pikora, T.J.; Bull, F.C.; Knuiman, M.; Bulsara, M.; van Niel, K.; Shilton, T. Development of a reliable measure of walking within and outside the local neighborhood: Reside’s neighborhood physical activity questionnaire. Prev. Med. 2006, 42, 455–459. [Google Scholar] [CrossRef] [PubMed]
- Giles-Corti, B.; Timperio, A.; Bull, F.; Pikora, T. Understanding physical activity environmental correlates: Increased specificity for ecological models. Exerc. Sport Sci. Rev. 2005, 33, 175–181. [Google Scholar] [CrossRef] [PubMed]
© 2014 by the authors; licensee MDPI, Basel, Switzerland. This article is an open access article distributed under the terms and conditions of the Creative Commons Attribution license (http://creativecommons.org/licenses/by/3.0/).
Share and Cite
Wallmann-Sperlich, B.; Froboese, I.; Schantz, P. Physical Activity and the Perceived Neighbourhood Environment — Looking at the Association the Other Way Around. Int. J. Environ. Res. Public Health 2014, 11, 8093-8111. https://doi.org/10.3390/ijerph110808093
Wallmann-Sperlich B, Froboese I, Schantz P. Physical Activity and the Perceived Neighbourhood Environment — Looking at the Association the Other Way Around. International Journal of Environmental Research and Public Health. 2014; 11(8):8093-8111. https://doi.org/10.3390/ijerph110808093
Chicago/Turabian StyleWallmann-Sperlich, Birgit, Ingo Froboese, and Peter Schantz. 2014. "Physical Activity and the Perceived Neighbourhood Environment — Looking at the Association the Other Way Around" International Journal of Environmental Research and Public Health 11, no. 8: 8093-8111. https://doi.org/10.3390/ijerph110808093
APA StyleWallmann-Sperlich, B., Froboese, I., & Schantz, P. (2014). Physical Activity and the Perceived Neighbourhood Environment — Looking at the Association the Other Way Around. International Journal of Environmental Research and Public Health, 11(8), 8093-8111. https://doi.org/10.3390/ijerph110808093