Article

Study on an Air Quality Evaluation Model for Beijing City Under Haze-Fog Pollution Based on New Ambient Air Quality Standards

Shenzhen Graduate School, Harbin Institute of Technology, Shenzhen 518055, China
*
Author to whom correspondence should be addressed.
Int. J. Environ. Res. Public Health 2014, 11(9), 8909-8923; https://doi.org/10.3390/ijerph110908909
Submission received: 24 July 2014 / Revised: 22 August 2014 / Accepted: 25 August 2014 / Published: 28 August 2014
(This article belongs to the Special Issue Air Pollution Modeling)

Abstract

:
Since 2012, China has been facing haze-fog weather conditions, and haze-fog pollution and PM2.5 have become hot topics. It is very necessary to evaluate and analyze the ecological status of the air environment of China, which is of great significance for environmental protection measures. In this study the current situation of haze-fog pollution in China was analyzed first, and the new Ambient Air Quality Standards were introduced. For the issue of air quality evaluation, a comprehensive evaluation model based on an entropy weighting method and nearest neighbor method was developed. The entropy weighting method was used to determine the weights of indicators, and the nearest neighbor method was utilized to evaluate the air quality levels. Then the comprehensive evaluation model was applied into the practical evaluation problems of air quality in Beijing to analyze the haze-fog pollution. Two simulation experiments were implemented in this study. One experiment included the indicator of PM2.5 and was carried out based on the new Ambient Air Quality Standards (GB 3095-2012); the other experiment excluded PM2.5 and was carried out based on the old Ambient Air Quality Standards (GB 3095-1996). Their results were compared, and the simulation results showed that PM2.5 was an important indicator for air quality and the evaluation results of the new Air Quality Standards were more scientific than the old ones. The haze-fog pollution situation in Beijing City was also analyzed based on these results, and the corresponding management measures were suggested.

1. Introduction

With the development of modern industry, industrial equipment and transportation vehicles consume lots of resources and discharge more and more pollutants, and as a result, the atmospheric environment is polluted seriously. Thus the progress of human society is at the expense of the environment [1]. In recent years, areas with polluted air frequently suffer from haze-fog weather conditions in autumn and winter. Especially, in the winter of 2012, a large-scale emergence of haze-fog weather affected the mid-east areas of China, and PM2.5, which is one of the key pollution factors in the air environment, became a hot topic in China [2]. As a result the atmospheric environment in China was very harsh, and human health and transportation were seriously affected. The data of the Ministry of Environmental Protection showed that there was large-scale haze-fog pollution in Northeast China, Northwest China, North China, Eastern China and Central China [3,4]. The wide range of haze-fog weather triggered a series of chain reactions, including transportation restrictions, flight delays and increased numbers of patients, etc., and people’s life was severely affected [5,6]. In order to protect and improve the living environment and quantitatively analyze the atmospheric environment pollution, new ambient air quality standards were formulated by the Ministry of Environmental Protection [7]. As a result, the “Air Quality Index” (AQI) was introduced to replace the old “Air Pollution Index” (API), and the “Technical Regulations on Ambient Air Quality Index (Trial) (HJ 633-2012)” [8] were published to calculate the AQI.
The severe haze-fog pollution situation has attracted serious concern of academic researchers. Numerous studies have been conducted to investigate the composition, sources, and chemical reactions of the haze-fog pollution in China [9,10,11]. Some scholars claimed the haze-fog pollution was usually accompanied with aerosol concentrations in the atmospheric environment, and had significant impacts on the air quality, human health and visibility [12,13,14]. The formation of haze-fog was very closely linked to atmospheric and meteorological conditions [15,16]. Zhao et al. argued that the main source of haze-fog in winter was anthropogenic emissions on a regional scale [17]. Che et al. investigated the optical characteristics of the aerosols of haze-fog [18], and Zhang et al. analyzed the main chemical components of the aerosols [19]. Wang et al. simulated the severe winter of 2013 regional hazes in East Asia and northern China based on simulation models [20].
In order to deal with the haze-fog pollution, the degree of haze-fog pollution should be known first. In this study the ambient air quality was evaluated to investigate the status of haze-fog. Evaluation of ambient air quality is an important part of any atmospheric ecology studies. The assessment of environmental air quality is the process of quantitative description of the ambient air quality by mathematical methods and models. It can help know the present situation and future tendencies of the ambient air quality [21]. Thus, it can provide a scientific basis for the planning and management of ambient air quality. Studies on the evaluation of air quality are an important issue, and have attracted the interest of many scholars. The fuzzy comprehensive evaluation theory was applied in air quality assessment according to the national air quality standard [22]. The level of environmental quality was determined based on the ambient air monitoring data of Dongzhi Country [23]. Artificial neural networks and decision tree models were applied to evaluate the common Air Quality Index in Thessaloniki, Greece [24]. The forest air quality in Yichun Town was evaluated based on BP neural networks [25].
In this study the current situation of haze-fog pollution in China was introduced, and the new ambient air quality standards were analyzed. A comprehensive evaluation model was developed based on an entropy weighting method and nearest neighbor method, and it was applied into the practical problems of air quality in Beijing to analyze the haze-fog pollution status. The entropy weighting method was used to determine the weights of indicators, and the nearest neighbor method was used to evaluate the levels of air quality. Two simulation experiments were implemented. One experiment was with PM2.5 and carried out based on the new Ambient Air Quality Standards (GB 3095-2012); the other experiment was without PM2.5 and carried out based on the old Ambient Air Quality Standards (GB 3095-1996). We compared their results to investigate the importance of PM2.5 and the effects of standards. The situation of haze-fog pollution in Beijing City was then analyzed based on these results.

2. Materials

2.1. Haze-Fog Pollution in China

Haze-fog events have been hot issues in China since 2012. From the year of 2013 onward haze-fog weather has become more and more serious, and this has caused serious harm to human health, traffic safety, and other production and living aspects of human beings. The main indicator affecting the haze-fog was PM2.5, and it became a hot topic that concerned people. The average number of haze-fog days in 2013 was 4.7, which was the largest number recorded in the last 52 years. According to the statistics of the China Meteorological Administration, in mid-east China where the haze-fog weather was the most serious, the average of haze-fog days in the year of 2013 was 35.9. This was equivalent to the fact that there was over one month when the mid-east areas of China were in the shadow of haze-fog, and the ratio of haze-fog days in one year was about 10%.
Figure 1. Model map of areas under air pollution based on monitoring data of PM2.5.
Ijerph 11 08909 g001
The PM2.5 data in China were monitored through instruments installed on satellites by the National Aeronautics and Space Administration, and the model map of areas under air pollution based on PM2.5 monitoring data is shown in Figure 1, where the different colors represent different degrees of PM2.5 pollution. The deeper the color of the areas in the map, the heavier the pollution there was. There was continuous haze-fog weather in most parts of China, including Tibet and Xinjiang. The areas with serious haze-fog pollution included the Beijing and Tianjin areas, South Hebei Province, Northeast Henan Province, Western Shandong Province, Jiangsu Province, Anhui Province, Western Zhejiang Province, Northwest Fujian Province, Central Hunan Province, South Jiangxi Province, Central Hubei Province and the Northern Sichuan Basin Area. Southwest China became the only unpolluted land.
The reasons for haze-fog pollution formation are many, and the main reasons can be summarized as follows [26,27]:
(i)
The automobile exhaust is the main source of pollutants. In recent years, there are more and more cars in the cities in China and the components in automobile exhaust are the main components of the haze-fog;
(ii)
Secondary pollution from factories is also an important reason. There is much benzene and aldehydes in chemical pollution emissions, and they are important components of haze-fog;
(iii)
The relative humidity near the ground in the haze-fog areas is relatively high, and the ground has lots of dust, so particulate matter can easily form;
(iv)
Burning garbage and burning coal in winter for heating can also generate pollutants.

2.2. New Air Quality Standards

In order to protect and improve the living environment and analyze the atmospheric environment pollution quantitatively, new ambient air quality standards were formulated. The standards formulated the function division of air quality, grading standards, pollutant indicators, time to acquire pollutants, concentration limit values, sampling and analysis methods, and effectiveness of data statistics. The air quality standard in effect before 2012 in China was “Ambient Air Quality Standards (GB 3095-1996)” [28]. They were published and implemented in 1996 and modified in 2000. However, because the haze-fog pollution in China is more and more serious, the regulation of the measurement of PM10 and PM2.5 in ambient air, was published by the Ministry of Environmental Protection, and started to be implemented from 1 January 2011. The measurement of PM2.5 was standardized for the first time in the regulation, but it was not included in the mandatory monitoring indicators at that time. In February 2012, the State Council of China issued the new air quality standards: “Ambient Air Quality Standards (GB 3095-2012)” [29]. This regulation will be implemented in 1 January 2016. In this new standard the PM2.5 values were mandatorily included. Three methods of PM2.5 monitoring were published in the regulation of “PM2.5 automatic monitoring instrument specifications and requirements (trial)” published in May 2012.
The threshold values of some main indicators in the Ambient Air Quality Standards (GB 3095-1996) and (GB 3095-2012) are shown in Table 1 and Table 2. The main differences between the new Ambient Air Quality Standards (GB 3095-2012) and the old ones (GB 3095-1996) were as follows:
(i)
The three levels of air environment function classification were adjusted to two levels, and the threshold values were adjusted accordingly;
(ii)
PM2.5 was included in the standards, and 8-hour average threshold values for O3 were also included;
(iii)
The threshold values of PM10 (annual mean) and NO2 (1-hour average) were adjusted, and they were more severe than before;
(iv)
The regulations of the validity of data statistics were adjusted.
Table 1. Threshold values of ambient air pollutant indicators in GB 3095-1996.
No.Pollutant IndicatorAverage TimeThreshold ValuesUnit
Level ILevel IILevel III
1SO2Annual mean2060100µg/m3
24-hour average50150250
1-hour average150500700
2NO2Annual mean404080µg/m3
24-hour average8080120
1-hour average120120240
3CO24-hour average446mg/m3
1-hour average101020
4O31-hour average120160200µg/m3
5PM10Annual mean40100150µg/m3
24-hour average50150250
Table 2. Threshold values of ambient air pollutant indicators in GB 3095-2012.
No.Pollutant IndicatorAverage TimeThreshold ValuesUnit
Level ILevel II
1SO2Annual mean2060
24-hour average50150µg/m3
1-hour average150500
2NO2Annual mean4040
24-hour average8080µg/m3
1-hour average200200
3CO24-hour average44mg/m3
1-hour average1010
4O38-hour average100160µg/m3
1-hour average160200
5PM10Annual mean4070µg/m3
24-hour average50150
6PM2.5Annual mean1535µg/m3
24-hour average3575

3. Methods

3.1. Entropy Weighting Method

In the evaluation system, determination of weights for all the indicators is an important process that can measure the degree of impact of indicators. When the weight of an indicator is high, it has great impact on the capability; otherwise, the impact is lower. In information theory, information entropy is an important concept, and it can measure the amount of useful information that the data provides in a system [30]. The basic criteria of entropy weighting method are as follows: when the data of the multiple evaluated objects on one indicator show great differences, the entropy value of this indicator must be low according to information theory. This shows that this indicator can contribute much useful information and thus the weight of this indicator should be set high; otherwise, when the entropy value of an indicator was high, it may contribute little useful information according to the information theory. Its weight should be correspondingly low [31]. The procedures for weighting the indicators are as follows:
(i) The original data of all indicators should be normalized, and this can eliminate the impact of dimension. For one benefit indicator, the higher its value is, the better its effect on the air quality was. The normalization equation is:
Ijerph 11 08909 i001
For a cost indicator, the lower its value is, the better its effect on the air quality is. The normalization equation is:
Ijerph 11 08909 i002
where, xij (i=1, 2, …, m, and j =1, 2, …, n) is the monitoring value of the j-th object on the i-th indicator, and rij is the dimensionless value normalized.
(ii) For the evaluation problem with m indicators and n evaluated objects, the entropy value pi of the i-th indicator can be defined as:
Ijerph 11 08909 i003
where Ijerph 11 08909 i004, k=1/ln n, i=1, 2, …, m. When fij= 0, we set fij ln fij =0.
(iii) The weight of the i-th indicator λi can be calculated according to the information entropy theory:
Ijerph 11 08909 i005
where 0 ≤ λi ≤ 1, and Ijerph 11 08909 i006.
The entropy weighting method is a good objective weighting method, and it can reflect the degree of effective amount of information provided. In this study the entropy weighting method is used to weight the indicators of the air quality.

3.2. Nearest Neighbor Method

The nearest neighbor method is one of the clustering analysis methods. The purpose of the clustering analysis method is to classify the samples with close distances to the clustering centers as the same class based on some criterion. The basic ideas of the nearest neighbor method are as follows: for an evaluation problem with multiple objects, it is supposed that there are multiple samples xi (i=1, 2, …, N). For one sample xi to be classified, we investigate the distances between xi and x* which is the known clustering center. The cluster of sample xi is defined as the cluster with the nearest distance from the known cluster [32]. According to this classification ideology, the distance of nearest neighbor method can be set as:
Ijerph 11 08909 i007
The Euclidean distance function is employed in this study, and the equation is:
Ijerph 11 08909 i008
In the evaluation system, different indicators are often with different dimensions, and the data of indicators should be normalized first. The nearest neighbor method is a practical evaluation method. It is suitable for processing multi-indicator evaluation problems. It has a simple principle, easy calculation and high practicability. When this method was applied to the evaluation work, good comparability assessment results could be obtained.

4. Evaluation Model and Algorithm

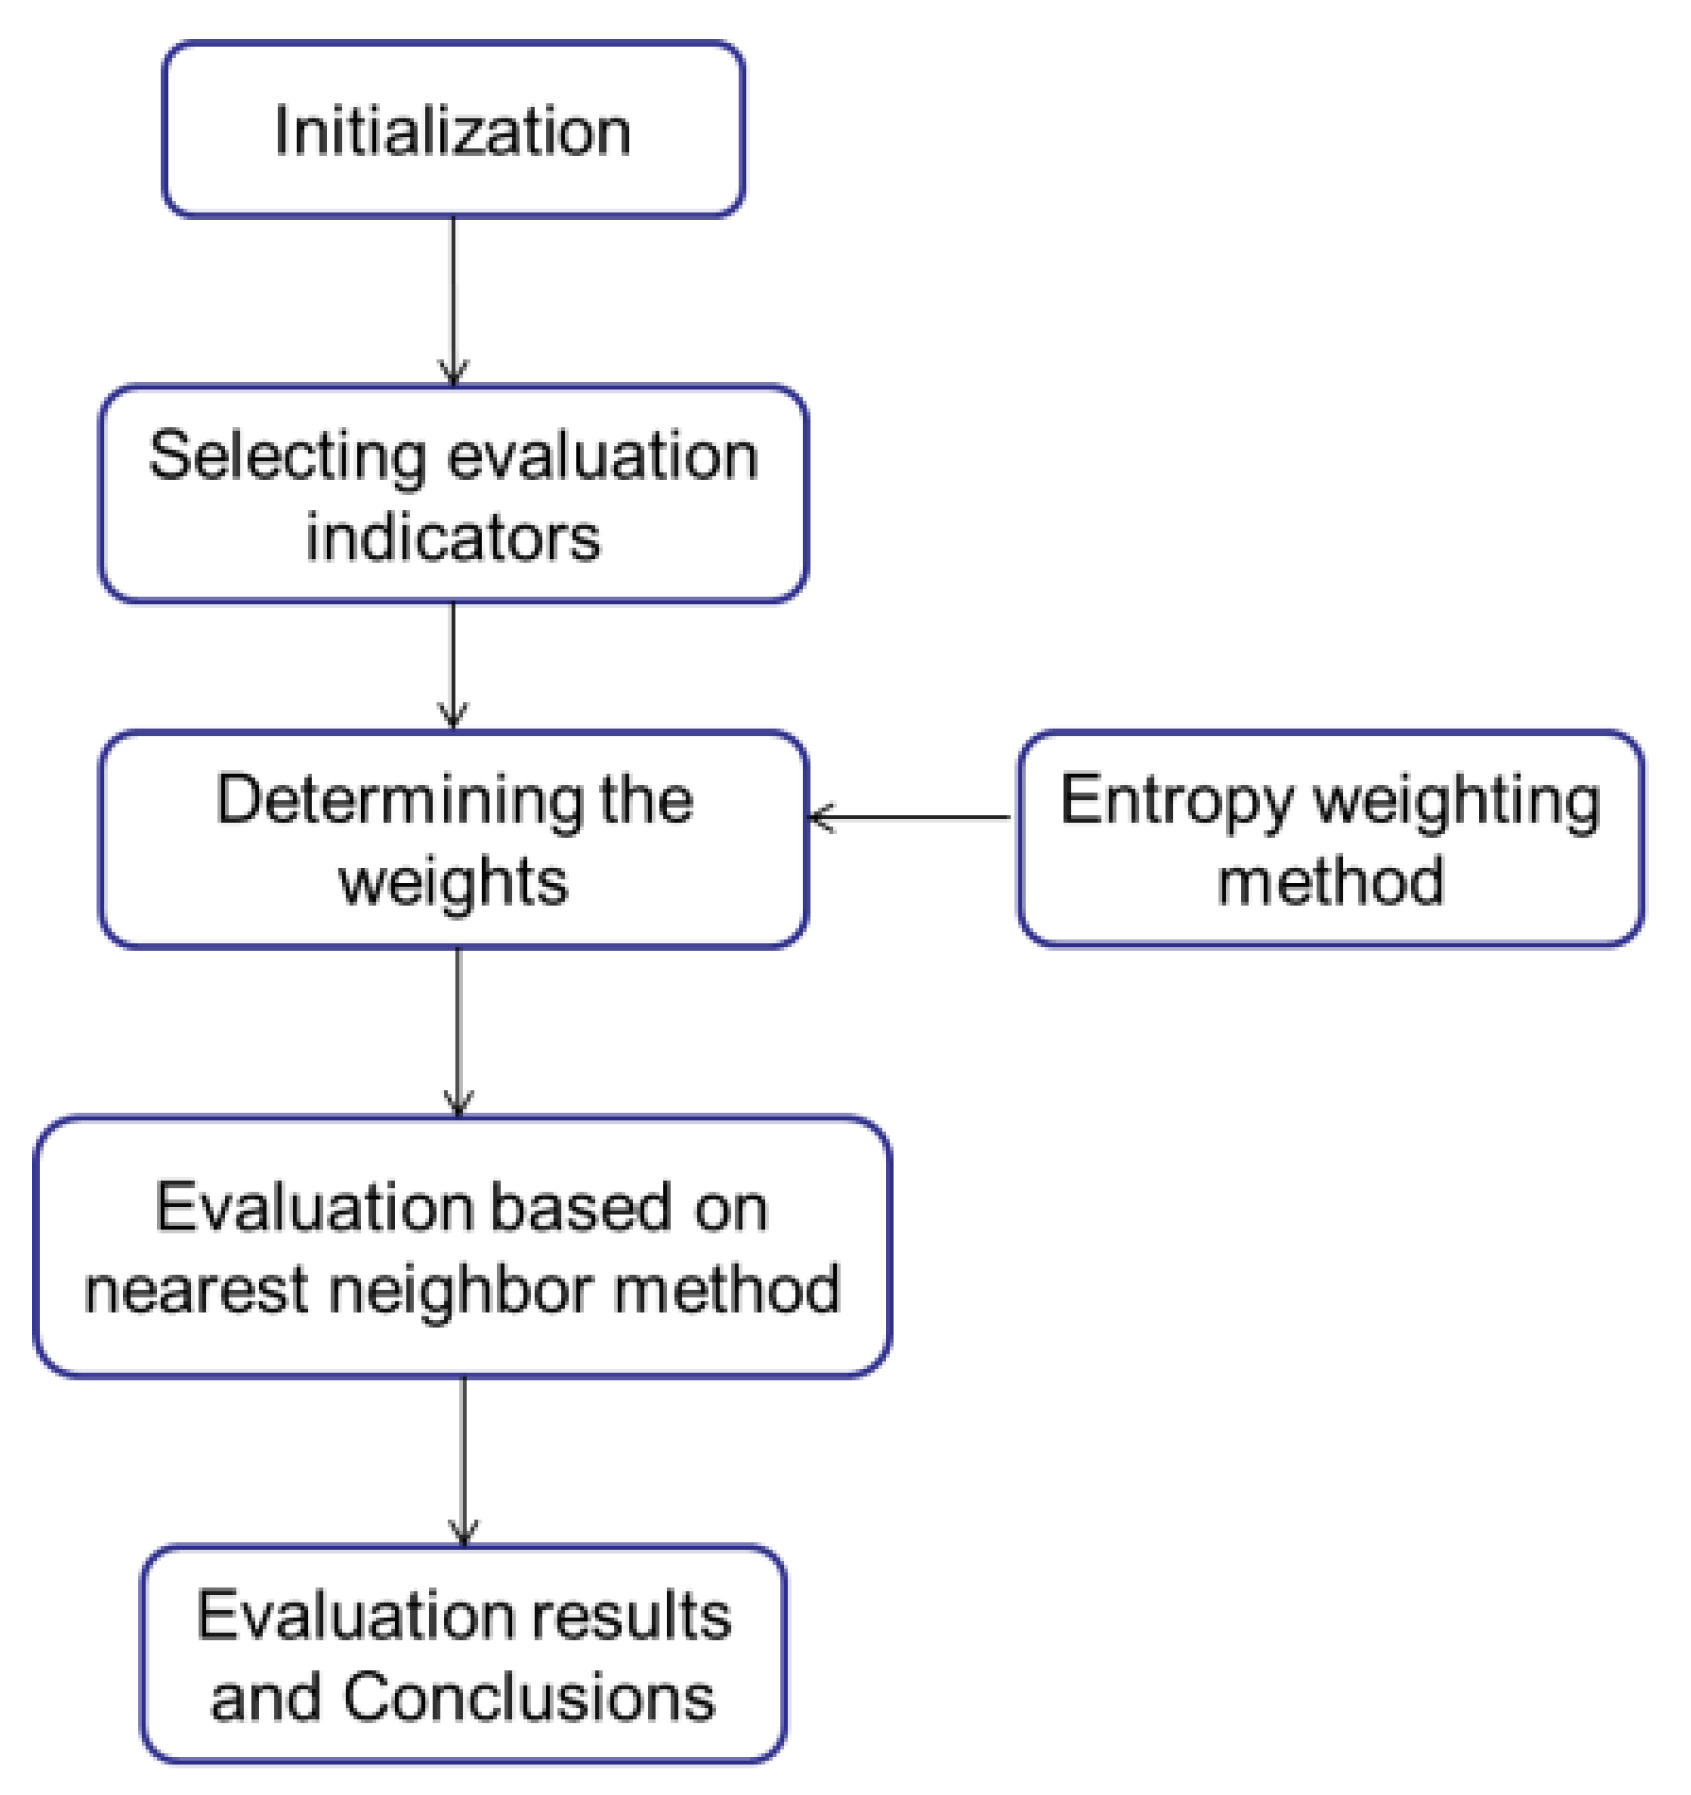
For the issue of air quality evaluation, a comprehensive evaluation model based on the entropy weighting method and nearest neighbor method was developed. The entropy weighting method was used to weight the various air quality indicators, and the importance of each indicator was analyzed. The nearest neighbor method was utilized to evaluate the air quality according to the Ambient Air Quality Standards. The algorithm of the evaluation model is shown in Figure 2.
Then the comprehensive evaluation model was applied to the practical problem of evaluating the air quality in Beijing to analyze the haze-fog pollution status. Because the most important changes of the Ambient Air Quality Standards were the introduction of PM2.5, we set two simulation experiments, one is with the indicator of PM2.5, and the other not. The simulation experiment with PM2.5 was carried out based on the new Ambient Air Quality Standards (GB 3095-2012), and the other experiment without PM2.5 was based on the old Ambient Air Quality Standards (GB 3095-1996). We compared their results, and analyzed the air quality of Beijing City at the same time. Thus the ambient air quality of Beijing City was analyzed comprehensively, and it is hoped that the results will provide helpful suggestions for the health and life of the people. The study procedures of this paper were as follows:
  • Step 1: Initialize, and collect the original data of all indicators of air quality;
  • Step 2: Define the indicators and their weights. The entropy weighting method was used to determine the weights of all indicators, and their importance was analyzed;
  • Step 3: Construct the evaluation model based on the nearest neighbor method, and it was used to evaluate the air quality of Beijing City;
  • Step 4: Use the model to evaluate the air quality in two simulation experiments. One experiment was with PM2.5 and carried out based on the new Ambient Air Quality Standards (GB 3095-2012); the other experiment was without PM2.5 and carried out based on the old Ambient Air Quality Standards (GB 3095-1996);
  • Step 5: Compare the results of the two simulation experiments, and analyze the air quality of Beijing City according to the evaluation results of the model;
  • Step 6: Draw conclusions, and provide reasonable suggests to decision making according to the research results.
Figure 2. Evaluation model algorithm.
Ijerph 11 08909 g002

5. Results and Analysis

5.1. Simulation Experiments

The two simulation experiments are described in this section. One experiment was with PM2.5 and carried out based on the new Ambient Air Quality Standards (GB 3095-2012); the other experiment was without PM2.5 and carried out based on the old Ambient Air Quality Standards (GB 3095-1996). The original data were the values of some important indicators in February 2014, which was one of the most polluted months in Beijing. The original data, as shown in Table 3, were from the China National Environmental Monitoring Center, and they were 24-hour averages of all pollutants. The indicators which reflected the air quality were PM2.5, PM10, CO, NO2, and SO2.
Table 3. Air quality data of Beijing city in February 2014.
DatePM2.5 (μg/m3)PM10 (μg/m3)CO (mg/m3)NO2 (μg/m3)SO2 (μg/m3)
02–011351461.995751
02–0263931.193018
02–035310.3084
02–0426390.622119
02–05871011.584852
02–061191312.086567
02–0794601.455134
02–0872431.273823
02–098150.451715
02–1023270.743725
02–111001142.097858
02–121111152.157753
02–131901762.858474
02–142652953.119473
02–153874433.75107102
02–162962043.188779
02–17104502.037165
02–1870841.136137
02–1966741.236134
02–201611712.167843
02–212572842.6710377
02–222622993.3210199
02–232122483.6192128
02–242593274.74119133
02–253533905.2912175
02–263152503.7010580
02–2715220.432212
02–28771021.507132
Using the formulas in Section 3.1, the weights of all indicators were calculated based on the entropy weighting method according to the data in Table 3 and the results are shown in Table 4.
Table 4. Entropy values and weights of indicators.
PM2.5PM10CONO2SO2
Entropy value1.38871.39991.40021.35951.3944
Weight0.20010.20590.20600.18500.2030
From Table 4 we could see that the weights of CO and PM10 were high, while that of NO2 was low. The differences between all indicators were not much, and this indicated that all indicators were very important to the evaluation system.
In next step the nearest neighbor method was used to evaluate the air quality of Beijing City in February. The air quality levels were set as the clustering centers, and we investigated the distances between each sample and the clustering centers. Using the formulas in Section 3.2, we calculated the distances, and the level of air quality was determined according to the principle of minimum distance. Two simulation experiments would be implemented. One experiment was with PM2.5 and carried out based on the new Ambient Air Quality Standards (GB 3095-2012); the other experiment was without PM2.5 and carried out based on the old Ambient Air Quality Standards (GB 3095-1996). We compared their results to investigate the importance of PM2.5 and the effects of the standards.
In the first simulation experiment based on the new Ambient Air Quality Standards (GB 3095-2012), five indicators were included (PM2.5, PM10, CO, NO2, and SO2). The air quality was evaluated and the results, shown in Table 5, were calculated according to the formulas in Section 3.2. In Table 5, d1 stands for the distances between the daily values of all indicators and the threshold values of Level I, while d2 stands for the distances from the daily values of all indicators to the threshold values of Level II in the standards (GB 3095-2012). In addition, from Table 2 we could see that the NO2 threshold values at Level I and Level II were the same, and so were those of CO, therefore, we could ignore these two indicators, which may reduce the evaluation workload.
Table 5. Evaluation results based on Ambient Air Quality Standards (GB 3095-2012).
Dated1d2RankDated1d2Rank
02–010.29490.2357II02–150.75110.6146II
02–020.37250.3740I02–160.45350.3520II
02–030.43130.4695I02–170.18650.2107I
02–040.36160.3981I02–180.28900.2945I
02–050.23740.2242II02–190.29930.3118I
02–060.22220.1624II02–200.35650.2860II
02–070.30720.3195I02–210.47150.3435II
02–080.34770.3726I02–220.48010.3460II
02–090.38400.4328I02–230.39870.2759II
02–100.33610.3816I02–240.52620.3954II
02–110.22770.1964II02–250.67320.5408II
02–120.25380.2209II02–260.50800.3948II
02–130.31080.2103II02–270.39530.4385I
02–140.49410.3665II02–280.31730.3098II
In the second simulation experiment, four indicators were included (PM10, CO, NO2, and SO2). PM2.5 was excluded. The old Ambient Air Quality Standards (GB 3095-1996) was adopted to evaluate the air quality. The evaluation results are shown in Table 6. In Table 6, d1 and d2 also stand for the distances between the daily values of all indicators and the threshold values of Level I and Level II, while d3 stands for the distances between the daily values of all indicators and the threshold values of Level III in the standards (GB 3095-1996).
Table 6. Evaluation results based on Ambient Air Quality Standards (GB 3095-1996).
Dated1d2d3RankDated1d2d3Rank
02–010.23520.21850.5498II02–150.56020.37590.3075III
02–020.32640.40820.7463I02–160.27390.07970.3365II
02–030.46020.55830.8978I02–170.21390.20680.5293II
02–040.39070.47570.8148I02–180.26340.31880.6491I
02–050.26570.27210.6063I02–190.25100.32070.6531I
02–060.24160.17150.4977II02–200.20900.20460.5154II
02–070.24710.32380.6625I02–210.36160.20690.3545II
02–080.29270.38960.7306I02–220.41500.21180.2602II
02–090.41830.51160.8511I02–230.45810.22470.2093III
02–100.33970.42760.766I02–240.56390.35840.1071III
02–110.20290.17710.4996II02–250.50800.37890.2808III
02–120.18840.18280.5086II02–260.32990.16010.2703II
02–130.24410.08250.3819II02–270.40740.50560.8454I
02–140.34710.18940.3452II02–280.22020.28930.6152I

5.2. Analysis and Discussion

As shown in Table 5, the air qualities of less than half a month in February were at Level I, and those of the other dates were at Level II. The results of Experiment 2 in Table 6 were basically consistent with those of Experiment 1. The days with Level II air quality in Table 5 were at Level II or III in Table 6, while the days with Level I air quality in Table 6 were still at Level I in Table 5.
However, there were some differences between the results of our two simulation experiments. The air qualities on 5 and 28 February were at Level II in Experiment 1 in Table 5, while those were at Level I in Experiment 2 in Table 6. This illustrated the air quality became worse due to the introduction of PM2.5. If the air quality were evaluated based on the old Ambient Air Quality Standards (GB 3095-1996), the results tended to be not scientific or deviate from the actual situation. PM2.5, as a new indicator that reflects air quality, plays an important role in the evaluation process, and it is receiving more and more attention in China. Thus the new Ambient Air Quality Standards (GB 3095-2012) are more scientific than the old ones.
There were two continuous periods when the air qualities were severe polluted (at Level II in Table 5, or Level II and III in Table 6), that is, from the 11th to the 16th and the 20th to the 26th. The data of all indicators in those days were high, especially the PM2.5 indicator, which was one of the most important factors influencing the air quality of Beijing City. The PM2.5 concentration on 11 to 16 February in Beijing increased obviously in Table 3, because it was affected by the fireworks during the Spring Festival and adverse weather conditions. On 20 to 26 February, due to the adverse weather conditions, Beijing was experiencing serious haze-fog pollution, and this haze-fog pollution event was wide ranging, of severe degree, and long lasting.

6. Conclusions

Haze-fog pollution in China was very severe during autumn and winter in recent years. In order to protect and improve the living environment and analyze the atmospheric environment pollution quantitatively, new ambient air quality standards were issued. A comprehensive evaluation model based on an entropy weighting method and nearest neighbor method was developed according to the new Ambient Air Quality Standards (GB 3095-2012), compared with the old standards (GB 3095-1996). The model was applied into assess the air quality in Beijing in February 2014. The simulation results showed that PM2.5 played an important role in the evaluation process, and could affect the air quality to a large extent. The results based on the new Ambient Air Quality Standards (GB 3095-2012) were more scientific than the old standards (GB 3095-1996). In February 2014 in Beijing there were two continuous periods when the air qualities was severe polluted, that is, the 11th to the 16th and the 20th to the 26th. The air quality in Beijing during less than half a month in February was at Level I, and those of the other dates were at Level II according to the new standards. This was affected by the fireworks during the Spring Festival and adverse weather conditions, and the haze-fog pollution situation in Beijing was still severe.
The haze-fog pollution is heavy in China, and the management and control of haze-fog is very important. The prevention of haze-fog pollution is a systematic project. This requires the environmental protection departments to take the lead, and it also needs social consensus to urge the relevant work. Measures from two aspects are suggested to reduce the haze-fog pollution. One is to reduce the pollution emissions from the sources. We must make efforts to adhere to plans to reduce pollutant emissions. The other is to establish emergency plans for heavy pollution weather. The measures can be taken in advance according to the weather forecast in order to reduce or avoid the occurrence of weather-driven heavy pollution.

Acknowledgments

Research works in this paper are financially supported by Research Planning Foundation in Humanities and Social Sciences of the Ministry of Education of China (Grant No. 13YJAZH044) and National Science Foundation of China( Grant No. 61173052).

Author Contributions

Li Li conceived the study idea, developed the evaluation model, and provided a lot of instructive suggestions contributed to the manuscript revision. Dong-Jun Liu contributed to the study design, collected the data, gathered and measured information on the variables of interest, developed the evaluation model with Li Li, developed the programs and performed data analysis and discussion and wrote the initial manuscript draft.

Conflicts of Interest

The authors declare no conflict of interest.

References

  1. Xie, Y.S.; Li, Z.Q.; Li, L.; Wang, L.; Li, D.H.; Chen, C.; Li, K.T.; Xu, H. Study on influence of different mixing rules on the aerosol components retrieval from ground-based remote sensing measurements. Atmos. Res. 2014, 145–146, 267–278. [Google Scholar] [CrossRef]
  2. Li, W.J.; Shao, L.Y.; Buseck, P.R. Haze types in Beijing and the influence of agricultural biomass burning. Atmos. Chem. Phys. 2010, 10, 8119–8130. [Google Scholar] [CrossRef]
  3. Wang, Z.F.; Li, J.; Wang, Z.; Yang, W.Y.; Tang, X.; Ge, B.Z.; Yan, P.Z.; Zhu, L.L.; Chen, X.S.; Chen, H.S. Modeling study of regional severe hazes over Mid-eastern China in January 2013 and its implications on pollution prevention and control. Sci. China Earth Sci. 2014, 57, 3–13. [Google Scholar] [CrossRef]
  4. Shen, G.; Xue, M.; Yuan, S.Y.; Zhang, J.; Zhao, Q.Y.; Li, B.; Wu, H.S.; Ding, A.J. Chemical compositions and reconstructed light extinction coefficients of particulate matter in a mega-city in the western Yangtze River Delta, China. Atmos. Environ. 2014, 8, 14–20. [Google Scholar]
  5. Tie, X.; Wu, D.; Brasseur, G. Lung cancer mortality and exposure to atmospheric aerosol particles in Guangzhou, China. Atmos. Environ. 2009, 43, 2375–2377. [Google Scholar] [CrossRef]
  6. Hanafy, M.E.; Roggemann, M.C.; Guney, D.O. Detailed effects of scattering and absorption by haze and aerosols in the atmosphere on the average point spread function of an imaging system. J. Opt. Soc. Am. A Opt. Image Sci. Vis. 2014, 31, 1312–1319. [Google Scholar] [CrossRef]
  7. Tao, J.; Zhang, L.; Ho, K.; Zhang, R.; Lin, Z.; Zhang, Z.; Zhang, Z.S.; Lin, M.; Cao, J.J.; Liu, S.X.; Wang, G.H. Impact of PM2.5 chemical compositions on aerosol light scattering in Guangzhou—The largest megacity in South China. Atmos. Res. 2014, 135, 48–58. [Google Scholar]
  8. Technical Regulations on Ambient Air Quality Index (Trial) (HJ 633–2012). 2012. Available online: http://kjs.mep.gov.cn/hjbhbz/bzwb/dqhjbh/jcgfffbz/201203/t20120302_224166.htm (accessed on 24 July 2014).
  9. Guo, S.; Hu, M.; Wang, Z.B.; Slanina, J.; Zhao, Y.L. Size-resolved aerosol water soluble ionic compositions in the summer of Beijing: Implication of regional secondary formation. Atmos. Chem. Phys. 2010, 10, 947–959. [Google Scholar]
  10. Li, W.J.; Zhou, S.Z.; Wang, X.F.; Xu, Z.; Yuan, C.; Yu, Y.C.; Zhang, Q.Z.; Wang, W.X. Integrated evaluation of aerosols from regional brown hazes over northern China in winter: Concentrations, sources, transformation, and mixing states. J. Geophys. Res. Atmos. 2011, 116. [Google Scholar] [CrossRef]
  11. Sun, Y.L.; Zhuang, G.S.; Tang, A.; Wang, Y.; An, Z. Chemical characteristics of PM2.5 and PM10 in Haze-Fog episodes in Beijing. Environ. Sci. Technol. 2006, 40, 3148–3155. [Google Scholar] [CrossRef]
  12. Pope, C.A.; Burnett, R.T.; Thun, M.J.; Call, E.E.; Krewski, D.; Ito, K.; Thurston, G.D. Lung cancer, cardiopulmonary mortality, and long-term exposure to fine particulate air pollution. J. Am. Med. Assoc. 2002, 287, 1132–1141. [Google Scholar] [CrossRef]
  13. Deng, X.Y.; Tie, X.X.; Wu, D.; Zhou, X.J.; Bi, X.Y.; Tan, H.B.; Li, F.; Jiang, C.L. Long-term trend of visibility and its characterizations in the Pearl River Delta (PRD) region, China. Atmos. Environ. 2008, 42, 1424–1435. [Google Scholar] [CrossRef]
  14. Gao, J.; Wang, T.; Zhou, X.H; Wu, W.S.; Wang, W.X. Measurement of aerosol number size distributions in the Yangtze River delta in China: Formation and growth of particles under polluted conditions. Atmos. Environ. 2009, 43, 829–836. [Google Scholar] [CrossRef]
  15. Lee, K.H.; Kim, Y.J.; Kim, M.J. Characteristics of aerosol observed during two severe haze events over Korea in June and October 2004. Atmos. Environ. 2006, 40, 5146–5155. [Google Scholar] [CrossRef]
  16. Li, Z.Q.; Gu, X.; Wang, L.; Li, D.; Li, K.; Dubovik, O.; Schuster, G.; Goloub, P.; Zhang, Y.; Li, L.; Ma, Y.; Xu, H. Aerosol physical and chemical properties retrieved from ground-based remote sensing measurements during heavy haze days in Beijing winter. Atmos. Chem. Phys. 2013, 13, 5091–5122. [Google Scholar] [CrossRef]
  17. Zhao, X.J.; Zhao, P.S.; Xu, J.; Meng, W.; Pu, W.W.; Dong, F.; He, D.; Shi, Q.F. Analysis of a winter regional haze event and its formation mechanism in the North China Plain. Atmos. Chem. Phys. 2013, 13, 5685–5696. [Google Scholar] [CrossRef]
  18. Che, H.; Xia, X.; Zhu, J.; Li, Z.; Dubovic, O.; Holben, B.; Goloub, P.; Chen, H.; Estelles, V.; Cuevas-Agulló, E.; et al. Column aerosol optical properties and aerosol radiative forcing during a serious haze-fog month over North China Plain in 2013 based on ground-based sunphotometer measurements. Atmos. Chem. Phys. 2013, 13, 29685–29720. [Google Scholar] [CrossRef]
  19. Zhang, J.K.; Sun, Y.; Liu, Z.R.; Ji, D.S.; Hu, B.; Liu, Q.; Wang, Y.S. Characterization of submicron aerosols during a serious pollution month in Beijing (2013) using an aerodyne high-resolution aerosol mass spectrometer. Atmos. Chem. Phys. 2013, 13, 19009–19049. [Google Scholar] [CrossRef]
  20. Wang, L.T.; Wei, Z.; Yang, J.; Zhang, Y.; Zhang, F.F.; Su, J.; Meng, C.C.; Zhang, Q. The 2013 severe haze over the southern Hebei, China: Model evaluation, source apportionment, and policy implications. Atmos. Chem. Phys. 2013, 13, 28395–28451. [Google Scholar] [CrossRef]
  21. Guleda, O.E.; Ibrahim, D.; Halil, H. Assessment of urban air quality in Istanbul using fuzzy synthetic evaluation. Atmos. Environ. 2004, 38, 3809–3815. [Google Scholar] [CrossRef]
  22. Yan, Y.; Zhao, Y.N.; Zhou, G.C.; Bi, M.T.; Feng, S. Application of fuzzy comprehensive evaluation theory in air quality assessment. J. Chem. Pharm. Res. 2014, 6, 13–21. [Google Scholar]
  23. Zhang, H.; Qing, C.S.; Yu, Y.P.; Li, S.J. Air quality assessment of Dongzhi Country based on fuzzy comprehensive evaluation. In Proceedings of the 3rd International Conference on Environmental Technology and Knowledge Transfer, Heifei, China, 13–14 May 2010; pp. 678–681.
  24. Kyriakidis, L.; Karatzas, K.; Kukkonen, J.; Papadourakis, G.; Ware, A. Evaluation and analysis of artificial neural networks and decision trees in forecasting of common air quality index in Thessaloniki, Greece. Eng. Intell. Syst. 2013, 21, 111–124. [Google Scholar]
  25. Wang, K.; Wang, W.S.; Zhang, X.; Sun, L.X. Evaluation of forest air quality based on BP neural network. J. Harbin Inst. Technol. 2010, 42, 1278–1281. [Google Scholar]
  26. Shen, G.F.; Yuan, S.Y.; Xie, Y.N.; Xia, S.J.; Li, L.; Yao, Y.K.; Qiao, Y.Z.; Zhang, J.; Zhao, Q.Y.; Ding, A.J.; et al. Ambient levels and temporal variations of PM2.5 and PM10 at a residential site in the mega-city, Nanjing, in the western Yangtze River Delta, China. J. Environ. Sci. Health 2014, 49, 171–178. [Google Scholar] [CrossRef]
  27. Wang , H.L.; Zhu, B.; Shen, L.J.; Zhang, Z.F.; Liu, X.H. The mass concentration and chemical compositions of the atmospheric aerosol during the Spring Festival in Nanjing. China Environ. Sci. 2014, 34, 30–39. [Google Scholar]
  28. Ministry of Environmental Protection. Ambient Air Quality Standards (GB 3095-1996). 2012. Available online: http://kjs.mep.gov.cn/hjbhbz/bzwb/dqhjbh/dqhjzlbz/201203/W020120410330232398521.pdf (accessed on 29 February 2012). [Google Scholar]
  29. Ministry of Environmental Protection. Ambient Air Quality Standards (GB 3095-2012). 2012. Available online: http://www.zzemc.cn/em_aw/Content/GB3095-2012.pdf (accessed on 29 February 2012).
  30. Liu, L.; Zhou, J.Z.; An, X.L.; Zhang, Y.C.; Yang, L. Using fuzzy theory and information entropy for water quality assessment in Three Gorges region, China. Expert Syst. Appl. 2010, 37, 2517–2521. [Google Scholar] [CrossRef]
  31. Zou, Z.H.; Yun, Y.; Sun, J.N. Entropy method for determination of weight of evaluating indicators in fuzzy synthetic evaluation for water quality assessment. J. Environ. Sci. 2006, 18, 1020–1023. [Google Scholar] [CrossRef]
  32. Kazuo, H.; Yasunobu, T. Effective algorithms for the nearest neighbor method in the clustering problem. Pattern Recognit. 1993, 26, 741–746. [Google Scholar] [CrossRef]

