
Prevalence and Determinants of Mucous Membrane Irritations in a Community Near a Cement Factory in Zambia: A Cross Sectional Study

Abstract
:1. Introduction
2. Material and Method
2.1. Study Design
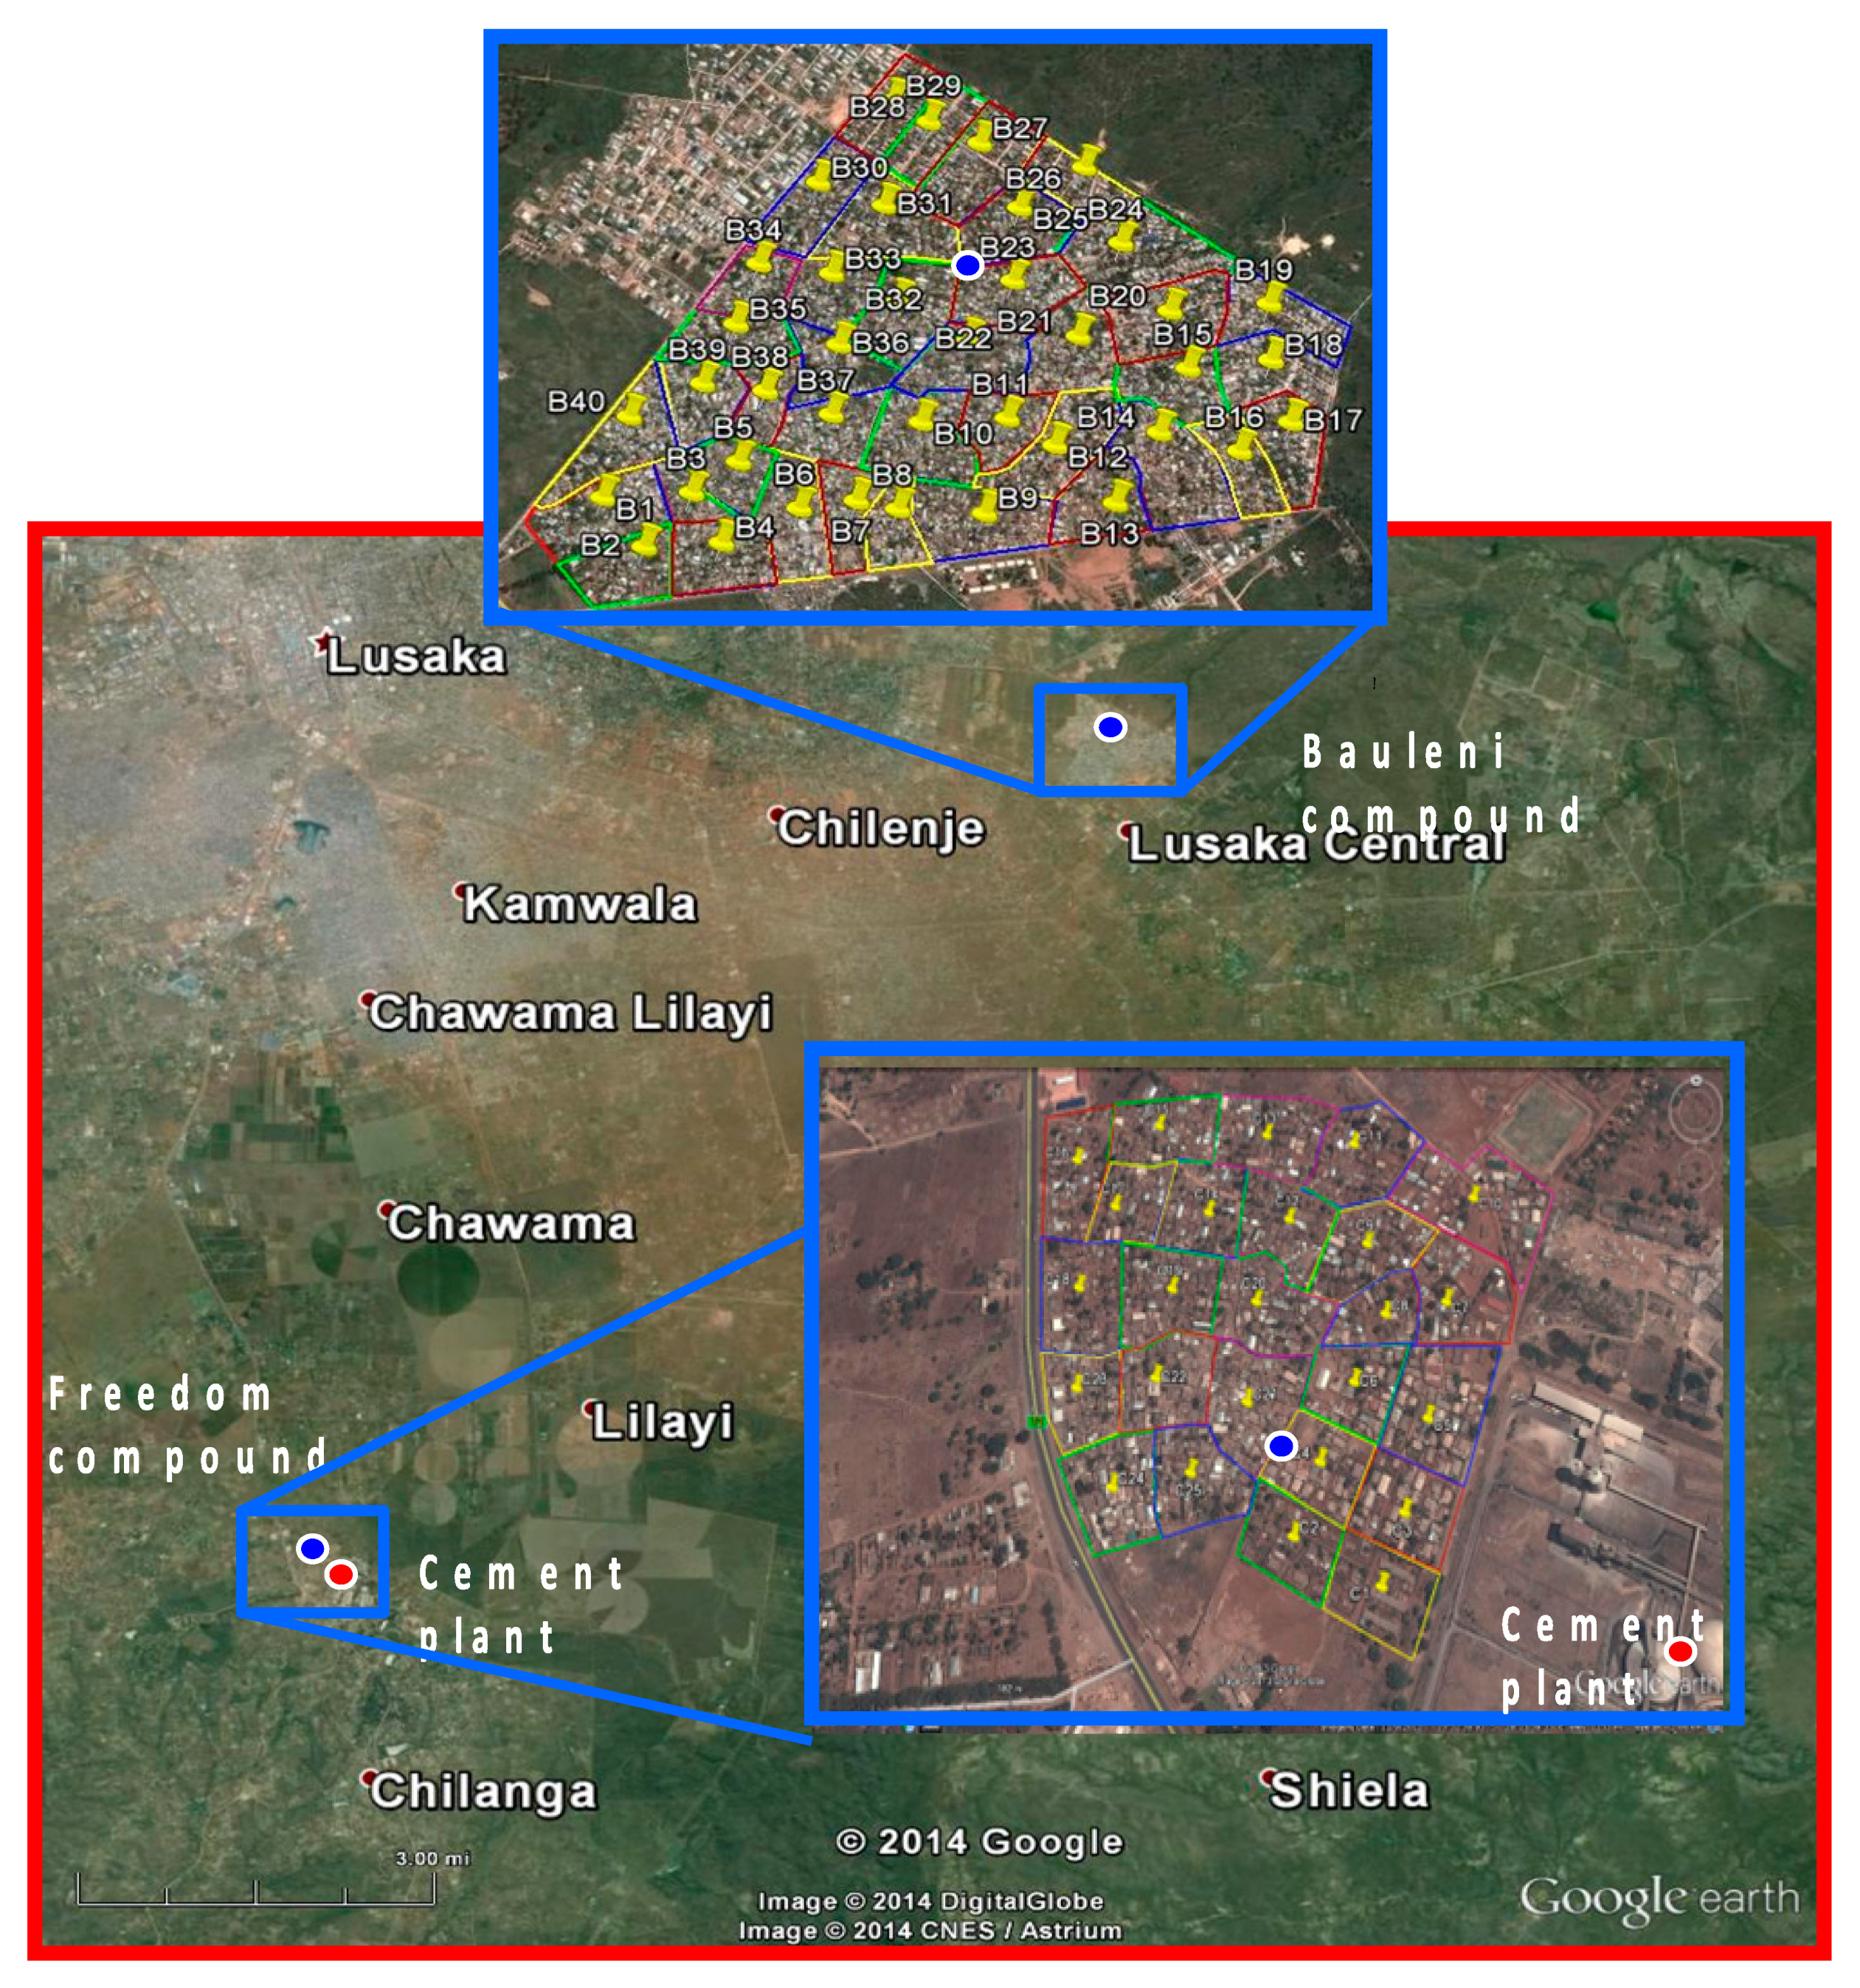
2.2. Study Area
Sample Size
2.3. Sampling of Participants

2.4. Data Collection
2.5. Measurement of Variables

| Symptoms or Complaints | ||
|---|---|---|
| Eye | Nose | Sinus |
| Swelling | Itching | Head or face pain |
| Discharge | Sensation of fullness or congestion | Blowing out thick mucus |
| Excessive tearing | Nasal discharge | Post nasal drip a |
| Any of the above of symptoms c | Runny nose | Throat clearing or Hoarseness of the voice b |
| Any of the above symptoms c | Any of the above symptoms c | |
3. Statistical Analysis
4. Results
4.1. Description of Respondents’ Demographic and Socioeconomic Characteristics
4.2. Socio Economic Characteristics of the Communities
| Factor | Total | Freedom | Bauleni | p-Value |
|---|---|---|---|---|
| (Exposed) | (Control) | |||
| N = 423 | N = 225 | N = 198 | ||
| n (%) | n (%) | n (%) | ||
| Age in years: | ||||
| 12–24 | 158 (37.4) | 77 (33.5) | 81 (39.5) | 0.005 |
| 25–39 | 166 (39.2) | 101 (46.2) | 65 (31.7) | |
| 40+ | 99 (23.4) | 47 (20.4) | 52 (28.8) | |
| Years lived in community a | N = 217 | N = 190 | ||
| median (IQR) | 10 (4–21) | 14 (5–23) | 0.080 | |
| Gender | ||||
| Female | 333 (78.7) | 187 (83.1) | 146 (73.7) | 0.021 |
| Male | 90 (21.3) | 38 (16.9) | 52 (26.3) | |
| Marital status | ||||
| Single | 138 (32.6) | 71 (36.6) | 67 (32.8) | 0.099 |
| Married | 245 (57.9) | 135 (57.9) | 110 (57.2) | |
| Widow/divorced | 40 (9.5) | 19 (5.5) | 21 (10.0) | |
| Education | ||||
| None | 28 (6.6) | 4 (1.1) | 24 (9.6) | |
| primary | 241 (57.0) | 147 (63.9) | 94 (49.7) | <0.001 |
| Secondary | 145 (34.3) | 66 (30.8) | 79 (40.3) | |
| Tertiary | 9 (2.1) | 8 (4.2) | 1 (0.4) | |
| Employment status b | ||||
| Unemployment | 270 (67.0) | 153 (75.5) | 117 (61.6) | 0.003 |
| Employed | 133 (33.0) | 56 (24.5) | 77 (38.4) | |
| Smoking status c | ||||
| Never smoked | 397 (94.7) | 209 (94.5%) | 188 (96.6%) | 0.381 |
| Ever smoker | 6 (1.4) | 5 (2.0%) | 1 (1.0%) | |
| Current | 17 (4.0) | 10 (3.5%) | 7(2.8) | |
| Secondary smoke | ||||
| Yes | 24 (5.7) | 9 (3.2) | 15 (7.6) | 0.060 |
| No | 395 (94.3) | 215 (96.8) | 180 (92.4) |
| Factor | Total | Freedom | Bauleni | p-Value |
|---|---|---|---|---|
| (Exposed) | (Control) | |||
| N = 423 | N = 225 | N = 198 | ||
| n (%) | n (%) | n (%) | ||
| House ownership | ||||
| Owned | 180 (42.6) | 85 (44.2) | 95 (53.9) | |
| Rented | 224 (52.9) | 124 (49.4 | 100 (44.8) | 0.021 |
| Other | 19 (4.5) | 16 (6.2%) | 3 (1.3) | |
| How old house Yrs a | ||||
| 1–20 | 70 (16.9) | 33 (16.8) | 37 (20.4) | |
| 21–40 | 23(5.5) | 6 (3.9) | 17 (9.4) | 0.080 |
| Unknown | 322 (77.6) | 184 (79.3) | 138 (70.1) | |
| House material b | ||||
| Mud | 49 (12.3) | 36 (16.5 ) | 13 (6.6) | 0.020 |
| Concrete | 351 (87.5) | 171 (76.5) | 180 (90.9) | |
| Roof material c | ||||
| Metal | 191 (45.9) | 55 (24.1) | 136 (71.5) | <0.001 |
| Asbestos | 225 (54.1) | 167 (75.9) | 58 (28.5) | |
| House plastered | ||||
| Yes | 205 (48.5) | 130 (58.8) | 75 (38.5) | 0.010 |
| No | 213 (50.4) | 90 (48.0) | 123 (123) | |
| No. of rooms d | ||||
| 1–2 | 240 (58.4) | 123 (50.8) | 117 (53.5) | 0.530 |
| 3+ | 117 (41.6) | 92 (49.2) | 79 (46.5) | |
| No. of windows e | ||||
| 0–3 | 305 (73.0) | 158 (64.6) | 147 (68.9 | 0.420 |
| >=4 | 113 (27.0) | 64 (35.4) | 49 (31.1) | |
| Carpet in house | ||||
| Yes | 121 (28.6) | 58 (25.0) | 63 (31.3) | 0.260 |
| No | 302 (71.4) | 167 (75.0) | 135 (68.7) | |
| Kitchen location | ||||
| Outside | 225 (53.2) | 102 (46.5) | 123 (64.6) | 0.004 |
| insideInside | 198 (46.8) | 123 (53.5) | 75 (35.4) | |
| Source energy cook | ||||
| Electricity | 199 (47.0) | 82 (35.3) | 117 (59.0) | <0.001 |
| Charcoal | 224 (53.0) | 143 (64.7) | 81 (41.0) | |
| Source energy light f | ||||
| Electricity | 288 (73.5) | 149 (72.3) | 139 (73.4) | 0.830 |
| Candle | 104 (26.5) | 51 (27.7) | 53 (26.6) |
4.3. Irritations of Mucous Membranes of Eyes, Nose and Sinus
| N = 420 | N = 223 | N = 197 | p-Value | |
|---|---|---|---|---|
| n (%) | n (%) | n (%) | ||
| Eye irritation | ||||
| Itching | ||||
| Yes | 163(38.8) | 126 (56.4) | 37 (18.3) | <0.001 |
| Swelling | ||||
| Yes | 82 (19.5) | 53 (26.1) | 29 (13.7) | 0.007 |
| Discharge | ||||
| Yes | 66 (15.7) | 49 (20.7) | 17 (10.3) | 0.020 |
| Tearing | ||||
| Yes | 122 (29.0) | 87 (42.8) | 35 (18.9) | <0.001 |
| Any of the symptoms | ||||
| Yes | 268 (63.8) | 170 (78.2) | 98 (49.9) | <0.001 |
| Nose irritation | ||||
| Itching | ||||
| Yes | 83 (19.8) | 53 (25.1) | 30 (14.6) | <0.001 |
| Fullness | ||||
| Yes | 95 (22.6) | 56 (25.0) | 39 (17.0) | 0.012 |
| Nasal discharge | ||||
| Yes | 62 (14.7) | 38 (17.0) | 24 (9.8 ) | 0.030 |
| Runny nose | ||||
| Yes | 115 (27.4) | 74 (35.2) | 41 (19.8) | <0.001 |
| Any of the symptoms | ||||
| Yes | 206 (49.0) | 141 (66.9) | 65 (29.4) | <0.001 |
| Sinus irritation | ||||
| Head pain | ||||
| Yes | 188 (44.8) | 119 (54.6) | 69 (38.4) | <0.003 |
| Thick mucus | ||||
| Yes | 67 (16.0) | 40 (21.4) | 27 (11.6) | 0.002 |
| Post nasal drip | ||||
| Yes | 72 (17.1) | 44 (21.3) | 28 (12.8) | 0.040 |
| Throat clearing | ||||
| Yes | 92 (21.9) | 55 (26.9) | 37 (16.5) | <0.004 |
| Any of the symptoms | ||||
| Yes | 260 (61.9) | 157 (73.7) | 103 (53.3) | <0.001 |
4.4. Predictors of Mucous Membrane Irritations
5. Discussion
| Site of Irritation | Independent Factors | Crude ORs | (95% CI) | p-Value | Adjusted ORs | (95% CI) | p-Value |
|---|---|---|---|---|---|---|---|
| Eye irritation | Community | ||||||
| Bauleni | 1 | - | - | 1 | - | - | |
| Freedom | 3.60 | 2.56–5.28 | <0.001 | 2.50 a | 1.65–3.79 | <0.001 | |
| Time spent | |||||||
| Away home | 1 | - | - | - | - | ||
| Around home | 2.45 | 1.63–3.70 | <0.001 | 1.78 | 1.12–2.82 | 0.017 | |
| Kitchen Location | |||||||
| Outside | 1 | - | - | - | - | ||
| Inside | 1.56 | 1.12–2.18 | 0.012 | 1.62 | 1.12–2.34 | 0.013 | |
| Cook energy | |||||||
| Electricity | 1 | - | - | - | |||
| Charcoal | 1.70 | 1.06–2.71 | 0.028 | 1.55 | 1.06–2.28 | 0.003 | |
| Nose irritation | Community | ||||||
| Bauleni | 1 | - | 1 | - | - | ||
| Freedom | 4.83 | 3.15–7.41 | <0.001 | 4.36 b | 2.95–6.55 | <0.001 | |
| Age (years) | |||||||
| 12–24 | 1 | - | - | - | - | - | |
| 26–39 | 0.99 | 0.64–1.51 | 0.964 | 0.73 | 0.46–1.13 | 0.155 | |
| 40+ | 0.58 | 0.33–1.01 | 0.057 | 0.60 | 0.36–0.01 | 0.053 | |
| Gender | |||||||
| Female | 1 | - | - | 1 | - | - | |
| Male | 0.41 | 0.23–0.78 | 0.006 | 0.47 | 0.25–0.85 | 0.017 | |
| Cook energy | |||||||
| Electricity | 1 | - | |||||
| Charcoal | 1.80 | 1.11–2.96 | 0.021 | 1.37 | 0.82–2.31 | 0.214 | |
| Sinus irritation | Community | ||||||
| Bauleni | 1 | - | - | 1 | - | - | |
| Freedom | 2.45 | 1.57–3.83 | <0.001 | 1.94 c | 1.19–3.18 | 0.012 | |
| Age (years) | |||||||
| 12–24 | 1 | - | - | - | - | - | |
| 25–39 | 0.53 | 0.28–1.00 | 0.052 | 0.46 | 0.21–0.03 | 0.044 | |
| 40+ | 0.70 | 0.34–1.43 | 0.311 | 0.83 | 0.36–1.9 | 0.595 | |
| Education | |||||||
| None | 1 | - | - | ||||
| Primary | 2.41 | 0.98–5.97 | 0.055 | 1.98 | 0.66–5.88 | 0.202 | |
| Secondary | 1.46 | 0.63–3.37 | 0.350 | 1.25 | 0.36–4.26 | 0.703 | |
| Tertiary | 2.66 | 0.61–11.53 | 0.178 | 2.54 | 0.73–8.82 | 0.132 | |
| Occupation | |||||||
| Unemployed | 1 | ||||||
| Unemployed | 0.56 | 0.35–0. 89 | 0.019 | 0.69 | 0.47–0.99 | 0.048 | |
| Cook energy | |||||||
| Electricity | 12.13 | - | - | - | |||
| Charcoal | 2.13 | 1.22–3.71 | 0.011 | 1.68 | 0.88–3.22 | 0.108 | |
| Floor carpet | |||||||
| No | 1 | - | - | - | |||
| Yes | 0.55 | 0.35–0.87 | 0.013 | 0.66 | 0.38–1.14 | 0.129 |
6. Ethical Considerations
7. Conclusions
Supplementary Files
Supplementary File 1Acknowledgments
Author Contributions
Conflicts of Interest
References
- Abdul-Wahab, S.A. Impact of fugitive dust emissions from cement plants on nearby communities. Ecol. Model. 2006, 195, 338–348. [Google Scholar] [CrossRef]
- Kabir, G.; Madugu, A.I. Assessment of environmental impact on air quality by cement industry and mitigating measures: A case study. Environ. Monit. Assess. 2010, 160, 91–99. [Google Scholar] [CrossRef] [PubMed]
- Al-Neaimi, Y.I.; Gomes, J.; Lloyd, O.L. Respiratory illnesses and ventilatory function among workers at a cement factory in a rapidly developing country. Occup. Med. 2001, 51, 367–373. [Google Scholar] [CrossRef]
- Mwaiselage, J.; Bråtveit, M.; Moen, B.; Mashalla, Y. Cement dust exposure and ventilatory function impairment: An exposure-response study. J. Occup. Environ. Med. 2004, 46, 658–667. [Google Scholar] [CrossRef] [PubMed]
- Neghab, M.; Choobineh, A. Work-related respiratory symptoms and ventilatory disorders among employees of a cement industry in Shiraz, Iran. J. Occup. Health 2007, 49, 273–278. [Google Scholar] [CrossRef]
- Zeleke, Z.K.; Moen, B.E.; Bråtveit, M. Cement dust exposure and acute lung function : A cross shift study. BMC Pulm. Med. 2010, 10, 1–8. [Google Scholar] [CrossRef] [PubMed]
- Bertoldi, M.; Borgini, A.; Tittarelli, A.; Fattore, E.; Cau, A.; Fanelli, R.; Crosignani, P. Health effects for the population living near a cement plant: An epidemiological assessment. Environ. Int. 2012, 41, 1–7. [Google Scholar] [CrossRef] [PubMed]
- Marcon, A.; Pesce, G.; Girardi, P.; Marchetti, P.; Blengio, G.; de Zolt Sappadina, S.; Falcone, S.; Frapporti, G.; Predicatori, F.; de Marco, R. Association between PM10 concentrations and school absences in proximity of a cement plant in northern Italy. Int. J. Hyg. Environ. Health 2014, 217, 386–391. [Google Scholar] [CrossRef] [PubMed]
- Dietz, A.; Ramroth, H.; Urban, T.; Ahrens, W.; Becher, H. Exposure to cement dust related occupational groups and laryngeal cancer risk: Results of a population based case-control study. Int. J. Cancer 2004, 108, 907–911. [Google Scholar] [CrossRef] [PubMed]
- Jakobsson, K.; Horstmann, V.; Wilinder, H. Mortality and cancer morbidity among cement workers. Brit. J. Ind. Med. 1993, 50, 264–272. [Google Scholar]
- Koh, D.-H.; Kim, T.-W.; Jang, S.; Ryu, H.-W. Dust exposure and the risk of cancer in cement industry workers in Korea. Amer. J. Ind. Med. 2013, 56, 276–281. [Google Scholar] [CrossRef]
- Cha, K.T.; Oh, S.S.; Yoon, J.H.; Lee, K.H.; Kim, S.K.; Cha, B.S.; Kim, S.H.; Eom, A.Y.; Koh, S.B. Adverse health outcomes in residents exposed to cement dust. Toxicol. Environ. Health Sci. 2012, 3, 239–244. [Google Scholar] [CrossRef]
- Mehraj, S.S.; Bhat, G.A.; Balkhi, H.M.; Gul, T. Health risks for population living in the neighborhood of a cement factory. Environ. Res. 2013, 7, 1044–1052. [Google Scholar]
- Performance, P.; Income, N.F.; Earnings, A.; Ratios, V. Zambia January 2014 Cement. 2014. Available online: https://www.google.co.zm/#q=Equity+research+Zambia+january+2014 (accessed on 1 December 2014).
- Nordby, K.-C.; Fell, A.K.M.; Notø, H.; Eduard, W.; Skogstad, M.; Thomassen, Y.; Bergamaschi, A.; Kongerud, J.; Kjuus, H. Exposure to thoracic dust airway symptoms and lung function in cement production workers. Eur. Respir. J. 2011, 38, 1278–1286. [Google Scholar] [CrossRef] [PubMed]
- Mwaiselage, J.; Bråtveit, M.; Moen, B.; Yost, M. Variability in dust exposure in a cement factory in Tanzania. Ann. Occup. Hyg. 2005, 49, 511–519. [Google Scholar] [CrossRef] [PubMed]
- Winkelstein, W. Outbreak of acute eye irritation associated with air pollution. Epidemiol. Aspect 1966, 81, 153–158. [Google Scholar]
- Crum-Cianflone, N.F. Bacterial, fungal, parasitic, and viral myositis. Clin. Microbiol. Rev. 2008, 21, 473–494. [Google Scholar] [CrossRef] [PubMed]
- Muluye, D.; Wondimeneh, Y.; Moges, F.; Nega, T.; Ferede, G. Types and drug susceptibility patterns of bacterial isolates from eye discharge samples at Gondar University Hospital, Northwest Ethiopia. BMC Res. Notes 2014, 7. [Google Scholar] [CrossRef] [PubMed]
- Mehraj, S.S.; Bhat, G.A.; Balkhi, H.M. Cement factories and human health. Int. J. Cur. Res. Rev. 2013, 5, 47–54. [Google Scholar]
- Chiba, T.; Kudara, N.; Abiko, Y.; Endo, M.; Suzuki, K.; Ishijima, K.; Sugai, T.; Ishijima, K.; Fukuda, K.; Yamazaki, K.; Sato, H. Effects of proton pump inhibitors in patients with laryngopharyngeal reflux disease. Hepato-Gastroenterolog 2011, 58, 1580–1582. [Google Scholar]
- Levine, H.L. Headaches and rhinosinusitis. In Sinus Surgery; Endoscopic and Microscopic Approaches; Levine, H.L., Clemente, P.M., Eds.; Thieme: New York, NY, USA, 2005; pp. 132–140. [Google Scholar]
- Staton, D.M.; Harding, M.H. Health and Environmental Effects of Cooking Stove Use in Developing Countries. Available online: https://www.bioenergylists.org/stovesdoc/Environment/staton.pdf (accessed on 25 December 2014).
- Lin, T.-C.; Krishnaswamy, G.; Chi, D.S. Incense smoke: Clinical, structural and molecular effects on airway disease. Clin. Mol. Allergy 2008, 6. [Google Scholar] [CrossRef]
- To, W.M.; Yeung, L.L. Effect of fuels on cooking fume emissions. Indoor Built. Environ. 2011, 20, 555–563. [Google Scholar] [CrossRef]
- Shusterman, D.; Murphy, M.A.; Balmes, J. Differences in nasal irritant sensitivity by age, gender, and allergic rhinitis status. Int. Arch. Occup. Environ. Health 2003, 76, 577–583. [Google Scholar] [CrossRef] [PubMed]
- Forsberg, B.; Stjernberg, N.; Wall, S.T.G. Prevalence of respiratory and hyperreactivity symptoms in relation to levels of criteria air pollutants in Sweden. Eur. J. Public Health 1997, 7, 291–296. [Google Scholar] [CrossRef]
- Buchanan, I.S.; Apte, M.G. Air Filter Materials and Building Related Symptoms in the BASE Study. Available online: http://indoor.lbl.gov/sites/all/files/lbnl-59663.pdf (accessed on 1 December 2014).
- Simukanga, S. Status of Air pollutIon in Zambia; School of Mines, University of Zambia: Lusaka, Zambia, 1999; pp. 1–9. Available online: http://www.sei-international.org/mediamanager/documents/Projcts/Atmospheric/RapidC/AirPolZam.PDF (accessed on 7 January 2015).
- Zambia 2010 Census of Population and Housing; CSO: Lusaka, Zambia, 2012.
© 2015 by the authors; licensee MDPI, Basel, Switzerland. This article is an open access article distributed under the terms and conditions of the Creative Commons Attribution license (http://creativecommons.org/licenses/by/4.0/).
Share and Cite
Nkhama, E.; Ndhlovu, M.; Dvonch, J.T.; Siziya, S.; Voyi, K. Prevalence and Determinants of Mucous Membrane Irritations in a Community Near a Cement Factory in Zambia: A Cross Sectional Study. Int. J. Environ. Res. Public Health 2015, 12, 871-887. https://doi.org/10.3390/ijerph120100871
Nkhama E, Ndhlovu M, Dvonch JT, Siziya S, Voyi K. Prevalence and Determinants of Mucous Membrane Irritations in a Community Near a Cement Factory in Zambia: A Cross Sectional Study. International Journal of Environmental Research and Public Health. 2015; 12(1):871-887. https://doi.org/10.3390/ijerph120100871
Chicago/Turabian StyleNkhama, Emmy, Micky Ndhlovu, J. Timothy Dvonch, Seter Siziya, and Kuku Voyi. 2015. "Prevalence and Determinants of Mucous Membrane Irritations in a Community Near a Cement Factory in Zambia: A Cross Sectional Study" International Journal of Environmental Research and Public Health 12, no. 1: 871-887. https://doi.org/10.3390/ijerph120100871