
Climate Change Effects on Heat- and Cold-Related Mortality in the Netherlands: A Scenario-Based Integrated Environmental Health Impact Assessment

Abstract
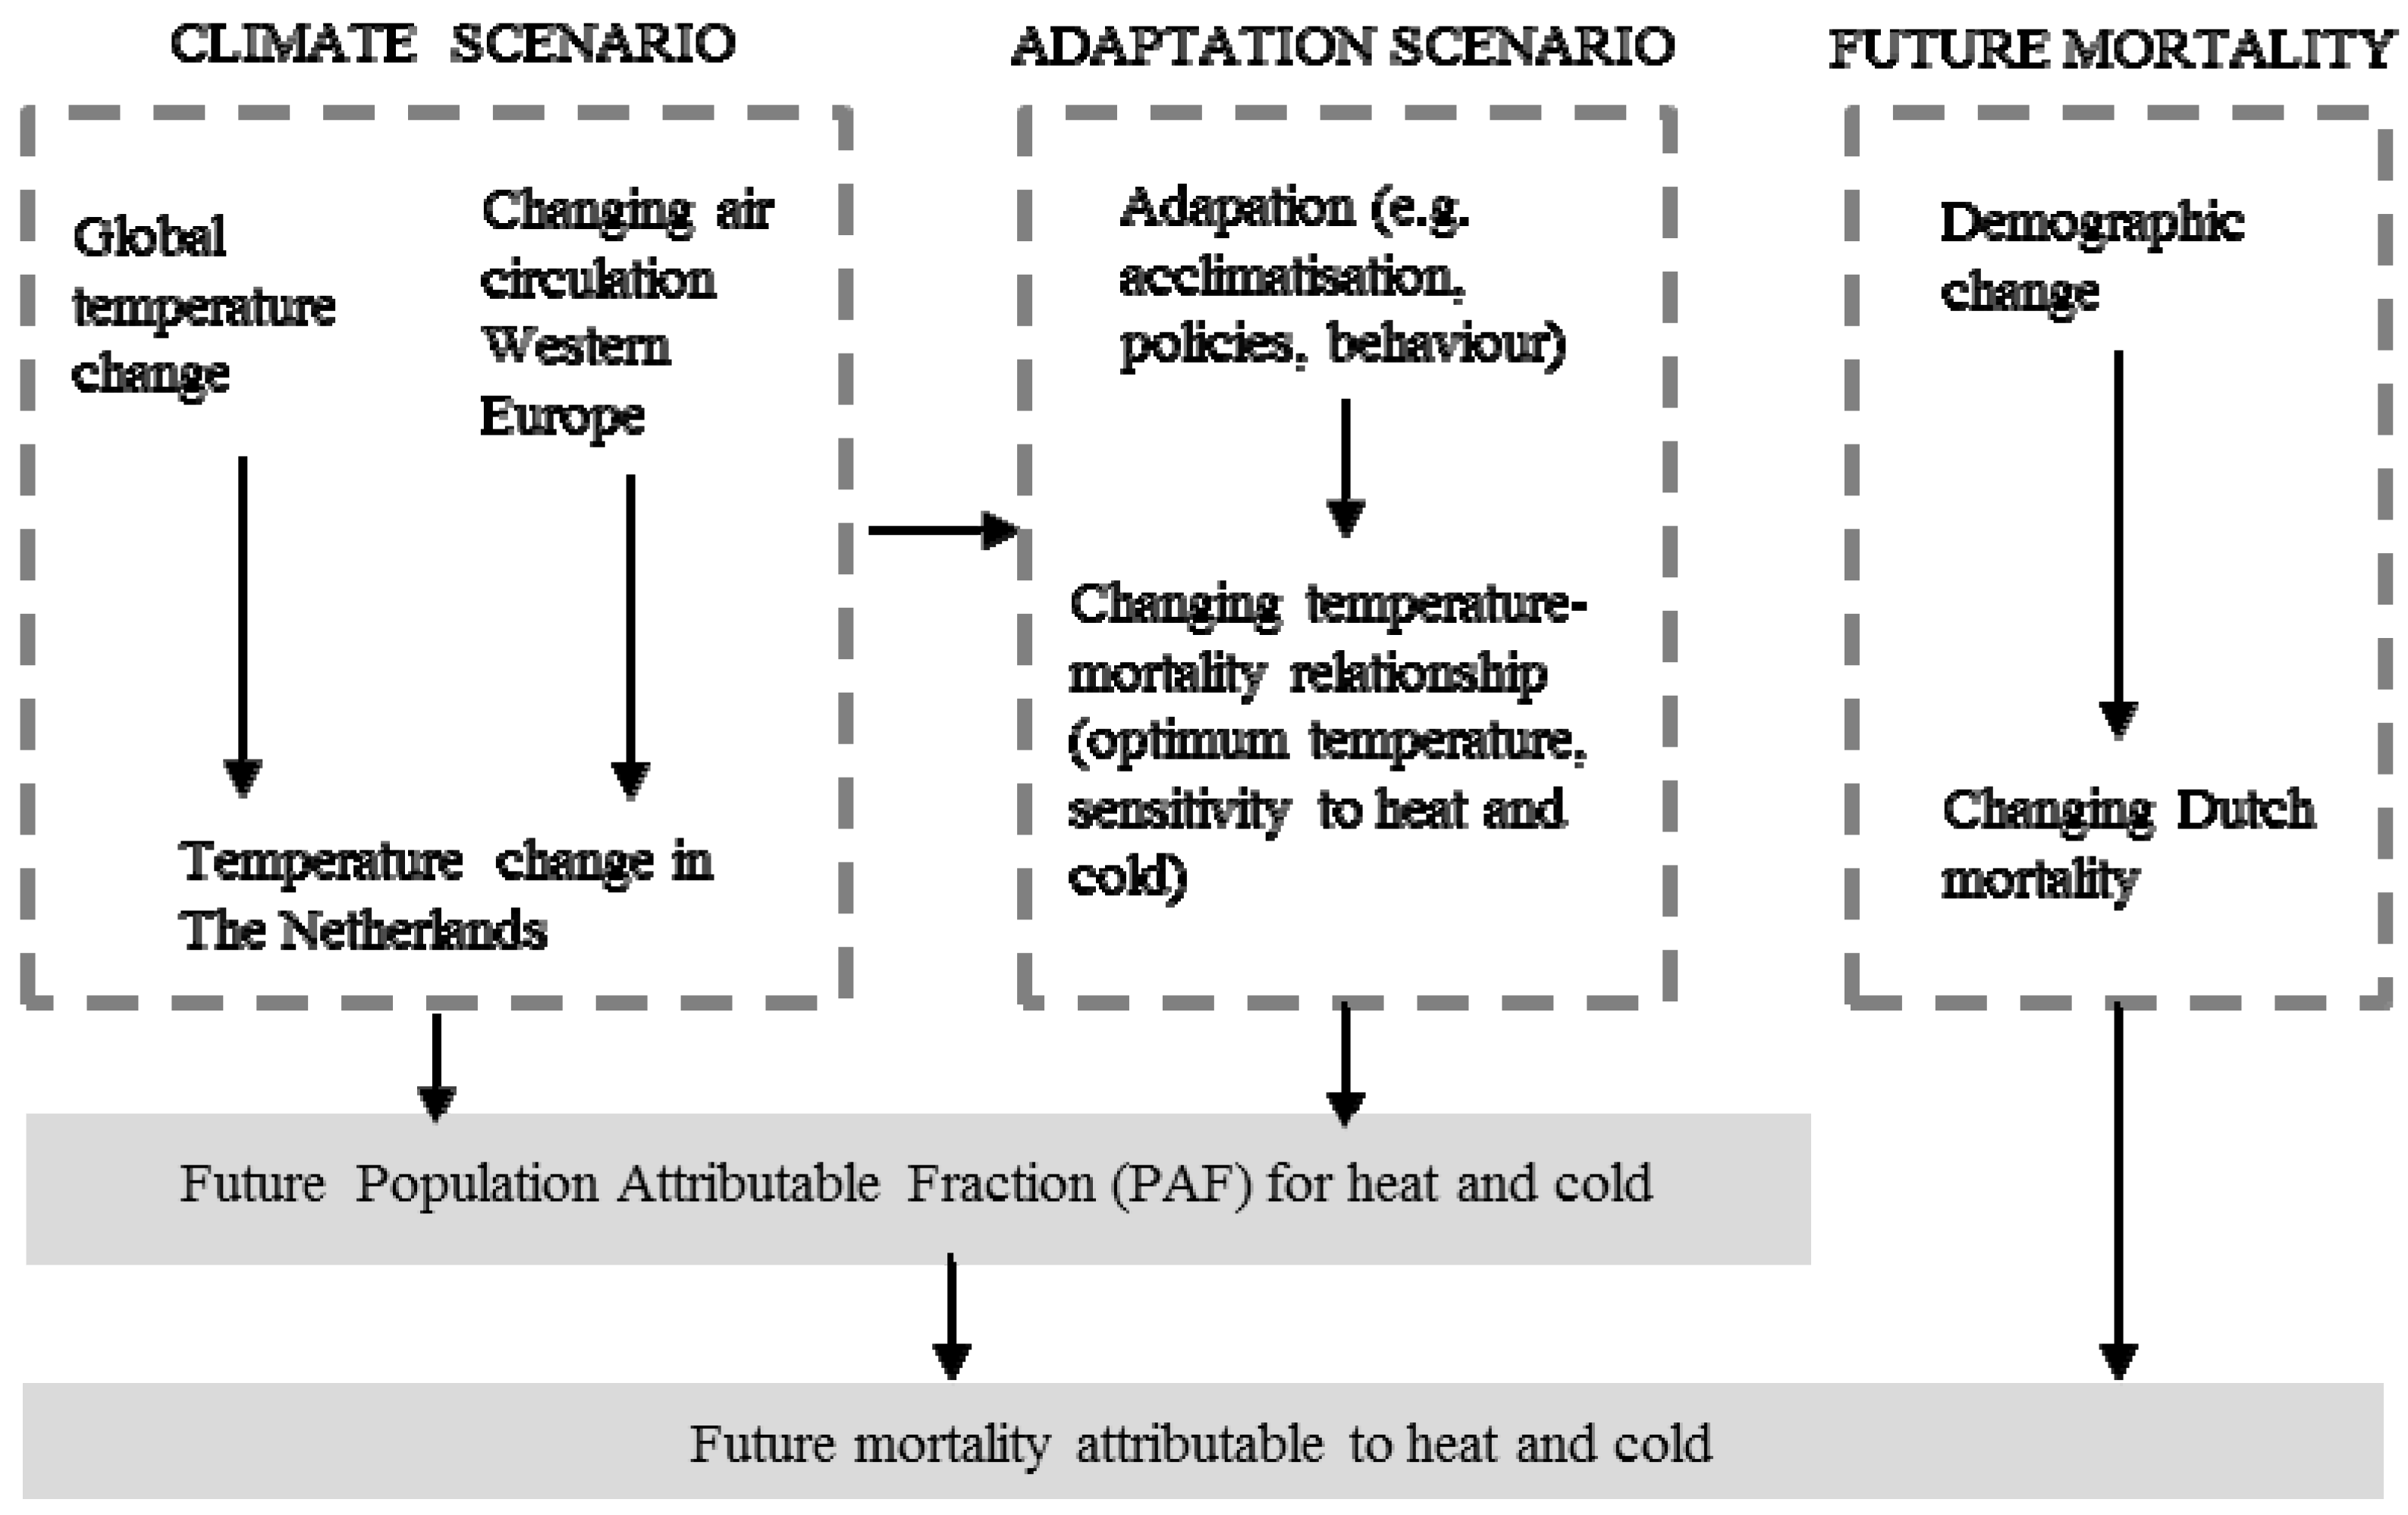
:1. Introduction
2. Methods

2.1. Observed Temperature–Mortality Relationship
2.2. KNMI’14 Climate Change Scenarios

| KNMI’14 Scenario | Mean Temperature Increase in De Bilt (the Netherlands) in 2050, Compared to the Baseline Period 1981–2010 * (per Season **) | ||||||
|---|---|---|---|---|---|---|---|
| Name *** | Global Temperature Rise on Earth | Change in Air Circulation Patterns in Western Europe | Spring | Summer | Autumn | Winter | Annual |
| KNMI’14-GL | 1 °C around 2050 1.5 °C around 2085 | Low value | +0.9 °C | +1.1 °C | +1.1 °C | +1.2 °C | +1.1 °C |
| KNMI’14-GH | 1 °C around 2050 1.5 °C around 2085 | High value **** | +1.2 °C | +1.4 °C | +1.4 °C | +1.8 °C | +1.5 °C |
| KNMI’14-W | 2 °C around 2050 3.5 °C around 2085 | Low value | +1.9 °C | +1.8 °C | +2.3 °C | +2.3 °C | +2.1 °C |
| KNMI’14-W | 2 °C around 2050 3.5 °C around 2085 | High value **** | +2.1 °C | +2.4 °C | +2.4 °C | +2.8 °C | +2.4 °C |
2.3. Adaptation Scenarios
| Future Adaptation Scenario | Scenario Assumption | Optimum Temperature (for All Selected Causes) | Sensitivity to Heat (Slope ERF) * | Sensitivity to Cold (Slope ERF) ** |
|---|---|---|---|---|
| No adaptation | Baseline values (based on [37]). | 16.5 °C for all KNMI’14 scenarios | 2.72% for total mortality, 1.86% for cardiovascular mortality, 12.82% for respiratory mortality | 1.37% for total mortality, 1.69% for cardiovascular mortality, 5.15% for respiratory mortality |
| Adaptation scenario I | Optimum temperature level increases proportional to annual temperature increase | KNMI’14-GL: 17.6 °C KNMI’14-GH: 18.0 °C KNMI’14-WL: 18.6 °C KNMI’14-WH: 18.9 °C | 2.72% for total mortality, 1.86% for cardiovascular mortality, 12.82% for respiratory mortality | 1.37% for total mortality, 1.69% for cardiovascular mortality, 5.15% for respiratory mortality |
| Adaptation scenario II | 10% decrease in sensitivity to heat; 10% increase to sensitivity in cold | 16.5 °C for all KNMI’14 scenarios | 2.45% for total mortality, 1.67% for cardiovascular mortality, 11.54% for respiratory mortality | 1.51% for total mortality, 1.86% for cardiovascular mortality, 5.67% for respiratory mortality |
| Adaptation scenario III | I and II combined | KNMI’14-GL: 17.6 °C KNMI’14-GH: 18.0 °C KNMI’14-WL: 18.6 °C KNMI’14-WH: 18.9 °C | 2.45% for total mortality, 1.67% for cardiovascular mortality, 11.54% for respiratory mortality | 1.51% for total mortality, 1.86% for cardiovascular mortality, 5.67% for respiratory mortality |
2.4. Baseline and Future Mortality Data
2.5. Modelling Population Attributable Fractions of Mortality Due to Heat and Cold Exposure
- RRheat = exp(βheat × Eheat)
- βheat = ln[(ERFheat/100) + 1]
- ERFheat = % change in mortality per 1 °C increase in Eheat
- Eheat = temperature exposure above the threshold/optimum temperature (in °C)
- RRcold = exp(βcold × Ecold)
- βcold = ln[(ERFcold/100) + 1]
- ERFcold = % change in mortality per 1 °C increase in Ecold
- Ecold = temperature exposure below the threshold/optimum temperature (1 °C)
2.6. Modelling the Number of Deaths Attributable to Heat and Cold Exposure
3. Results
3.1. Baseline and Future Exposure to Heat and Cold
| Climate Scenario | Adaptation Assumption Regarding Optimum Temperature Level in 2050 | |||
|---|---|---|---|---|
| No Shift in Optimum Temperature Compared to Baseline * | Optimum Temperature Level Increases Proportional to Annual Temperature Increase ** | |||
| Exposure to Heat | Exposure to Cold | Exposure to Heat | Exposure to Cold | |
| Baseline | 0.43 | 6.85 | 0.43 | 6.85 |
| KNMI’14-GL | 0.62 | 6.01 | 0.42 | 6.90 |
| KNMI’14-GH | 0.70 | 5.72 | 0.42 | 6.93 |
| KNMI’14-WL | 0.82 | 5.20 | 0.39 | 6.87 |
| KNMI’14-WH | 0.95 | 4.99 | 0.43 | 6.86 |
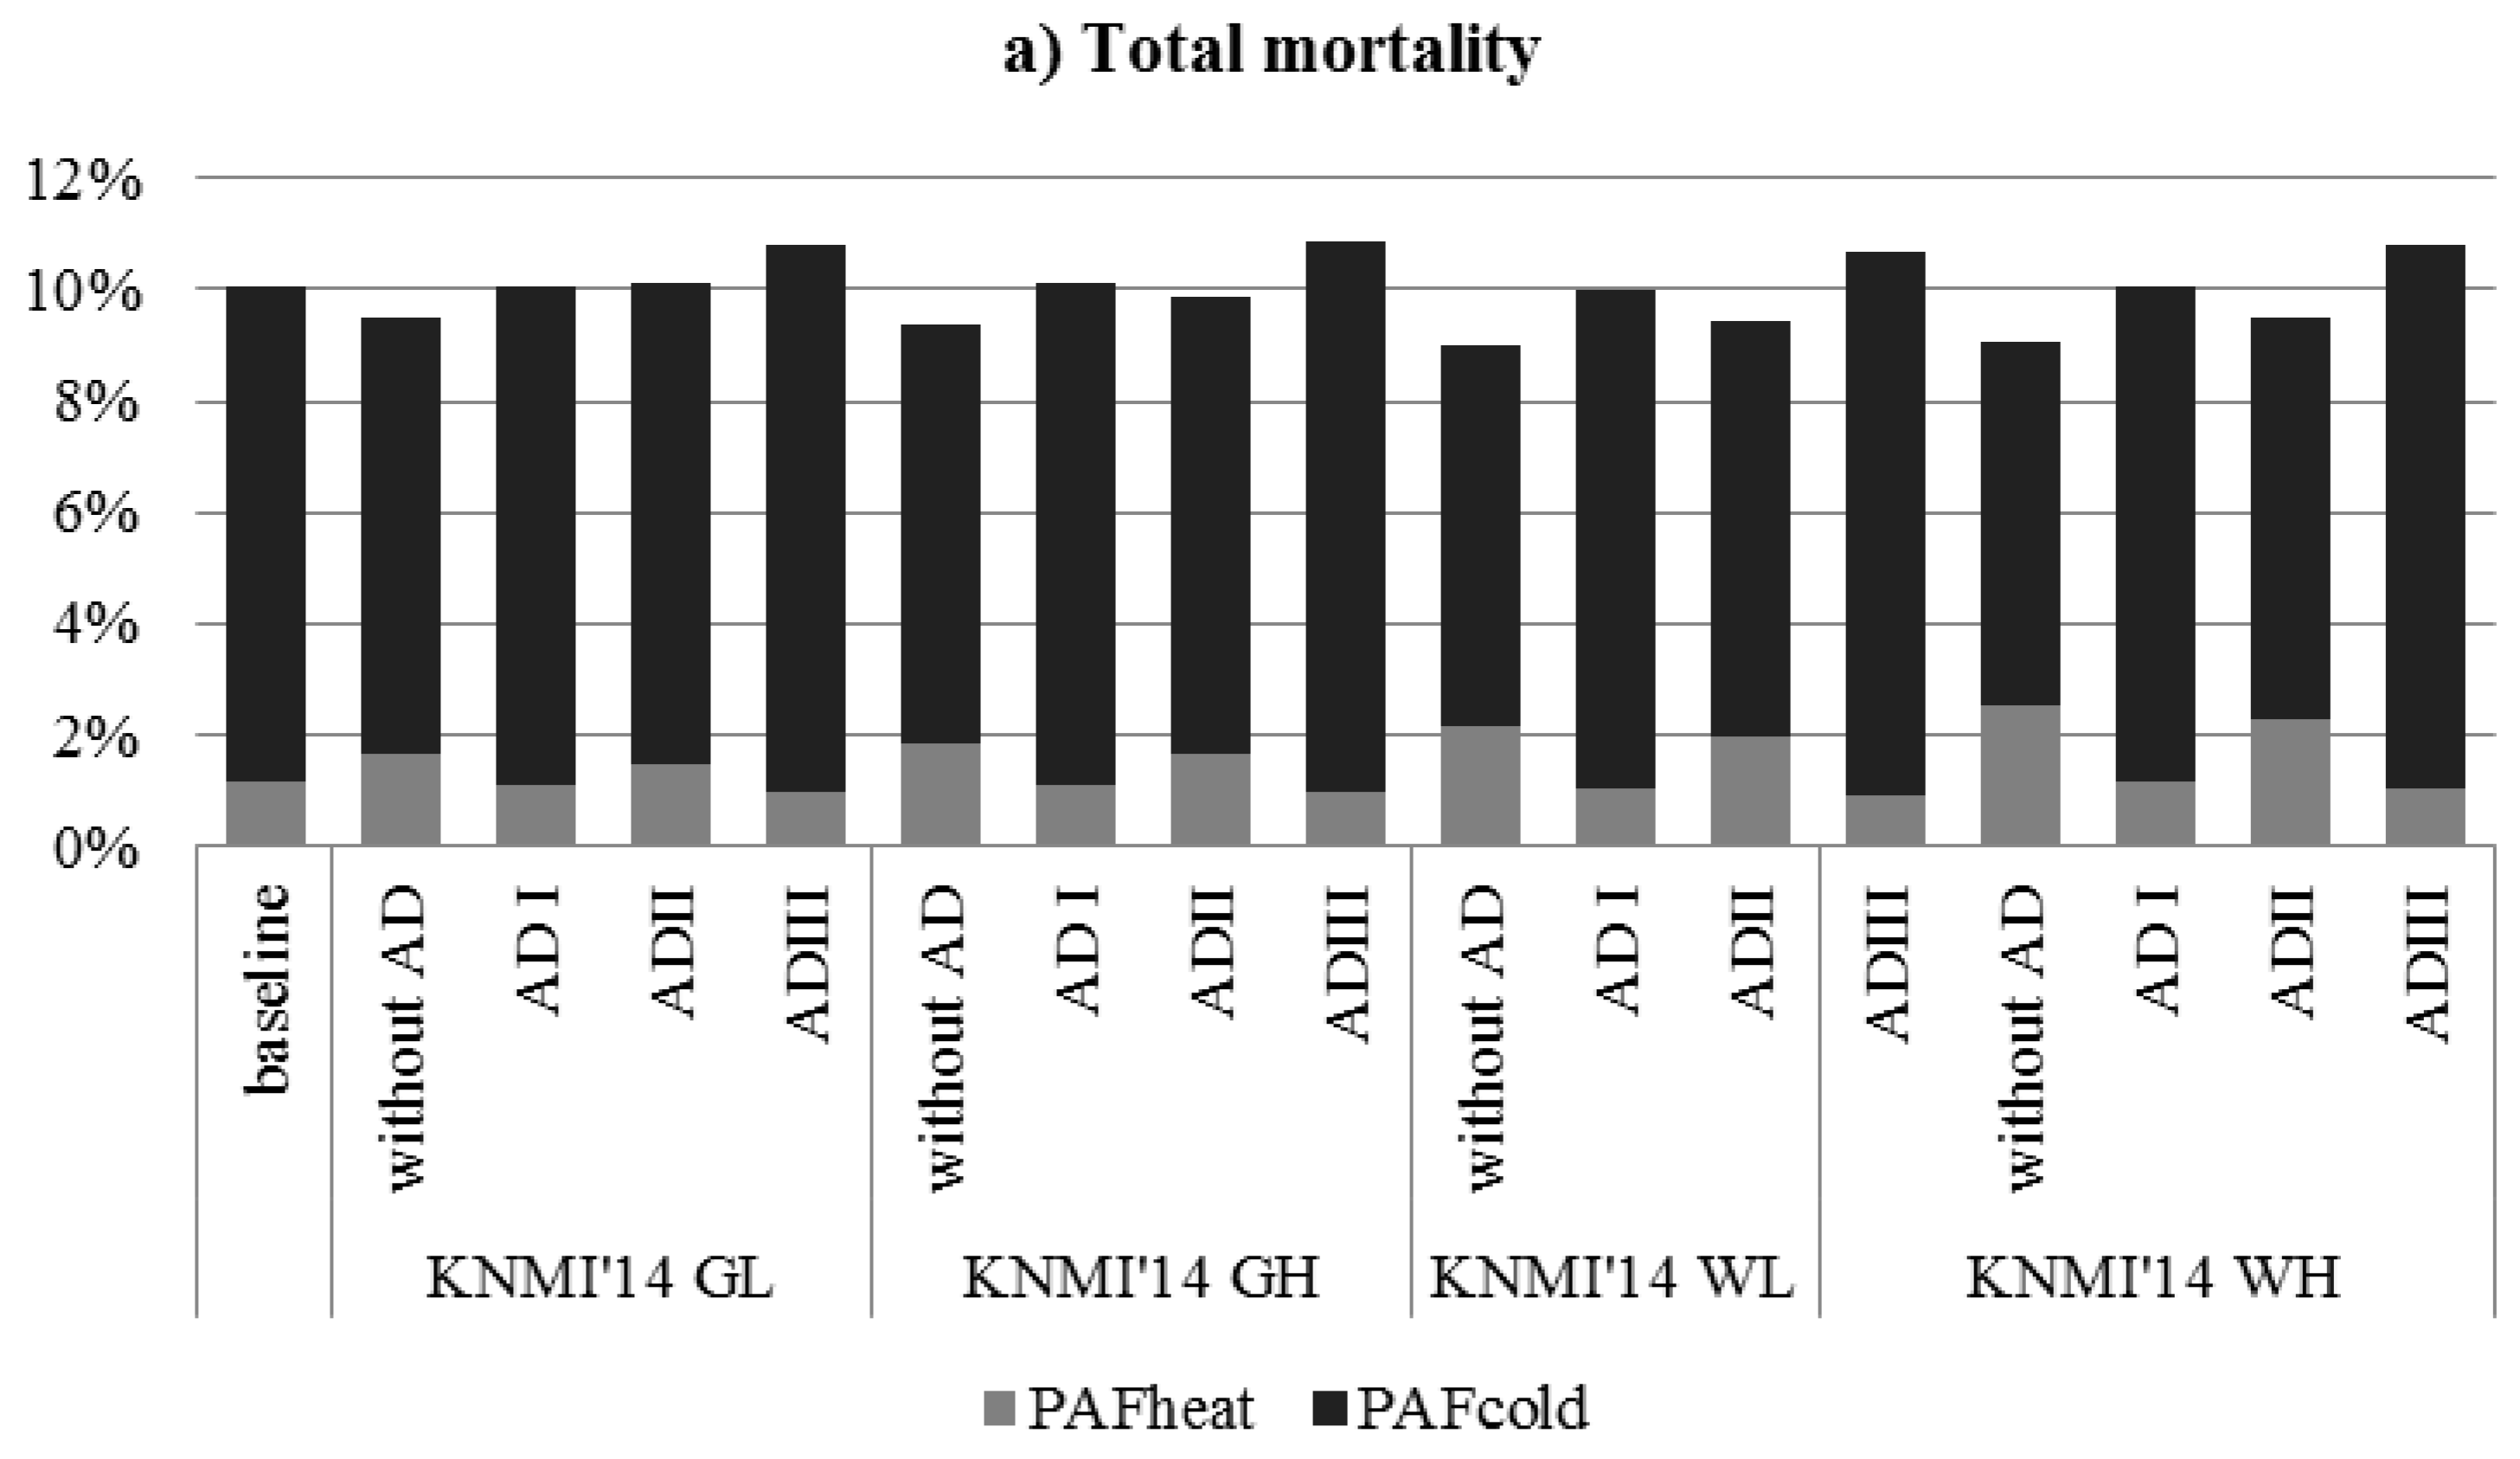
3.2. Population Attributable Fractions of Mortality Due to Heat and Cold


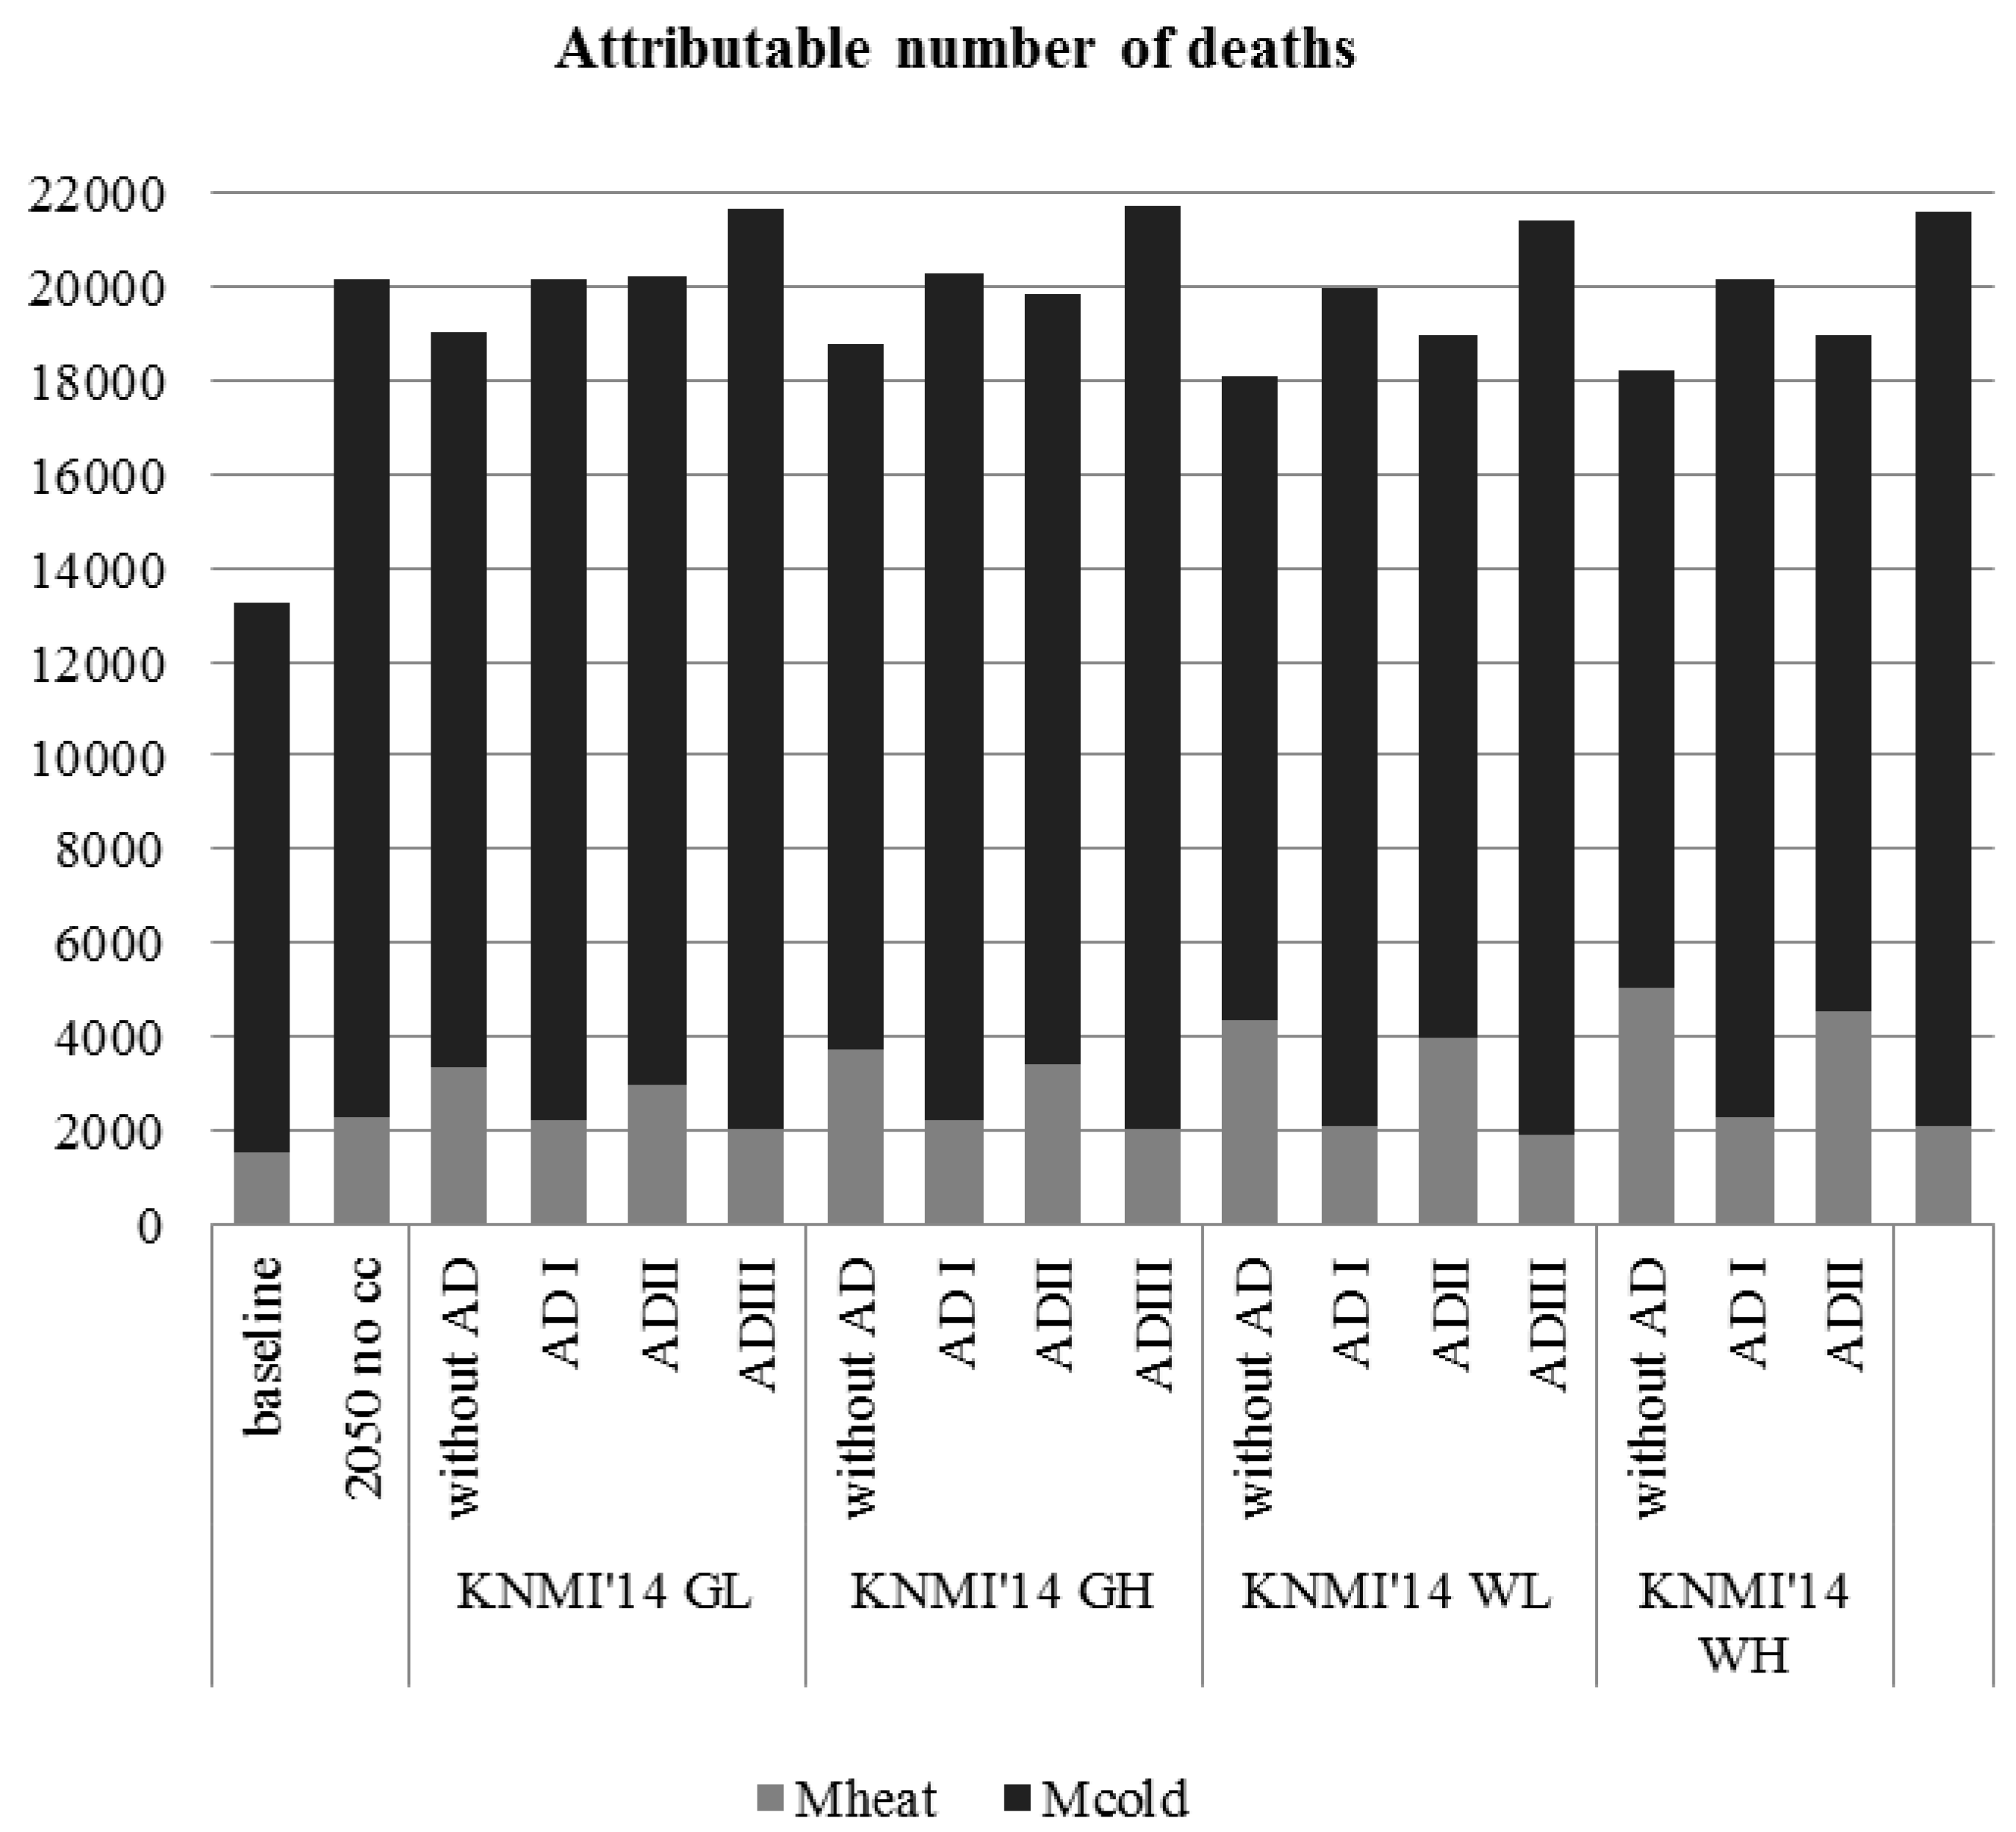
3.3. Baseline and Future Mortality Due to Heat and Cold Exposure

4. Discussion
5. Conclusions
Acknowledgments
Author Contributions
Conflicts of Interest
Appendix
| Total Mortality | ||||
|---|---|---|---|---|
| Climate Scenario | Adaptation Scenario * | PAFheat | PAFcold | PAFtemperature |
| Baseline (1981–2010) | n.a. | 1.15% | 8.90% | 10.05% |
| KNMI’14 GL | no adaptation | 1.66% | 7.85% | 9.51% |
| I | 1.11% | 8.96% | 10.07% | |
| II | 1.50% | 8.59% | 10.09% | |
| III | 1.00% | 9.80% | 10.81% | |
| KNMI’14 GH | no adaptation | 1.87% | 7.49% | 9.36% |
| I | 1.11% | 9.00% | 10.11% | |
| II | 1.69% | 8.20% | 9.89% | |
| III | 1.00% | 9.85% | 10.85% | |
| KNMI’14 WL | no adaptation | 2.18% | 6.83% | 9.02% |
| I | 1.04% | 8.92% | 9.96% | |
| II | 1.97% | 7.48% | 9.46% | |
| III | 0.94% | 9.76% | 10.70% | |
| KNMI’14 WH | no adaptation | 2.52% | 6.56% | 9.08% |
| I | 1.14% | 8.91% | 10.06% | |
| II | 2.28% | 7.19% | 9.46% | |
| III | 1.03% | 9.75% | 10.79% | |
| Cardiovascular Mortality | ||||
|---|---|---|---|---|
| Climate Scenario | Adaptation Scenario * | PAFheat | PAFcold | PAFtemperature |
| Baseline (1981–2010) | n.a. | 0.79% | 10.85% | 11.64% |
| KNMI’14 GL | no adaptation | 1.14% | 9.58% | 10.72% |
| I | 0.77% | 10.92% | 11.68% | |
| II | 1.03% | 10.47% | 11.50% | |
| III | 0.69% | 11.93% | 12.62% | |
| KNMI’14 GH | no adaptation | 1.29% | 9.14% | 10.43% |
| I | 0.76% | 10.97% | 11.73% | |
| II | 1.16% | 10.00% | 11.17% | |
| III | 0.69% | 11.99% | 12.68% | |
| KNMI’14 WL | no adaptation | 1.51% | 8.35% | 9.85% |
| I | 0.71% | 10.87% | 11.59% | |
| II | 1.36% | 9.14% | 10.49% | |
| III | 0.64% | 11.88% | 12.53% | |
| KNMI’14 WH | no adaptation | 1.74% | 8.01% | 9.76% |
| I | 0.79% | 10.86% | 11.65% | |
| II | 1.57% | 8.77% | 10.34% | |
| III | 0.71% | 11.87% | 12.58% | |
| Respiratory Mortality | ||||
|---|---|---|---|---|
| Climate Scenario | Adaptation Scenario * | PAFheat | PAFcold | PAFtemperature |
| Baseline (1981–2010) | n.a. | 5.05% | 29.11% | 34.16% |
| KNMI’14 GL | no adaptation | 7.25% | 26.04% | 33.29% |
| I | 4.90% | 29.28% | 34.18% | |
| II | 6.58% | 27.05% | 34.44% | |
| III | 4.45% | 31.62% | 36.07% | |
| KNMI’14 GH | no adaptation | 8.14% | 24.98% | 33.12% |
| I | 4.89% | 29.40% | 34.29% | |
| II | 7.40% | 27.05% | 34.44% | |
| III | 4.43% | 31.76% | 36.19% | |
| KNMI’14 WL | no adaptation | 9.45% | 22.99% | 32.44% |
| I | 4.59% | 29.17% | 33.75% | |
| II | 8.60% | 24.92% | 33.52% | |
| III | 4.16% | 31.51% | 35.67% | |
| KNMI’14 WH | no adaptation | 10.86% | 22.15% | 33.00% |
| I | 5.04% | 29.15% | 34.19% | |
| II | 9.88% | 24.02% | 33.90% | |
| III | 4.58% | 31.48% | 36.06% | |
| Climate Scenario | Adaptation Scenario ** | Number of Deaths Attributable to Heat (% of Baseline) | Number of Deaths Attributable to Cold (% of Baseline) |
|---|---|---|---|
| baseline | 1511 (100%) | 11,727 (100%) | |
| 2050 no climate change * | n.a. | 2299 (152%) | 17,846 (152%) |
| KNMI’14 GL * | no adaptation | 3329 (220%) | 15,733 (134%) |
| I | 2230 (148%) | 17,965 (153% | |
| II | 3002 (199%) | 17,226 (147%) | |
| III | 2011 (133%) | 19,657 (168%) | |
| KNMI’14 GH * | no adaptation | 3752 (248%) | 15,020 (128%) |
| I | 2222 (147% | 18,052 (154%) | |
| II | 3384 (224%) | 16,447 (140%) | |
| III | 2004 (133%) | 19,753 (168%) | |
| KNMI’14 WL * | no adaptation | 4380 (290%) | 13,699 (117%) |
| I | 2083 (138%) | 17,886 (153%) | |
| II | 3952 (262%) | 15,007 (128%) | |
| III | 1879 (124%) | 19,572 (167%) | |
| KNMI’14 WH * | no adaptation | 5061 (335%) | 13,149 (112%) |
| I | 2295 (152%) | 17,872 (152%) | |
| II | 4567 (302%) | 14,406 (123%) | |
| III | 2070 (137%) | 19,556 (167%) |
References
- IPCC. Climate Change 2013: The Physical Science Basis: Summary for Policymakers; Intergovermental Panel on Climate Change, Working Group I Contribution to the IPCC Fifth Assessment Report; IPCC: Geneva, Switzerland, 2013. [Google Scholar]
- Costello, A.; Abbas, M.; Allen, A.; Ball, S.; Bell, S.; Bellamy, R.E.A. Managing the health effects of climate change. Lancet 2009, 373, 1693–1733. [Google Scholar] [CrossRef]
- McMichael, A.J. Insights from past millenia into climatic impacts on human health survival. Proc. Natl. Acad. Sci. USA 2012, 109, 4730–4737. [Google Scholar] [CrossRef] [PubMed]
- Anstey, M. Climate change and health—What’s the problem? Glob. Health 2013, 9. [Google Scholar] [CrossRef] [PubMed]
- Patz, J.A.; Frumkin, H.; Holloway, T.; Vimont, D.J.; Haines, A. Climate change: Challenges and opportunities for global health. JAMA 2014, 312, 1565–1580. [Google Scholar] [CrossRef] [PubMed]
- IPCC. Climate Change 2014: Impacts, Adaptation and Vulnerability; Working Group II Contribution to the IPCC Fifth Assessment Report; IPCC: Geneva, Switzerland, 2014. [Google Scholar]
- Watts, N.; Adger, W.N.; Agnolucci, P.; Blackstock, J.; Byass, P.; Cai, W.; Chaytor, S.; Colbourn, T.; Collins, M.; Cooper, A.; et al. Health and climate change: Policy responses to protect public health. Lancet 2015, 6. [Google Scholar] [CrossRef]
- Whitmee, S.; Haines, A.; Beyrer, C.; Boltz, F.; Capon, A.G.; de Souza Dias, B.F.; Ezeh, A.; Frumkin, H.; Gong, P.; Head, P.; et al. Safeguarding human health in the anthropocene epoch: Report of the Rockefeller Foundation-Lancet Commission on Planetary Health. Lancet 2015, 7. [Google Scholar] [CrossRef]
- Schram-Bijkerk, D. Programma Klimaat en Gezondheid van ZonMw-nut en Noodzaak voor Politiek Den Haag; RIVM Briefrapport 630028001/2010; RIVM: Bilthoven, The Netherlands, 2010. [Google Scholar]
- Gezondheidsraad. Mondiale Milieu-Invloed op Onze Gezondheid; Gezondheidsraad; Publicatienr: Den Haag, The Netherlands, 2009. [Google Scholar]
- Huynen, M.; van Vliet, A. Klimaatverandering en gezondheid in Nederland. Ned Tijdschr Geneeskd 2009, 153, A1515–A1521. [Google Scholar] [PubMed]
- Huynen, M.; van Vliet, A. Programmavoorstel Klimaat en Gezondheid. Opgesteld op Verzoek van en in Samenwerking met ZonMw en Kennis voor Klimaat; ICIS Maastricht University: Maastricht, The Netherlands, 2009. [Google Scholar]
- Huynen, M.; de Hollander, G.; Martens, P.; Mackenbach, J.P. De gezonde wereld: Gezondheidseffecten van klimaatverandering. Tijdschrift voor Gezondheidswetenschappen 2009, 87, 140–142. [Google Scholar] [CrossRef]
- Kennis voor Klimaat/Klimaat voor Ruimte. Verslag Oploopdebat Klimaat en Gezondheid, Amsterdam, 18 September 2008; Kennis voor Klimaat: Utrecht, The Netherlands, 2008. [Google Scholar]
- Huynen, M.; de Hollander, A.; Martens, P.; Mackenbach, J. Mondiale Milieuveranderingen en Volksgezondheid: Stand van de Kennis; RIVM: Bilthoven, The Netherlands, 2008. [Google Scholar]
- The Netherlands Court of Audits. Adaptation to Climate Change: Strategy and Policy; The Netherlands Court of Audits: The Hague, The Netherlands, 2012.
- Wuijts, S.; Vros, C.; Schets, F.; Braks, M. Effecten van Klimaat op Gezondheid: Actualisatie voor de Nationale Adaptatiestrategie (2016); Rijksinstituut voor Volksgezondheid en Milieu (RIVM): Bilthoven, The Netherlands, 2014. [Google Scholar]
- Gasparrini, A.; Guo, Y.; Hashizume, M.; Lavigne, E.; Zanobetti, A.; Schwartz, J.; Tobias, A.; Tong, S.; Rocklov, J.; Forsberg, B.; et al. Mortality risk attributable to high and low ambient temperature: A multicountry observational study. Lancet 2015, 386, 369–375. [Google Scholar] [CrossRef]
- Huang, C.; Barnett, A.; Wang, X.; Vaneckova, P.; FizGerald, G.; Tong, S. Projecting future heat-related mortality under climate change scenarios: A systematic review. Environ. Health Perspect. 2011, 119, 1681–1690. [Google Scholar] [CrossRef] [PubMed] [Green Version]
- McMichael, A.; Wilkinson, P.; Kovas, R.; Pattenden, S.; Hajat, S.; Armstrong, B.; Vajanapoom, N.; Niciu, E.M.; Mahomed, H.; Kingkeow, C.; et al. International study of temperature, heat and urban mortality: The “ISOTHURM” project. Int. J. Epidemiol. 2008, 37, 1121–1131. [Google Scholar] [CrossRef] [PubMed]
- Hajat, S.; Vardoulakis, S.; Heaviside, C.; Eggen, B. Climate change effects on human health: Projections of temperature-related mortality for the UK during the 2020s, 2050s and 2080s. J. Epidemiol. Community Health 2014, 68, 641–648. [Google Scholar] [CrossRef] [PubMed]
- Briggs, D. Integrated Assessment of Health Risks of Environmental Stressors in Europe: INTARESE Final Activity Report: 2011. Available online: http://www.intarese.org/sites/intarese.org/files/INTARESE%20Final%20Project%20Report_Text.pdf (accessed on 17 August 2015).
- Briggs, D.J. A framework for integrated environmental health impact assessment of systemic risks. Environ. Health 2008, 7. [Google Scholar] [CrossRef] [PubMed]
- UNEP. Global Environmental Outlook 3; Earthscan: London, UK, 2002. [Google Scholar]
- Alberdi, J.; Diaz, J.; Montero, J.; Miron, I. Daily mortality in Madrid community 1986–1992: Relationship with meteorological variables. Eur. J. Epidemiol. 1998, 14, 571–578. [Google Scholar] [CrossRef] [PubMed]
- Ballester, F.; Corella, D.; Perez-Hoyos, S.; Saez, M.; Hervas, A. Mortality as a function of temperature; a study in Valencia, Spain, 1991–1993. Int. J. Epidemiol. 1997, 26, 551–561. [Google Scholar] [CrossRef] [PubMed]
- Rooney, C.; McMichael, A.J.; Kovats, R.S.; Coleman, M.P. Excess mortality in England and Wales, and in greater London, during the 1995 heatwave. J. Epidemiol. Community Health 1998, 53, 482–486. [Google Scholar] [CrossRef]
- Pan, W.; Li, L.; Tsai, M. Temperature extremes and mortality from coronary hearth disease and cerebral infarction in elderly Chinese. Lancet 1995, 345, 353–355. [Google Scholar] [CrossRef]
- Kunst, A.E.; Looman, C.W.N.; Mackenbach, J.P. Outdoor temperature and mortality in The Netherlands: A time-series analysis. Am. J. Epidemiol. 1993, 137, 331–341. [Google Scholar] [PubMed]
- Lindeboom, W.; Alam, N.; Begum, D.; Streatfield, P. The association of meteorological factors and mortality in rural Bangladesh, 1983–2009. Glob. Health Action 2012, 5, 61–73. [Google Scholar] [CrossRef] [PubMed]
- Wu, W.; Xiao, Y.; Li, G.; Zeng, W.; Lin, H.; Rutherford, S.; Xu, Y.; Luo, Y.; Xu, X.; Chu, C.; et al. Temperature–mortality relationship in four subtropical Chinese cities: A time-series study using a distributed lag non-linear model. Sci. Total Environ. 2013, 449, 355–362. [Google Scholar] [CrossRef] [PubMed]
- Baccini, M.; Biggeri, A.; Acetta, G.; Kosatky, T.; Katsouyanni, K.; Analitis, A.; Anderson, H.; Bisanti, L.; D’Ipolliti, D.; Danova, J.; et al. Heat effects on mortality in 15 European cities. Epidemiology 2008, 19, 711–719. [Google Scholar] [CrossRef] [PubMed]
- Tawatsupa, B.; Dear, K.; Kjellstrom, T.; Sleigh, A. The association between temperature and mortality in tropical middle income Thailand from 1999 to 2008. Int. J. Biometeorol. 2012, 10. [Google Scholar] [CrossRef] [PubMed]
- Hajat, S.; Kosatky, T. Heat-related mortality: A review and exploration of heterogeneity. J. Epidemiol. Community Health 2010, 64, 753–760. [Google Scholar] [CrossRef] [PubMed]
- Yu, W.; Mengersen, K.; Wang, W.; Ye, W.; Guo, Y.; Pan, X.; Tong, S. Daily average temperature and mortality among the elderly: A meta-analysis and systematic review of epidemiological evidence. Int. J. Biometeorol. 2011, 56, 569–581. [Google Scholar] [CrossRef] [PubMed] [Green Version]
- Gasparrini, A.; Guo, Y.; Hashizume, M.; Kinney, P.L.; Petkova, E.P.; Lavigne, E.; Zanobetti, A.; Schwartz, J.D.; Tobias, A.; Leone, M.; et al. Temporal variation in heat-mortality associations: A multicountry study. Environ. Health Perspect. 2015, 1. [Google Scholar] [CrossRef] [PubMed] [Green Version]
- Huynen, M.M.T.E.; Martens, P.; Schram, D.; Weijenberg, M.P.; Kunst, A.E. The impact of heat waves and cold spells on mortality rates in the Dutch population. Environ. Health Perspect. 2001, 109, 463–470. [Google Scholar] [CrossRef] [PubMed]
- KNMI. KNMI’14 Climate Scenarios for the Netherlands; Royal Netherlands Meteorological Institute (KNMI): De Bilt, The Netherlands, 2014. [Google Scholar]
- Van den Hurk, B.; Siegmund, P.; Klein Tank, A. KNMI’14: Climate Change Scenarios for the 21st Century—A Netherlands Perspective; Royal Netherlands Meteorological Institute (KNMI): De Bilt, The Netherlands, 2014. [Google Scholar]
- KNMI. KNMI’14 Climate Scenarios: Time Series Transformation Tool. Royal Netherlands Meteorological Institute, 2014. Available online: http://www.klimaatscenarios.nl/toekomstig_weer/transformatie/index (accessed on 17 August 2015).
- KNMI. KNMI’14 Scenarios Kaarten, Grafieken en Tabellen: Gemiddelde Temperatuur. Available online: http://www.klimaatscenarios.nl/getallen/overzicht.php?wel=temperatuur&ws=tabel&wom=gemiddelde (accessed on 17 August 2015).
- Braga, A.L.F.; Zanobetti, A.; Schwartz, J. The effect of weather on respiratory and cardiovascular deaths in 12 U.S. cities. Environ. Health Perspect. 2002, 110, 859–863. [Google Scholar] [CrossRef] [PubMed]
- Curriero, F.C.; Heiner, K.S.; Samet, J.M.; Zeger, S.L.; Strug, L.; Patz, J.A. Temperature and mortality in 11 cities of the Eastern United States. Am. J. Epidemiol. 2002, 155, 80–87. [Google Scholar] [CrossRef] [PubMed]
- Keatinge, W.R.; Donaldson, G.C.; Cordioli, E.; Martinelli, M.; Kunst, A.E.; Mackenbach, J.P.; Nayha, S.; Vuori, I. Heat related mortality in warm and cold regions of Europe: Observational study. BMJ 2000, 321, 670–673. [Google Scholar] [CrossRef] [PubMed]
- McMichael, A.J.; Campbell-Lendrum, D.; Kovats, R.S.; Edwards, S.; Wilkonson, P.; Wilson, T.; Nicholls, R.; Hales, S.; Tanser, F.C.; Le Sueur, D.; et al. Global climate change. In Comparative Quantification of Health Risks; Ezzati, M., Lopez, A.D., Rodgers, A., Murray, C.J.L., Eds.; World Health Organization: Geneva, Switzerland, 2004. [Google Scholar]
- Dessai, S.R. Heat stress and mortality in Lisbon Part II: An assessment of the potential impacts of climate change. Int. J. Biometeorol. 2003, 48, 37–44. [Google Scholar] [CrossRef] [PubMed]
- Gosling, S.N.; McGregor, G.R.; Lowe, J.A. Climate change and heat-related mortality in six cities Part 2: Climate model evaluation and projected impacts from changes in the mean and variability of temperature with climate change. Int. J. Biometeorol. 2009, 53, 31–51. [Google Scholar] [CrossRef] [PubMed]
- The Eurowinter Group. Cold exposure and winter mortality from ischemic heart disease, cerebrovascular disease, respiratory disease, and all causes in warm and cold regions of Europe. Lancet 1997, 349, 1341–1346. [Google Scholar]
- Healy, J. Excess winter mortality in Europe: A cross country analysis identifying key risk factors. J. Epidemiol. Community Health 2003, 57, 784–789. [Google Scholar] [CrossRef] [PubMed]
- Analitis, A.; Katsouyanni, K.; Biggeri, A.; Baccini, M.; Forsberg, B.; Bisanti, L.; Kirchmayer, U.; Ballester, F.; Cadum, E.; Goodman, P.G.; et al. Effects of cold weather on mortality: Results from 15 European cities within the PHEWE project. Am. J. Epidemiol. 2008, 168, 1397–1408. [Google Scholar] [CrossRef] [PubMed]
- Statistics Netherlands. Statline Database. Available online: http://statline.cbs.nl/ (accessed on 17 August 2015).
- Statistics Netherlands. Statline Overledenen; Belangrijke Doodsoorzaken (Korte Lijst), Leeftijd, Geslacht. Available online: http://statline.cbs.nl/ (accessed on 20 September 2015).
- Statistics Netherlands. Statline Kerncijfers van Diverse Bevolkingsprognoses en Waarneming: Aantal Overledenen. Available online: http://statline.cbs.nl/ (accessed on 20 September 2015).
- CBS. Bevolingstrends 2014: Bevolkingsprognose 2014–2060; Groei Door Migratie; Centraal Bureau voor de Statistiek (Statistics Netherlands): Den Haag, The Netherlands, 2014.
- Koepsell, T.; Weiss, N. Epidemiologic Methods; Oxford University Press: New York, NY, USA, 2003. [Google Scholar]
- Hajat, S.; Armstrong, B.; Baccini, M.; Biggeri, A.; Bisanti, L.; Russo, A.; Paldy, A.; Menne, B.; Kosatsky, T. Impact of high temperatures on mortality: Is there an added heat wave effect? Epidemiology 2006, 17, 632–638. [Google Scholar] [CrossRef] [PubMed]
- Carson, C.; Hajat, S.; Armstrong, B.; Wilkinson, P. Declining vulnerability to temperature-related mortality in London over the 20th century. Am. J. Epidemiol. 2006, 164, 77–84. [Google Scholar] [CrossRef] [PubMed]
- Baccini, M.; Kosatsky, T.; Analitis, A.; Anderson, H.; D’Ovidio, M.; Menne, B.; Michelozzi, P.; Biggeri, A.; the PHEWE Collaborative Group. Impact of heat on mortality in 15 European cities: Attributable deaths under different weather scenarios. J. Epidemiol. Community Health 2011, 65, 64–70. [Google Scholar] [CrossRef] [PubMed]
- Hayhoe, K.; Sheridan, S.; Kalkstein, L.; Greene, S. Climate change, heat waves, and mortality projections for Chicago. J. Great Lakes Res. 2010, 36, 65–73. [Google Scholar] [CrossRef]
- Doyon, B.; Bélanger, D.; Pierre, G. The potential impact of climate change on annual and seasonal mortality for three cities in Québec, Canada. Int. J. Health Geogr. 2008, 7. [Google Scholar] [CrossRef] [PubMed]
- Takahashi, K.; Honda, Y.; Emori, S. Assessing mortality risk from heat stress due to global warming. J. Risk Res. 2007, 10, 339–354. [Google Scholar] [CrossRef]
- Knowlton, K.; Lynn, B.; Goldberg, R.A.; Rosenzweig, C.; Hogrefe, C.; Rosenthal, J.K.; Kinney, P.L. Projecting heat-related mortality impacts under a changing climate in the New York city region. Am. J. Public Health 2007, 97, 2028–2034. [Google Scholar] [CrossRef] [PubMed]
- Shifano, P.; Leone, M.; de Sario, M.; de’Donato, F.; Bargagli, A.; D’ippoliti, D.; Marino, C.; Michelozzi, P. Changes in the effect of heat on mortality among the elderly from 1998 to 2010: Results from a multicentre time series study in Italy. Environ. Health 2012, 11. [Google Scholar] [CrossRef] [PubMed]
- Toloo, G.; Fitzgerals, G.; Aitken, P.; Verral, K.; Tong, S. Are heat warning systems effective? Environ. Health 2013, 12. [Google Scholar] [CrossRef] [PubMed] [Green Version]
- Grjibovski, A.; Nurgaliyeva, N.; Kosbayeva, A.; Menne, B. No association between temperature and deathts from cardiovascular and cerebrovascular diseases during cold season in Astana, Kazakhstan—The second coldest capital in the world. Int. J. Circumpolar Health 2012, 71. [Google Scholar] [CrossRef] [PubMed]
- Armstrong, B. Models for the relationship between ambient temperature and daily mortality. Epidemiology 2006, 17, 624–631. [Google Scholar] [CrossRef] [PubMed]
- IPCC. Climate Change 2007: Impacts, Adaptation and Vulnerability; Cambridge University Press: Cambridge, UK, 2007. [Google Scholar]
- Kinney, P.; Schwartz, J.; Pascal, M.; Petkova, E.; Le Tertre, A.; Medina, S.; Vautard, R. Winter season mortality: Will climate warming bring benefits? Environ. Res. Lett. 2015, 10. [Google Scholar] [CrossRef]
- Bhaskaran, K.; Gasparrini, A.; Hajat, S.; Smeeth, L.; Armstrong, B. Time series regression studies in environmental epidemiology. Int. J. Epidemiol. 2013, 42, 1187–1195. [Google Scholar] [CrossRef] [PubMed]
© 2015 by the authors; licensee MDPI, Basel, Switzerland. This article is an open access article distributed under the terms and conditions of the Creative Commons Attribution license (http://creativecommons.org/licenses/by/4.0/).
Share and Cite
Huynen, M.M.T.E.; Martens, P. Climate Change Effects on Heat- and Cold-Related Mortality in the Netherlands: A Scenario-Based Integrated Environmental Health Impact Assessment. Int. J. Environ. Res. Public Health 2015, 12, 13295-13320. https://doi.org/10.3390/ijerph121013295
Huynen MMTE, Martens P. Climate Change Effects on Heat- and Cold-Related Mortality in the Netherlands: A Scenario-Based Integrated Environmental Health Impact Assessment. International Journal of Environmental Research and Public Health. 2015; 12(10):13295-13320. https://doi.org/10.3390/ijerph121013295
Chicago/Turabian StyleHuynen, Maud M. T. E., and Pim Martens. 2015. "Climate Change Effects on Heat- and Cold-Related Mortality in the Netherlands: A Scenario-Based Integrated Environmental Health Impact Assessment" International Journal of Environmental Research and Public Health 12, no. 10: 13295-13320. https://doi.org/10.3390/ijerph121013295