
Community Trial on Heat Related-Illness Prevention Behaviors and Knowledge for the Elderly

 and
and 
Abstract
:1. Introduction
2. Materials and Method
2.1. Study Design
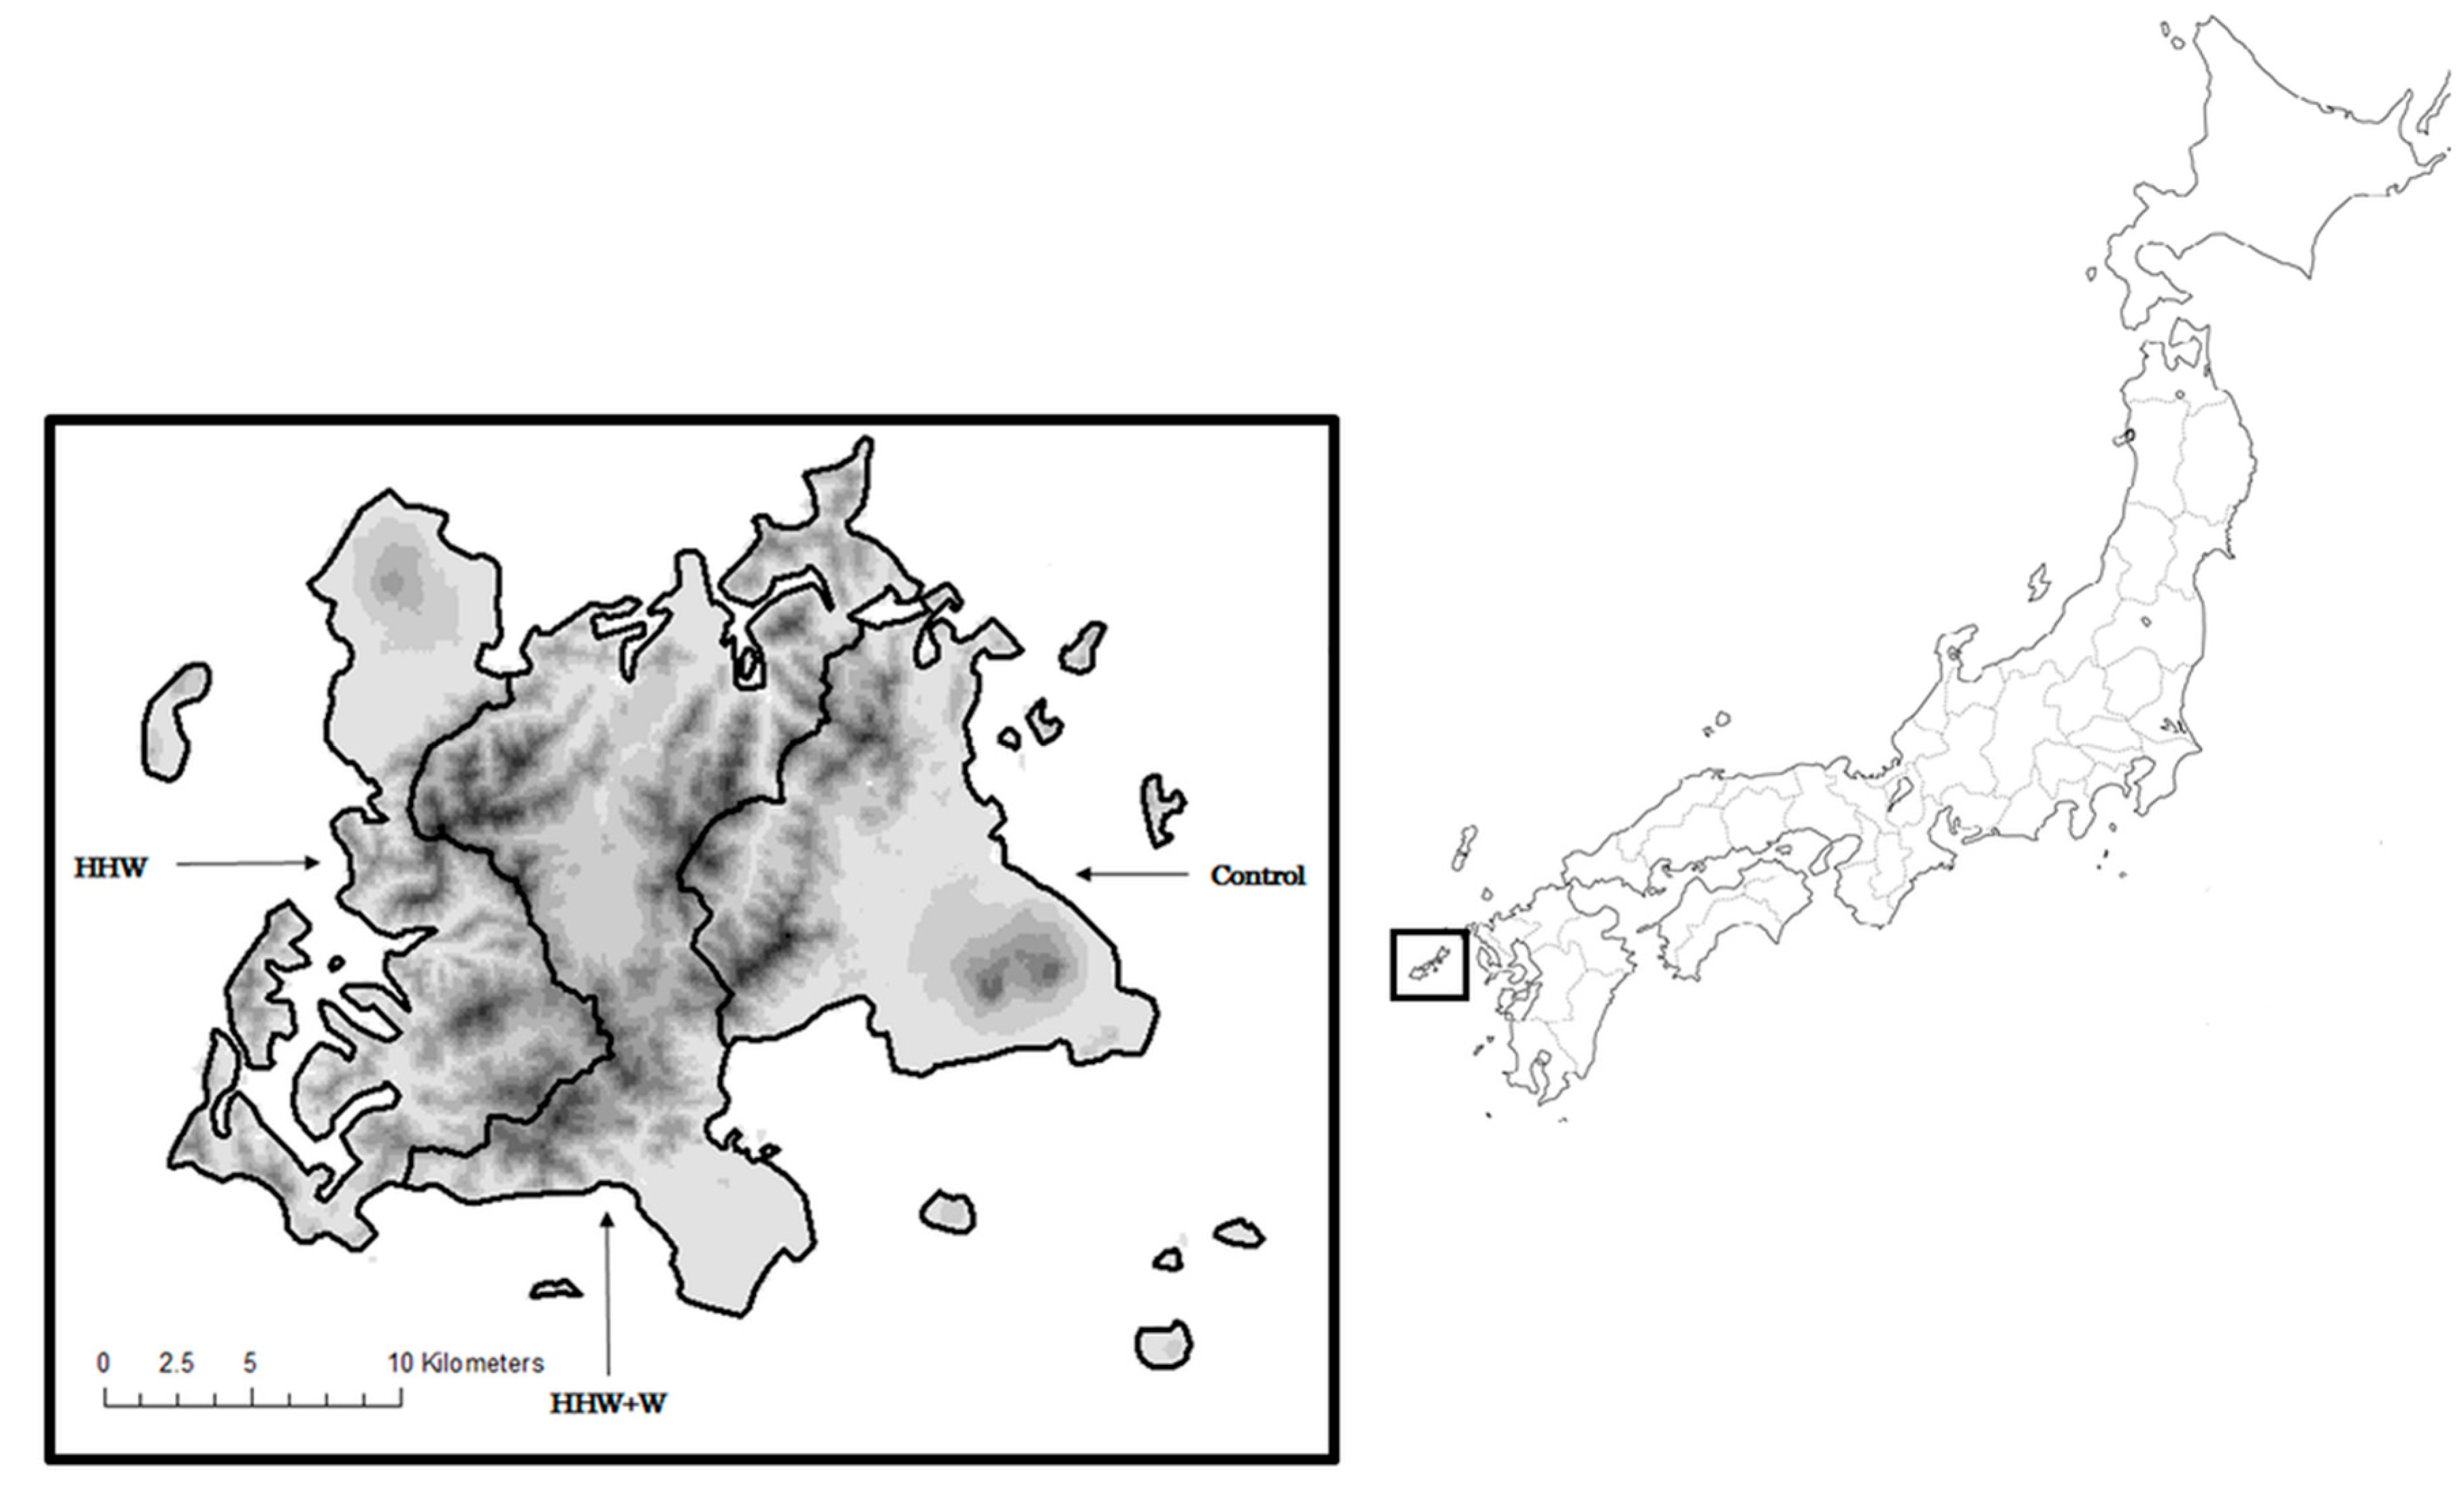
2.2. Settings and Participants

2.3. Sample Size
2.4. Intervention
2.5. Data Collection
2.6. Outcome Measures
2.7. Statistical Analysis
2.8. Ethics
3. Results
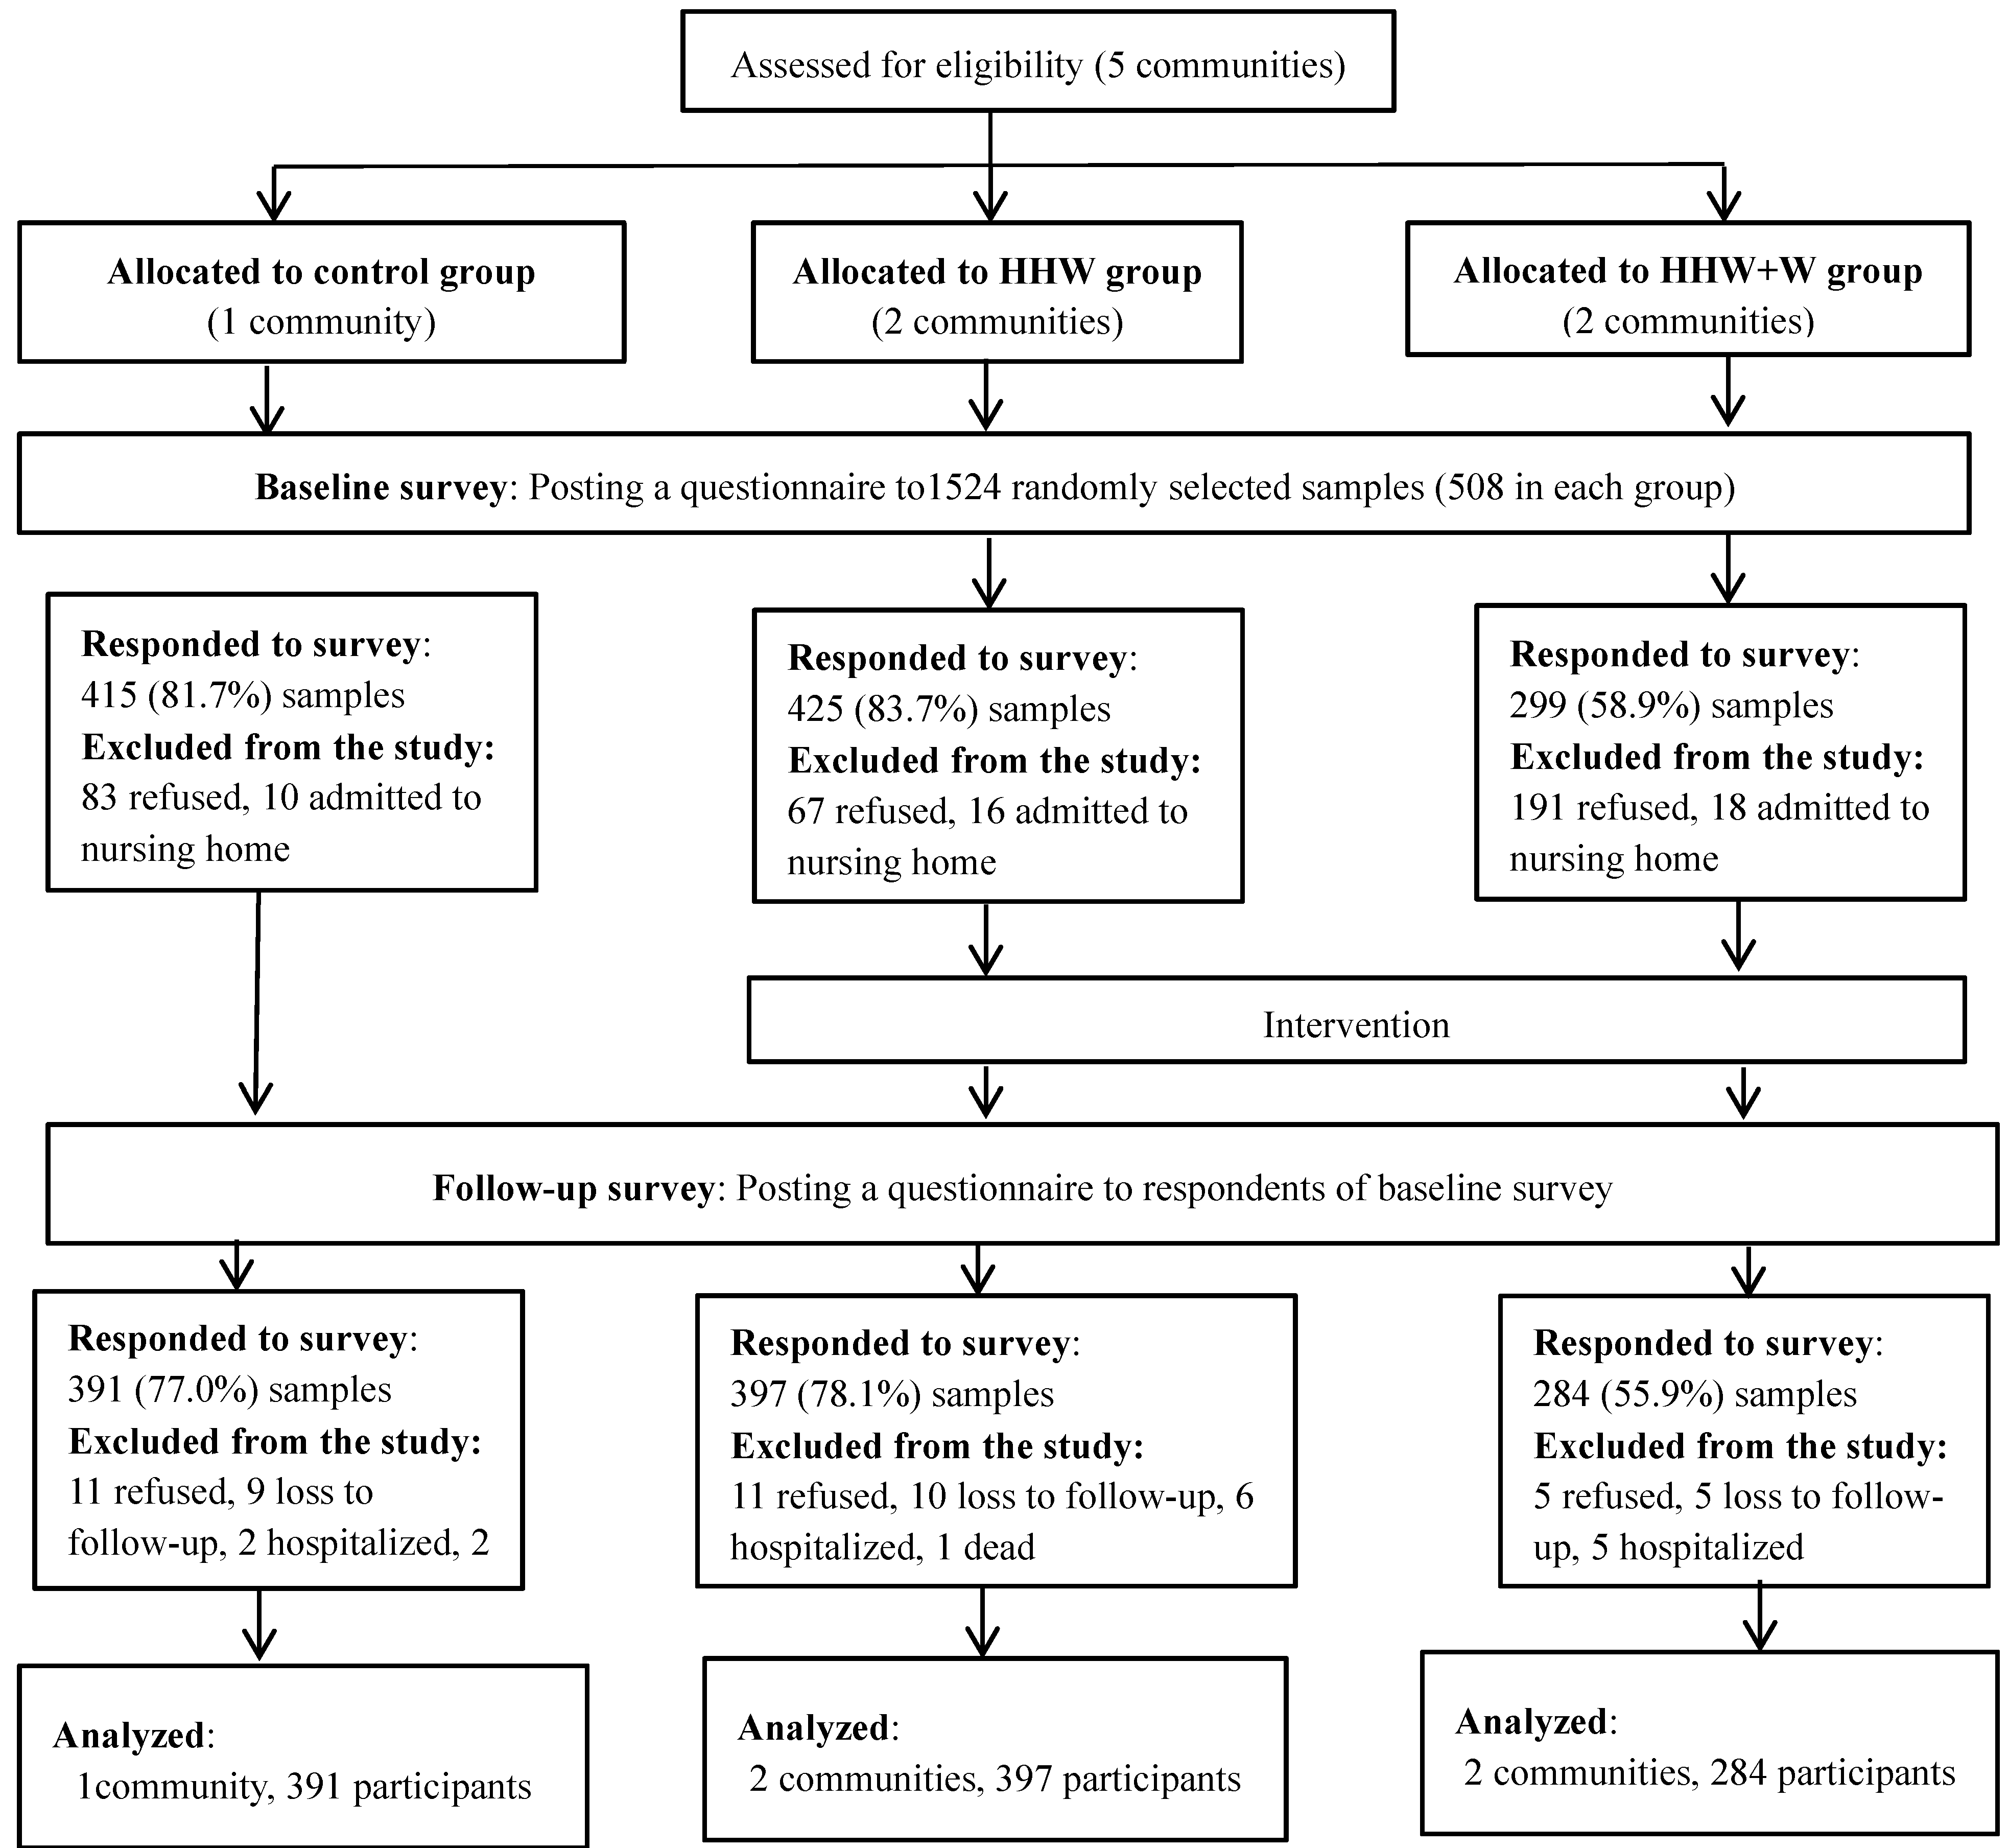
3.1. Respondents


| Participants Characteristics | Control (n = 391) | HHW (n = 397) | HHW+W (n = 284) | p-Value | |
|---|---|---|---|---|---|
| n (%) | n (%) | n (%) | |||
| Age | Mean (SD) | 74.3 (5.7) | 74.3 (5.5) | 73.9 (5.3) | 0.276 |
| 65–74 | 190 (48.6) | 198 (49.9) | 156 (54.9) | ||
| 75–84 | 193 (49.4) | 181 (45.6) | 123 (43.3) | ||
| Sex | Male | 194 (49.6) | 192 (48.4) | 139 (48.9) | 0.900 |
| Female | 194 (49.6) | 199 (50.1) | 142 (50.0) | ||
| Education | Junior high school | 190 (48.6) | 254 (64.0) | 189 (66.6) | <0.001 |
| High school | 117 (29.9) | 71(17.9) | 46 (16.2) | ||
| College/University | 38 (9.7) | 24 (6.1) | 13 (4.6) | ||
| Employment | Employed | 131 (33.5) | 123 (31.0) | 96 (33.8) | 0.154 |
| Unemployed | 253 (64.7) | 254 (64.0) | 178 (62.7) | ||
| Community involvement | Participate | 111 (28.4) | 115 (29.0) | 82 (28.9) | 0.596 |
| Do not participate | 266 (68.0) | 258 (65.0) | 188 (66.2) | ||
| Family structure | Living alnoe | 95 (24.3) | 94 (23.7) | 68 (23.9) | 0.964 |
| Living together | 291(74.4) | 299 (75.3) | 214 (75.4) | ||
| Regular medical treatment | Receive | 120 (30.7) | 91 (22.9) | 73 (25.7) | 0.125 |
| Do not receive | 261 (66.8) | 299 (75.3) | 205 (72.2) | ||
| Residence type | House | 361 (92.3) | 386 (97.2) | 278 (97.9) | 0.00 |
| Flat | 14 (3.6) | 9 (2.3) | 2 (0.7) | ||
| Other | 10 (2.6) | 0 (0.0) | 1 (0.4) | ||
| Residencial structure | Wooden house | 346 (88.5) | 379 (95.5) | 271 (95.4) | 0.00 |
| Reinforced concrete | 38 (9.7) | 15 (3.8) | 11 (3.9) | ||
| TV ownership | Own | 379 (96.9) | 384 (96.5) | 279 (98.2) | 0.495 |
| Do not own | 2 (0.5) | 5 (1.3) | 1 (0.4) | ||
| Internet usage | Use | 39 (10.0) | 21 (5.3) | 14 (4.9) | 0.007 |
| Do not use | 342 (87.5) | 353 (88.9) | 254 (89.4) | ||
| Radio usage | Frequent | 105 (28.2) | 42 (11.3) | 69 (25.9) | <0.001 |
| Infrequent (up to 2 times / week) | 268 (71.9) | 329 (88.7) | 197 (74.1) | ||
| Newspaper | Subscribe | 232 (59.3) | 170 (42.8) | 130 (45.8) | <0.001 |
| Do not subscribe | 148 (37.9) | 217 (54.7) | 149 (52.5) | ||
| Alcohol intake | Drink | 129 (33.0) | 108 (27.2) | 93 (32.8) | 0.322 |
| Do not drink | 256 (65.5) | 279 (70.3) | 184 (64.8) | ||
| Smoking status | Smoke | 46 (11.8) | 41 (10.3) | 25 (8.80) | 0.077 |
| Used to smoke | 60 (15.4) | 42 (10.6) | 31 (10.9) | ||
| Have never smoked | 275 (70.3) | 293 (73.8) | 211 (74.3) | ||
| AC ownership | Own | 358 (91.6) | 351 (88.4) | 264 (93.0) | 0.217 |
| Do not own | 32 (8.2) | 42 (10.6) | 19 (6.7) | ||
| Fan ownership | Own | 366 (93.6) | 385 (97.0) | 273 (96.1) | 0.162 |
| Do not own | 22 (5.6) | 9 (2.3) | 9 (3.2) | ||
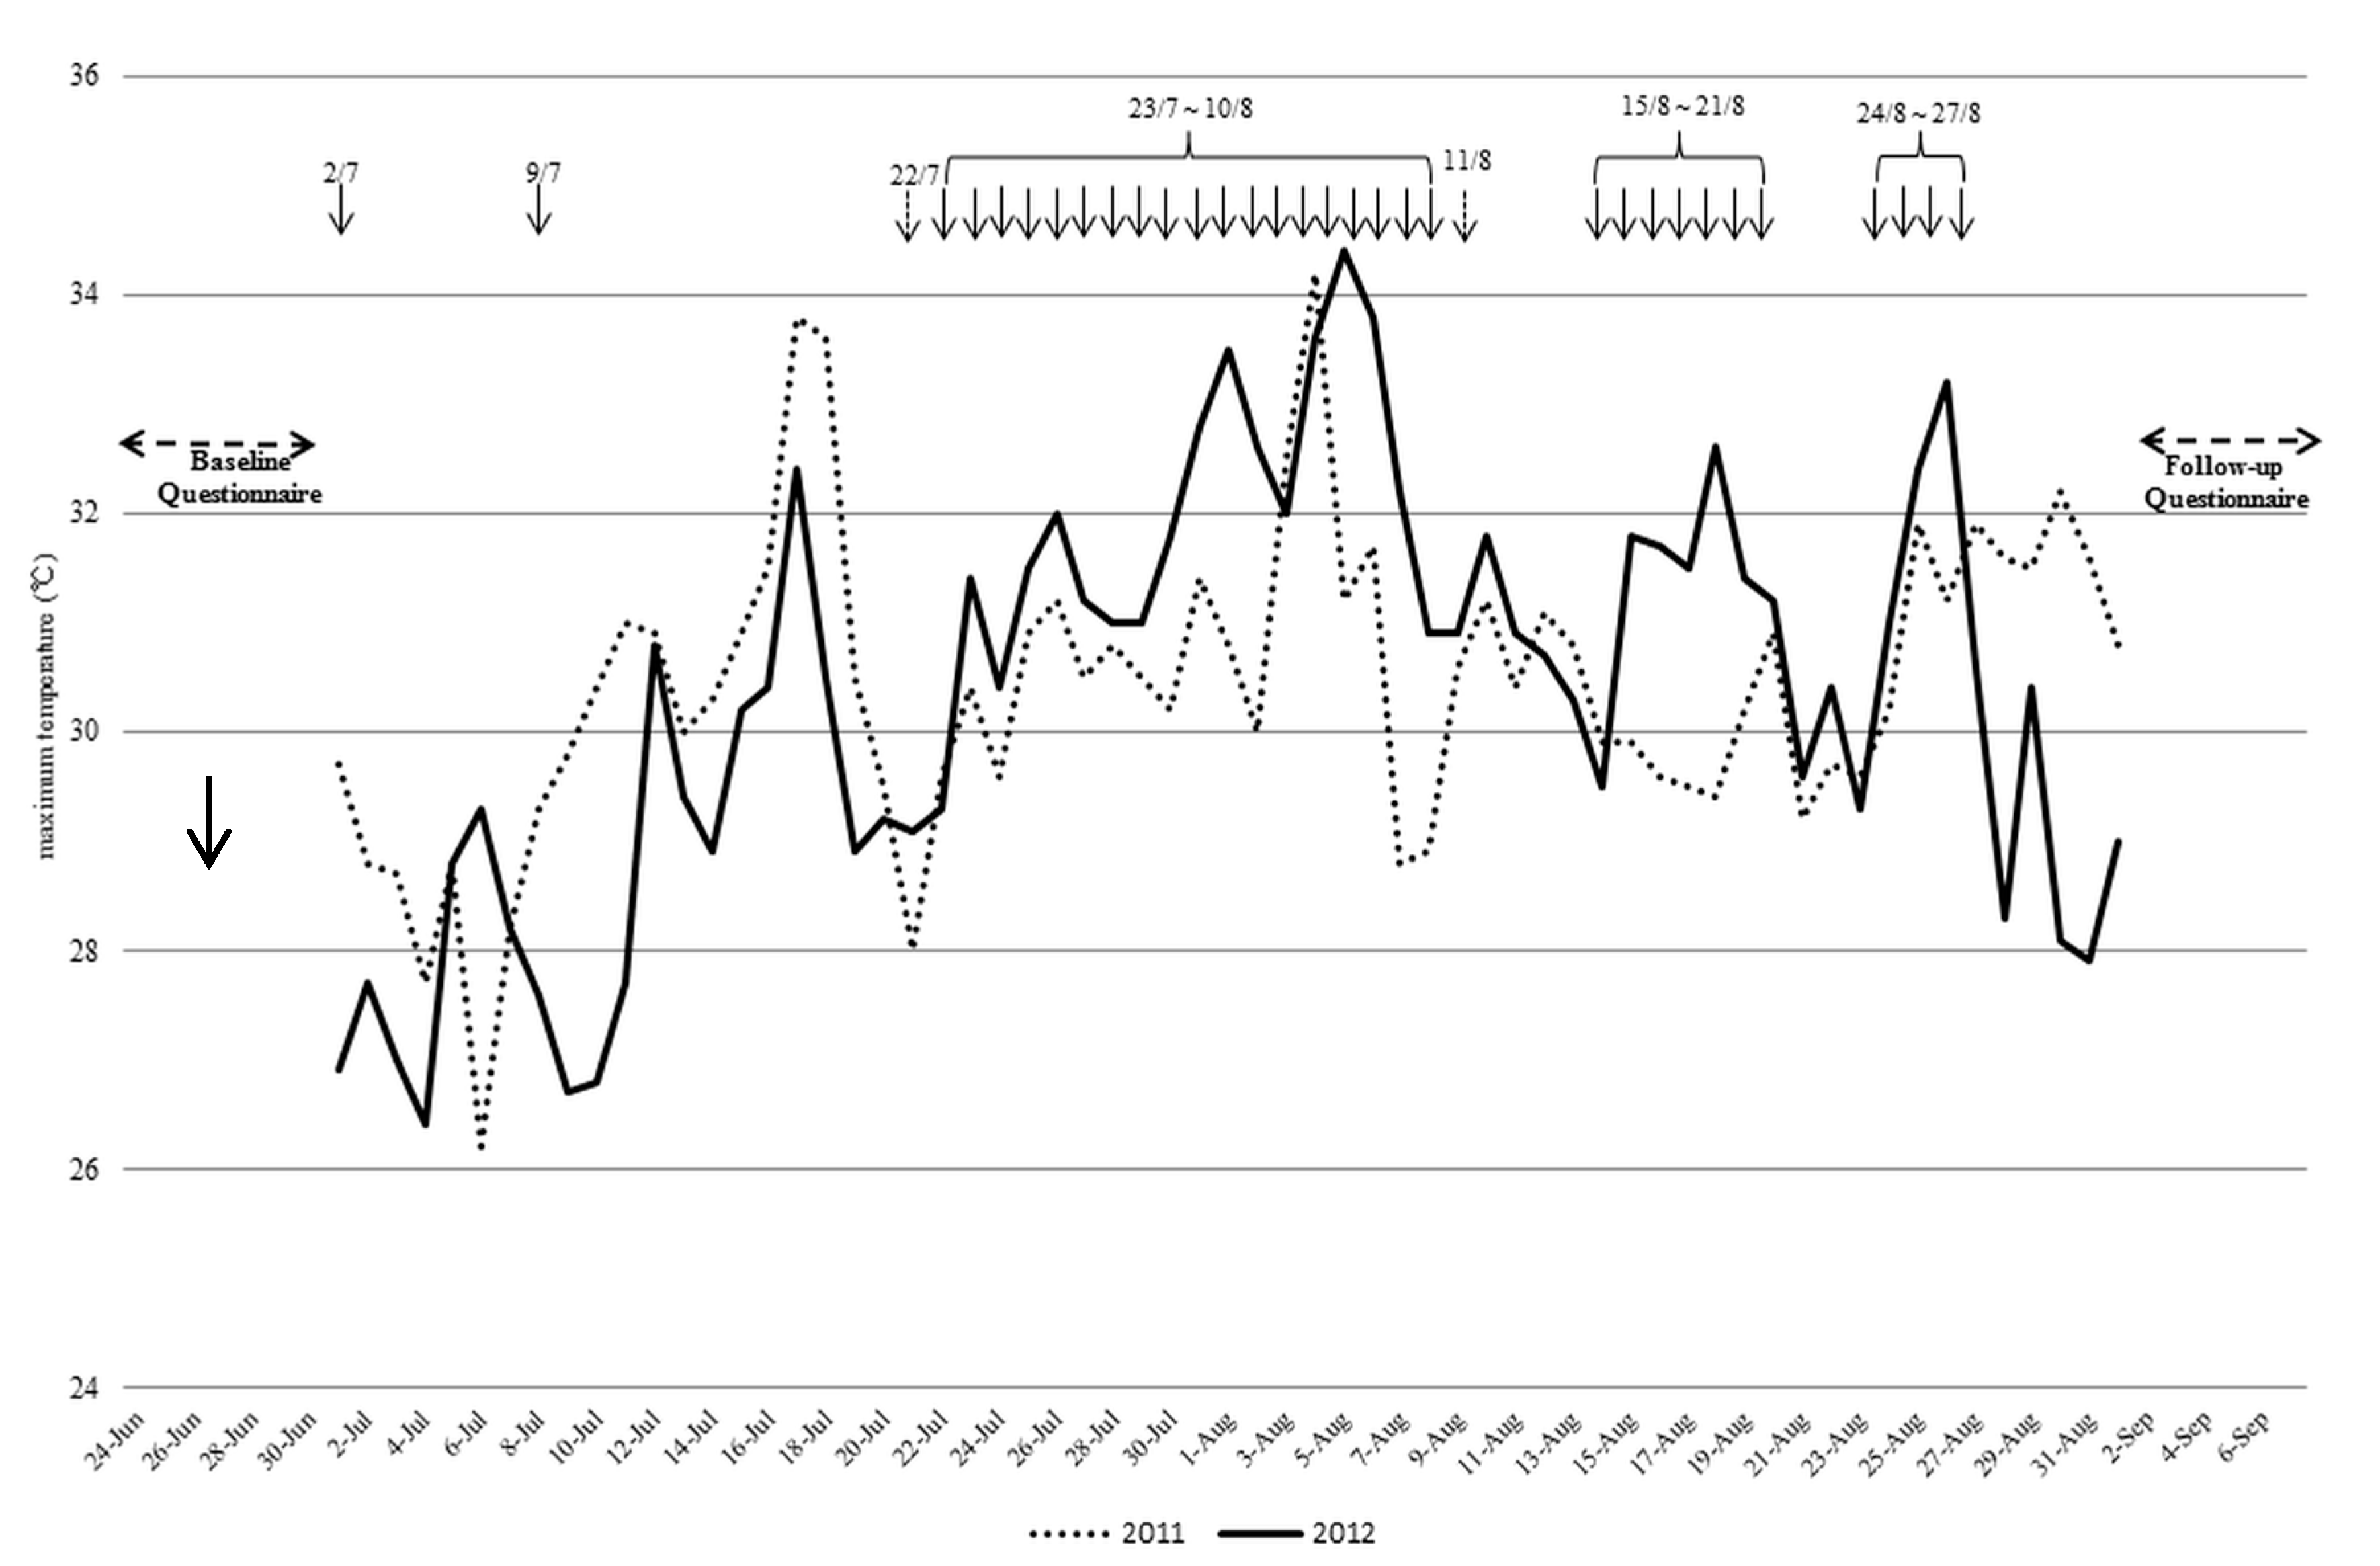
3.2. Weather Conditions and HHWs

3.3. Improvement of Behaviors to Prevent Heat-Related Illness
| Control | HHW | HHW+W | p-Value HHW vs. HHW+W | |||||||||
|---|---|---|---|---|---|---|---|---|---|---|---|---|
| No. of improved people (%) | No. of improved people (%) | Crude | Adjusted | No. of improved people (%) | Crude | Adjusted | ||||||
| OR (95% CI) | p-value | OR (95%CI) | p-value | OR (95% CI) | p-value | OR (95% CI) | p-value | |||||
| 1. Day time AC use (N = 905) | 182 (54.3) | 164 (50.9) | 0.87 (0.64, 1.19) | 0.383 | 0.94 (0.65, 1.35) | 0.737 | 129 (52.0) | 0.91 (0.66, 1.27) | 0.580 | 0.88 (0.60, 1.29) | 0.505 | 0.733 |
| 2. Night time AC use (N = 902) | 133 (39.7) | 134 (41.5) | 1.08 (0.79, 1.47) | 0.641 | 1.10 (0.76, 1.60) | 0.606 | 121 (49.6) | 1.49 (1.07, 2.08) | 0.018 | 1.49 (1.01, 2.19) | 0.047 | 0.141 |
| 3. Temperatures to turn on AC (N = 789) | 28 (9.4) | 35 (12.4) | 1.37(0.81, 2.31) | 0.245 | 1.41 (0.75, 2.67) | 0.289 | 26 (12.4) | 1.37 (0.78, 2.41) | 0.275 | 1.31 (0.68, 2.52) | 0.419 | 0.825 |
| 4. Room temperature settings of AC (N = 831) | 159 (51.3) | 165 (56.1) | 1.21 (0.88, 1.67) | 0.234 | 1.37 (0.93, 2.01) | 0.106 | 114 (50.2) | 0.96 (0.68, 1.35) | 0.806 | 1.09 (0.73, 1.63) | 0.676 | 0.273 |
| 5. Electric fan (EF) use (N = 906) | 185 (56.4) | 192 (58.0) | 1.07 (0.78, 1.45) | 0.677 | 1.02 (0.71, 1.48) | 0.910 | 138 (55.9) | 0.98 (0.70, 1.36) | 0.899 | 0.89 (0.60, 1.31) | 0.553 | 0.487 |
| 6. Effective use of EF (N = 628) | 118 (53.2) | 107 (46.9) | 0.78 (0.54, 1.13) | 0.187 | 0.94 (0.60, 1.49) | 0.804 | 79 (44.4) | 0.70 (0.47, 1.05) | 0.082 | 0.72 (0.45, 1.16) | 0.176 | 0.270 |
| 7. Frequency of alcohol intake (N = 952) | 224 (65.1) | 247 (70.4) | 1.27 (0.92, 1.75) | 0.139 | 1.34 (0.89, 2.02) | 0.158 | 161 (62.7) | 0.90 (0.64, 1.26) | 0.532 | 1.02 (0.67, 1.57) | 0.921 | 0.225 |
| No. of improved people (%) | No. of improved people (%) | Crude | Adjusted | Crude | Crude | Adjusted | ||||||
| OR (95% CI) | p-value | OR (95%CI) | p-value | OR (95% CI) | p-value | OR (95% CI) | p-value | |||||
| 8. Clothing type (N = 986) | 259 (71.6) | 248 (68.1) | 0.85 (0.62, 1.17) | 0.316 | 0.95 (0.64, 1.40) | 0.781 | 182 (70.0) | 0.93 (0.65, 1.32) | 0.675 | 1.11 (0.73, 1.70) | 0.629 | 0.460 |
| 9. Frequency of water intake (N = 1002) | 138 (37.8) | 147 (39.7) | 1.08(0.81, 1.46) | 0.593 | 1.25 (0.87, 1.78) | 0.224 | 132 (49.4) | 1.61 (1.17, 2.21) | 0.004 | 1.77 (1.21, 2.58) | 0.003 | 0.067 |
| 10. Cooling body (N = 978) | 91 (25.5) | 106 (29.7) | 1.23 (0.89, 1.72) | 0.209 | 1.34 (0.91, 1.97) | 0.137 | 101 (38.3) | 1.81 (1.28, 2.55) | 0.001 | 1.87 (1.26, 2.80) | 0.002 | 0.095 |
| 11. Frequency of taking a break (N = 931) | 108 (31.9) | 115 (33.1) | 1.06 (0.77, 1.45) | 0.740 | 1.39 (0.95, 2.03) | 0.088 | 82 (33.6) | 1.08 (0.76, 1.54) | 0.657 | 1.19 (0.79, 1.79) | 0.414 | 0.445 |
| 12. Reduced activities in the heat (N = 961) | 234 (67.2) | 258 (72.3) | 1.27 (0.92, 1.75) | 0.146 | 1.40 (0.95, 2.07) | 0.093 | 184 (71.9) | 1.25 (0.88, 1.77) | 0.223 | 1.54 (1.01, 2.37) | 0.047 | 0.656 |
| 13. Hat or parasol use (N = 1021) | 282 (75.6) | 317 (82.9) | 1.65 (1.15, 2.37) | 0.006 | 1.80 (1.17, 2.77) | 0.008 | 223 (83.6) | 1.56 (1.05, 2.32) | 0.027 | 1.39 (0.88, 2.20) | 0.163 | 0.299 |
| Control | HHW | HHW+W | p-Value for HHW vs. Control b | p-Value for HHW +W vs. Control b | p-Value for HHW vs. HHW+W b | ||||||||
|---|---|---|---|---|---|---|---|---|---|---|---|---|---|
| Baseline | Follow-up | p-Value a | Baseline | Follow-up | p-Value a | Baseline | Follow-up | p-Value a | |||||
| Total knowledge score (Mean ± SD) | 16.5 ± 4.5 | 17.2 ± 4.6 | <0.001 | 16.1 ± 5.2 | 16.1 ± 5.7 | 0.188 | 16.4 ± 5.1 | 16.5 ± 5.7 | 0.064 | 0.057 | 0.163 | 0.698 | |
| Question | Answer | Number of the participants who selected the correct answer, n (%) | |||||||||||
| 1. Can usage of cooling devices prevent heat stroke? | Yes | 308 (78.8) | 337 (86.2) | - | 299 (75.3) | 322 (81.1) | - | 231 (81.3) | 234 (82.4) | - | |||
| 2. Can wearing thick clothes prevent heat stroke? | No | 291 (74.4) | 312 (79.8) | - | 276 (69.5) | 255 (64.2) | - | 202 (71.1) | 192 (67.6) | - | |||
| 3. Can staying at cool spots prevent heat stroke? | Yes | 332 (84.9) | 325 (83.1) | - | 326 (82.1) | 295 (74.3) | - | 238 (83.8) | 215 (75.7) | - | |||
| 4. Can cooling body down prevent heat stroke? | Yes | 296 (75.7) | 313 (80.1) | - | 287 (72.3) | 287 (72.3) | - | 210 (73.9) | 224 (78.9) | - | |||
| 5. Is dehydration one of the symptoms of heat stroke? | Yes | 350 (89.5) | 351 (89.8) | - | 345 (86.9) | 330 (83.1) | - | 256 (90.1) | 242 (85.2) | - | |||
| 6. Is tiredness one of the symptoms of heat stroke? | Yes | 324 (82.9) | 329 (84.1) | - | 329 (82.9) | 320 (80.6) | - | 231 (81.3) | 230 (81.0) | - | |||
| Total knowledge score (Mean ± SD) | 16.5 ± 4.5 | 17.2 ± 4.6 | <0.001 | 16.1 ± 5.2 | 16.1 ± 5.7 | 0.188 | 16.4 ± 5.1 | 16.5 ± 5.7 | 0.064 | 0.057 | 0.163 | 0.698 | |
| 7. Are dizziness and light-headedness one of the symptoms of heat stroke? | Yes | 353 (90.3) | 351 (89.8) | - | 340 (85.6) | 335 (84.4) | - | 248 (87.3) | 246 (86.6) | - | |||
| 8. Is headache one of the symptoms of heat stroke? | Yes | 296 (75.7) | 323 (82.6) | - | 311 (78.5) | 315 (79.4) | - | 225 (79.2) | 234 (82.4) | - | |||
| 9. Is feeling nauseous one of the symptoms of heat stroke? | Yes | 293 (74.9) | 320 (81.8) | - | 298 (75.3) | 307 (77.3) | - | 224 (78.9) | 235 (82.8) | - | |||
| 10. Is reduction in appetite one of the symptoms of heat stroke? | Yes | 306 (78.3) | 330 (67.5) | - | 315 (79.4) | 321 (65.0) | - | 219 (77.1) | 215 (63.4) | - | |||
| 11. Is sweating one of the symptoms of heat stroke? | Yes | 268 (68.5) | 264 (67.5) | - | 262 (66.0) | 258 (65.0) | - | 197 (69.4) | 180 (63.4) | - | |||
| 12. Is muscle cramp one of the symptoms of heat stroke? | Yes | 161 (41.2) | 202 (51.7) | - | 157 (39.6) | 198 (49.9) | - | 120 (42.3) | 152 (53.5) | - | |||
| Total knowledge score (Mean ± SD) | 16.5 ± 4.5 | 17.2 ± 4.6 | <0.001 | 16.1 ± 5.2 | 16.1 ± 5.7 | 0.188 | 16.4 ± 5.1 | 16.5 ± 5.7 | 0.064 | 0.057 | 0.163 | 0.698 | |
| 13. Can sweating reduce body temperature? | Yes | 254 (65.0) | 252 (64.5) | - | 217 (54.7) | 217 (54.7) | - | 169 (59.5) | 150 (52.8) | - | |||
| 14. Can sweating negatively affect people with hypertension or cardiac diseases? | Yes | 191 (48.9) | 186 (47.6) | - | 174 (43.8) | 168 (42.3) | - | 140 (49.3) | 134 (47.2) | - | |||
| 15. Do people sweat when not really feeling the heat? | Yes | 186 (47.6) | 200 (51.2) | - | 215 (54.2) | 195 (49.1) | - | 135 (47.5) | 148 (52.1) | - | |||
| 16. Does sweating a lot make people exhausted? | Yes | 303 (77.5) | 319 (81.6) | - | 305 (76.8) | 307 (77.3) | - | 222 (78.2) | 220 (77.5) | - | |||
| 17. Does heat stroke always make people thirsty? | No | 114 (29.2) | 137 (35.0) | - | 116 (29.2) | 129 (32.5) | - | 92 (32.4) | 108 (38.0) | - | |||
| 18. Is heat stroke getting worse? | Yes | 291 (74.4) | 310 (79.3) | - | 307 (77.3) | 296 (74.6) | - | 214 (75.4) | 204 (71.8) | - | |||
| Total knowledge score (Mean ± SD) | 16.5 ± 4.5 | 17.2 ± 4.6 | <0.001 | 16.1 ± 5.2 | 16.1 ± 5.7 | 0.188 | 16.4 ± 5.1 | 16.5 ± 5.7 | 0.064 | 0.057 | 0.163 | 0.698 | |
| 19. Are people with hypertension or cardiac diseases more likely to get heat stroke? | Yes | 206 (52.7) | 192 (49.1) | - | 196 (49.4) | 189 (47.6) | - | 140 (49.3) | 137 (48.2) | - | |||
| 20. Does heat stroke occur in sleep? | Yes | 317 (81.1) | 332 (84.9) | - | 315 (79.4) | 323 (81.4) | - | 220 (77.5) | 253 (89.1) | - | |||
| 21. Are temperatures only the factor related to heat stroke? | No | 284 (72.6) | 305 (78.0) | - | 307 (77.3) | 291 (73.3) | - | 210 (73.9) | 201 (70.8) | - | |||
| 22. Does heat stroke occur in early summer or winter? | Yes | 228 (58.3) | 196 (50.1) | - | 216 (54.4) | 213 (53.7) | - | 165 (58.1) | 153 (53.9) | - | |||
| 23. Can electric fans decrease ambient temperatures? | No | 128 (32.7) | 135 (34.5) | - | 100 (25.2) | 101 (25.4) | - | 71 (25.0) | 77 (27.1) | - | |||
| 24. Are electric fans effective when used in conjunction with AC? | Yes | 343 (87.7) | 339 (86.7) | - | 344 (86.7) | 348 (87.7) | - | 237 (83.5) | 246 (86.6) | - | |||
| 25. Are fans effective to prevent heat stroke even if the humidity level is high? | No | 36 (9.2) | 69 (17.7) | - | 27 (6.8) | 65 (16.4) | - | 41 (14.1) | 47 (16.6) | - | |||
3.4. Knowledge of Heat-Related illness
4. Discussion
5. Limitation
6. Conclusions
Acknowledgments
Author Contributions
Appendix
A1. Definitions Used in this Study for the Behavior Improvement
1. How many hours did you use AC in daytime (until sunset)?
Definition of Improvement Group
- Participants who used AC longer in the daytime in the follow-up questionnaires than in the baseline questionnaires.
- Participants who chose Option (4) in both the baseline and follow-up questionnaires. These participants had used AC more than five hours in daytime even before the intervention.
2. How many hours did you use AC in nighttime (until sunrise)?
Definition of Improvement Group
- Participants who used AC longer in nighttime in the follow-up questionnaires than in the baseline questionnaires.
- Participants who chose Option (4) in both the baseline and follow-up questionnaires. These participants had used AC more than five hours in nighttime even before the intervention.
3. At what temperature did you start using AC?
Definition of Improvement Group
- Participants who chose Options (3–5) in the baseline questionnaires and chose either Options (1) or (2) in the follow-up questionnaires. These participants started using AC at ≥28 °C or when feeling hot in the baseline, and started using AC at <28 °C after the intervention.
- Participants who chose either Option 1 or 2 in both the baseline and follow-up questionnaires. These participants had used AC at <28 °C even before the intervention.
4. What were the room temperature settings?
Definition of Improvement Group
- Participants who chose Options (3–5) in the baseline questionnaires, and chose either Options (1) or (2) in the follow-up questionnaires. These participants set the room temperature to ≥28 °C or did not decide the temperature in the baseline, and set the room temperature to <28 °C after the intervention.
- Participants who chose either Options (1) or (2) in both the baseline and follow-up questionnaires, which means these participants had set the room temperature to < 28°C before the intervention.
5. How many hours did you use an electric fan a day?
Definition of Improvement Group
- Participants who used an electric fan longer in the follow-up questionnaires than in the baseline questionnaires.
- Participants who chose Option (4) in both the baseline and follow-up questionnaires. These participants had used an electric fan for more than five hours even before the intervention.
6. How did you use a fan?
Definition of Improvement Group
- Participants who chose either Options (2) or (3) in the baseline questionnaires, and chose Option (1) in the follow-up questionnaires. These participants used either an electric fan or AC before the intervention, and grew to use both at the same time after the intervention.
- Participants who chose Option (1) in both the baseline and follow-up questionnaires. These participants had used an electric fan and AC at the same time even before the intervention
7. How often did you drink alcohol during summer?
Definition of Improvement Group
- Participants who grew to refrain from alcohol in the follow-up questionnaires more than in the baseline questionnaires.
- Participants who chose Option (1) in both the baseline and follow-up questionnaires. These participants had refrained from alcohol even before the intervention
8. What kinds of clothes did you wear?
Definition of Improvement Group
- Participants who grew to wear lighter clothes in the follow-up questionnaires than in the baseline questionnaires.
- Participants who chose Option (3) in both the baseline and follow-up questionnaires. These participants had worn light clothes before the intervention.
9. How often did you drink fluid (excluding liquids included in meals)?
- (1)
- days when you never drank fluid
- (2)
- days when you hardly drank fluid
- (3)
- drink sometimes even if did not feel thirsty
- (4)
- drink regularly even if not feeling thirsty.
Definition of Improvement Group
- Participants who grew to drink fluid more frequently in the follow-up questionnaires than in the baseline questionnaires.
- Participants who chose Option (4) in both the baseline and follow-up questionnaires. These participants had drunk fluid regularly even before the intervention.
10. Did you cool your body when feeling hot?
Definition of Improvement Group
- Participants who grew to cool their bodies down when feeling hot in the follow-up questionnaires than in the baseline questionnaires.
- Participants who chose Option (4) in both the baseline and follow-up questionnaires. These participants had cooled their bodies when feeling hot even before the intervention.
11. Did you take a rest when you were active (doing agriculture, fishery and walking)?
- (1)
- never took a rest regularly
- (2)
- rarely took a rest regularly
- (3)
- sometimes took a rest regularly
- (4)
- tried to take a rest regularly.
Definition of Improvement Group
- Participants who grew to take a rest more frequently in the follow-up questionnaires than in the baseline questionnaires.
- Participants who chose Option (4) in both the baseline and follow-up questionnaires. These participants had taken a rest regularly even before the intervention.
12. Were you active (doing agriculture, fishery and walking) during the hottest period of days (10 am to 4 pm)?
- (1)
- active every day
- (2)
- active frequently (not every day)
- (3)
- sometimes refrained from being active
- (4)
- tried to refrain from being active.
Definition of Improvement Group
- Participants who grew to refrain from activities during the hottest period in the follow-up questionnaires than in the baseline questionnaires.
- Participants who chose Option (4) in both the baseline and follow-up questionnaires. These participants had refrained from activities during the hottest period even before the intervention.
13. Did you use a hat or parasol when going outside?
Definition of Improvement Group
- Participants who grew to use a hat or parasol more frequently in the follow-up questionnaires than in the baseline questionnaires.
- Participants who chose Option (4) in both the baseline and follow-up questionnaires. These participants had used a hat or parasol every day even before the intervention.
| Section/Topic | Item No. | Checklist Item | Reported on Page No. |
|---|---|---|---|
| Title and abstract | |||
| 1a | Identification as a randomised trial in the title | 1 | |
| 1b | Structured summary of trial design, methods, results, and conclusions (for specific guidance see CONSORT for abstracts) | 1-2 | |
| Introduction | |||
| Background and objectives | 2a | Scientific background and explanation of rationale | 2 |
| 2b | Specific objectives or hypotheses | 2 | |
| Methods | |||
| Trial design | 3a | Description of trial design (such as parallel, factorial) including allocation ratio | 3 |
| 3b | Important changes to methods after trial commencement (such as eligibility criteria), with reasons | N.A. | |
| Participants | 4a | Eligibility criteria for participants | 3 |
| 4b | Settings and locations where the data were collected | 3/Figure 1 | |
| Interventions | 5 | The interventions for each group with sufficient details to allow replication, including how and when they were actually administered | 4 |
| Outcomes | 6a | Completely defined pre-specified primary and secondary outcome measures, including how and when they were assessed | 5 |
| 6b | Any changes to trial outcomes after the trial commenced, with reasons | N.A. | |
| Sample size | 7a | How sample size was determined | 4 |
| 7b | When applicable, explanation of any interim analyses and stopping guidelines | N.A. | |
| Randomisation: | |||
| Sequence generation | 8a | Method used to generate the random allocation sequence | 4 |
| 8b | Type of randomisation; details of any restriction (such as blocking and block size) | 4 | |
| Allocation concealment mechanism | 9 | Mechanism used to implement the random allocation sequence (such as sequentially numbered containers), describing any steps taken to conceal the sequence until interventions were assigned | 4 |
| Implementation | 10 | Who generated the random allocation sequence, who enrolled participants, and who assigned participants to interventions | 4 |
| Blinding | 11a | If done, who was blinded after assignment to interventions (for example, participants, care providers, those assessing outcomes) and how | N.A. |
| 11b | If relevant, description of the similarity of interventions | N.A. | |
| Statistical methods | 12a | Statistical methods used to compare groups for primary and secondary outcomes | 5 |
| 12b | Methods for additional analyses, such as subgroup analyses and adjusted analyses | 5 | |
| Results | |||
| Participant flow (a diagram is strongly recommended) | 13a | For each group, the numbers of participants who were randomly assigned, received intended treatment, and were analysed for the primary outcome | Table 1/Figure 2 |
| 13b | For each group, losses and exclusions after randomisation, together with reasons | Figure 2 | |
| Recruitment | 14a | Dates defining the periods of recruitment and follow-up | 4 |
| 14b | Why the trial ended or was stopped | Figure 2 | |
| Baseline data | 15 | A table showing baseline demographic and clinical characteristics for each group | Table 1 |
| Numbers analysed | 16 | For each group, number of participants (denominator) included in each analysis and whether the analysis was by original assigned groups | Table 1 |
| Outcomes and estimation | 17a | For each primary and secondary outcome, results for each group, and the estimated effect size and its precision (such as 95% confidence interval) | Table 2/Table 3 |
| 17b | For binary outcomes, presentation of both absolute and relative effect sizes is recommended | N.A. | |
| Ancillary analyses | 18 | Results of any other analyses performed, including subgroup analyses and adjusted analyses, distinguishing pre-specified from exploratory | Table 2/Table 3 |
| Harms | 19 | All important harms or unintended effects in each group (for specific guidance see CONSORT for harms) | N.A. |
| Discussion | |||
| Limitations | 20 | Trial limitations, addressing sources of potential bias, imprecision, and, if relevant, multiplicity of analyses | 20 |
| Generalisability | 21 | Generalisability (external validity, applicability) of the trial findings | 19-20 |
| 22 | Interpretation consistent with results, balancing benefits and harms, and considering other relevant evidence | 19-20 | |
| Other information | |||
| Registration | 23 | Registration number and name of trial registry | N.A. |
| Protocol | 24 | Where the full trial protocol can be accessed, if available | N.A. |
| Funding | 25 | Sources of funding and other support (such as supply of drugs), role of funders | 21 |
Conflicts of Interest
References
- Pirard, P.; Vandentorren, S.; Pascal, M.; Laaidi, K.; Le Tertre, A.; Cassadou, S.; Ledrans, M. Summary of the mortality impact assessment of the 2003 heat wave in France. Euro Surveill. 2005, 10, 153–156. [Google Scholar] [PubMed]
- Robine, J.M.; Cheung, S.L.; Le Roy, S.; van Oyen, H.; Griffiths, C.; Michel, J.P.; Herrmann, F.R. Death toll exceeded 70,000 in Europe during the summer of 2003. C. R. Biol. 2008, 331, 171–178. [Google Scholar] [CrossRef]
- Ibrahim, J.E.; McInnes, J.A.; Andrianopoulos, N.; Evans, S. Minimising harm from heatwaves: A survey of awareness, knowledge, and practices of health professionals and care providers in Victoria, Australi. Int. J. Public Health. 2012, 57, 297–304. [Google Scholar] [CrossRef] [PubMed]
- Semenza, J.C.; McCullough, J.E.; Flanders, W.D.; McGeehin, M.A.; Lumpkin, J.R. Excess hospital admissions during the July 1995 heat wave in Chicago. Am. J. Prev. Med. 1999, 16, 269–277. [Google Scholar] [CrossRef] [PubMed]
- Flynn, A.; McGreevy, C.; Mulkerrin, E.C. Why do older patients die in a heatwave? QJM. 2005, 98, 227–229. [Google Scholar] [CrossRef] [PubMed]
- Emergency Transport Data by Heat Stroke from June to September 2013, Tokyo, Japan. Available online: http://www.9fdma.go.jp/neuter/topics/houdou/h25/2510/251015_1houdou/01_houdoushiryou.pdf (accessed on 11 December 2013).
- Emergency Transport Data by Heat Stroke from June to September 2012, Tokyo, Japan. Available online: http://www.fdma.go.jp/neuter/topics/houdou/h24/2410/241016_1houdou/01_houdoushiryou.pdf (accessed on 11 December 2013).
- Hajat, S.; Sheridan, S.C.; Allen, M.J.; Pascal, M.; Laaidi, K.; Yagouti, A.; Bickis, U.; Tobias, A.; Bourque, D.; Armstrong, B.G.; et al. Heat-health warning systems: A comparison of the predictive capacity of different approaches to identifying dangerously hot days. Am. J. Public Health. 2010, 100, 1137–1144. [Google Scholar] [CrossRef] [PubMed]
- The Web Site for Heat Health Preventive Information, the Ministry of Environment. Available online: http://www.wbgt.env.go.jp/mail_service.php (accessed on 12 May 2014).
- Toloo, G.; FitzGerald, G.; Aitken, P.; Verrall, K.; Tong, S. Evaluating the effectiveness of heat warning systems: Systematic review of epidemiological evidence. Int. J. Public Health. 2013, 58, 667–681. [Google Scholar] [CrossRef] [PubMed]
- Weinstein, N.D. The precaution adoption process. Health Psychol. 1988, 7, 355–386. [Google Scholar] [CrossRef] [PubMed]
- Weinstein, N.D.; Rothman, A.J.; Sutton, S.R. Stage theories of health behavior: Conceptual and methodological issues. Health Psychol. 1998, 17, 290–299. [Google Scholar] [CrossRef] [PubMed]
- The Japan Meteorological Agency Website. Available online: http://www.jma.go.jp/jma/indexe.html (accessed on 1 July 2012).
- Lowe, D.; Ebi, K.L.; Forsberg, B. Heatwave early warning systems and adaptation advice to reduce human health consequences of heatwaves. Int. J. Environ. Res. Public Health. 2011, 8, 4623–4648. [Google Scholar] [CrossRef] [PubMed]
- Laurence, S.; Kalkstein, P.F.J.; Scott, G.J.; Libby, J.; Robinson, R. The Philadelphia hot weather-health watch/warning system: Development and application, summer 1995. B. Am. Meteorol. Soc. 1996, 77, 1519–1528. [Google Scholar] [CrossRef]
- Knowlton, K.; Kulkarni, S.P.; Azhar, G.S.; Mavalankar, D.; Jaiswal, A.; Connolly, M.; Nori-Sarma, A.; Rajiva, A.; Dutta, P.; Deol, B.; et al. Development and implementation of South Asia’s first heat-health action plan in Ahmedabad (Gujarat, India). Int. J. Environ. Res. Public Health. 2014, 11, 3473–3492. [Google Scholar] [CrossRef] [PubMed]
- Naughton, M.P.; Henderson, A.; Mirabelli, M.C.; Kaiser, R.; Wilhelm, J.L.; Kieszak, S.M.; Rubin, C.H.; McGeehin, M.A. Heat-related mortality during a 1999 heat wave in Chicago. Am. J. Prev. Med. 2002, 22, 221–227. [Google Scholar] [CrossRef] [PubMed]
- Semenza, J.C.; Rubin, C.H.; Falter, K.H.; Selanikio, J.D.; Flanders, W.D.; Howe, H.L.; Wilhelm, J.L. Heat-related deaths during the July 1995 heat wave in Chicago. N Engl. J. Med. 1996, 335, 84–90. [Google Scholar] [CrossRef] [PubMed]
- Gupta, S.; Carmichael, C.; Simpson, C.; Clarke, M.J.; Allen, C.; Gao, Y.; Chan, E.Y.; Murray, V. Electric fans for reducing adverse health impacts in heatwaves. Cochrane Database Syst. Rev. 2012, 7. [Google Scholar] [CrossRef] [PubMed]
- Hajat, S.; O’Connor, M.; Kosatsky, T. Health effects of hot weather: from awareness of risk factors to effective health protection. Lancet 2010, 375, 856–863. [Google Scholar] [CrossRef]
- Kilbourne, E.M.; Choi, K.; Jones, T.S.; Thacker, S.B. Risk factors for heatstroke. A case-control study. JAMA. 1982, 247, 3332–3336. [Google Scholar] [CrossRef] [PubMed]
- Kaiser, R.; Rubin, C.H.; Henderson, A.K.; Wolfe, M.I.; Kieszak, S.; Parrott, C.L.; Adcock, M. Heat-related death and mental illness during the 1999 Cincinnati heat wave. Am. J. Forensic Med. Pathol. 2001, 22, 303–307. [Google Scholar] [CrossRef] [PubMed]
- Wang, X.Y.; Barnett, A.G.; Yu, W.; FitzGerald, G.; Tippett, V.; Aitken, P.; Neville, G.; McRae, D.; Verrall, K.; Tong, S. The impact of heatwaves on mortality and emergency hospital admissions from non-external causes in Brisbane, Australia. Occup. Environ. Med. 2012, 69, 163–169. [Google Scholar] [CrossRef] [PubMed]
- D’Ippoliti, D.; Michelozzi, P.; Marino, C.; de’Donato, F.; Menne, B.; Katsouyanni, K.; Kirchmayer, U.; Analitis, A.; Medina-Ramon, M.; Paldy, A.; et al. The impact of heat waves on mortality in 9 European cities: results from the EuroHEAT project. Environ. Health. 2010, 9. [Google Scholar] [CrossRef]
© 2015 by the authors; licensee MDPI, Basel, Switzerland. This article is an open access article distributed under the terms and conditions of the Creative Commons Attribution license (http://creativecommons.org/licenses/by/4.0/).
Share and Cite
Takahashi, N.; Nakao, R.; Ueda, K.; Ono, M.; Kondo, M.; Honda, Y.; Hashizume, M. Community Trial on Heat Related-Illness Prevention Behaviors and Knowledge for the Elderly. Int. J. Environ. Res. Public Health 2015, 12, 3188-3214. https://doi.org/10.3390/ijerph120303188
Takahashi N, Nakao R, Ueda K, Ono M, Kondo M, Honda Y, Hashizume M. Community Trial on Heat Related-Illness Prevention Behaviors and Knowledge for the Elderly. International Journal of Environmental Research and Public Health. 2015; 12(3):3188-3214. https://doi.org/10.3390/ijerph120303188
Chicago/Turabian StyleTakahashi, Noriko, Rieko Nakao, Kayo Ueda, Masaji Ono, Masahide Kondo, Yasushi Honda, and Masahiro Hashizume. 2015. "Community Trial on Heat Related-Illness Prevention Behaviors and Knowledge for the Elderly" International Journal of Environmental Research and Public Health 12, no. 3: 3188-3214. https://doi.org/10.3390/ijerph120303188