1. Introduction
Among the three major classes of pesticides global herbicide sales have been in first place in recent years at around 48% of the total. A large number of herbicides have been developed by the agrochemical industry and are widely used around the world. The proportion of herbicide users in various areas is different and the differences are becoming bigger and bigger in recent years. Economically developed regions such as Europe and North America are the largest consumers of herbicides. Most herbicides exhibit low acute toxicity, and there are very few reports of acute poisoning incidents, but herbicide residues in vegetables and other foods can result in chronic harmful effects to humans and animals, and it is noted that chronic hazards, such as nervous system damage [
1,
2,
3], hormone imbalance [
4], fertility disorders [
5], immune system dysfunction [
6], and so on, pose a threat to human health.
The herbicide fluorochloridone (FLC) is widely used for pre-emergence control of broad-leaved weeds and annual grasses in carrot, sunflower, potato and several other crops. According to the European Food Safety Authority [
7], there is no evidence suggesting that fluorochloridone is genotoxic, carcinogenic or neurotoxic. The target organs of FLC as a potential endocrine disruptor in male rats are the testis and epididymides [
7], but there is no data to confirm this. In the report, the heart, major vessels and the haematopoietic system were also identified as potential target organs of FLC in rat [
7]. Acute and short-term NOAELs were set from these critical studies at 20 mg/kg bw/day, where the LOAEL is 25 mg/kg bw/day [
7]. In a recent investigation, we discovered that oral administration of FLC (30 mg/kg·bw/day–750 mg/kg·bw/day) for 28 days could damage the testis of adult Sprague Dawley (SD) rats by inducting oxidative stress [
8]. Abnormal cell-cycle progression, cellular mitodepressive activity and chromosomal abnormalities induced by FLC in
Allium cepa root meristematic cells were also demonstrated [
9]. The genotoxic and cytotoxic effects of pure FLC and its two main formulations in Chinese Hamster Ovary K1 (CHO-K1) cells using several end-points were reported [
10]. In addition, FLC and its two commercial formulations could induce single-strand DNA breaks
in vitro in mammalian cells [
11]. GC-MS methods of analysis are recommended for residues of FLC in plants, soil, water and air, but there is a data gap for a suitable method of analysis for body fluids and tissues [
7].
Based on the European Food Safety Authority (EFSA) report, there are no more detailed technical data about all the target organs or potential target organs in rats. Consistency of toxicity assessment data on FLC derived from different institutions is also important for revealing the characteristics of FLC toxicity. In this study, we report the 90 day toxicity and toxicokinetics (TK) of FLC in Wistar rats to characterize more detailed findings about target organs. Rats were gavaged with FLC daily for 90 days, followed by a 30 day recovery phase. The following clinical signs were observed: changes in body weight, food consumption, serum biochemistry, hematology, hormone level in serum, macroscopic findings at necropsy and histopathologic alterations. In addition, the TK profiles of FLC were reported using a validated UPLC-MS/MS assay by comparing different doses of FLC on the 1st, 60th, 75th and last (90th) dosing day.
2. Materials and Methods
2.1. Materials
Fluorochloridone (purity > 95.5%) was purchased from Jiangxi Anlida Chemical Co., Ltd. (Jiangxi, China). A FLC standard (purity 99.0%) was purchased from Sigma-Aldrich (Seelze, Germany). Verapamil was provided by the Shanghai Institute for Food and Drug Control (Shanghai, China) as an internal standard for the UHPLC-MS/MS analysis of FLC. Mass spectroscopy grade acetonitrile, methanol, and formic acid were purchased from Merck (Darmstadt, Germany). All other chemicals used were of the highest commercial grade available.
2.2. Experimental Animals and Housing Conditions
This study was conducted at the Shanghai Institute for Food and Drug Control (SIFDC, Shanghai, China) and was carried out according to the OECD Guidelines for the “Repeated Dose 90-day Oral Toxicity Study in Rodents” [
12]. All protocols were approved by the Institutional Animal Care and Use Committee of SIFDC. Six weeks male and female Wistar rats were obtained from Shanghai SLAC Laboratory Animal Co., Ltd. (Shanghai, China). Animals were kept in a room maintained at 23 ± 2 °C, relative humidity of 40%–70%, under a 12 h light/dark cycle.
2.3. Sample Preparation Procedures
FLC was suspended in 0.5% (w/v) sodium carboxymethyl cellulose (CMC-Na) used as a vehicle at concentrations of 1.56 mg/mL, 6.25 mg/mL and 25 mg/mL and fresh samples were prepared once every three days. The suspension was stirring during oral administration at room temperature.
2.4. Experimental Design
One hundred and ninety Wistar rats were fed a standard diet for 10 days to adapt to the environment before the experiments, and then divided into four groups at random by body weight. Group 0 was the control group which was gavaged with 0.5% (w/v) CMC-Na (n = 40, G0). Group 1 was gavaged with a dose of 31.25 mg/kg FLC (n = 50, G1). Group 2 was gavaged with a dose of 125 mg/kg FLC (n = 50, G2). Group 3 was gavaged a dose of 500 mg/kg FLC (n = 50, G3). Each group included half male and half female rats. Forty rats of each FLC group (G1, 2 and 3) and control group (G0) used in the ninety day toxicity test were gavaged with FLC for 90 days (Weeks 1–13) and feed without FLC to recover for 30 days (Weeks 14–17). The remaining ten animals of each FLC group (G1, G2 and G3) used in the TK test were gavaged with FLC for 90 days without a recovery phase. Body weights of all animals were measured once a week and the volume of FLC gavaged to each animal was adjusted according to their body weights.
On the 46th, 91th and 121th experimental date during the 90 day dosing phase and 30 day recovery phase of the 90 day toxicity test, 12, 16 and 12 animals, respectively, including half male and female rats, were fasted 18 h but with free access to water in a metabolic cage before histopathological examination. Animals’ blood were drawn via the abdominal aorta and urine of each animal was accumulated for clinical biochemistry, hematology, coagulation, hormone detection and routine urine tests. The main organs like brain, heart, liver, lung, kidney, adrenal gland ratio, thymus, spleen, testis, epididymis, prostate, seminal vesicle, ovary, uterus and fallopian tube were removed and weighed immediately for histopathology. Other organs and tissues like the eyeballs, lymphonodus, salivary glands, pancreas, stomach, intestine, bladder, vagina, sciatic nerve, pituitary gland, spine, and so on were also removed for histopathology. On the 1st, 60th, 75th and 90th experimental days of the TK test, G1, G2 and G3 included eight time points at 30 min. and 1, 2, 3, 5, 8, 10 and 24 h after administration before the next dosing on each experimental date. Blood samples of ten animals of each group were collected (anticoagulant: heparin sodium) via the orbital sinus.
2.5. Clinical Observations
Clinical observations were performed every day for all animals prior to the oral administration and during the course of gavage. Body weight data and food consumption data were collected once a week during the study period.
2.6. Clinical Pathology
Serum and plasma of all animals was accumulated by centrifugation at 804× g for 10 min. at 4 °C (Hettich Rotanta 460R Centrifuge, Tuttlingen, Germany). Biochemistry of the serum samples was tested using a Hitachi 7060 Automatic Biochemical Analyzer (Naka, Japan). Hematology of plasma samples (with K2-EDTA added as anticoagulant) was analyzed on a Bayer ADVIA 120 Automatic Blood Cell Analyzer (Leverkusen, Germany). Plasma samples (with added sodium citrate as anticoagulant) were tested for coagulation function on a Sysmex CA1500 Full-Automatic Coagulation Analyzer (Kobe, Japan). Urine samples were collected for routine urine tests (Bayer HealthCare Clinitek Status Urine Analyzer, NY, USA). The levels of testosterone (T), estradiol (E2), follicle-stimulating hormone (FSH) and luteinizing hormone (LH) in serum were measured by radioimmunoassay.
Blood samples were collected from the abdominal aorta on the 46th, 91th and 121th experimental date for clinical biochemistry, hematology, coagulation and routine urine tests. The following indicators of serum were determined: alanine aminotransferase, alkaline phosphatase, aspartate aminotransferase, γ-glutamyltraspeptidase, total protein, albumin, creatine phosphokinase, glucose, cholesterol, triglycerides, total bilirubin, urea nitrogen, creatinine, uric acid, glycosylated hemoglobin, high density lipoprotein, low density lipoprotein, sodium ion, potassium ion, chloride ion. Samples were collected in tubes containing K2-EDTA for the hematology analyses and the following indicators were determined: total leukocyte count, differential leukocyte count, hemoglobin, red blood cell count, hematocrit, red blood cell distribution width—coefficient of variation, mean corpuscular hemoglobin concentration, platelet count, absolute reticulocytes count and so on. Samples collected in tubes containing sodium citrate were analyzed for coagulation function and the following indicators were determined: activated partial thromboplastin time, thromboplastin time, fibrinogen, fibrinogen concentration, prothrombin time, prothrombin time international normalized ratio. Urine samples were tested for pH, urobilinogen, glucose, etc.
2.7. Necropsy and Histopathology
Animals were sacrificed by exsanguination while under deep anesthesia. The final body weight was recorded, and a complete gross necropsy was conducted. Major organs were weighed, and a complete standard set of tissues (>30 per animal) were preserved in neutral buffered formalin and male reproductive organs were preserved in Davison’s fixative. Some main organs like brain, heart, liver, lung, kidney, adrenal gland ratio, thymus, spleen, testis, epididymis, prostate, seminal vesicle, ovary, uterus and fallopian tubes were weighted immediately. Main organ coefficients (organ weight × 100 / body weight) were calculated. Organs and tissues were embedded in paraffin, sectioned, stained with hematoxylin and eosin (H&E), and examined by histological analysis (
Figure 1 and
Figure 2). Histological diagnosis was performed according to [
13,
14].
Figure 1.
Mean body weight trend chart of Wistar rats treated with FLC. G0 means Group 0 (Control, 0.5% CMC-Na), G1 means Group 1 (FLC 31.25 mg/kg), G2 means Group 2 (FLC 125 mg/kg), G3 means Group 3 (FLC 500 mg/kg).
Figure 1.
Mean body weight trend chart of Wistar rats treated with FLC. G0 means Group 0 (Control, 0.5% CMC-Na), G1 means Group 1 (FLC 31.25 mg/kg), G2 means Group 2 (FLC 125 mg/kg), G3 means Group 3 (FLC 500 mg/kg).
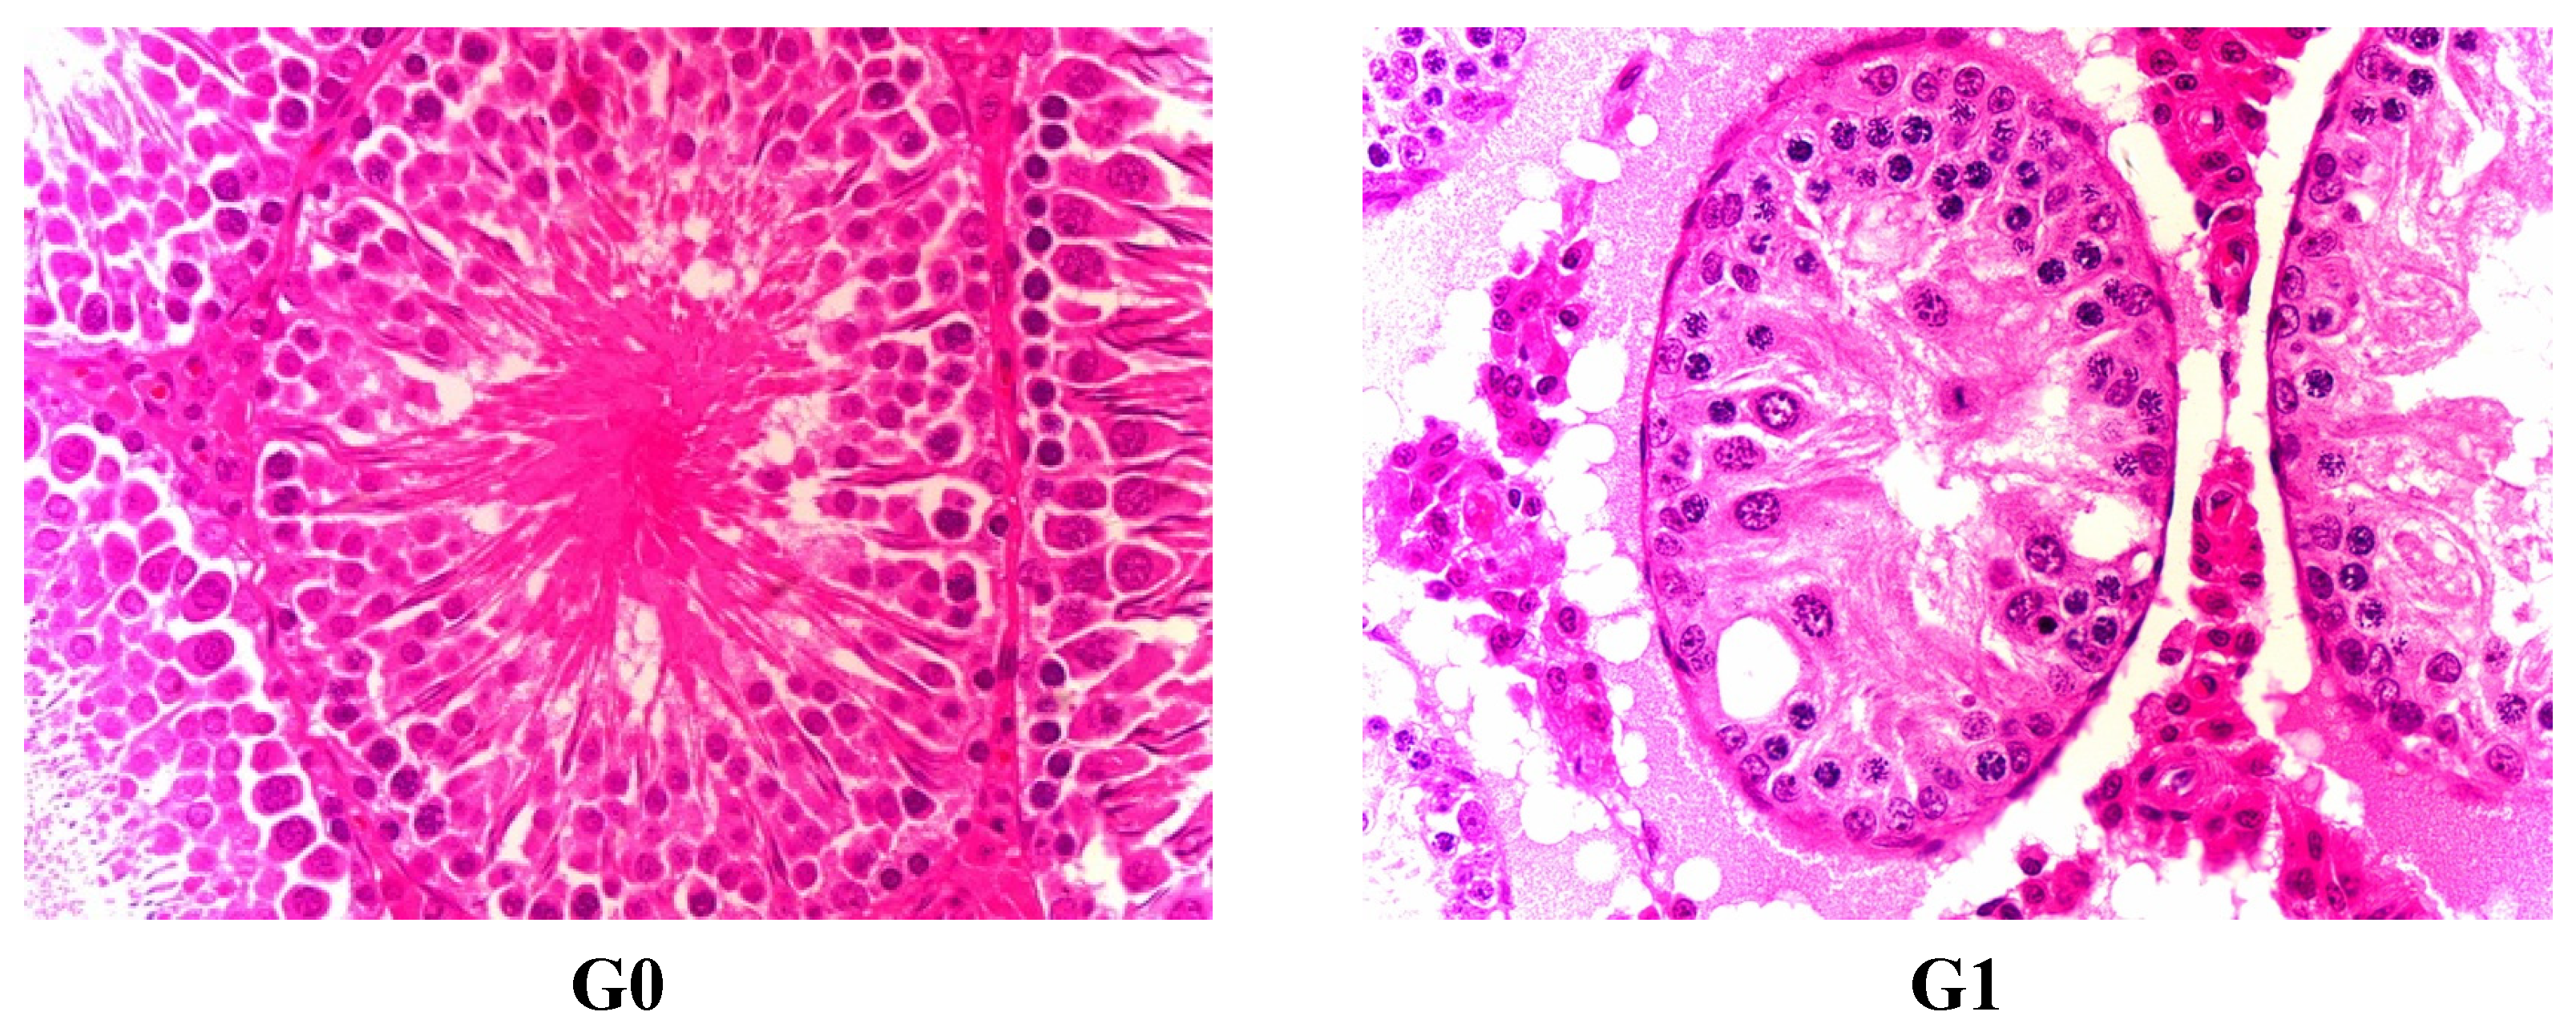
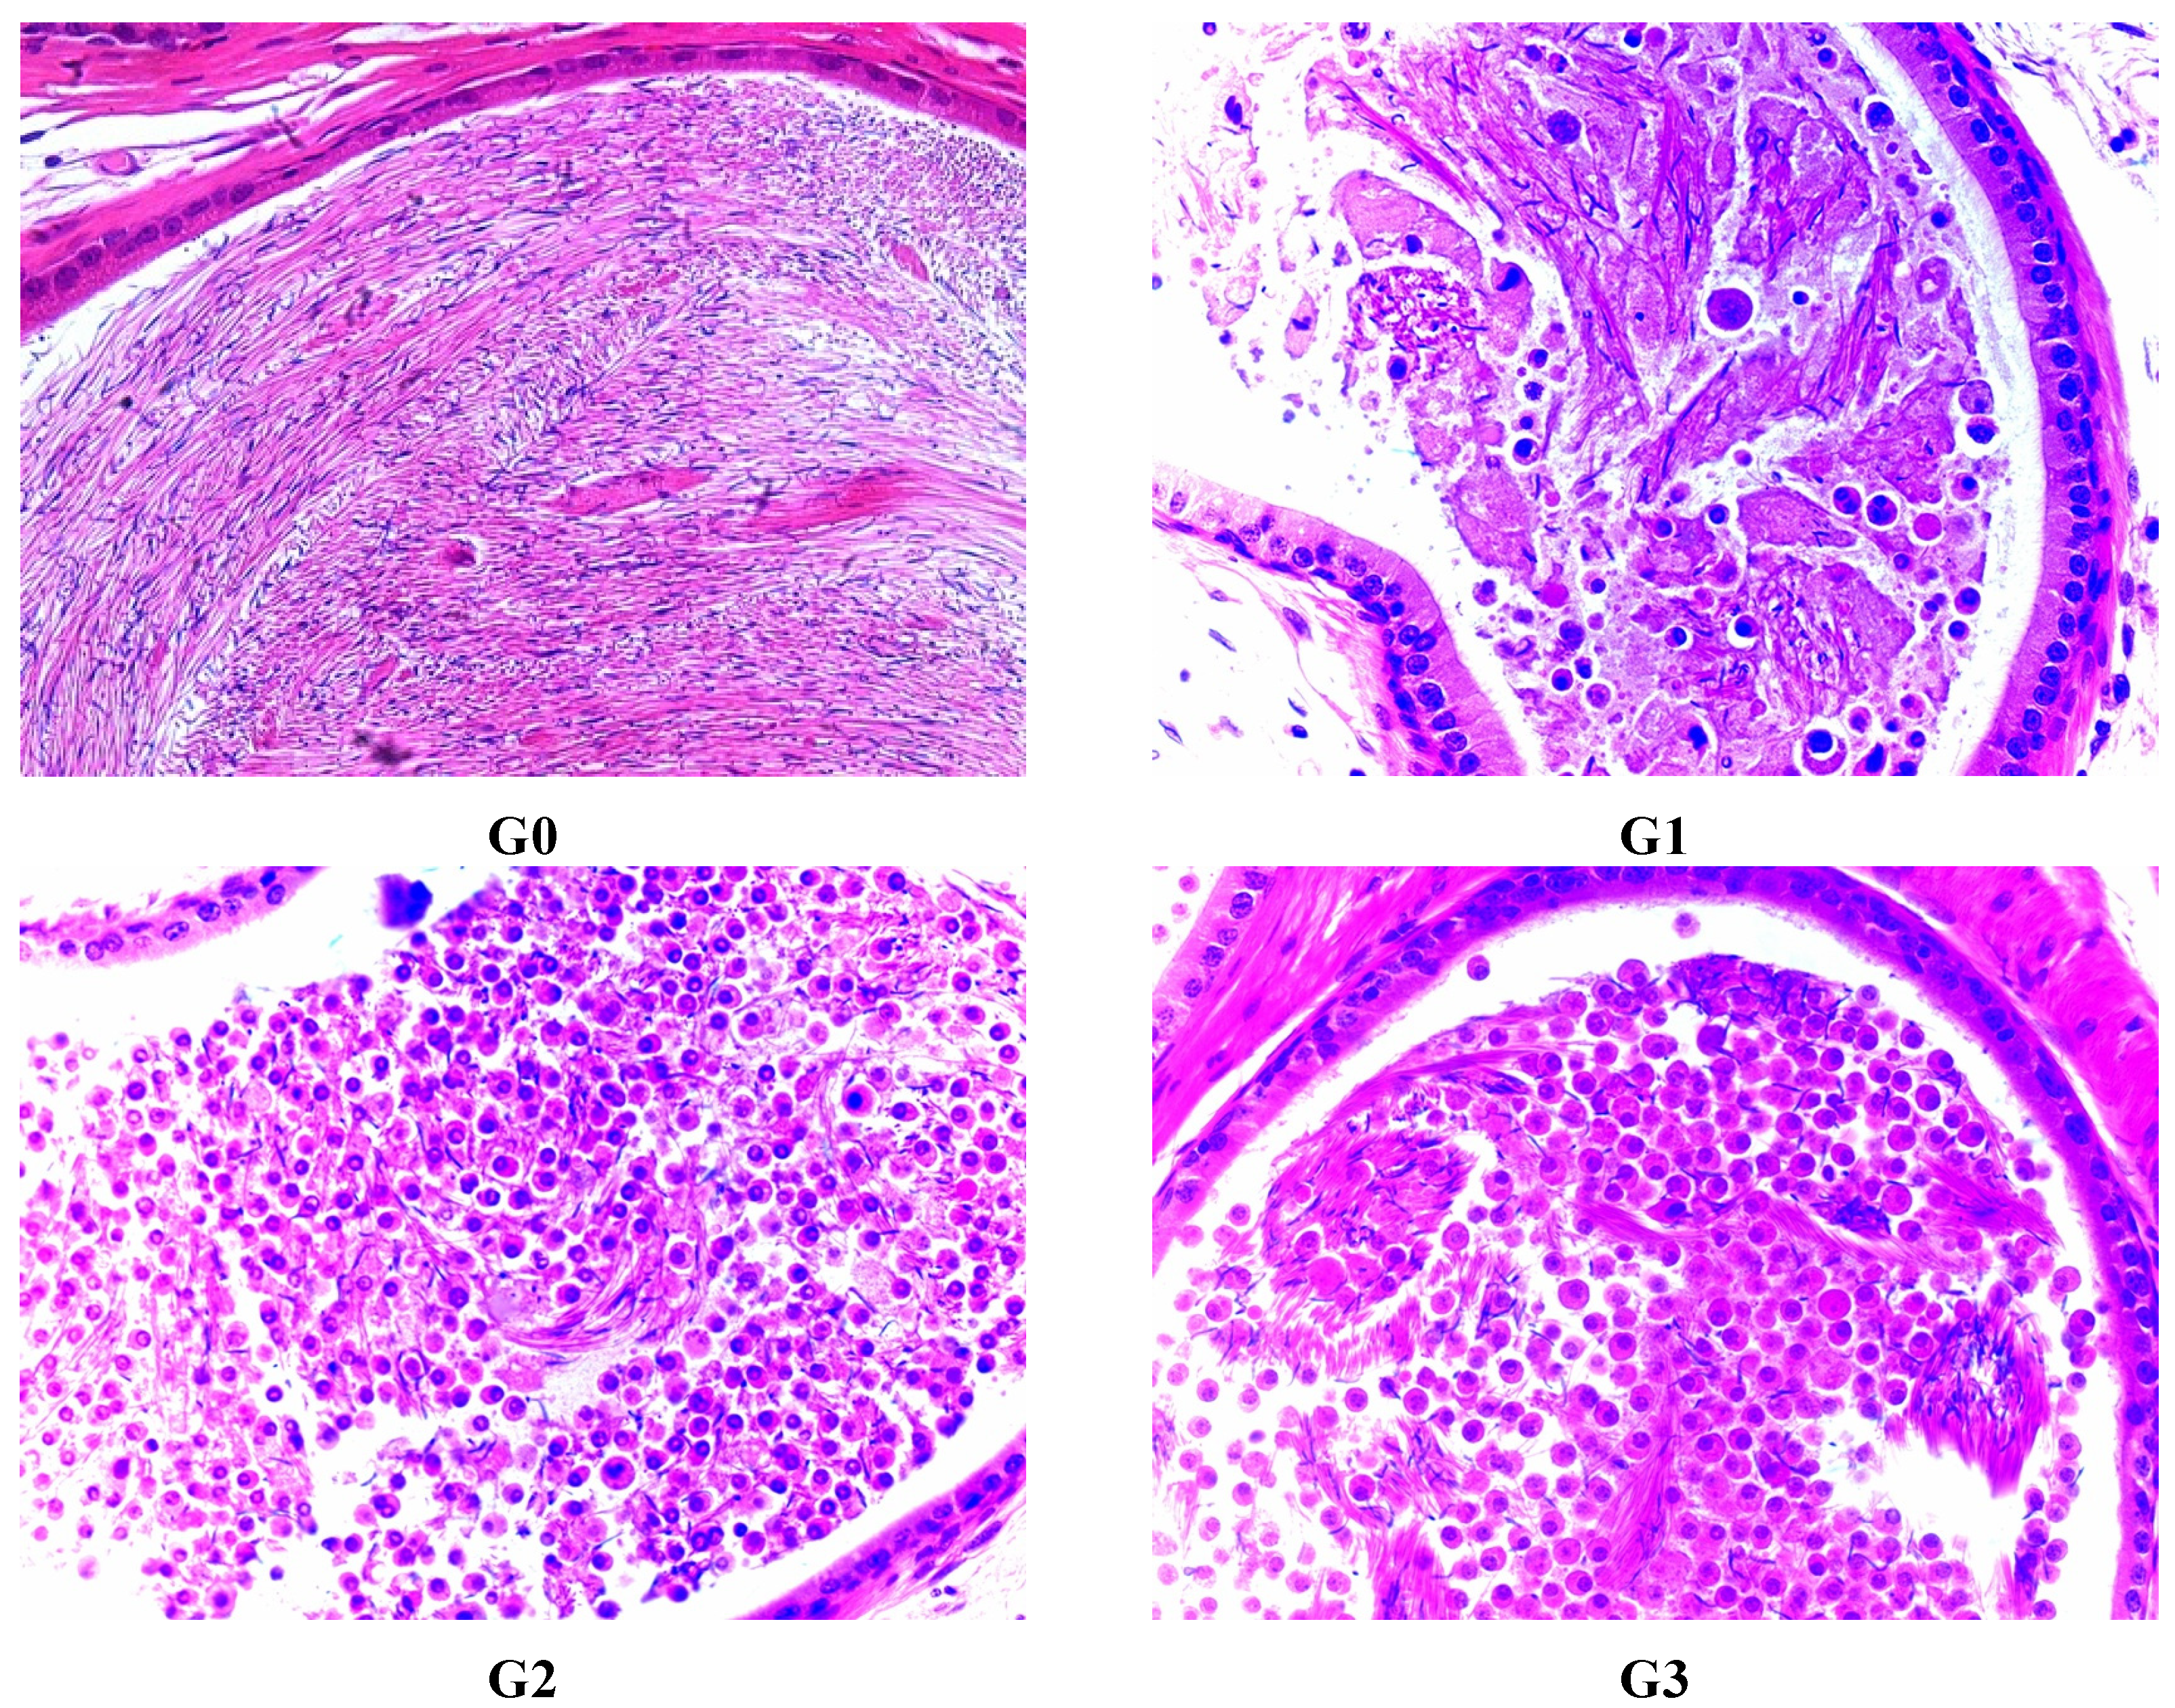
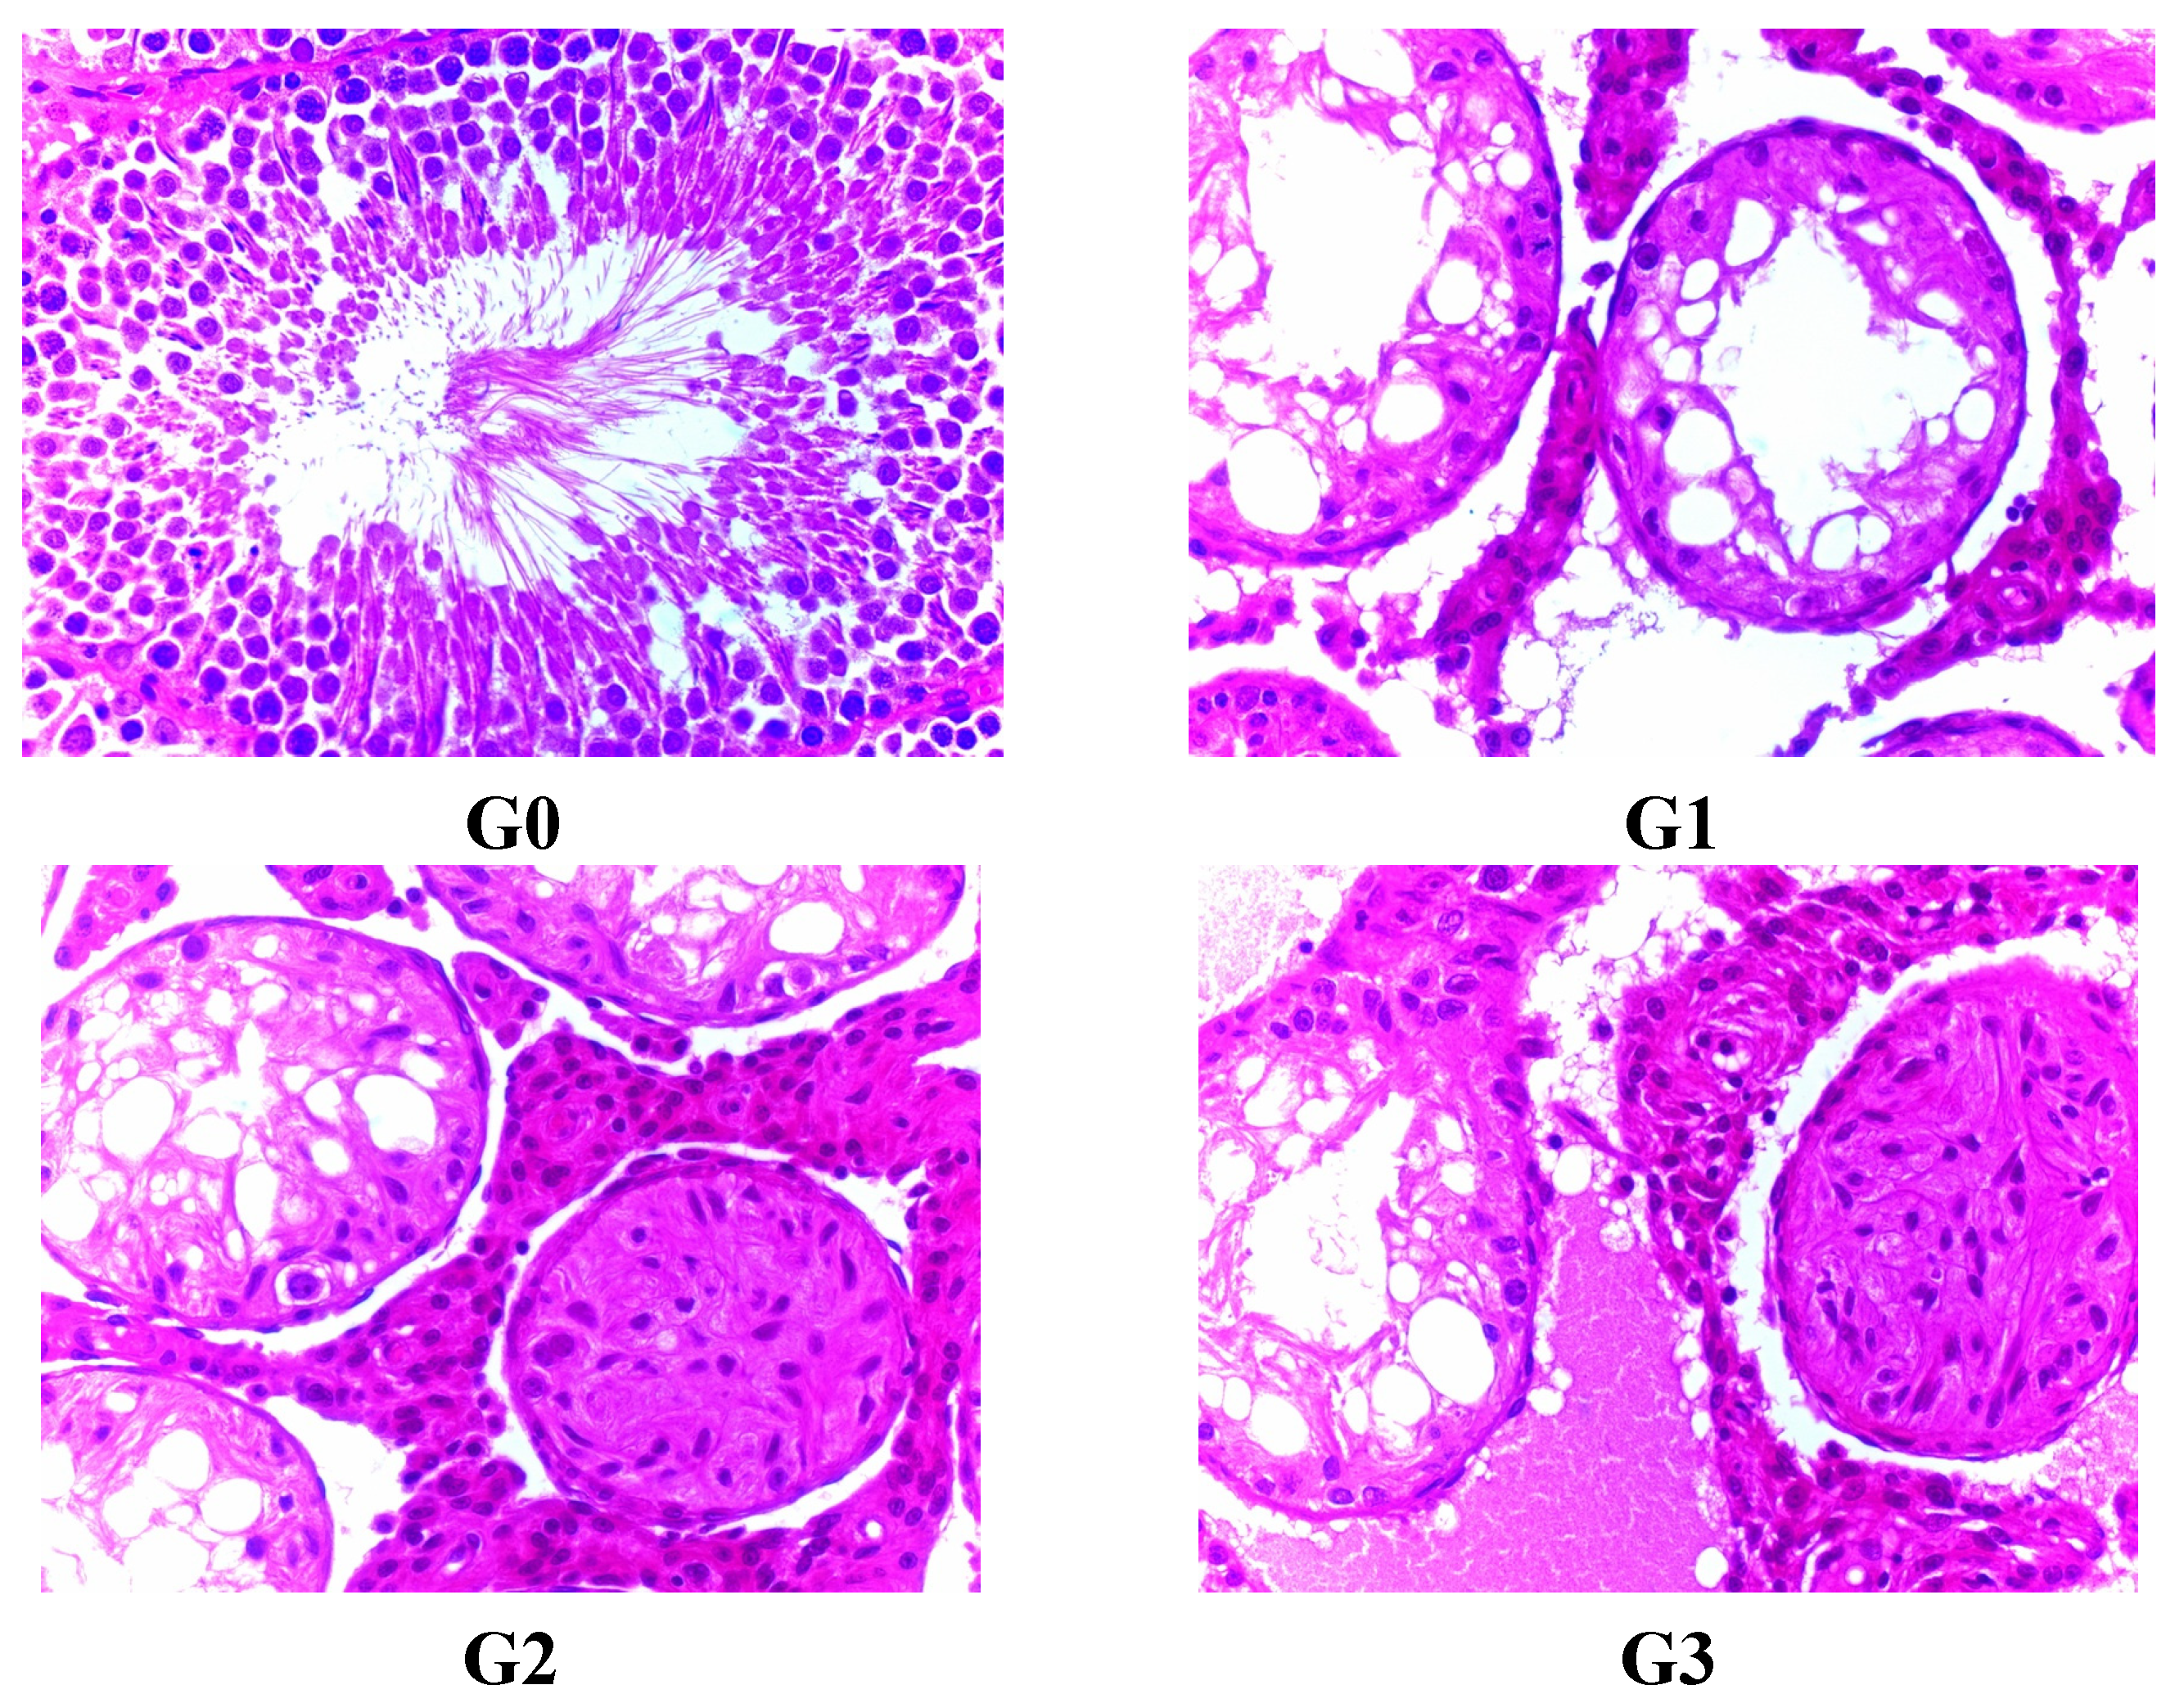
Figure 2.
Lesion of testis in male rats treated with FLC on day 45 for atrophic and degenerating tubules, stained with H&E. G0 means Group 0 (0.5% CMC-Na), G1 means Group 1 (FLC 31.25 mg/kg), G2 means Group 2 (FLC 125 mg/kg), G3 means Group 3 (FLC 500 mg/kg).
Figure 2.
Lesion of testis in male rats treated with FLC on day 45 for atrophic and degenerating tubules, stained with H&E. G0 means Group 0 (0.5% CMC-Na), G1 means Group 1 (FLC 31.25 mg/kg), G2 means Group 2 (FLC 125 mg/kg), G3 means Group 3 (FLC 500 mg/kg).
2.8. Plasma FLC Determination
Plasma was cumulated by centrifugation at 804 × g for 10 min. at 4 °C (Hettich Rotanta 460R Centrifuge) and the supernatant was stored at −70 °C until analysis. Plasma samples were analyzed for FLC by an UPLC-MS/MS method. Briefly, a 100 μL aliquot of plasma was transferred into a 1.5-mL tapered plastic centrifuge tube, followed by the addition of 10 μL of verapamil (0.05 μg/mL) as an internal standard. The mixture was mixed for 30 s, followed by an addition of 300 μL of acetonitrile. The mixture was vortexed for 3 min and centrifuged at 36,670 × g for 10 min at 4 °C (Sartorius SIGMA 3K30 Centrifuge, Göttingen, Germany). An aliquot of the upper phase (1 μL) was subsequently injected into the UPLC-MS/MS system for analysis. An API 5000 triple quadrupole mass spectrometer (AB SCIEX, Boston, MA, USA) accompanied by Ultra Performance Liquid Chromatography was performed on an ACQUITY UPLC BEH C18 column (2.1 mm × 50 mm, 1.7 μm, Waters, Milford, MA, USA). The mobile phase was 0.1% formic acid in water-0.1% formic acid in acetonitrile (50:50, v/v) at a flow rate of 0.6 mL/min. The ion-spray potential was set at 5.5 kV, and the source temperature was 450 °C. Multiple reaction monitoring (MRM) were performed by using nitrogen as the collision gas. The analysis were detected by monitoring the transtitions m/z 312.0 → m/z 292.0 for FLC and m/z 456.2 → m/z 165.2 for verapamil (IS), with collision energies (CE) of 31 eV and 41 eV, respectively. The declustering potentials (DP) of FLC and verapamil were 188 V and 218 V. The calibration equation was determined by least-squares linear regression (weighted 1/x × x) over the range 3–3000 ng/mL in plasma.
2.9. Statistical Analysis
All measurements are expressed as the means ± standard deviation. Statistical analysis was performed with one-way analysis of variance (ANOVA) and Student’s t test using SPSS 19.0. p-values lower than 0.05 were considered to be significant. Toxicokinetic parameters (Tmax, Cmax, Clearance [CLz/F] and area under the curve [AUC]) in rats were assessed by a non-compartmental method using the Drug and Statistics 2.1 (DAS 2.1) software package (Mathematical Pharmacology Professional Committee of China, Shanghai, China).
4. Discussion
EFSA has reported that oral administration of FLC could affect the testis, epididymis, heart, great vessels and haematopoietic system in rats [
7]. However, there is little available technical data about the systemic toxicity and toxicokinetics of FLC after repeated administration. In this work we aimed to provide a sound basis for the safety evaluation of FLC.
The results of our studies demonstrated that 90 days of repeated administration of FLC could cause severe toxicity to the testis and epididymis, obvious toxicity to the liver and hematopoietic system, and potential toxicity to the brain, heart, pancreas, kidney and thymus. There were no obvious signs to suggest toxicity to the great vessels. Testis and epididymis lesion from the microscopic examination combined with decreased organ coefficients showed a severe toxicity of FLC to the reproductive organs in male rats. What is interesting is that the level of testosterone was increasing in male rats treated with high doses of FLC, but different sperm cell stages were not observed in the seminiferous tubules. Testosterone is secreted by Leydig cells and the adrenal gland to assist in completing spermatogenesis. Leydig cell lesions were not apparent from the microscopic examination. It was reported that testosterone could decrease the level of HDL-C [
15,
16,
17,
18], but increased levels of HDL-C were observed in both male and female rats. Testosterone also could improve insulin sensitivity [
15,
19,
20]. This finding suggested that FLC could be an endocrine disrupter. Further studies should be performed to clarify the toxicity and mechanism of action of FLC on the testis, epididymis, pancreas, vessels,
etc. Tubular atrophy is an end-stage lesion where there are no germ cells left within a tubule. It can result from progressive degeneration and phagocytosis/exfoliation of germ cells or cumulative depletion of germ cells. It is a treatment-related change. A greater number are present in the epididymis in all male rats treated with FLC, due to the inefficiency of the first cycle of spermatogenesis. Increased numbers of sloughed, degenerate germ cells in the epididymal lumen of male rats treated with FLC generally reflect ongoing severe testicular degeneration/atrophy, spermatid degeneration, or germ cell exfoliation. The location of the cell debris can provide important information on when cells were sloughed from the testes. Cell debris in the caput would have been released from the testis within the previous 3 days whereas cells in the distal cauda were probably released more than a week previously. The presence of cell debris in the epididymis is often associated with increased prominence of clear cells in the distal corpus and cauda, probably due to increased endocytosis of particulate matter. The decreased testis and epididymis coefficients in all FLC-treated groups without a recovery trend revealed that the oral NOAEL of the 90 day toxicity study could be much less than 31.25 mg/kg according to the histopathological findings. This finding is similar to the EFSA report. Previous work on FLC has suggested that the compound interferes with mitosis. The current findings suggested toxicity to organs or cell grouping which were very mitotically active like the seminiferous tubules (spermatogonia to primary spermatocytes) and liver.
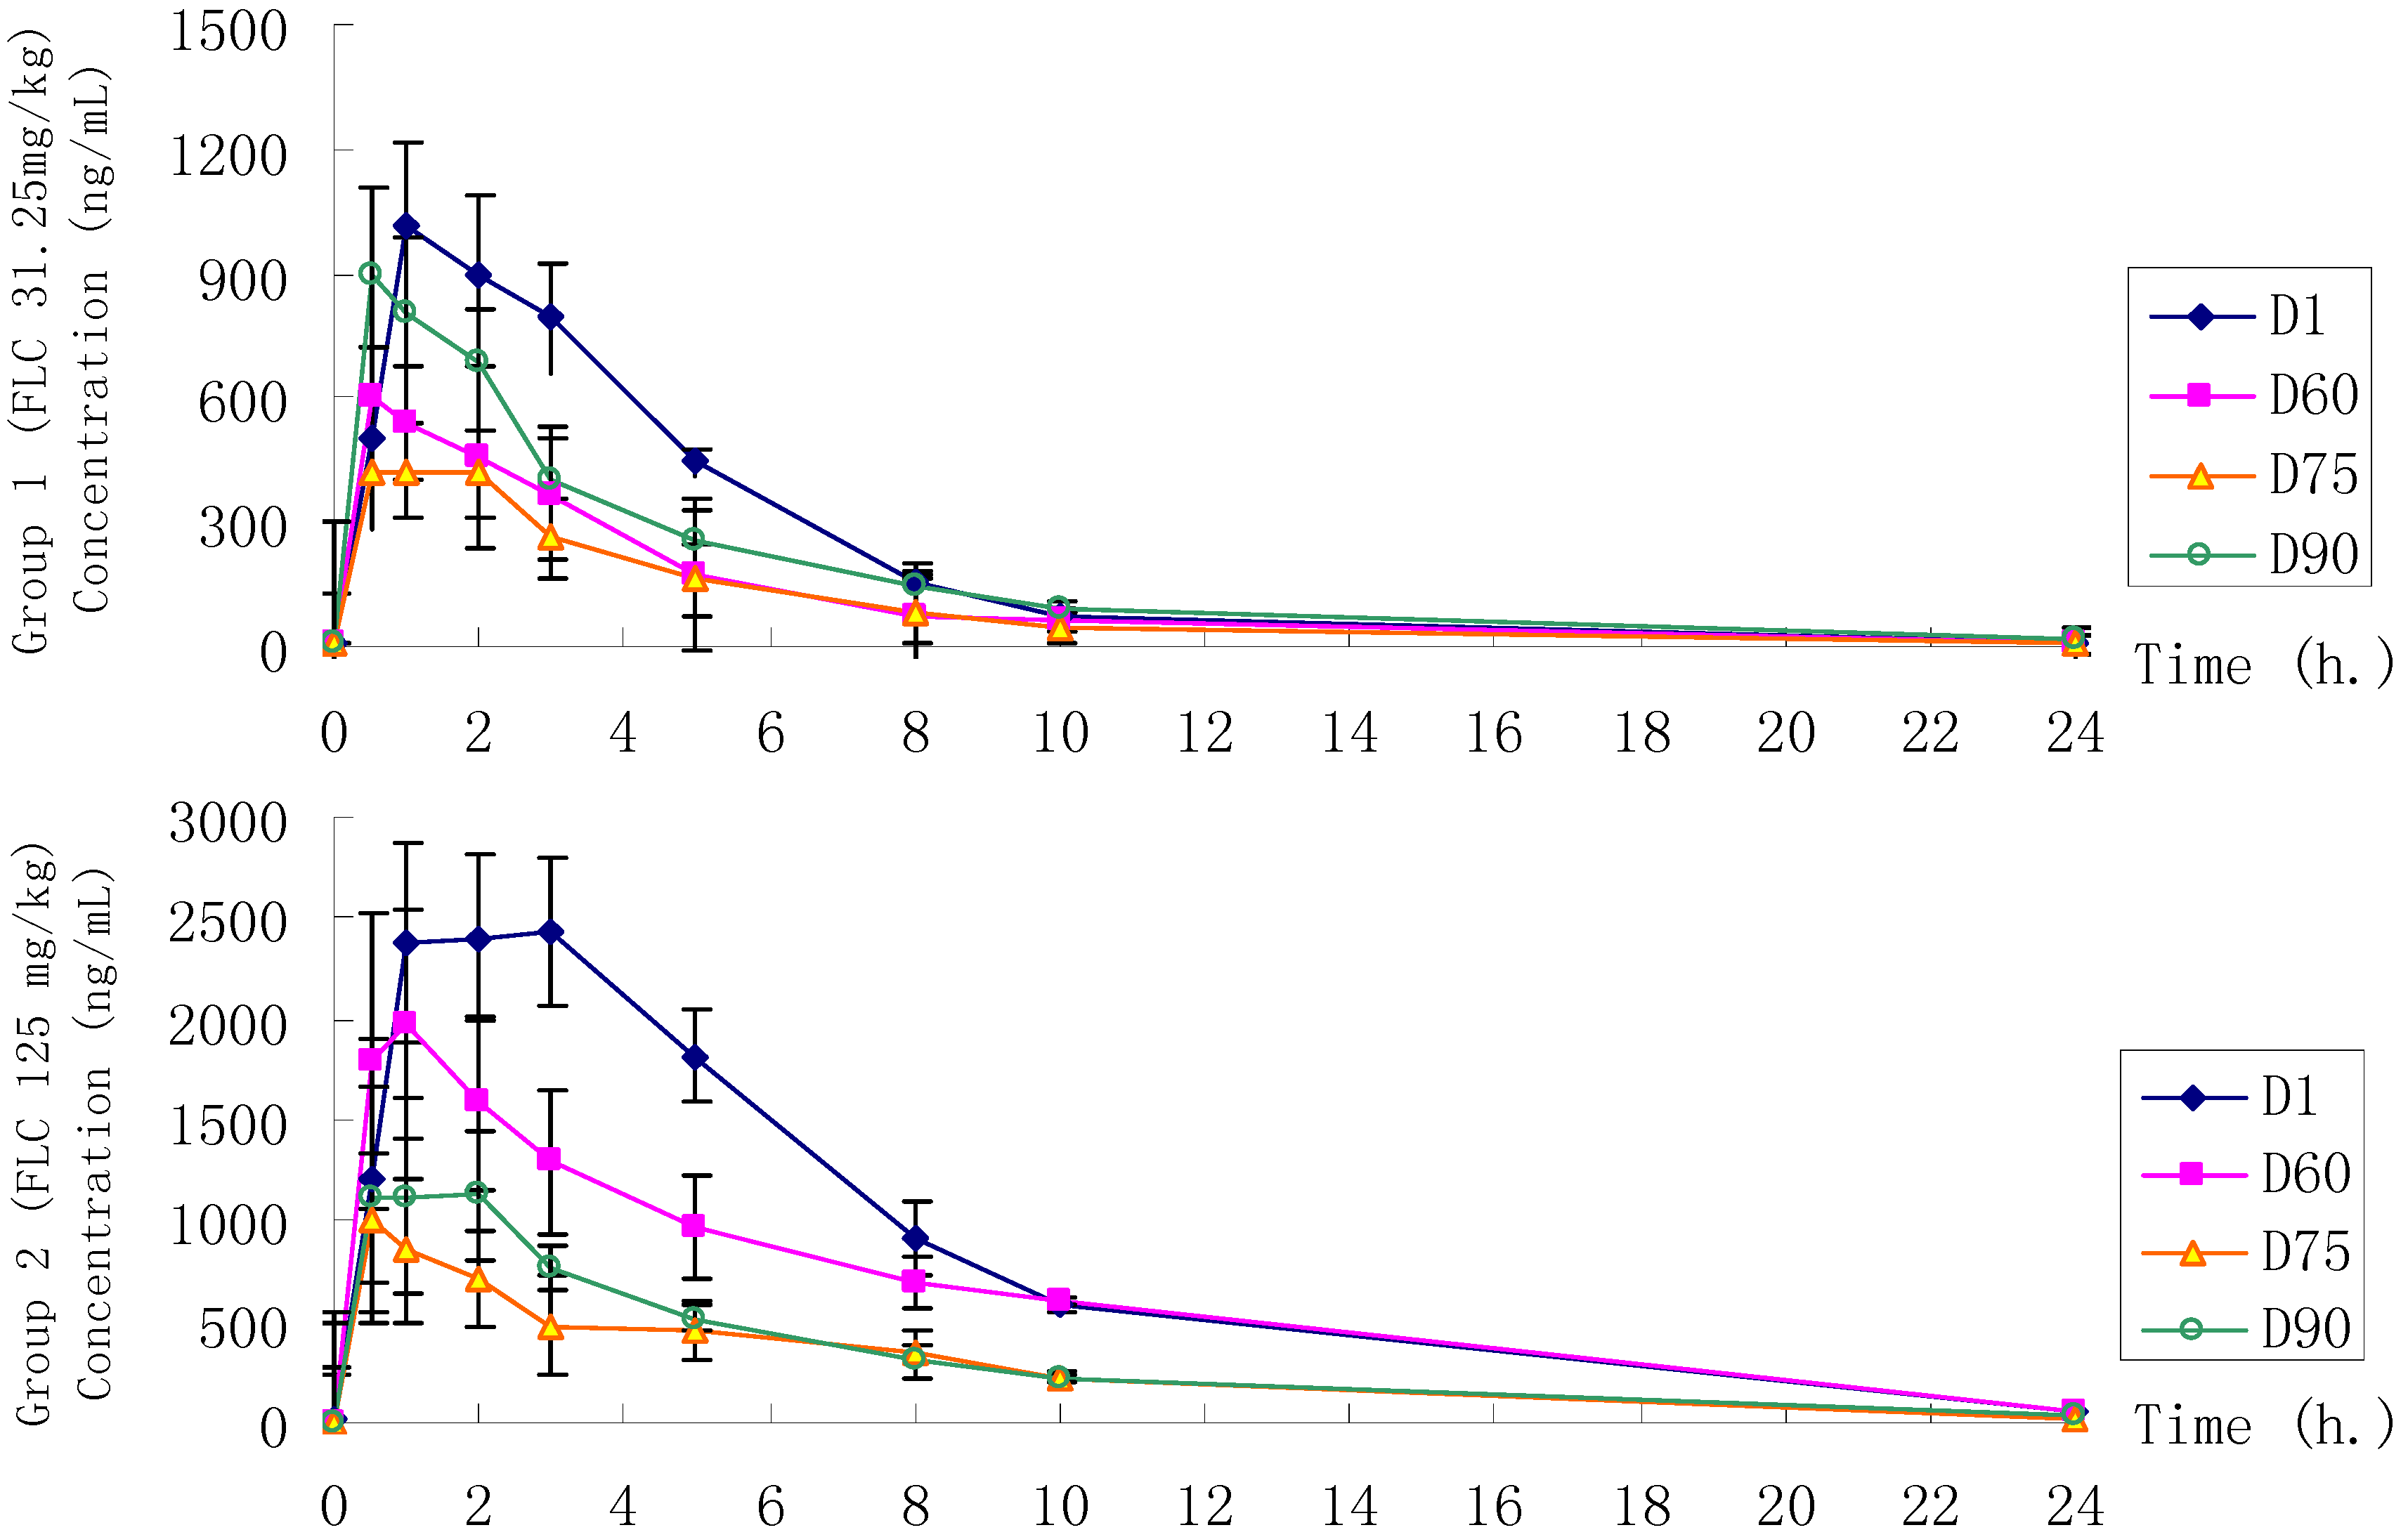
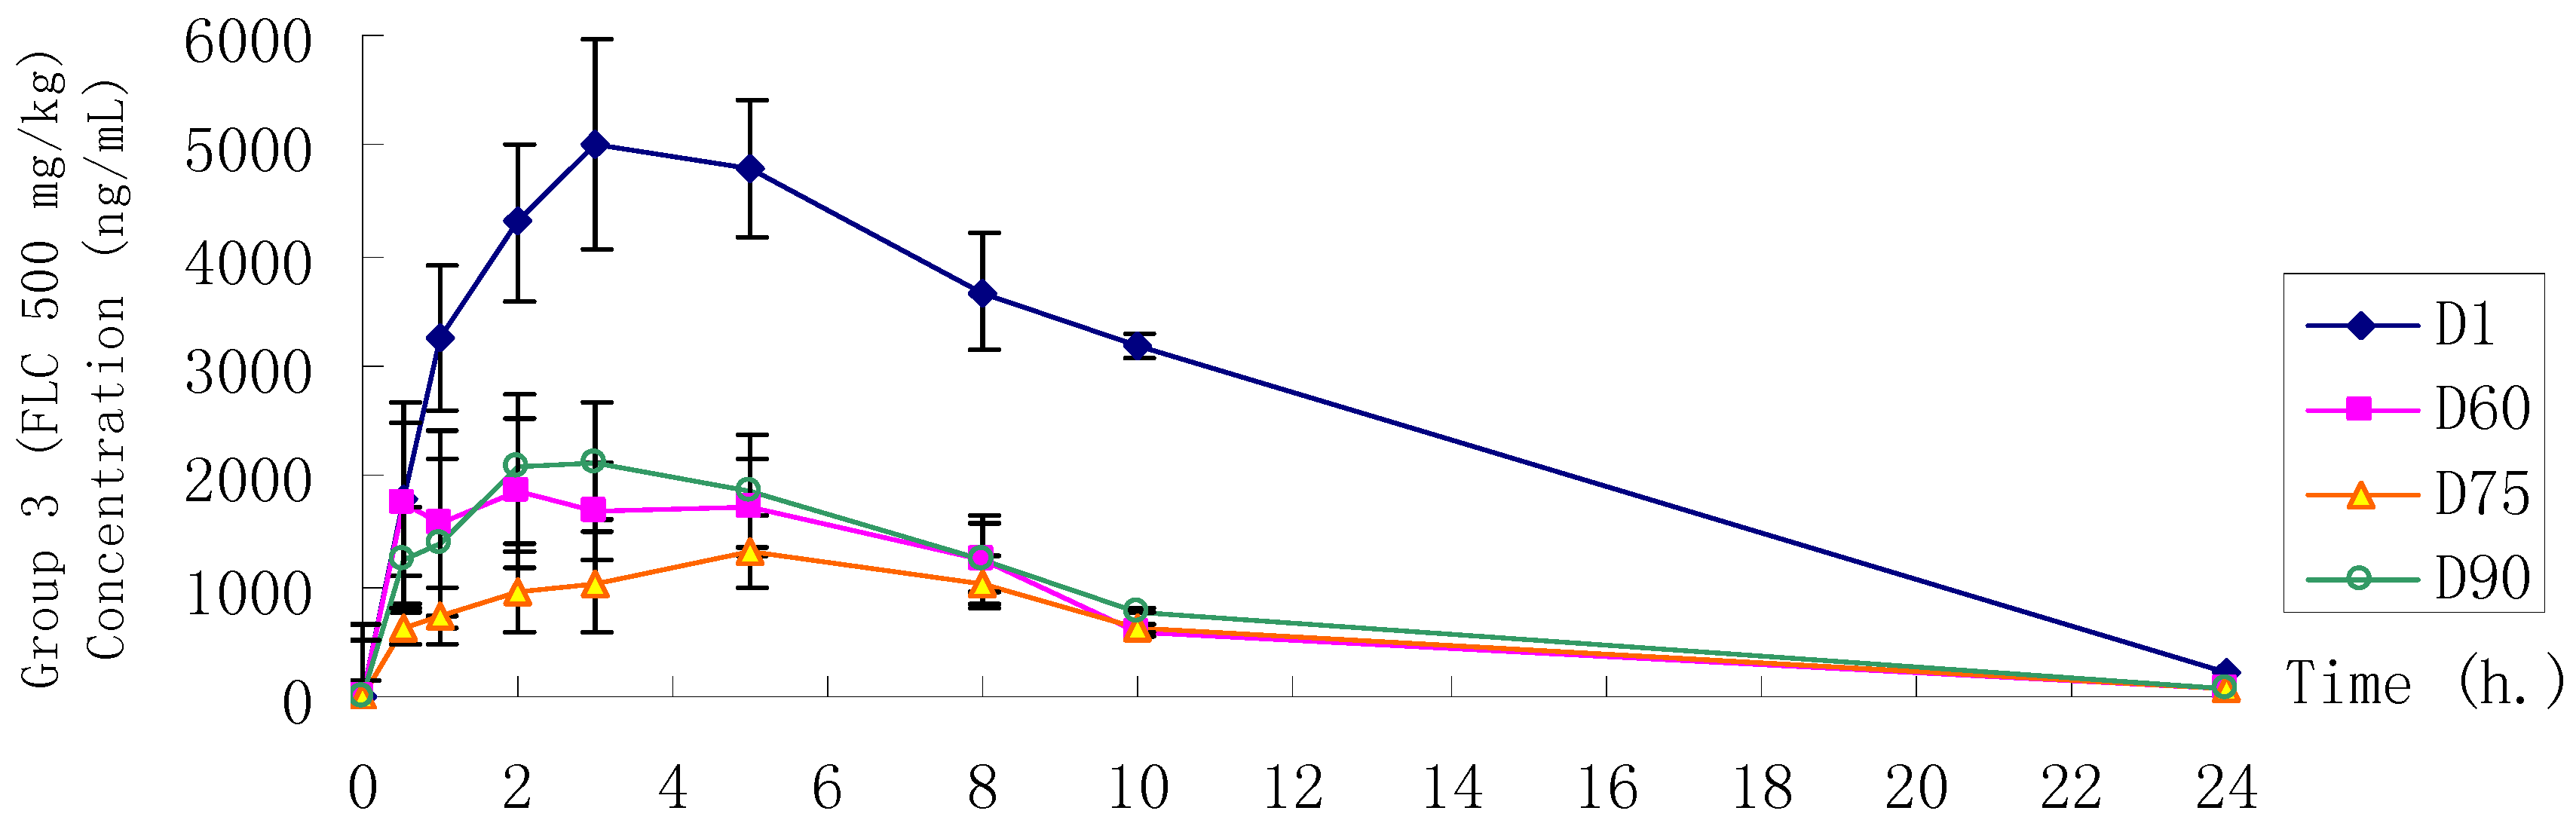
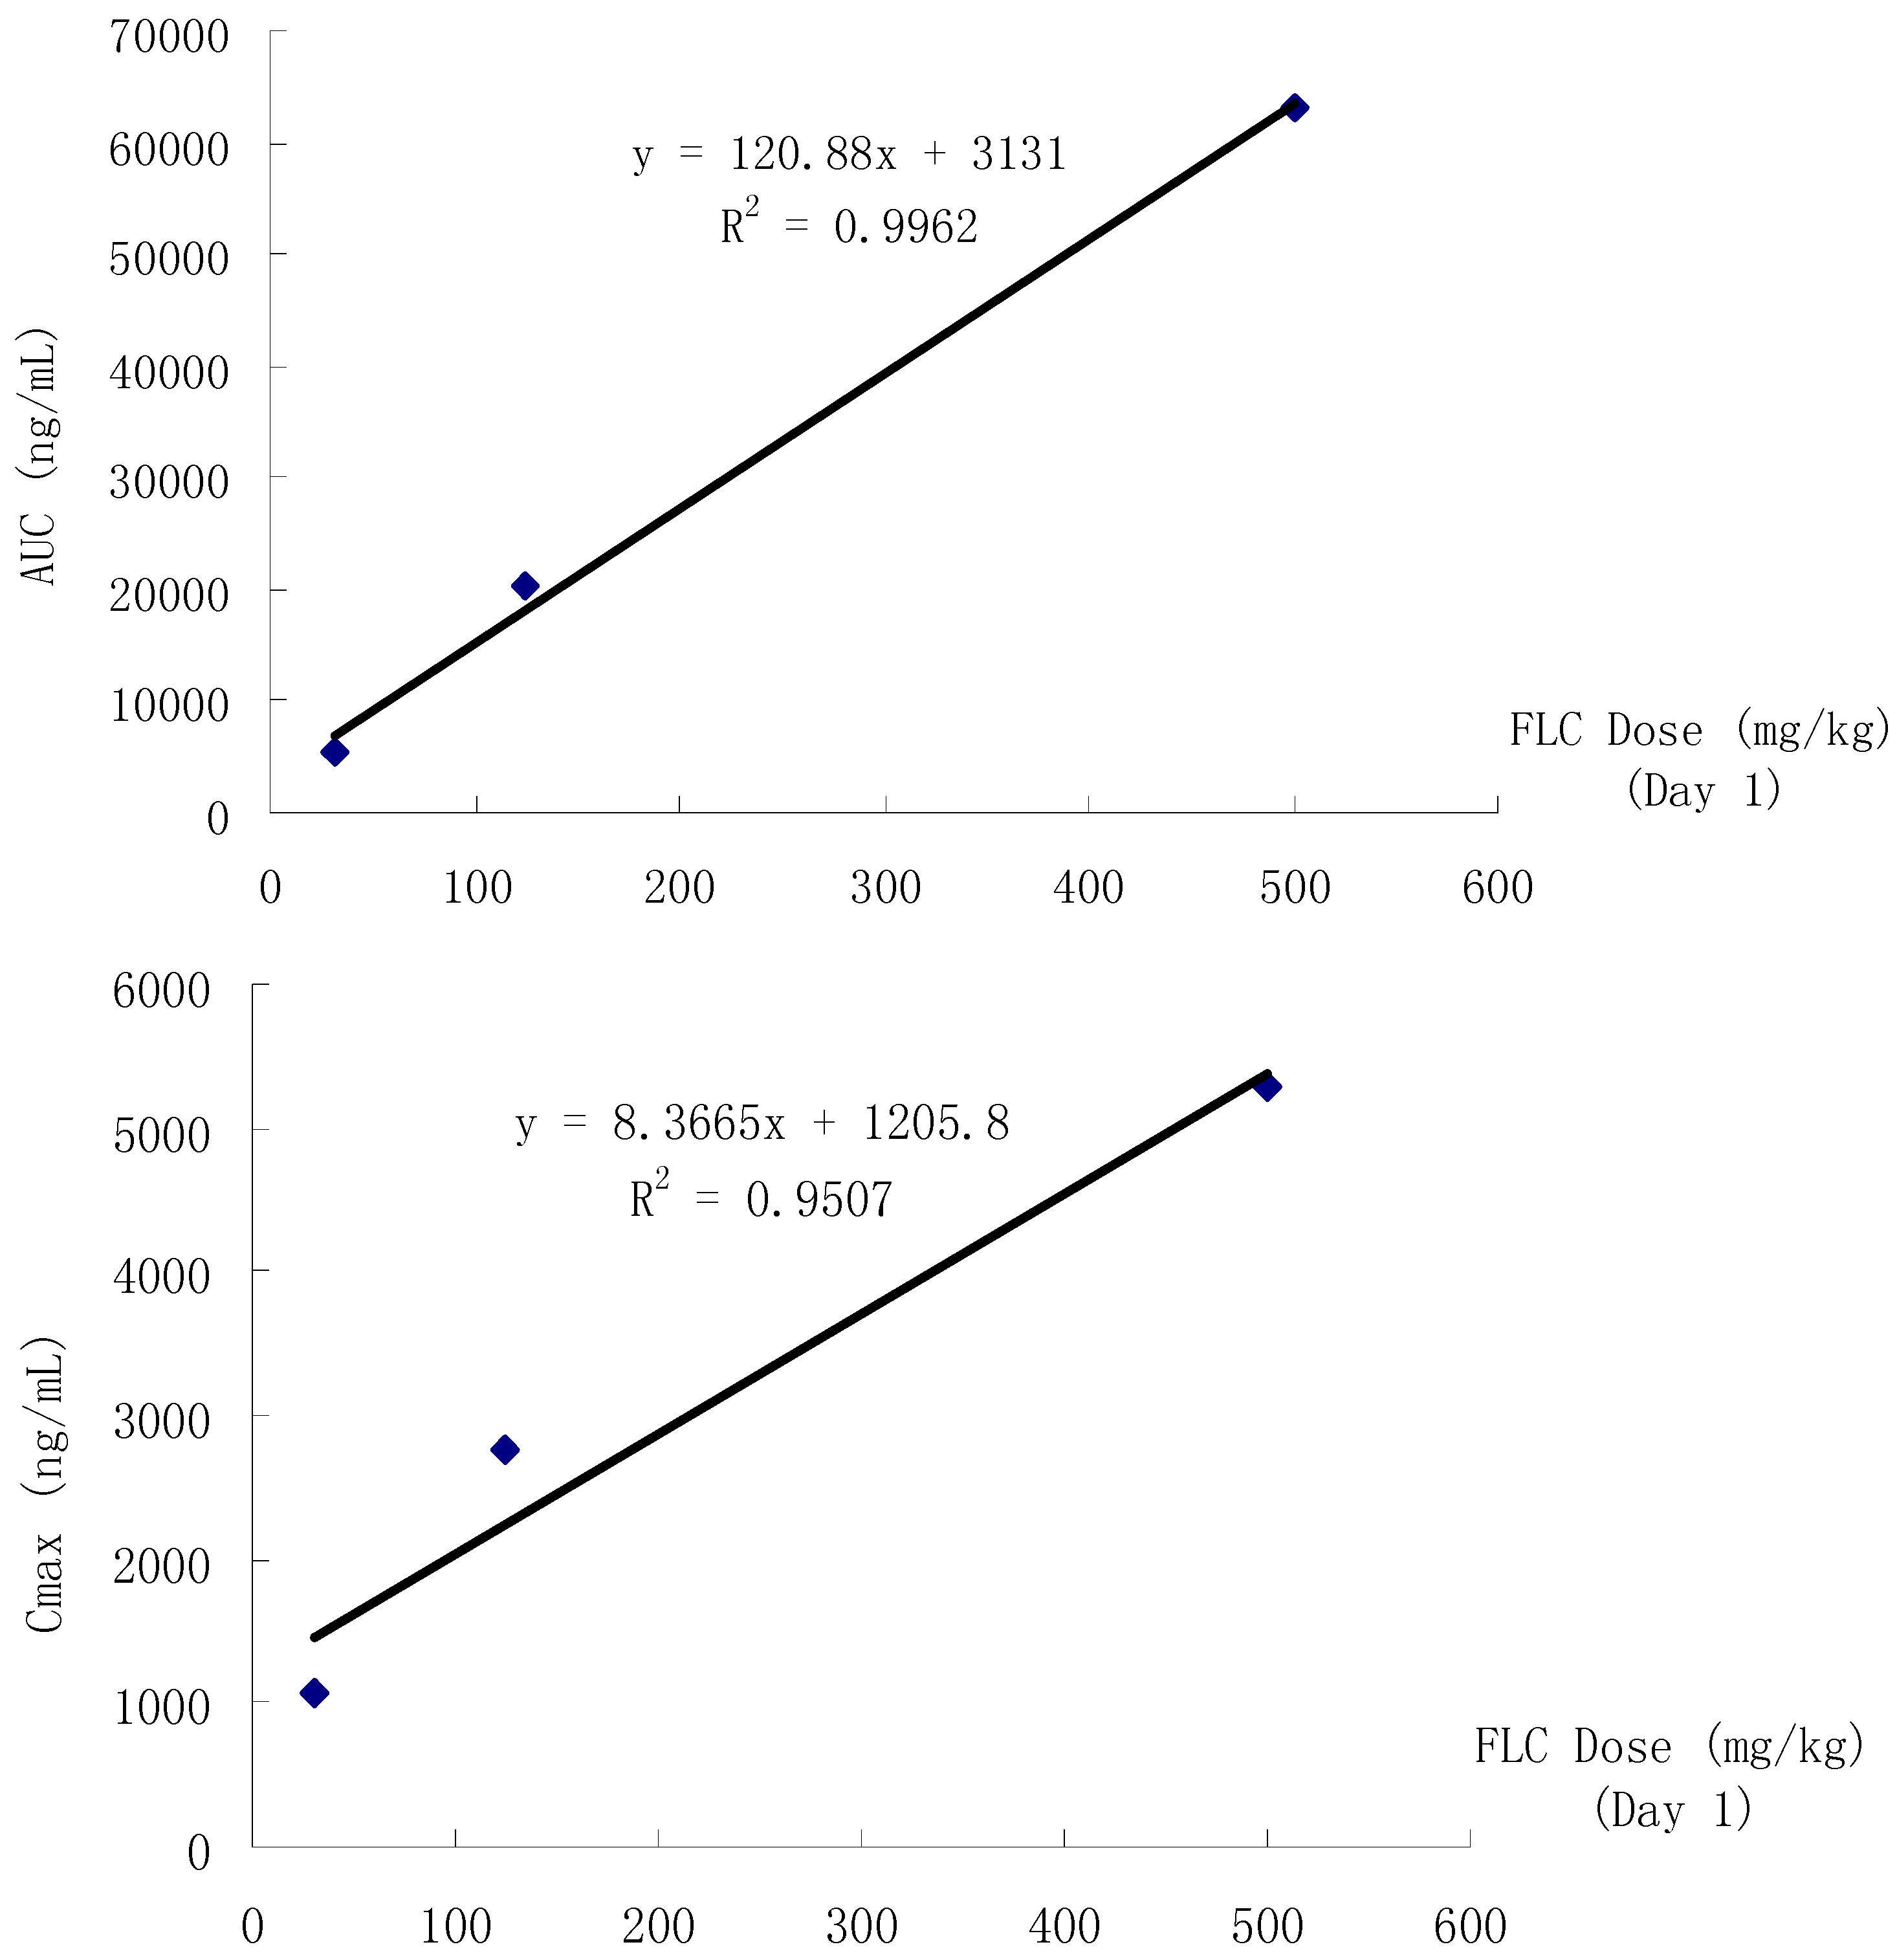
The toxicokinetic findings provided a clue to understand the influence of the pattern of repeated exposure to FLC in rats on the absorption phase. FLC (31.25–500 mg/kg) showed a persistent plasma concentration (436–5708 ng/mL) throughout the dosing phase with no significant differences between male and female rats. With the prolongation of the treatment time, the
in vivo FLC exposure decreased in all groups. As
Table 10 and
Table 11 indicated, the AUC and C
max of FLC decreased and clearance increased. This discovery suggests that there was possibily an increase in xenobiotic metabolism due to the increased activity or expression of liver enzymes. Therefore, aside from the results of this study, the distribution of FLC in rat tissues, especially in the testis and epididymis, should be studied in the future to explain the mechanism of toxicity of FLC to reproductive organs, liver, brain, spleen,
etc.


