
Heat Waves and Morbidity: Current Knowledge and Further Direction-A Comprehensive Literature Review

Abstract
:1. Introduction
2. Methods
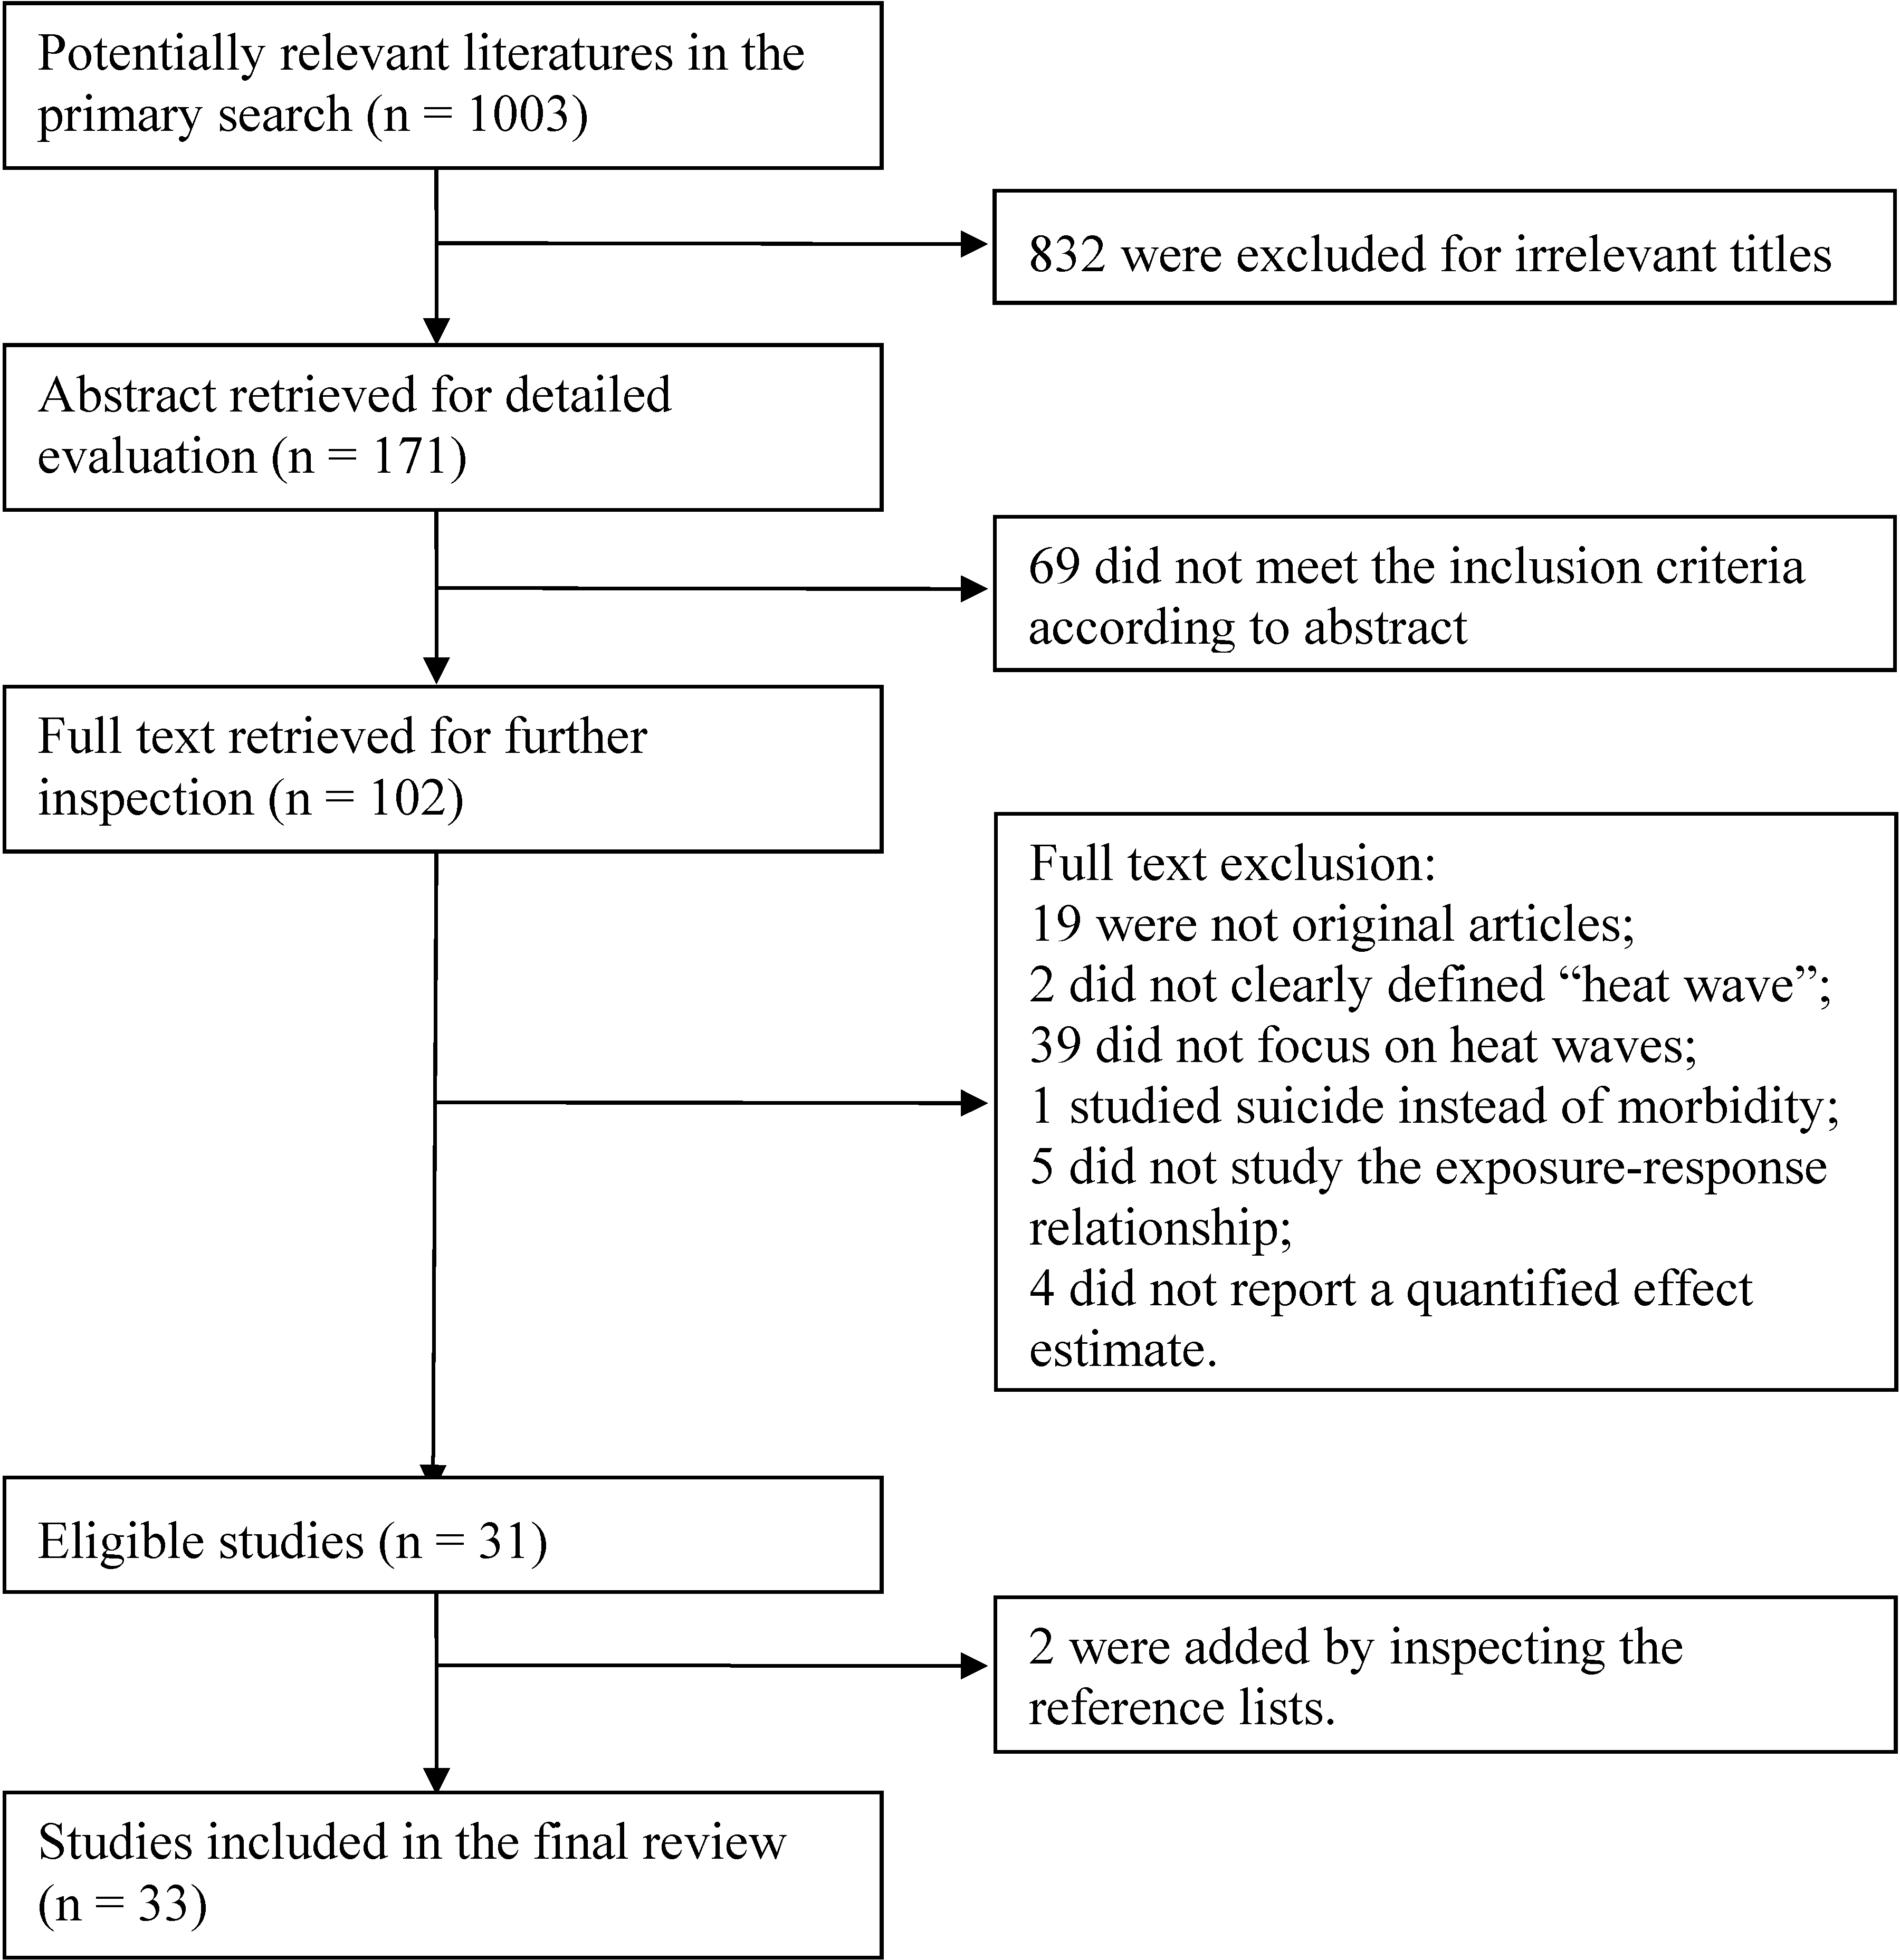
2.1. Search Strategy and Selection Criteria
2.2. Eligibility Criteria
- It is an original study.
- Used heat wave as the main exposure of interest and included a clear definition of heat wave.
- Used morbidity as the main health outcome. When morbidity and mortality are analyzed simultaneously, only the results on morbidity are included.
- Studied the exposure-response relationship between heat waves and morbidity.
3. Results
3.1. Health Indicators


| Reference | Region and Time | Heat Wave Definition | Method | Outcome Variable | Key Findings | Effect Estimate (95% CI) | Comments |
|---|---|---|---|---|---|---|---|
| (Turner et al. 2013) [10] | Brisbane, Australia. 1 January 2000–31 December 2007 | Greater than two consecutive days with daily Tmax ≥37 °C | Time-series; DLNM | Ambulance attendance for total, CVD and RD | Significant added heat wave effects were observed for both RD and CVD attendance, particularly for those aged 65–74 years (yrs). | CVD aged 65–74 yrs: percentage increase: 163.7% (56.0%, 345.8%); | The added effect of heat wave was evaluated after controlling for effect of main temperature and its lag by DLNM. Relative humidity, O3, NO2 and PM10 were also included. |
| RD aged 65–74 yrs: percentage increase: 127.3% (14.7%, 350.3%). | |||||||
| (Wang et al. 2012) [11] | Brisbane, Australia. 1 January 1996–31 December 2005 | Greater than two consecutive days with daily Tmax ≥37 °C | Time-stratified case-crossover analysis | EHAs for CVD, RD, diabetes, ischemic stroke, Mental health and Renal disease | During heat waves, significant increases were observed in NEC aged 65–74 and ≥75 yrs and renal disease patients aged ≥75 yrs. | NEC aged 65–74 yrs: OR: 1.24 (1.02, 1.50); | Linear effects of relative humidity and air pollutants (PM10, NO2 and O3) were included. |
| NEC aged 75+ yrs: OR: 1.39 (1.23, 1.58); | |||||||
| Renal patients aged 75+ yrs: OR: 2.25 (1.05, 4.83). | |||||||
| (Tong et al. 2012) [12] | Brisbane, Australia. 1 January 1996–31 December 2005 | Greater than two consecutive days with daily Tmax ≥37 °C | Time-series; Poisson GAM; time-stratified case-crossover analysis | EHAs | Heat waves were significantly associated with EHAs increase for both time-series and case-crossover method. The risk estimates gradually attenuated after the lag of one day. | Case-crossover analysis: OR: 1.22 (1.14, 1.30) at lag 1; | Comparison of both case-crossover analysis and time-series GAM model. Relative humidity, O3 and PM10 were included. |
| GAM: RRs ranged from 1.14 (1.06, 1.23) to 1.28 (1.21, 1.36) at lag 1. | |||||||
| (Schaffer et al. 2012) [13] | New South Wales, Sydney, Australia. 1 November–28 February for years 2006/2007 through to 2010/2011 | 30 January–6 February 2011 | Time-series; Poisson regression model | Ambulance calls and ED visits | Significant increases in all-cause ambulance calls and ED visits were related with heat wave. And those aged ≥75 yrs had the highest impacts. | ED visits: RR: 1.02 (1.01, 1.03); | Heat wave was identified by the Bureau of Meteorology, Australia’s national weather agency. Day of the week, public holidays and quadratic variables for day of the year were included. |
| Ambulance calls: RR: 1.14 (1.11, 1.16). Age, 75+ yrs: | |||||||
| ED visits: RR: 1.08 (1.04, 1.11); | |||||||
| Ambulance calls: RR: 1.17 (1.12, 1.23). | |||||||
| (Mayner et al. 2010) [14] | Adelaide, Australia. 2009 | The Bureau of Meteorology criterion: ≥5 consecutive days with Tmax ≥ 35 °C or ≥3 consecutive days with Tmax ≥ 40 °C | Kruskal-Wallis test (to check the differences between heat wave period and pre and post heat wave period) | ED patient presentation | Heat wave contributed to significant increases in number of total ED patient presentation compared to pre and post heat wave period. | Heat wave one: 18% and 9% increase in the number of ED patient presentations than pre and post heat wave period (p < 0.001); | A heat wave period was described by the Bureau of Meteorology. Demographic information and diagnostic descriptors were also presented. |
| Heat wave two: 8% more than post heat wave period (p < 0.001). | |||||||
| (Bustinza et al. 2013) [15] | Eight health regions of Quebec, Canada. 2005–2010 | The days in July 2010 when the moving averages (over three days) of the Tmax and Tmin of the health regions were equal to or exceeded certain predefined thresholds | The normal approximation of the natural logarithm of the rate was used to calculate 95% CI of the crude rate | Emergency department admission rates | During heat wave, a relative small increase in emergency department admission was observed, compared to reference periods. | Percentage increase: 4% (p < 0.05). | Temperature threshold in each eight health region was used to define heat wave. |
| (Tong et al. 2010) [16] | Brisbane, Australia. January 1996–December 2005 | Ten definitions | Case-crossover analyses | EHAs | During heat waves, there was a statistically significant increase in EHAs for all ten definitions. | OR ranged from 1.03 (1.01, 1.06) to 1.18 (1.11, 1.25). | Even a small change in the heat wave definition had an appreciable effect on estimated health impact. Relative humidity, PM10, NO2 and O3 were included. |
| (Bulbena et al. 2009) [17] | Barcelona, Spain. 2003 | 2–15 August 2003 | Pearsons Chi Squared test, the Student’s T test and ANOVA) | Psychiatric emergency department | No differences were found in the number of emergencies and admissions, but significant differences were observed on alcohol and anxiety disorders comparing heat wave with non-heat wave days | Alcohol abuse disorders: OR: 2.12 (1.12, 4.01); | Data were from a general hospital and a psychiatric hospital. |
| Anxiety disorders: OR: 0.47 (0.25, 0.89). | |||||||
| (Cerutti et al. 2006) [18] | Ticino, Switzerland. 2001–2003 | AT over 24 °C during three days or more, without falling below this threshold for more than one day, including the three days following the end of the wave | Data from 2001 to 2002 was used to estimate the mean of a Poisson distribution and 95% CI for the 2003 result, then calculated ratio O/E | Ambulance service intervention | The heat waves (especially in June) were correlated with a higher number of ambulance callouts. | Age, 65+ yrs: Ratio O/E: 1.21 (p < 0.05); | Three heat waves (i.e., 8–30 June, 8–26 July and 2–20 August) were analyzed. |
| Age, 75+ yrs: Ratio O/E: 1.21 (p < 0.05). | |||||||
| (Johnson et al. 2005) [19] | Nine Government Office Regions in England. July–August 1998–2002 | 4–13 August 2003 | Excess admissions were calculated as observed numbers minus the baseline (average of 1998 to 2002) expected number. Poisson distribution was used to calculate CI | Emergency hospital admissions | During heat wave, significant increases were found for 0–64 yrs and ≥75 yrs groups in London. | Percentage increase: Age, 0–64 yrs: 4% (1%, 6%); Age, 75+ yrs: 16% (12%, 20%). | The data covered nine Government Office Regions. |
| (Kovats et al. 2004) [20] | London, UK. 1 April 1994–31 March 2000 | 29 July–3 August 1995 | Time-series; Poisson regression | Emergency hospital admissions | No obvious excess was apparent in the emergency hospital admissions. | Excess rate: 2.6% (−2.2%, 7.6%) | Long term trend, season, day of the week, public holidays, the Christmas period, influenza, relative humidity, air pollution (O3, PM10), and over-dispersion were controlled for. |
| (Leonardi et al. 2006) [21] | England 19 December 2001–23 May 2004 | Two severe heat periods were defined as 10–19 July (10 days) and 4–13 August 2003 (10 days) | Time-series; GLM | Calls to NHS Direct(a nurse-led helpline) | Significant effect estimates were observed in July heat wave among children aged 0–4 yrs and 5–14 yrs. | Age, 0–4 yrs: 8.4 % (0.8%, 16.0%); | Data on calls to NHS Direct System was used. Long-term trend, day of the week and holiday, relative humidity, O3 and PM10 were included. |
| Age, 5–14 yrs: 10.0 % (2.3%, 17.7%). | |||||||
| (Gronlund et al. 2014) [22] | 200 counties, USA. 1992–2006 | Two-day mean AT above the 95th percentile of city-specific warm-season AT for 2–8 days in duration | Time-stratified case-crossover design with DLNM | Emergency hospital admissions for individuals ≥65 yrs | An added heat-wave effect with 8 days and 4 days in duration was observed on renal patient and RD, respectively | Renal disease: 12.8% (1.8%, 25.0%); | 200 counties with highest number of cardiovascular hospital admissions in 2004–2006 were used. The analyses were stratified by age and gender. |
| RD: 2.1% (0.1%, 4.3%). | |||||||
| (Wang et al. 2014) [23] | Brisbane, Australia. 1996–2005 | Daily Tmax of at least 37 °C (top 0.5%) for two or more consecutive days | Time-stratified case-crossover study | EHAs for renal diseases in children | There was a significant increase in EHAs for renal disease in children during heat wave. And highest risk estimates were observed at lag 1. | OR: 2.08 (1.05, 4.09) at lag 0–2; | Relative humidity, PM10, O3 and NO2 were included. |
| OR: 3.6 (1.4, 9.5) at lag 1. | |||||||
| (Williams et al. 2012) [24] | Perth, Australia. 1 January 2002–30 April 2009 | Greater than three consecutive days with Tmax ≥ 35°C | GEE; negative binomial regression | EDs for total, mental, renal, CVD, RD | Heat waves days were associated with significant increases in total and renal disease EDs. | Total: IRR: 1.034 (1.011, 1.057); | Day of the week, month, year, O3, NO2 and PM2.5 were included. |
| Renal disease: IRR: 1.109 (1.043, 1.180). | |||||||
| (Nitschke et al. 2011) [25] | Adelaide, Australia. July 1993–March 2009 | Greater than three consecutive days with Tmax ≥35 °C (the 95th percentile for Tmax for the period 1993–2009) | Case-series analysis; Negative binomial regression | Ambulance call-outs | During heat waves, highest effect estimates were (1) ambulance call-outs of respiratory patients aged 5–14 yrs (2) Emergency department presentations of direct heat disease aged 15–64 yrs | (1) RR: 1.47(1.13, 1.39). | The analyses were stratified by age group (0–4, 5–14, 65–74, 75+ yrs) and causes. |
| (2) RR: 2.99 (2.24, 3.99). | |||||||
| (Knowlton et al. 2009) [26] | 58 counties of California, USA. 8 July 2006–22 August 2006 | 15 July–1August 2006 | RR: the ratio of the number of cases in the heat wave and reference period. Excess cases: the difference of the number of cases in the two period | ED visits | During heat wave, a significant increase was observed in all age groups; highest effect estimate was observed on heat-related illness. | Total: RR: 1.03 (1.02,1.04); | The analyses were stratified by gender, age, causes and race. |
| Heat-related illnesses: RR: 6.30 (5.67, 7.01) | |||||||
| (Nitschke et al. 2007) [27] | Adelaide, Australia. 1993–2006 | Greater than three consecutive days with daily Tmax ≥35 °C | Case-series study | Ambulance transports | During heat waves, a significant increase was found on total ambulance transport. Reductions were observed in relation to cardiac, sports- and falls-related events. | Total Ambulance transport: percentage increase: 4% (1%, 7%). | This analysis included five age groups (0–4, 5–14, 15–64, 65–74, 75+ yrs) and causes. |
| (Lindstrom et al. 2013) [28] | Melbourne, Australia. 2007–2009 | 28 January–3 February 2009. | Poisson regression | Emergency department presentations | During heat wave, a significant increase was observed in ED presentations. | ED presentations: IRR: 1.15 (p < 0.01) | One hospital data was used. |
3.2. Vulnerable Populations
3.2.1. Age
3.2.2. Gender
| Reference | Region and Time | Heat Wave Definition | Method | Outcome Variable | Key Findings | Effect Estimate | Comments |
|---|---|---|---|---|---|---|---|
| (Manser et al. 2013) [37] | Zurich, Switzerland. 1 January 2001–31 December 2005 | Any period of six days with Tmax > 5 °C above Tmax (recommended by the World Meteorological Organization) | Time-series; Poisson regression | Hospital admissions for IBD, IG and NIIs | Heat wave was significant associated with increased risk of IBD and IG flares. The strongest heat wave effect was observed on IG at lag seven days. | IBD flares: percentage increase: 4.6% (1.6%, 7.4%); | Data on one hospital was used. Day of the week, public holidays as Sundays, long-term trends and yearly seasonal patterns were adjusted. |
| IG flares: percentage increase: 4.7% (1.8%, 7.4%); | |||||||
| IG flares: percentage increase: 7.2% (4.6%, 9.7%) at lag 7. | |||||||
| (Ha et al. 2014) [33] | Allegheny County, Pennsylvania. May–September 1994–2000 | Greater than two consecutive days with AT > 95th percentile (26.1 °C) of all temperatures. | Time-stratified case-crossover analysis | Stroke hospitalization for ischemic and hemorrhage stroke | Heat wave at lag-2 day was significantly associated with an increased risk for stroke hospitalization. The effect estimates were more significant for ischemic stroke, men and subjects aged 80 yrs or more. | Stroke: OR: 1.173 (1.047, 1.315) at lag2; | This analysis was stratified by gender, race, age group and type of stroke. |
| Ischemic stroke: OR: 1.145 (1.009, 1.299) at lag2; | |||||||
| Male: OR: 1.201 (1.008, 1.430) at lag2; | |||||||
| Age, 65–79 yrs: OR: 1.161 (1.001, 1.346) at lag 2; | |||||||
| Age, 80+ yrs: OR: 1.191 (1.003, 1.414) at lag 2. | |||||||
| (Ma et al. 2011) [29] | Shanghai, China. 2005–2008 | Greater than seven consecutive days with daily Tmax above 35.0 °C and daily average temperatures above 97th percentile during the study period | The difference in the numbers of hospital admission between heat wave and reference period was used to calculate excess hospital visits, RRs and 95% CI | Hospital admission | The heat wave was significant associated with increase of total, CVD and RD. | Total: RR: 1.02 (1.01, 1.04). | The data were from database of Shanghai Health Insurance Bureau, covering most of the residents in Shanghai. |
| CVD: RR: 1.08 (1.05, 1.11). | |||||||
| RD: RR: 1.06 (1.00, 1.11). | |||||||
| (Hansen et al. 2008a) [36] | Adelaide, Australia. 1995–2006 | Greater than three consecutive days when daily Tmax ≥35 °C, the 95th percentile of the Tmax range for the study period | Time-series; conditional-fixed effects Poisson regression; | Hospital admission for renal disease | During heat wave, significant increases were found on renal disease and acute renal failure. The effect estimates were higher among the elderly. | Renal disease: IRR: 1.100 (1.003, 1.206); | The analyses were stratified by three age group (15–64, 65+, 85+ yrs) and gender. Seasonality, long-term trend and over dispersion were controlled. |
| ARF: IRR: 1.255 (1.037, 1.519). | |||||||
| Age,15–64 yrs: IRR: 1.130 (1.025, 1.247); | |||||||
| Age, 85+ yrs: IRR: 1.196 (1.036, 1.380). | |||||||
| (Hansen et al. 2008b) [34] | Adelaide, Australia. 1 October–31 March 1993–2006 | Greater than three consecutive days when daily Tmax ≥ 35 °C, the 95th percentile of the Tmax range for the study period | Time-series; conditional-fixed effects Poisson regression; | Hospital admission for MBDs | During heat wave, significant increases were found on patients with organic illnesses, including symptomatic mental disorders; dementia; mood (affective) disorders; neurotic, stress related, and somatoform disorders; disorders of psychological development; and senility. Higher effect estimates were observed on patients with senility. | MBDs: IRR: 1.073 (1.017, 1.132); | The analyses were stratified by three age group (15–64, 65–74, 75+ yrs), and gender. Seasonality, long-term trend and over dispersion were controlled. |
| Senility: IRR: 2.366 (1.200, 4.667). | |||||||
| (Semenza et al. 1999) [30] | Cook County, Chicago. 1994–1995 | 13–19 July 1995 | Excess admission: the weekly average (the expected number of admissions) was subtracted from the number of admissions recorded during the heat wave study period. 95% CI: a standard method based on the t-distribution | Hospital admissions | Significant excess increases were observed on patients with disorders of fluid, volume depletion, nephritis, acute renal failure, heat stroke, anhydrotic heat exhaustion, heat exhaustion, hypertensive disease, ischemic heart disease, cardiac dysrythmias, diseases of arteries, cerebrovascular disease, late effects of cerebrovascular disease, diabetes mellitus, noninsulin dependent diabetes (Type II). | Significant excess rate ranged from 19% (p = 0.019) for ischemic heart disease to 78,000% (p < 0.001) for heat stroke. | Cause-specific hospital admissions were analyzed. |
| (Mastrangelo et al. 2007) [38] | Veneto Region, Italy. 1 June–31 August 2002–2003 | Greater than three consecutive days with Humidex above 40 °C | GEE | Hospital admissions for the elderly (≥75 yrs) | Heat wave duration increased the risk of hospital admissions for heat disease and RD. | Heat diseases: IRR: 1.16 (1.12, 1.20); | Humidex was used; heat wave characteristics were analyzed, such as duration, intensity and a dummy variable for days outside or inside a heat wave. |
| RD: IRR: 1.05 (1.03, 1.07). | No correlation was found for fractures of femur or circulatory disease admissions | ||||||
| (Sheridan et al. 2014) [39] | New York, USA. April–August 1991–2004 | Three consecutive days of DT (Dry Moderate) or MT+ (Moist Tropical Plus) weather type | Time-series; DLM | Hospitalizations for heat-related disease, CVD, RD. | The strongest effect of heat wave was observed on heat-related illness. Heat-related hospital admissions have increased during the time, especially during the earlier days of heat events. | Heat-related disease: RR: 25.891 (20.300, 33.022) during 1991–2004; | The analysis included different time period (1991–1996 and 1997–2004) and seasons (spring and summer). |
| RR: 25.46 (15.98, 40.57) during 1991–1996; | |||||||
| RR: 26.69 (20.19, 35.29) during 1997–2004. | |||||||
| (Williams et al. 2012) [24] | Perth, Australia. 1 January 1980–1 July 2008 | Greater than three consecutive days with Tmax ≥35 °C | GEE; negative binomial regression | Hospital admissions | Total hospital admissions decreased during heat wave days. | Hospital admissions: IRR: 0.905 (0.854, 0.958). | Twenty-eight years of data were used. |
| (Nitschke et al. 2011) [25] | Adelaide, Australia. July 1993–March 2009 | Greater than three consecutive days with Tmax ≥35 °C (the 95th percentile of Tmax for the period 1993–2009) | Case-series analysis; Negative binomial regression | Hospital admissions for total, ischemic, mental, renal, RD and direct heat disease | During heat waves, highest effect estimates were found on direct heat disease during 2008 and 2009 heat wave. | 2008 heat wave: RR: 2.64 (1.32, 5.20); | The analyses were stratified by age group (0–4, 5–14, 65–74, 75+ yrs). |
| 2009 heat wave: RR: 13.66 (8.80, 20.98). | |||||||
| (Knowlton et al. 2009) [26] | Fifty-eight counties of California, USA. 8 July 2006–22 August 2006 | 15 July–1 August 2006 | RR: the ratio of the number of cases in the heat wave and reference period. Excess cases: the difference of the number of cases in the two period | Hospitalizations | During heat wave, a significant increase was found only on (1) Electrolyte imbalance, (2) Nephritis and nephritic syndrome (3) Acute renal failure (4) Heat-related illnesses | (1) RR: 1.09(1.07, 1.11) | The analyses were stratified by gender, age, causes and race. |
| (2) RR: 1.05(1.02, 1.07) | |||||||
| (3) RR: 1.11(1.08, 1.15) | |||||||
| (4) RR: 10.15(7.79, 13.43) | |||||||
| (Nitschke et al. 2007) [27] | Adelaide, Australia. 1993–2006 | Greater than three consecutive days with daily Tmax ≥35 °C | Case-series study | Hospital admissions for CVD, RD, mental and renal disease | Highest effect estimate was observed for renal patients aged 15–64 yrs. | IRR: 1.16 (1.04, 1.30) | This analysis included five age groups (0–4, 5–14, 15–64, 65–74, 75+ yrs). |
| (Lindstrom et al. 2013) [28] | Melbourne, Australia. 2007–2009 | 28 January–3 February 2009 | Poisson regression | Hospital admissions, general medical admissions | During heat wave, a significant increase was observed in hospital admissions and general medical admissions. | (1) IRR: 1.11 (p < 0.05) | One hospital data was used. |
| (2) IRR: 1.81 (p < 0.01) |
| Reference | Region and Time | Heat Wave Definition | Method | Outcome Variable | Key Findings | Effect Estimates | Comments |
|---|---|---|---|---|---|---|---|
| (Van Zutphen et al. 2012) [31] | New York, USA. June–August 1992–2006 | Greater than three consecutive days with mean UAT above the 90th percentile | Case control study | Birth defects | Congenital cataracts were significantly associated with heat waves, while significant decrease was on gastroschisis. No statistically significant relationships were found among central nervous systems, CVD, craniofacial or genitourinary birth defect groups. | Congenital cataracts: OR: 1.97 (1.17, 3.32); | A population-based case-control study was performed. The analyses were stratified by causes. |
| Gastroschisis: OR: 0.48 (0.28, 0.81). | |||||||
| (Schifano et al. 2013) [40] | Rome, Italy. 1 January–31 December 2001–2010 | Greater than two consecutive days with MAT above the monthly 90th percentile or the daily Tmin above the monthly 90th percentile and MAT above the median monthly value | Time-series; DLM; Poisson GAM | Preterm birth | A significant increase of preterm birth was associated with heat waves. | Percentage increase: 19% (7.91%, 31.69%). | The long-term trend, seasonality and holidays were adjusted. |
| (Empana et al. 2009) [35] | Paris, France. 1 January–21 December 2000–2005 | 1–14 August 2003 | Poisson regression analysis (the same period in years 2000–2002 and 2004–2005 as reference) | Out-of-hospital cardiac arrest due to heart disease and of ST-segment elevation myocardial infarction (STEMI) aged >18 yrs | During heat wave, a significant relative rate was found on out-of-hospital cardiac arrests but not on myocardial infarctions comparing to reference period. This increase estimates were higher among males and those aged above 60 yrs. | Out of Hospital Cardiac Arrests: RR: 2.34 (1.60, 3.41); | The data was from a city mobile intensive care units (MICU) database. The analysis was adjusted for gender and age. |
| Myocardial Infarctions: RR: 1.09 (0.58, 2.03). | |||||||
| (Kent et al. 2014) [41] | Alabama, USA. May–September 1990–2010 | Sixteen heat wave definitions | Time-stratified case-crossover | Preterm births | Effect of heat waves (first definition) defined as having at least two consecutive days with Tmean above the 98th percentile were much higher than that as at least two consecutive days with T mean above the 90th (second definition). | The first definition: ER: 32.4% (3.7%, 69.1%); | Sixteen heat wave definitions were performed according to previous studies. |
| The second definition: ER: 3.7% (1.1%, 6.3%). | Effect estimates varied by heat wave definitions. | ||||||
| (Bai et al. 2014) [32] | Ningbo, China. 2011–2013 | Greater than seven consecutive days with the Tmax >35 °C | Time-series; DLNM | Heat-related illness | The strongest cumulative effect of heat waves was on severe forms of illness. Males and all age groups were vulnerable to heat wave. | The strongest cumulative effect (Lag 0–5): RR: 10.69 (2.10, 54.44). | The data were collected from the national heat-related illness surveillance system. The analyses included age groups and gender. |
| (Xiang 2014) [42] | Adelaide, Australia. 1 October–31 March 2001–2010 | Greater than three consecutive days with daily Tmax ≥ 35 °C | GEE | Workers’ compensation claim | For outdoor industries, daily claims increased significantly during heat waves. And male laborers, tradespersons aged ≥55 yrs, those employed in ‘agriculture, forestry and fishing’ and ‘electricity, gas and water’, occupational burns, wounds, lacerations, and amputations as well as heat illnesses were significantly associated with heat waves. | Outdoor industries: IRR: 1.06 (1.02, 1.10) | The analyses were stratified by gender, age, occupation and industry. |
3.3. The Susceptible Patients
3.4. The Additional Effect of Heat Waves on Morbidity
3.5. The Lag Effect of Heat Waves
4. Discussion
4.1. The Impact of Heat Waves on Emergency Medical Care and Hospital Admissions
4.2. The Vulnerable Populations
4.3. The Heterogeneity of Existing Literature
4.4. Usage of Morbidity Data in the Heat Wave Early Warning System
4.5. Limitations and Future Considerations
5. Conclusions
Acknowledgements
Author Contributions
Conflicts of Interest
References
- IPCC. Climate Change 2013: The Physical Science Basis. Contribution of Working Group I to the Fifth Assessment Report of the Intergovernmental Panel on Climate Change; Cambridge University Press: Cambridge, UK, 2013. [Google Scholar]
- IPCC. Managing the Risks of Extreme Events and Disasters to Advance Climate Change Adaptation. A Special Report of Working Groups I and II of the Intergovernmental Panel on Climate Change; Cambridge University Press: Cambridge, UK, 2012. [Google Scholar]
- Astrom, D.O.; Forsberg, B.; Rocklov, J. Heat wave impact on morbidity and mortality in the elderly population: A review of recent studies. Maturitas 2011, 69, 99–105. [Google Scholar] [CrossRef] [PubMed]
- Martiello, M.A.; Baldasseroni, A.; Buiatti, E.; Giacchi, M.V. Health effects of heat waves. PMC 2008, 64, 735–772. [Google Scholar]
- Xu, Z.; Etzel, R.A.; Su, H.; Huang, C.; Guo, Y.; Tong, S. Impact of ambient temperature on children’s health: A systematic review. Environ. Res. 2012, 117, 120–131. [Google Scholar] [CrossRef] [PubMed]
- Fouillet, A.; Rey, G.; Laurent, F.; Pavillon, G.; Bellec, S.; Guihenneuc-Jouyaux, C.; Clavel, J.; Jougla, E.; Hemon, D. Excess mortality related to the august 2003 heat wave in france. Int. Arch. Occup. Environ. Health 2006, 80, 16–24. [Google Scholar] [CrossRef] [PubMed] [Green Version]
- Semenza, J.C.; Rubin, C.H.; Falter, K.H.; Selanikio, J.D.; Flanders, W.D.; Howe, H.L.; Wilhelm, J.L. Heat-related deaths during the july 1995 heat wave in chicago. N. Engl. J. Med. 1996, 335, 84–90. [Google Scholar] [CrossRef] [PubMed]
- Meehl, G.A.; Tebaldi, C. More intense, more frequent, and longer lasting heat waves in the 21st century. Science 2004, 305, 994–997. [Google Scholar] [CrossRef] [PubMed]
- Ye, X.; Wolff, R.; Yu, W.; Vaneckova, P.; Pan, X.; Tong, S. Ambient temperature and morbidity: A review of epidemiological evidence. Environ. Health Perspect. 2012, 120, 19–28. [Google Scholar] [CrossRef] [PubMed] [Green Version]
- Turner, L.R.; Connell, D.; Tong, S. The effect of heat waves on ambulance attendances in Brisbane, Australia. Prehosp. Disaster Med. 2013, 28, 482–487. [Google Scholar] [CrossRef] [PubMed]
- Wang, X.Y.; Barnett, A.G.; Yu, W.; FitzGerald, G.; Tippett, V.; Aitken, P.; Neville, G.; McRae, D.; Verrall, K.; Tong, S. The impact of heatwaves on mortality and emergency hospital admissions from non-external causes in Brisbane, Australia. Occup. Environ. Med. 2012, 69, 163–169. [Google Scholar] [CrossRef] [PubMed]
- Tong, S.; Wang, X.Y.; Guo, Y. Assessing the short-term effects of heatwaves on mortality and morbidity in Brisbane, australia: Comparison of case-crossover and time series analyses. PLoS One 2012. [Google Scholar] [CrossRef] [Green Version]
- Schaffer, A.; Muscatello, D.; Broome, R.; Corbett, S.; Smith, W. Emergency department visits, ambulance calls, and mortality associated with an exceptional heat wave in Sydney, Australia, 2011: A time-series analysis. Environ. Health 2012. [Google Scholar] [CrossRef]
- Mayner, L.; Arbon, P.; Usher, K. Emergency department patient presentations during the 2009 heatwaves in Adelaide. Collegian 2010, 17, 175–182. [Google Scholar] [CrossRef] [PubMed]
- Bustinza, R.; Lebel, G.; Gosselin, P.; Belanger, D.; Chebana, F. Health impacts of the July 2010 heat wave in Quebec, Canada. BMC Public Health 2013. [Google Scholar] [CrossRef]
- Tong, S.; Wang, X.Y.; Barnett, A.G. Assessment of heat-related health impacts in Brisbane, Australia: Comparison of different heatwave definitions. PLoS One 2010. [Google Scholar] [CrossRef]
- Bulbena, A.; Sperry, L.; Garcia Rivera, C.; Merino, A.; Mateu, G.; Torrens, M.; San Gil, J.; Cunillera, J. Impact of the summer 2003 heat wave on the activity of two psychiatric emergency departments. Actas Esp. Psiquiatria 2009, 37, 158–165. [Google Scholar]
- Cerutti, B.; Tereanu, C.; Domenighetti, G.; Cantoni, E.; Gaia, M.; Bolgiani, I.; Lazzaro, M.; Cassis, I. Temperature related mortality and ambulance service interventions during the heat waves of 2003 in Ticino (Switzerland). Soz. Praventivmed. 2006, 51, 185–193. [Google Scholar] [CrossRef] [PubMed]
- Johnson, H.; Kovats, R.S.; McGregor, G.; Stedman, J.; Gibbs, M.; Walton, H.; Cook, L.; Black, E. The impact of the 2003 heat wave on mortality and hospital admissions in England. Health Stat. Qual. 2005, 6–11. [Google Scholar]
- Kovats, R.S.; Hajat, S.; Wilkinson, P. Contrasting patterns of mortality and hospital admissions during hot weather and heat waves in greater London, UK. Occup. Environ. Med. 2004, 61, 893–898. [Google Scholar] [CrossRef] [PubMed]
- Leonardi, G.S.; Hajat, S.; Kovats, R.S.; Smith, G.E.; Cooper, D.; Gerard, E. Syndromic surveillance use to detect the early effects of heat-waves: An analysis of nhs direct data in England. Soz. Praventivmed. 2006, 51, 194–201. [Google Scholar] [CrossRef] [PubMed]
- Gronlund, C.J.; Zanobetti, A.; Schwartz, J.D.; Wellenius, G.A.; O’Neill, M.S. Heat, heat waves, and hospital admissions among the elderly in the United States, 1992–2006. Environ. Health Perspect. 2014, 122, 1187–1192. [Google Scholar] [PubMed]
- Wang, X.Y.; Barnett, A.; Guo, Y.M.; Yu, W.W.; Shen, X.M.; Tong, S.L. Increased risk of emergency hospital admissions for children with renal diseases during heatwaves in Brisbane, Australia. World J. Pediatr. 2014. [Google Scholar] [CrossRef]
- Williams, S.; Nitschke, M.; Weinstein, P.; Pisaniello, D.L.; Parton, K.A.; Bi, P. The impact of summer temperatures and heatwaves on mortality and morbidity in Perth, Australia 1994–2008. Environ. Int. 2012, 40, 33–38. [Google Scholar] [CrossRef] [PubMed]
- Nitschke, M.; Tucker, G.R.; Hansen, A.L.; Williams, S.; Zhang, Y.; Bi, P. Impact of two recent extreme heat episodes on morbidity and mortality in Adelaide, south Australia: A case-series analysis. Environ. Health 2011. [Google Scholar] [CrossRef]
- Knowlton, K.; Rotkin-Ellman, M.; King, G.; Margolis, H.G.; Smith, D.; Solomon, G.; Trent, R.; English, P. The 2006 california heat wave: Impacts on hospitalizations and emergency department visits. Environ. Health Perspect. 2009, 117, 61–67. [Google Scholar] [CrossRef] [PubMed]
- Nitschke, M.; Tucker, G.R.; Bi, P. Morbidity and mortality during heatwaves in metropolitan Adelaide. Med. J. Aust. 2007, 187, 662–665. [Google Scholar] [PubMed]
- Lindstrom, S.J.; Nagalingam, V.; Newnham, H.H. Impact of the 2009 melbourne heatwave on a major public hospital. Intern. Med. J. 2013, 43, 1246–1250. [Google Scholar] [CrossRef] [PubMed]
- Ma, W.; Xu, X.; Peng, L.; Kan, H. Impact of extreme temperature on hospital admission in Shanghai, China. Sci. Total Environ. 2011, 409, 3634–3637. [Google Scholar] [CrossRef] [PubMed]
- Semenza, J.C.; McCullough, J.E.; Flanders, W.D.; McGeehin, M.A.; Lumpkin, J.R. Excess hospital admissions during the July 1995 heat wave in chicago. Amer. J. Prev. Med. 1999, 16, 269–277. [Google Scholar] [CrossRef]
- Van Zutphen, A.R.; Lin, S.; Fletcher, B.A.; Hwang, S.A. A population-based case-control study of extreme summer temperature and birth defects. Environ. Health Perspect. 2012, 120, 1443–1449. [Google Scholar]
- Bai, L.; Ding, G.; Gu, S.; Bi, P.; Su, B.; Qin, D.; Xu, G.; Liu, Q. The effects of summer temperature and heat waves on heat-related illness in a coastal city of China, 2011–2013. Environ. Res. 2014, 132, 212–219. [Google Scholar] [CrossRef] [PubMed]
- Ha, S.; Talbott, E.O.; Kan, H.; Prins, C.A.; Xu, X. The effects of heat stress and its effect modifiers on stroke hospitalizations in allegheny county, pennsylvania. Int. Arch. Occup. Environ. Health 2014, 87, 557–565. [Google Scholar] [CrossRef] [PubMed]
- Hansen, A.; Bi, P.; Nitschke, M.; Ryan, P.; Pisaniello, D.; Tucker, G. The effect of heat waves on mental health in a temperate Australian city. Environ. Health Perspect. 2008, 116, 1369–1375. [Google Scholar] [CrossRef] [PubMed]
- Empana, J.P.; Sauval, P.; Ducimetiere, P.; Tafflet, M.; Carli, P.; Jouven, X. Increase in out-of-hospital cardiac arrest attended by the medical mobile intensive care units, but not myocardial infarction, during the 2003 heat wave in Paris, France. Crit. Care Med. 2009, 37, 3079–3084. [Google Scholar] [CrossRef] [PubMed]
- Hansen, A.L.; Bi, P.; Ryan, P.; Nitschke, M.; Pisaniello, D.; Tucker, G. The effect of heat waves on hospital admissions for renal disease in a temperate city of Australia. Int. J. Epidemiol. 2008, 37, 1359–1365. [Google Scholar] [CrossRef] [PubMed]
- Manser, C.N.; Paul, M.; Rogler, G.; Held, L.; Frei, T. Heat waves, incidence of infectious gastroenteritis, and relapse rates of inflammatory bowel disease: A retrospective controlled observational study. Amer. J. Gastroenterol. 2013, 108, 1480–1485. [Google Scholar] [CrossRef]
- Mastrangelo, G.; Fedeli, U.; Visentin, C.; Milan, G.; Fadda, E.; Spolaore, P. Pattern and determinants of hospitalization during heat waves: An ecologic study. BMC Public Health 2007. [Google Scholar] [CrossRef]
- Sheridan, S.C.; Lin, S. Assessing variability in the impacts of heat on health outcomes in New York city over time, season, and heat-wave duration. Ecohealth 2014, 11, 512–515. [Google Scholar] [CrossRef] [PubMed]
- Schifano, P.; Lallo, A.; Asta, F.; de Sario, M.; Davoli, M.; Michelozzi, P. Effect of ambient temperature and air pollutants on the risk of preterm birth, Rome 2001–2010. Environ. Int. 2013, 61, 77–87. [Google Scholar] [CrossRef] [PubMed]
- Kent, S.T.; McClure, L.A.; Zaitchik, B.F.; Smith, T.T.; Gohlke, J.M. Heat waves and health outcomes in Alabama (USA): The importance of heat wave definition. Environ. Health Perspect. 2014, 122, 151–158. [Google Scholar] [CrossRef] [PubMed]
- Xiang, J.; Bi, P.; Pisaniello, D.; Hansen, A. The impact of heatwaves on workers’ health and safety in Adelaide, south Australia. Environ. Res. 2014, 133, 90–95. [Google Scholar] [CrossRef] [PubMed]
- Martiello, M.A.; Giacchi, M.V. High temperatures and health outcomes: A review of the literature. Scand. J. Public Health 2010, 38, 826–837. [Google Scholar] [CrossRef] [PubMed]
- Blatteis, C.M. Age-dependent changes in temperature regulation—A mini review. Gerontology 2012, 58, 289–295. [Google Scholar] [CrossRef] [PubMed]
- Kenny, G.P.; Yardley, J.; Brown, C.; Sigal, R.J.; Jay, O. Heat stress in older individuals and patients with common chronic diseases. CMAJ 2010, 182, 1053–1060. [Google Scholar] [CrossRef] [PubMed]
- Nitschke, M.; Hansen, A.; Bi, P.; Pisaniello, D.; Newbury, J.; Kitson, A.; Tucker, G.; Avery, J.; Grande, E.D. Risk factors, health effects and behaviour in older people during extreme heat: A survey in south australia. Int. J. Environ. Res. Public Health 2013, 10, 6721–6733. [Google Scholar] [CrossRef] [PubMed] [Green Version]
- Josseran, L.; Caillere, N.; Brun-Ney, D.; Rottner, J.; Filleul, L.; Brucker, G.; Astagneau, P. Syndromic surveillance and heat wave morbidity: A pilot study based on emergency departments in France. BMC Med Inform Decis. Mak. 2009. [Google Scholar] [CrossRef]
- Xu, Z.; Sheffield, P.E.; Su, H.; Wang, X.; Bi, Y.; Tong, S. The impact of heat waves on children’s health: A systematic review. Int. J. Biometeorol. 2013. [Google Scholar] [CrossRef] [Green Version]
- Wichmann, J.; Andersen, Z.J.; Ketzel, M.; Ellermann, T.; Loft, S. Apparent temperature and cause-specific mortality in Copenhagen, Denmark: A case-crossover analysis. Int. J. Environ. Res. Public Health 2011, 8, 3712–3727. [Google Scholar] [PubMed]
- Kravchenko, J.; Abernethy, A.P.; Fawzy, M.; Lyerly, H.K. Minimization of heatwave morbidity and mortality. Amer. J. Prev. Med. 2013, 44, 274–282. [Google Scholar] [CrossRef]
- Yang, J.; Liu, H.Z.; Ou, C.Q.; Lin, G.Z.; Ding, Y.; Zhou, Q.; Shen, J.C.; Chen, P.Y. Impact of heat wave in 2005 on mortality in Guangzhou, China. Biomed. Environ. Sci. 2013, 26, 647–654. [Google Scholar]
- Hansen, A.; Bi, P.; Saniotis, A.; Nitschke, M.; Benson, J.; Tan, Y.; Smyth, V.; Wilson, L.; Han, G.-S. Extreme heat and climate change: Adaptation in culturally and linguistically diverse (cald) communities. National Climate Change Adaptation Research Facility: Gold Coast, Australia, 2013. [Google Scholar]
- Vandentorren, S.; Bretin, P.; Zeghnoun, A.; Mandereau-Bruno, L.; Croisier, A.; Cochet, C.; Riberon, J.; Siberan, I.; Declercq, B.; Ledrans, M. August 2003 heat wave in france: Risk factors for death of elderly people living at home. Eur. J. Public Health 2006, 16, 583–591. [Google Scholar] [CrossRef] [PubMed]
- Smith, T.T.; Zaitchik, B.F.; Gohlke, J.M. Heat waves in the united states: Definitions, patterns and trends. Clim. Change 2013, 118, 811–825. [Google Scholar] [CrossRef] [PubMed]
- Anderson, G.B.; Bell, M.L. Heat waves in the united states: Mortality risk during heat waves and effect modification by heat wave characteristics in 43 U.S. Communities. Environ. Health Perspect. 2011, 119, 210–218. [Google Scholar] [CrossRef]
- Nairn, J.R.; Fawcett, R.J. The excess heat factor: A metric for heatwave intensity and its use in classifying heatwave severity. Int. J. Environ. Res. Public Health 2014, 12, 227–253. [Google Scholar] [CrossRef] [PubMed]
- Zhang, K.; Chen, Y.H.; Schwartz, J.D.; Rood, R.B.; O’Neill, M.S. Using forecast and observed weather data to assess performance of forecast products in identifying heat waves and estimating heat wave effects on mortality. Environ. Health Perspect. 2014, 122, 912–918. [Google Scholar] [PubMed]
- Zhang, K.; Rood, R.B.; Michailidis, G.; Oswald, E.M.; Schwartz, J.D.; Zanobetti, A.; Ebi, K.L.; O’Neill, M.S. Comparing exposure metrics for classifying “dangerous heat” in heat wave and health warning systems. Environ. Int. 2012, 46, 23–29. [Google Scholar] [CrossRef] [PubMed]
- Zhang, K.; Li, Y.; Schwartz, J.D.; O'Neill, M.S. What weather variables are important in predicting heat-related mortality? A new application of statistical learning methods. Environ. Res. 2014, 132, 350–359. [Google Scholar]
- Green, H.K.; Andrews, N.J.; Bickler, G.; Pebody, R.G. Rapid estimation of excess mortality: Nowcasting during the heatwave alert in england and wales in june 2011. J. Epidemiol. Community Health 2012, 66, 866–868. [Google Scholar] [CrossRef] [PubMed]
- Michelozzi, P.; de’ Donato, F.K.; Bargagli, A.M.; D’Ippoliti, D.; De Sario, M.; Marino, C.; Schifano, P.; Cappai, G.; Leone, M.; Kirchmayer, U.; et al. Surveillance of summer mortality and preparedness to reduce the health impact of heat waves in Italy. Int. J. Environ. Res. Public Health 2010, 7, 2256–2273. [Google Scholar]
- Cox, B.; Wuillaume, F.; Van Oyen, H.; Maes, S. Monitoring of all-cause mortality in belgium (be-momo): A new and automated system for the early detection and quantification of the mortality impact of public health events. Int. J. Public Health 2010, 55, 251–259. [Google Scholar] [CrossRef] [PubMed]
- Josseran, L.; Fouillet, A.; Caillere, N.; Brun-Ney, D.; Ilef, D.; Brucker, G.; Medeiros, H.; Astagneau, P. Assessment of a syndromic surveillance system based on morbidity data: Results from the oscour network during a heat wave. PLoS One 2010. [Google Scholar] [CrossRef]
- Price, K.; Perron, S.; King, N. Implementation of the montreal heat response plan during the 2010 heat wave. Can. J. Public Health 2013, 104, 96–100. [Google Scholar]
© 2015 by the authors; licensee MDPI, Basel, Switzerland. This article is an open access article distributed under the terms and conditions of the Creative Commons Attribution license (http://creativecommons.org/licenses/by/4.0/).
Share and Cite
Li, M.; Gu, S.; Bi, P.; Yang, J.; Liu, Q. Heat Waves and Morbidity: Current Knowledge and Further Direction-A Comprehensive Literature Review. Int. J. Environ. Res. Public Health 2015, 12, 5256-5283. https://doi.org/10.3390/ijerph120505256
Li M, Gu S, Bi P, Yang J, Liu Q. Heat Waves and Morbidity: Current Knowledge and Further Direction-A Comprehensive Literature Review. International Journal of Environmental Research and Public Health. 2015; 12(5):5256-5283. https://doi.org/10.3390/ijerph120505256
Chicago/Turabian StyleLi, Mengmeng, Shaohua Gu, Peng Bi, Jun Yang, and Qiyong Liu. 2015. "Heat Waves and Morbidity: Current Knowledge and Further Direction-A Comprehensive Literature Review" International Journal of Environmental Research and Public Health 12, no. 5: 5256-5283. https://doi.org/10.3390/ijerph120505256