1. Introduction
The International Commission on Non-Ionizing Radiation Protection (ICNIRP) is an independent scientific organization that offers regulations and recommendations about the health and environmental effects of non-ionizing radiation exposure [
1]. The exposure limits recommended by international standards-setting bodies—ICNIRP [
1], the Institute of Electrical and Electronics Engineers (IEEE) [
2] and the European Committee for Electrotechnical Standardization (CENELEC) [
3]—are based on short-term and immediate health effects of elevated tissue temperatures due to the absorption of energy during exposure to non-ionizing radiation. In 2002, the Australian Radiation Protection and Nuclear Safety Agency (ARPANSA) published a standard that specifies health limits of human exposure to radio frequency fields ranging from 3 kHz–300 GHz in order to avoid its adverse health effects [
4]. These guidelines aim to minimise the heating effects caused by the absorption of radio frequency electromagnetic fields (RF-EMFs). Each of the standards indicate basic restrictions for the general public exposure, occupational exposure and the equipment and usage parameters.
There are countless man-made sources of electromagnetic radiation (EMR), such as mobile phones [
5,
6,
7,
8], radios and high-frequency (HF) welding machines. Aboard marine ships, there are numerous sources of EMR [
9,
10,
11]; these include transmitters, such as radar and satellite for shipboard communication. Because of the extreme growth of the marine transportation industry, the number of marine vessel transmitters has greatly increased. Measuring the electric fields from marine ship transmitters is normally a complex and time-consuming process. Hence, there is a potential applicability of this work to a variety of marine vessels, which is significant, and could be quite useful as a reference for many professionals without direct access to the necessary equipment. Very high-frequency (VHF) radios [
9], working in a frequency range from 156 MHz–176 MHz [
10], and radars [
11] seem to be more common in marine vessels that have been investigated in previous studies. The electromagnetic exposures aboard vessels could be affected by: (i) on-board radiation sources; (ii) conductive objects; and (iii) neighbouring radiation sources, such as other vessels and coastal transmitters. Electromagnetic fields can be reduced by properly designing the systems and equipment, such as choosing the correct material for vessels and finding the correct positioning of equipment on-board [
12].
The aim of this study was to measure and analyse the radio frequency radiation emitted from transmitters aboard a marine vessel, focused on areas normally occupied by crew members and passengers; and to observe whether the measured electric field (EF) levels comply with the ICNIRP and the ARPANSA limits. In this analysis, we used transmitters: VHF band fixed (156–157.42 MHz), MF/HF transceiver (1605 KHz–30 MHz), satellite communication (Sat-Com C) (6006) (1,626.5–1,646.5 MHz), shipborne Automatic Identification System (AIS) navigation (156–163 MHz), radar X-band (9410 MHz) and radar S-band (3,050 MHz).
2. Materials and Methods
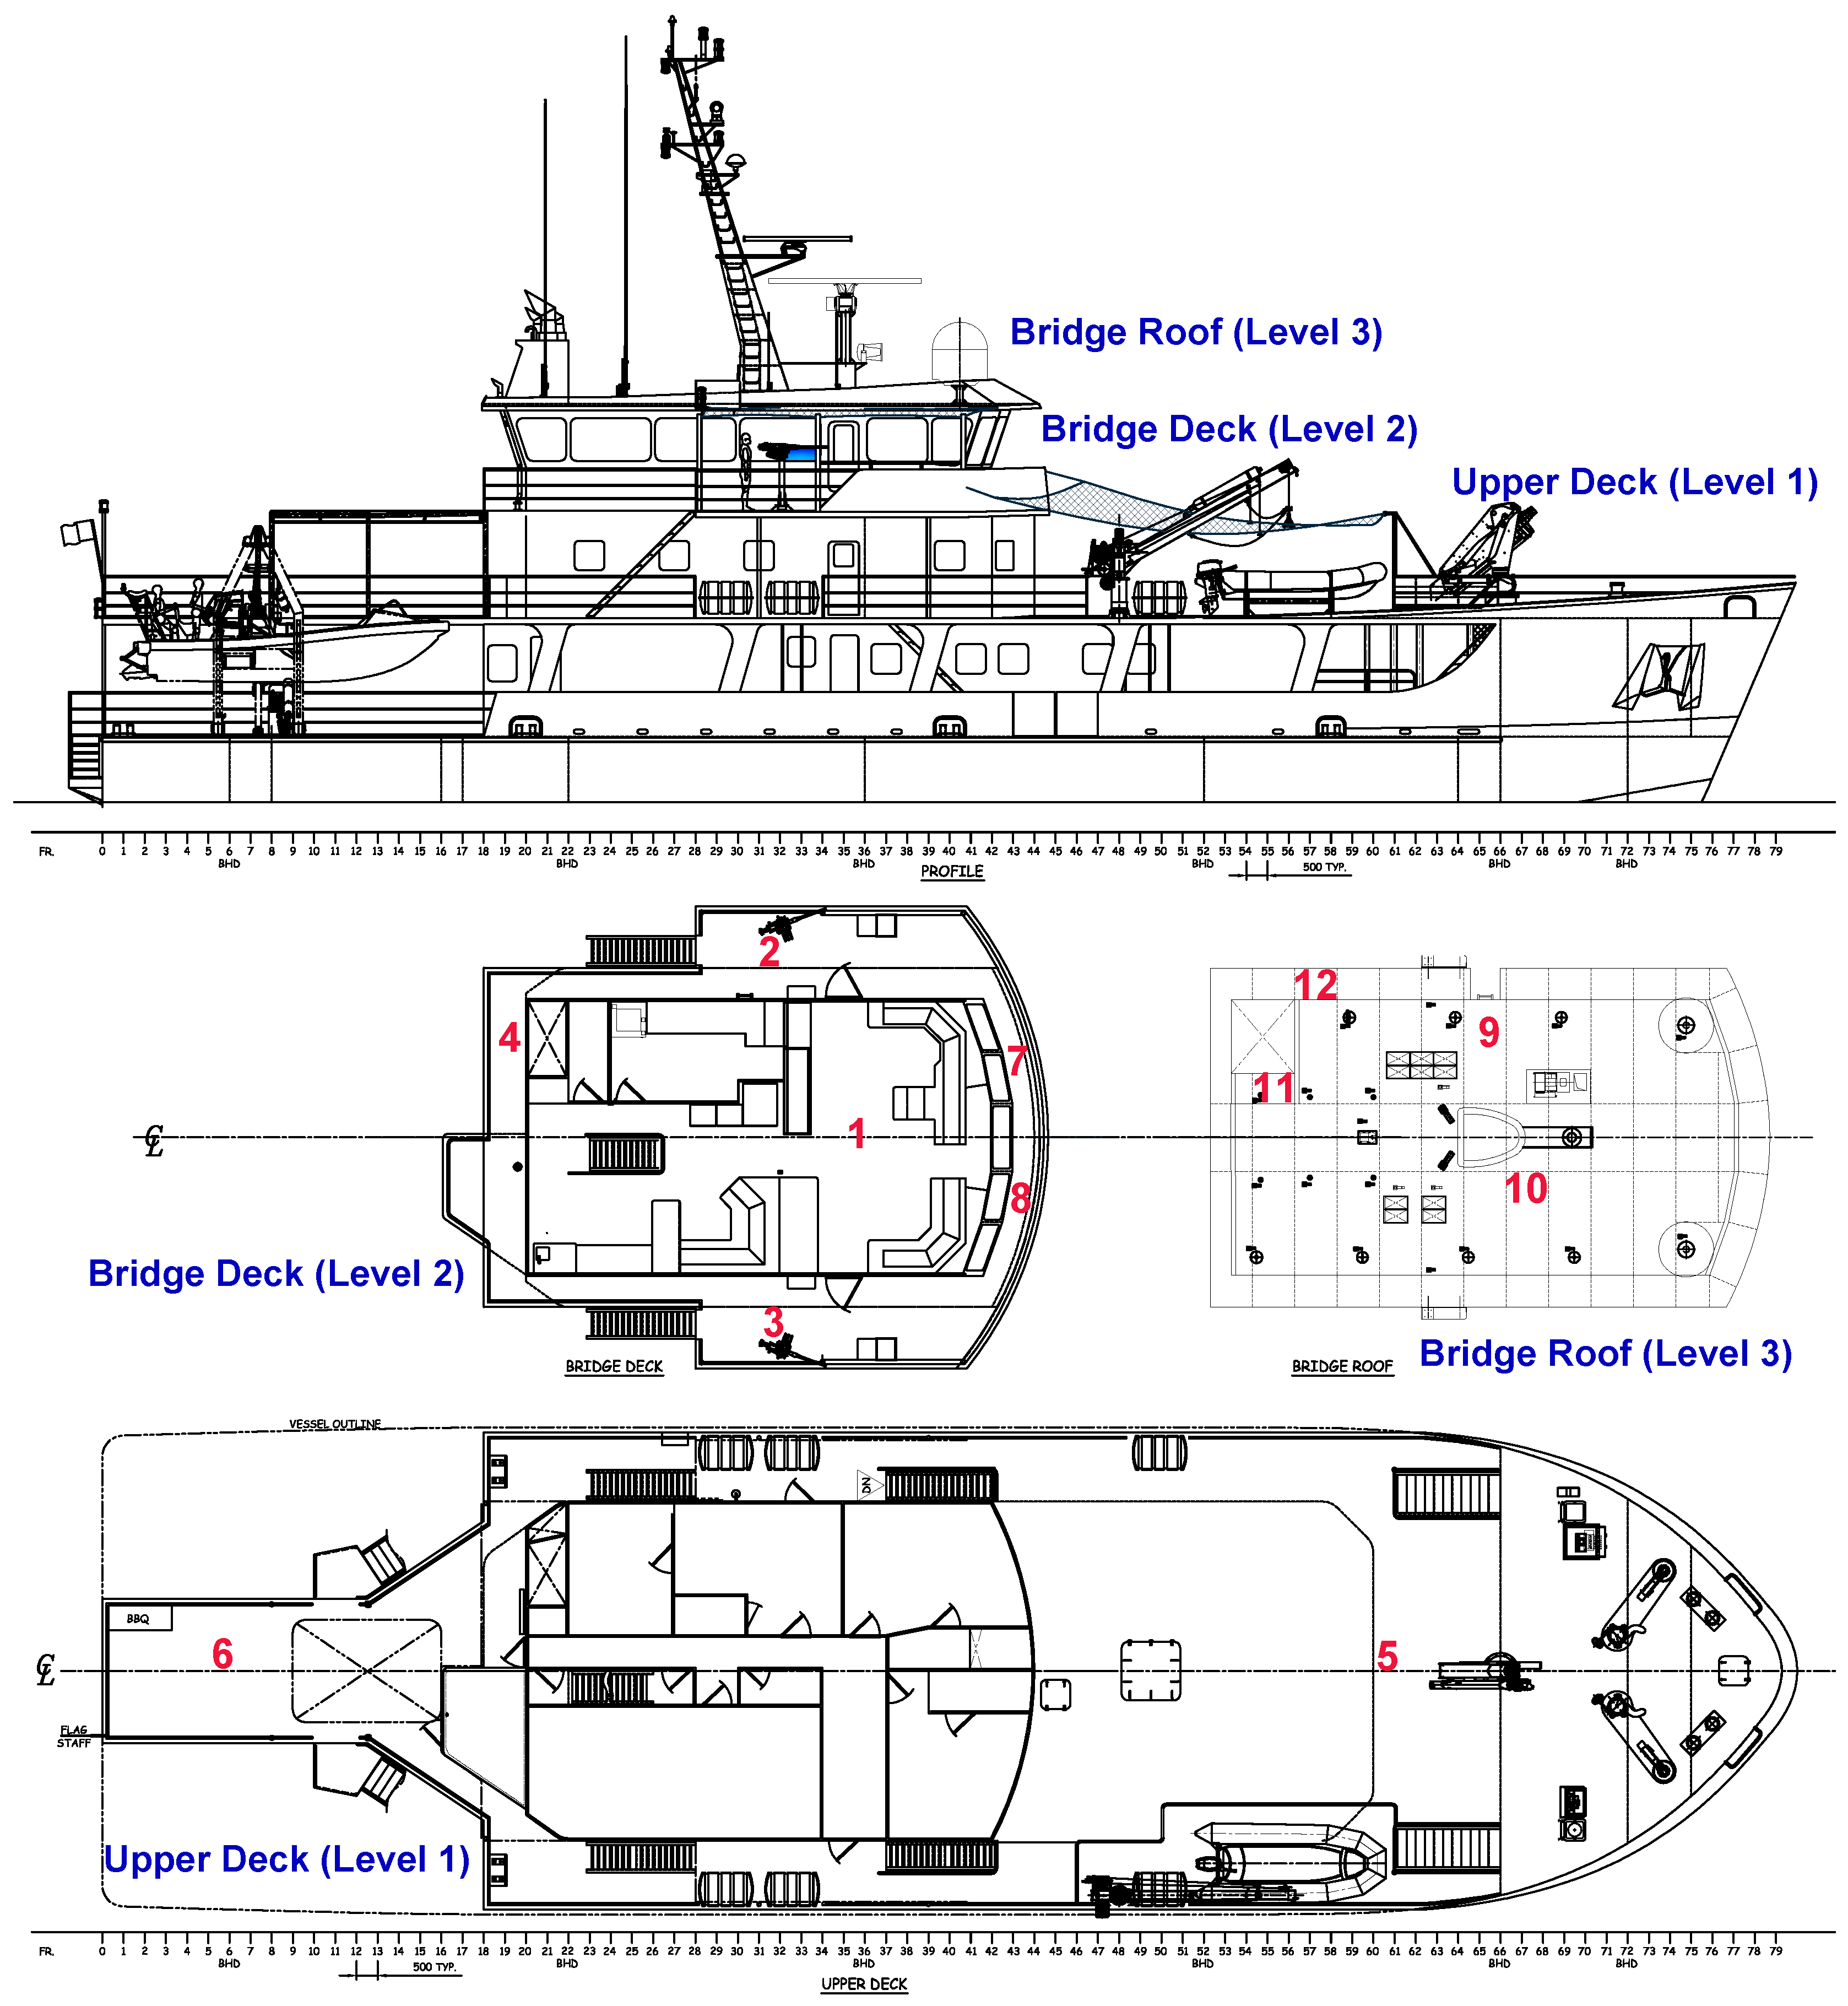
The levels of electric field were recorded in all areas where crew members and passengers gather in all three levels of the ship: (i) the upper deck, Level 1 (the area where the passengers spend some of their time); (ii) the bridge deck, Level 2 (central to where the bridge operation stations are located and the crew members’ working position); and (iii) the bridge roof, Level 3 (where all of the transmitters and antennas were located), as in
Figure 1. Please note that the bridge roof is not accessible to the general public (e.g., passengers). The shipboard radio transmitter and the antenna systems that we used in this study are described in
Table 1. The position numbers or measuring locations in
Table 2 correspond to the numbers in
Figure 1.
All electric field measurements were recorded under similar conditions with (i) a NARDA NBM 520 with probe (EF 1891), frequency range 3 MHz–18 GHz and sensitivity 0.8–1,000 V/m, and (ii) a NARDA NBM 550 with probe (EF 0391), frequency range 100 kHz–3 GHz, sensitivity 0.2 V/m for the electric field and a detection range 0.2–320 V/m (Narda Safety Test Solutions, Germany), to measure the electric field levels in this study. Both broadband and narrowband (frequency selective) instruments can be used for measuring RF fields. In our study, the NARDA meters provide the broadband measurements, and the electric field probes provide isotropic (non-directional) measurements.
The data acquisition time of the NARDA meters is 2 s–5 min. Each position undertook two types of measurements, “spot measurements” and “continuous measurements”. Each set of electric field measurements was taken for 6 minutes at each position until a steady-state value was obtained; average values were then recorded. All probes were oriented vertically during the data collection, and the auto-zeroing function was used to exclude the effects of temperature on the results. Since the field distribution is not homogeneous, the spatial averaging function was used in both meters. The transmission directions of directional antennas did not change during the data collection period.
Figure 1.
Measuring locations (No. 1–12) of the marine ship. The electric field (EF) measurements were recorded in all areas where people (crew members and passengers) gather in all 3 levels of the ship: (i) the upper deck (Level 1, the area where the passengers and crew members spend time); (ii) the bridge deck (Level 2, the crew members’ working position); and (iii) the bridge roof (Level 3, all the transmitters and antennas were mounted). Please note that the bridge roof is not accessible to the general public (e.g., passengers).
Table 1.
Details of shipboard radio transmitter and antenna systems measured. VHF, very high frequency; MF, medium frequency; HF, high frequency.
Table 1.
Details of shipboard radio transmitter and antenna systems measured. VHF, very high frequency; MF, medium frequency; HF, high frequency.
| Radio Transmitter | Manufacturer/Model | Frequencies | Antennas | Radiation Distance Transmitter | Hazard from | License |
|---|
| VHF Fixed | ICOM IC-M505 | 156.0–157.425 MHz | GFE | 1 m | Under Ships Marine Radio License |
| VHF Fixed | Sailor 6006 | 156.0–157.425 MHz | GFE | 1 m | Under Ships Marine Radio License |
| GMDSS Suite |
| MF/HF Transceiver | Sailor | 1605 KHz–30 MHz | ATU6381 Coupler with ANT 800W SSB-HF 8.5MT. (Rx/Tx) ANT 800W SSB-HF 7.0MT. (Tx) | 1.8 m | Under Ships MarineRadio License |
| Satellite Communication (Sat-Com C) | Sailor 6006 | 1626.5–1646.5 MHz | TT-3027C | 0.3 m | Under Ships Marine
Radio License |
| Navigation System |
| Automatic Identification System (AIS) Navigation | SAAB/R5 AIS | 156–163 MHz | Celmar | 0.5 m | Under Ships Marine
Radio License
|
| Radar X-band (25 kW X-band transceiver) | Sperry Marine/VMFT ECAT2 253/8/MK/VM2 | 9,410 MHz | Included, 2.5 m | 100 W/m2 for 0.75 m
10 W/m2 for 7.5 m | Under Ships Marine
Radio License |
| Radar S-band (30 kW S-band transceiver) | Sperry Marine/VMFT ECAT2 253/8/MK/VM2 | 3,050 MHz | Included, 3.5 m | 100 W/m2 for 0.55 m
10 W/m2 for 5.5 m | Under Ships Marine
Radio License |
Table 2.
Measuring locations in all 3 levels of the ship.
Table 2.
Measuring locations in all 3 levels of the ship.
| Location | Reason for the choice of location |
|---|
| Bridge Deck, Level 2 |
| No. 1. Central to the bridge operation stations | The crew members’ working position |
| No. 2. The port wind station | Between the gun and the wind station control (on the left) |
| No. 3. The port wind station | Between the gun and the wind station control (on the right) |
| No. 4. The observation deck | Behind the bridge deck |
| No. 7. The bridge deck and bridge windows | Opposite the crew members’ working position (on the left) |
| No. 8. The bridge deck and bridge windows | Opposite the crew members’ working position (on the right) |
| Upper Deck, Level 1 |
| No. 5. Passenger area | Frequently used by passengers |
| No. 6. The gymnasium | The crew members spend some of their time here |
| Bridge Roof, Level 3 |
| No. 9. The top of the access ladder onto the bridgeroof | Bridge staff spend their time here |
| No. 10. Beside the ship mast, which is at the bottom of the access ladder up the ship mast | Some antennas and equipment were mounted on the mast |
| No. 11. Beside the panels and close to the ventilation flats | This is in the shadow of the ship mast |
| No. 12. Close to the ventilation flats | Outside the shadow sector of the ship mast |
2.1. Spot and Continuous Measurements
Electric field measurements were then taken while the ship was not moving (in the “standing” position), with the engine turned off. Around each of the locations, the meters were moved slowly along the whole area to identify the typical and highest electric field (EF) levels, as well as the location of the high electric fields. Because the likelihood of peaks and nulls in the fields was very high in the confines of the metal ship, the spot measurements were conducted to identify sources of EF. Then, the continuous measurements were taken from the identified locations. Please note that the EF measurements were taken during the weekend to minimise the impact of external disturbances.
Firstly, all of the transmitters and antennas that were installed on the bridge roof were turned off to measure the background electric field levels. Secondly, spot and continuous measurements were recorded in a 40 m-long ship (in total, 528 electric field measurements) [
13]. The ship was positioned in a port and about 150 m from the nearest vessel. Measurements were carried out at 12 different locations (
Table 2) and under 11 different scenarios (
Table 3) in all 3 levels of the ship (upper deck, bridge deck and bridge roof) in locations where crew members and passengers spend their time. The appropriate source of antenna tuning was completed by the radio operator to obtain the maximum level of radiated power. Due to the port emission restriction, these transmitters were switched on only when each location was measured. No other people were on the ship during the measurement period. Repeated measurements were taken at each location to ensure the validity of the data.
2.2. Data Collection Protocol: Various Scenarios of RF Transmitters on Marine Vessels and Reasons
Under a normal operation condition, the ship will have the two radars (X-band and S-band), the AIS and the Sat Comm C; all transmitting continuously. The VHF and the MF/HF radios operate intermittently, in addition to the other navigation equipment transmitting continuously. By considering all of these situations, we developed a data collection protocol and performed various scenarios to observe and measure the radiation emissions from all of the transmitters. The protocol and reasons for the various scenarios are described in
Table 3.
Table 3.
Data collection protocol: the various scenarios of marine ship transmitters for measuring RF-EF levels.
Table 3.
Data collection protocol: the various scenarios of marine ship transmitters for measuring RF-EF levels.
| Scenario No. | Scenario Details |
|---|
| A | Measured with the VHF fixed (IC-M505) switched ON and all other transmitting antennas switched OFF |
| B | Measured with the VHF fixed (Sailor 6006) switched ON and all other transmitting antennas switched OFF |
| C | Measured with the MF/HF transceiver (TU 6360 TX/Tx and CU6301 control unit) switched ON and all other transmitting antennas switched OFF |
| D | Measured with the satellite communication, Sat-Com C (6006), switched ON and all other transmitting antennas switched OFF |
| E | Measured with the AIS navigation (R5 AIS) switched ON and all other transmitting antennas switched OFF |
| F | Measured with the radar X-band (VMFT ECAT2 253/8/MK/VM2) switched ON and all other transmitting antennas switched OFF |
| G | Measured with the radar S-band (VMFT ECAT2 253/8/MK/VM2) switched ON and all other transmitting antennas switched OFF |
| H | Measured with the Group Z (radar X-band, radar S-band, satellite communication (Sat-Com C) and AIS navigation) switched ON and all other transmitting antennas switched OFF (under the normal operation condition, the ship will have two radars, the AIS and Sat Comm C; all transmitting continuously; besides, Sat Comm C does not continuously transmit; however, it operates all of the time; the VHF and MF/HF radios operate intermittently, in addition to the other navigation equipment transmitting continuously) |
| I | Measured with the Group Z + VHF fixed (IC-M505) switched ON |
| J | Measured with the Group Z + VHF fixed (Sailor 6006) switched ON |
| K | Measured with the Group Z + MF/HF transceiver (TU 6360 TX/Tx and CU6301 control unit) switched ON |
2.3. Data Analysis Using Occupational and General Public Exposure Levels
First, we analysed the environment or background EF levels, where all of the transmitters and antennas that were installed on the bridge roof were turned off at each measurement point. As the EF levels were not measured on the same day for all transmitters, the background fields were measured on each day. On average, those values were observed ranging from 0.000 to 0.003 V/m. The background electric field values at different locations were subtracted from all of the other measured data, and negative numbers were rounded to zero.
The probability distribution of the EF levels was observed in order to test the normality of the distribution. The sample sizes used were: for the bridge roof N = 176, the bridge deck N = 264 and the upper deck N = 88. For each set of measurements (one location at one data collection protocol), we calculated the mean and the standard deviation of each dataset. The geometric mean is more applicable than the arithmetic mean (AM) for explaining the relative progress of the EF level values. Therefore, we computed the geometric mean (GM) of each dataset to estimate the population. Nevertheless, the percentage of measurements equal to or greater than 14 V/m (50% of the ICNIRP exposure limit) and 28 V/m (the ICNIRP exposure limit) were calculated.
The interquartile range (IQR) is a vital estimate of the spread of the data, as changes in the upper and lower 25% of the data do not affect it. As an estimate, the IQR is more representative than the standard deviation of the spread of the data, if there are outliers. When the data are from a normal distribution, the IQR is less efficient than the standard deviation; however, we found that our data did not have a normal distribution. Therefore, we analysed the interquartile range of the datasets to perceive how data spread over the 25th (first quartile) and 75th (third quartile) percentiles.
The EF measurements were analysed and compared in all 3 levels of the ship (upper deck, bridge deck and bridge roof) and the operating conditions of the vessels’ transmitters and antennas. For comparison, we used box-and-whiskers plots to show these values. Then, we compared the exposure values with the general public exposure levels of the ICNIRP and the ARPANSA limits in order to quantify the effects. All analyses were carried out using MATLAB (MathWorks Inc., Natick, MA, USA) R2014b on a computer with an Intel Core Intel Core i7 CPU.
Table 4.
The occupational and general public exposure levels of the ICNIRP guidelines and the ARPANSA standards.
Table 4.
The occupational and general public exposure levels of the ICNIRP guidelines and the ARPANSA standards.
| Frequency | General Public (V/m) | Occupational (V/m) |
|---|
| ICNIRP Guidelines |
| 100 kHz–3 GHz | 28.0–87.0 | 61.0–610.0 |
| 3 MHz–18 GHz
| 28.0–61.0 | 61.0–203.03 |
| ARPANSA Standards |
| 100 kHz–3 GHz | 27.4–86.8 | 61.4–614.0 |
| 3 MHz–18 GHz | 27.4–61.4 | 61.4–204.6 |
The regulation and recommendations about the health and environmental effects on all aspects of non-ionizing radiation exposure was given by the independent scientific organization, the International Commission on Non-Ionizing Radiation Protection (ICNIRP) [
1]. In Australia, the occupational and general public exposure levels are mandated by the Australian Radiation Protection and Nuclear Safety Agency (ARPANSA) standards: “Radiation Protection Standard for Maximum Exposure Levels to Radio frequency Fields–3 kHz to 300 GHz”, 2002 (ARPANSA Radiation Protection Standard No. 3 (RPS3)) [
4]. These documents provide reference levels, hence providing verification of compliance with the basic restrictions of the standards. This requires measurements of the highest RF field levels emitted under normal operating conditions and the maximum expected duty factor in areas accessible to workers or the general public [
4]. The time-averaged electric field levels for both public and occupational levels are given in
Table 4. In the next section, the results of the measurements are described and compared to the reference levels of the ICNIRP guidelines and the ARPANSA standards.
3. Results and Discussion
The measured electric fields were then assessed for compliance with the occupational and general public reference levels of the ICNIRP guidelines [
1] and the ARPANSA standards [
4]. Overall, the average electric field levels for various marine vessel’s transmitters were in the range of 0.55–7.99 V/m (AM) and 0.47–3.70 V/m (GM). These fields were below the ICNIRP guidelines, 28 V/m [
1], and the ARPANSA limits, 27.4 V/m [
4], for maximum general public exposure.
Figure 2,
Figure 3 and
Figure 4 show the levels of the electric fields from the marine ship transmitters using box plots with a median and interquartile range. The T-bars (whiskers) were extended to 1.5-times the height of the box (IQR). A “+” symbol depicts a value more than three IQRs from the end of the box (the extreme outlier). A few points with high electric field strengths that exceeded the ICNIRP and the ARPANSA limits for the general public were observed on the bridge roof, as in
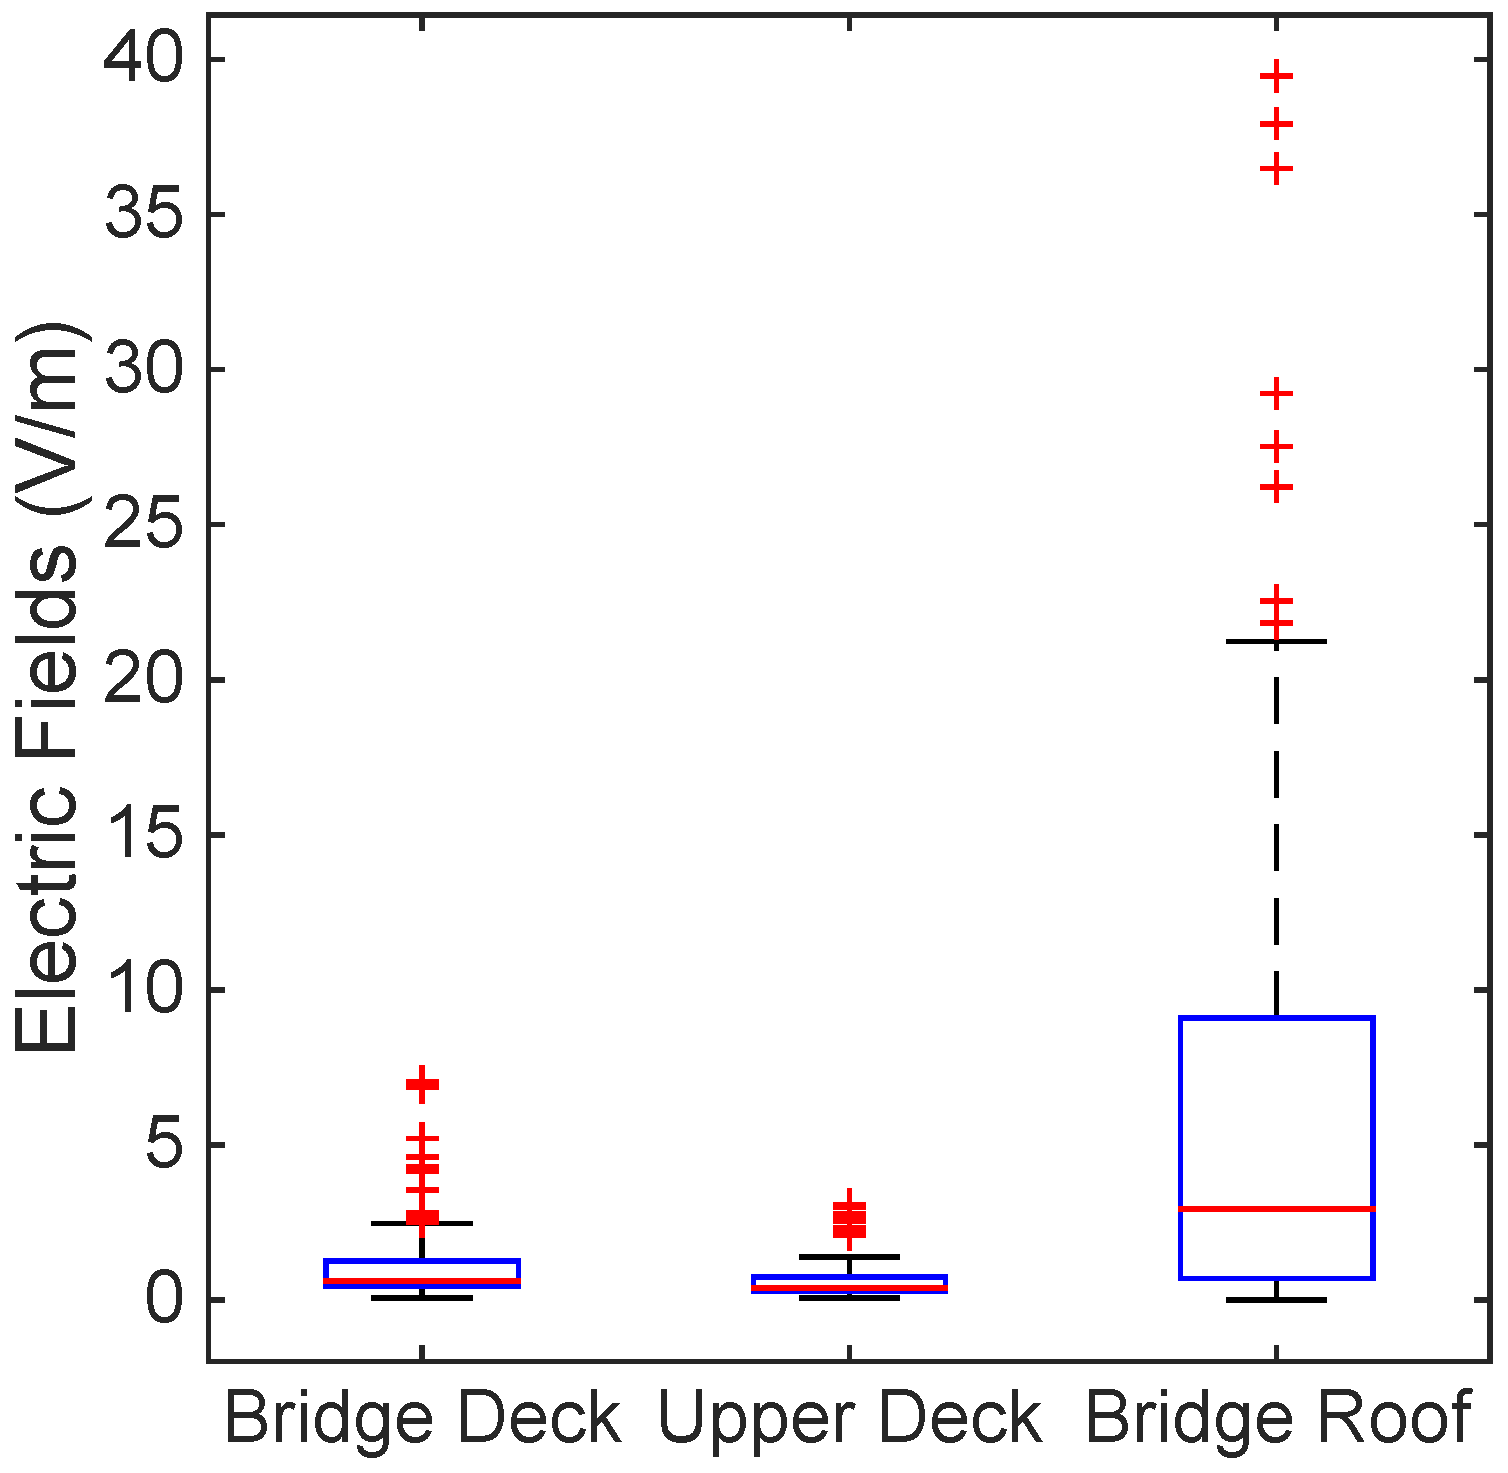
Figure 2; nevertheless, the occupational limits were respected everywhere. Thus, this complies with the occupational and general public reference levels of the ICNIRP guidelines and the ARPANSA standards.
Figure 2.
Electric field level measurement of the bridge deck, upper deck and bridge roof using box plots with a median and interquartile range. The T-bars (whiskers) were extended to 1.5-times the height of the box (inter quartile range, IQR). A “+” symbol depicts a value more than three IQRs from the end of the box (the extreme outlier). The ICNIRP and the Australian Radiation Protection and Nuclear Safety Agency (ARPANSA) limits for the general public were exceeded on the bridge roof; nevertheless, the occupational limits were respected everywhere.
Table 5 presents the descriptive statistics for the electric field measurements of the different levels of the ship. The mean EF levels were significantly (6.321 V/m) higher on the bridge roof compared to the other levels of the ship. This is obvious as all of the transmitters were mounted at Location Nos. 9–12, and this corresponds to
Figure 2. The 75th percentile of the EF measurements was also high (9.377 V/m) on the bridge roof level, and the percentage of measurements above 27.4 V/m were slightly high (3.41%) at this level. The electric field levels were significantly lower in the upper deck level compared to the bridge deck level. Despite that, the general public has no access to the bridge roof at Location Nos. 9–12; therefore, the bridge roof data were assessed for compliance with the occupational reference levels (61 V/m), while upper deck and bridge deck data were assessed by the general public reference levels (28 V/m). All of the measured electric field data were compared to the lowest limit of the respective reference levels, as indicated in
Table 4.
Figure 3.
Electric field level measurement by different locations, as in
Table 2 using box plots with a median and interquartile range. The T-bars (whiskers) were extended to 1.5-times the height of the box (IQR). A “+” symbol depicts a value more than three IQRs from the end of the box (the extreme outlier). The ICNIRP and the ARPANSA limits for the general public were exceeded on the bridge roof; nevertheless, the occupational limits were respected everywhere.
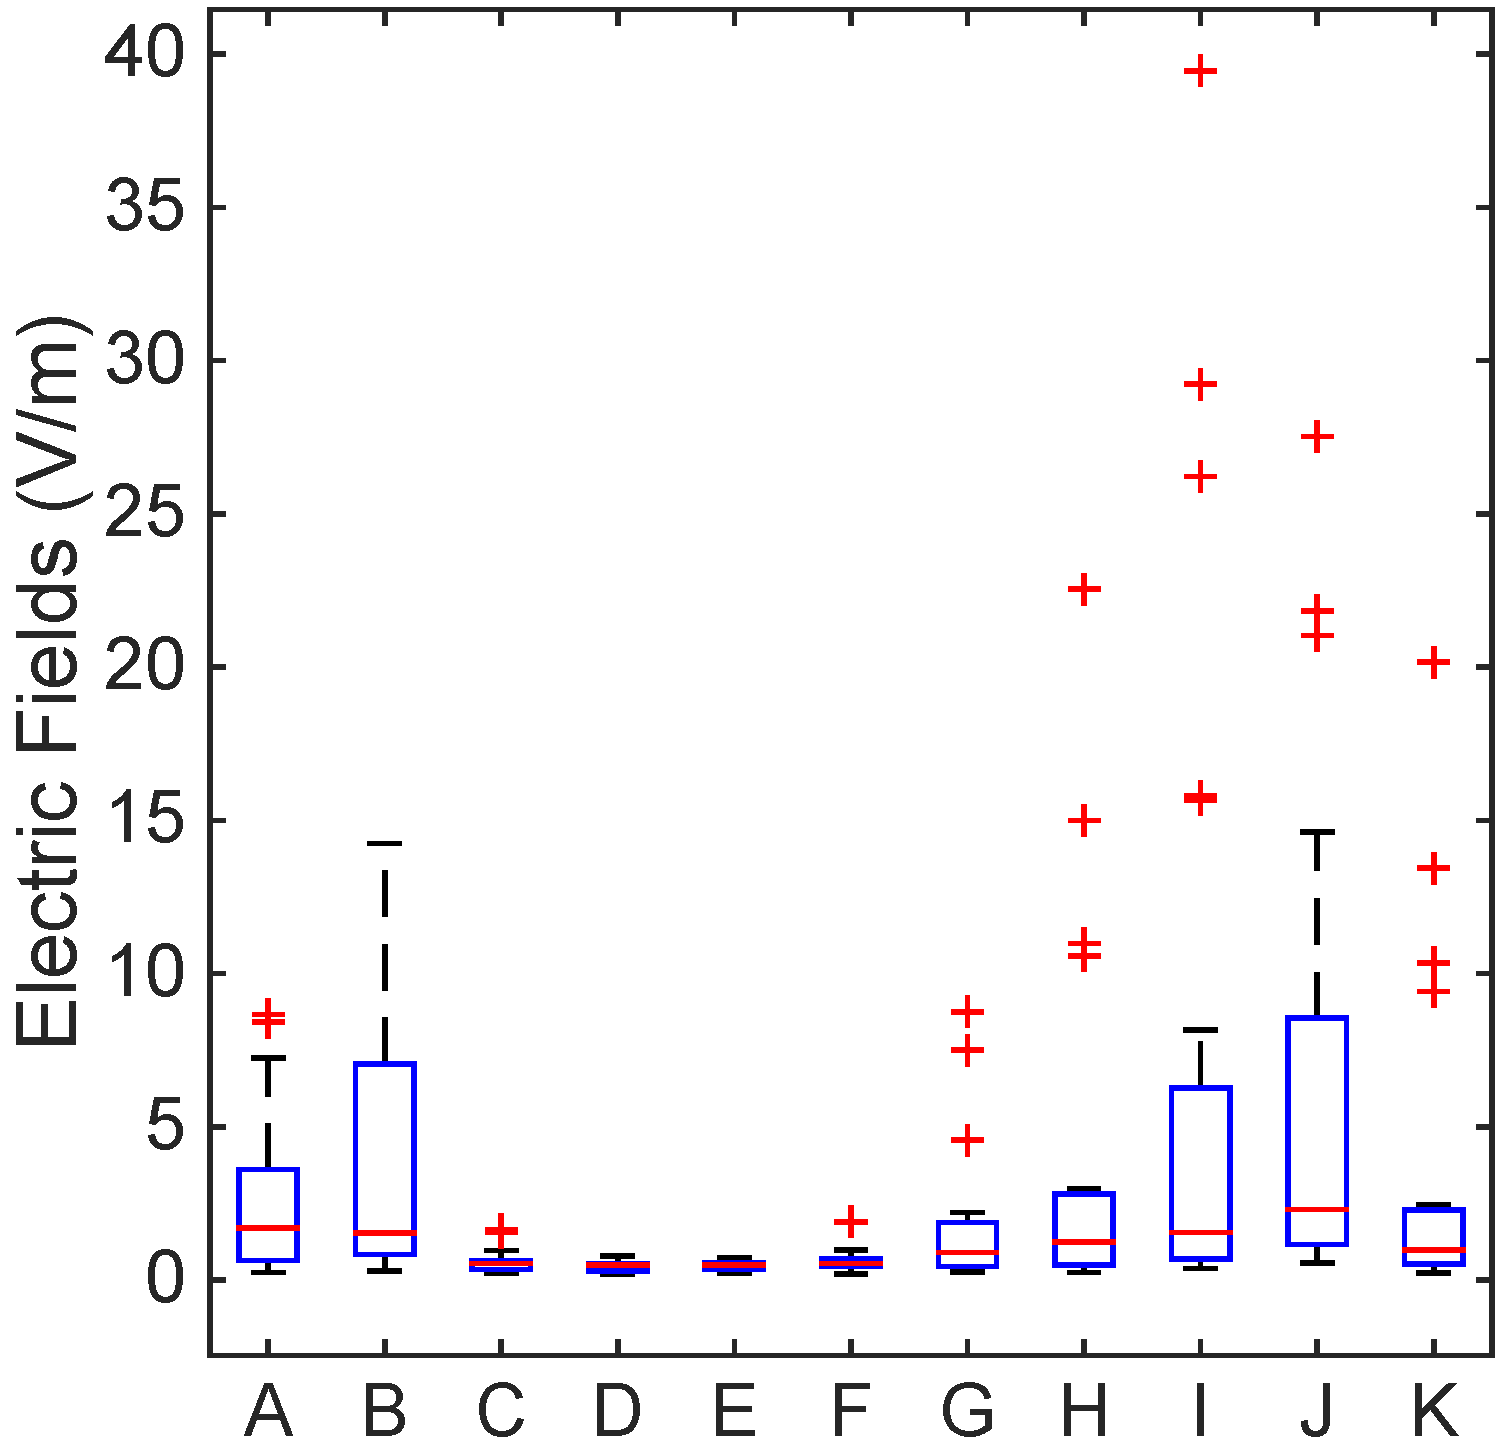
Figure 4.
Electric field level measurement by various scenarios as in
Table 3 using box plots with a median and interquartile range. The T-bars (whiskers) were extended to 1.5-times the height of the box (IQR). A “+” symbol depicts a value more than three IQRs from the end of the box (the extreme outlier). The ICNIRP and the ARPANSA limits for the general public were exceeded on the bridge roof; nevertheless, the occupational limits were respected everywhere.
Table 6 shows the electric field levels in different locations on the ship. The mean EF levels were significantly higher (7.992 V/m) than in Location No. 12 on the bridge roof. The 75th percentile of the EF measurements was also high (12.352 V/m) in Location No. 12, and the percentage of measurements above 27.4 V/m was also slightly high (4.54%). The electric field levels were also significantly higher in Location Nos. 9–12 compared to the others. This is obvious, as all of the transmitters were mounted on the bridge roof.
Figure 3 shows the electric field variation based on the locations that are described in
Table 2 and the values obtained from
Table 6.
Table 7 shows the electric field levels of various scenarios that are described in
Table 3. The mean EF levels were significantly (6.734 V/m) high in Scenario I, when the radar X-band, radar S-band, satellite communication (Sat-Com C), AIS navigation and VHF fixed (IC-M505) were switched on. The 75th percentile of the EF measurements was also high (12.352 V/m) in Scenario J, where the radar X-band, radar S-band, satellite communication (Sat-Com C), AIS navigation and VHF fixed (Sailor 6006) were switched on. The percentage of measurements above 27.4 V/m was slightly higher (8.33%) than in Scenario I. The electric field levels were also significantly higher in Scenarios H–K compared to the others. Similarly,
Figure 4 shows that the electric field level variation is based on the various scenarios that are described in
Table 3 and the values obtained from
Table 7.
Repeated measurements resulted in average electric field levels that differed from each other by about
±11%. Nonetheless, we observed that the effect for crew members and passengers from marine vessel transmitters is minimised from the measurements that were carried out under 11 different scenarios and at 12 different locations on the vessel. Our results demonstrated that the electric field levels measured complied with the international (ICNIRP) [
1] and the Australian (ARPANSA) standards [
4] and were also compatible with the measurements recorded in a previous study [
9]. Nevertheless, for the ICNIRP limit, the acute effects are determined by the intensity of the radiation, and cumulative effects were not presumed, as also indicated in our previous research [
14]. For low frequencies, a limit of the magnetic field could be exceeded even if the electric field limit is low. In contrast to this, at high frequencies (>100 KHz), magnetic and electric fields are decoupled when the near-field is considered.
Table 5.
The descriptive statistics for electric field levels (V/m) emitted from marine transmitters from each ship level.
Table 5.
The descriptive statistics for electric field levels (V/m) emitted from marine transmitters from each ship level.
| Location | N | Minimum | Maximum | Mean (SD) | Geometric Mean (GSD) | Median | 25th–75th Percentile | %>14V/m | %>27.4V/m | Compliance |
|---|
| Overall | 528 | 0.001 | 39.460 | 2.631 (4.925) | 1.027 (3.744) | 0.755 | 0.440–2.21 | 3.97 | 0.94 | Yes |
| Bridge Roof | 176 | 0.001 | 39.460 | 6.001 (7.348) | 2.537 (4.959) | 2.945 | 0.702–9.105 | 11.93 | 2.84 | Yes |
| Bridge Deck | 264 | 0.070 | 7.040 | 1.029 (1.037) | 0.723 (2.310) | 0.630 | 0.442–1.267 | 0.00 | 0.00 | Yes |
| Upper Deck | 88 | 0.070 | 3.090 | 0.694 (0.729) | 0.480 (2.237) | 0.400 | 0.302–0.747 | 0.00 | 0.00 | Yes |
Table 6.
The descriptive statistics for electric field levels (V/m) emitted from the marine transmitters from each location of the ship.
Table 6.
The descriptive statistics for electric field levels (V/m) emitted from the marine transmitters from each location of the ship.
| LocationNo | Minimum | Maximum | Mean (SD) | Geometric Mean (GSD) | Median | 25th–75th Percentile | %>14 V/m | %>27.4V/m | Compliance |
|---|
| 1 | 0.210 | 4.610 | 0.753 (0.959) | 0.491 (2.311) | 0.395 | 0.230–1.065 | 0.00 | 0.00 | Yes |
| 2 | 0.360 | 6.870 | 1.777 (1.755) | 1.157 (2.511) | 0.935 | 0.497–2.513 | 0.00 | 0.00 | Yes |
| 3 | 0.180 | 2.580 | 0.913 (0.831) | 0.609 (2.479) | 0.510 | 0.255–1.467 | 0.00 | 0.00 | Yes |
| 4 | 0.440 | 1.910 | 0.782 (0.371) | 0.718 (1.479) | 0.700 | 0.497–0.890 | 0.00 | 0.00 | Yes |
| 5 | 0.400 | 2.300 | 0.962 (0.590) | 0.826 (1.699) | 0.695 | 0.540–1.235 | 0.00 | 0.00 | Yes |
| 6 | 0.410 | 2.020 | 0.971 (0.488) | 0.868 (1.594) | 0.735 | 0.587–1.377 | 0.00 | 0.00 | Yes |
| 7 | 0.250 | 3.090 | 0.985 (0.950) | 0.657 (2.372) | 0.415 | 0.325–1.877 | 0.00 | 0.00 | Yes |
| 8 | 0.250 | 2.330 | 0.555 (0.425) | 0.471 (1.670) | 0.380 | 0.327–0.737 | 0.00 | 0.00 | Yes |
| 9 | 0.470 | 27.520 | 6.328 (7.645) | 2.766 (3.982) | 3.010 | 0.540–10.447 | 18.18 | 4.54 | Yes * |
| 10 | 0.490 | 15.790 | 4.440 (4.748) | 2.332 (3.339) | 2.545 | 0.627–7.085 | 9.09 | 0.00 | Yes |
| 11 | 0.230 | 39.460 | 6.523 (9.617) | 2.158 (5.037) | 2.565 | 0.505–9.622 | 0.09 | 4.54 | Yes * |
| 12 | 0.540 | 29.230 | 7.992 (8.656) | 3.709 (3.914) | 5.185 | 0.925–12.352 | 22.73 | 4.54 | Yes * |
Table 7.
The descriptive statistics for electric field levels (V/m) emitted from the marine transmitters from each scenario.
Table 7.
The descriptive statistics for electric field levels (V/m) emitted from the marine transmitters from each scenario.
| Scenario No | Transmitter | Minimum | Maximum | Mean (SD) | Geometric Mean (GSD) | Median | 25th–75th Percentile | %>14 V/m | %>27.4 V/m | Compliance |
|---|
| A | VHF band fixed (IC-M505) | 0.240 | 8.670 | 2.629 (2.593) | 1.582 (2.916) | 1.700 | 0.603–7.107 | 0.00 | 0.00 | Yes |
| B | VHF band fixed (Sailor 6006) | 0.290 | 14.250 | 3.855 (4.117) | 2.066 (3.250) | 1.525 | 0.820–7.107 | 4.17 | 0.00 | Yess |
| C | MF/HF transceiver | 0.210 | 3.420 | 0.585 (0.361) | 0.505 (1.691) | 0.540 | 0.342–0.637 | 0.00 | 0.00 | Yes |
| D | Satellite communication | 0.000 | 0.790 | 0.445 (0.162) | 0.415 (1.479) | 0.490 | 0.295–0.540 | 0.00 | 0.00 | Yes |
| E | AIS navigation | 0.070 | 0.720 | 0.456 (0.144) | 0.432 (1.409) | 0.490 | 0.340–0.570 | 0.00 | 0.00 | Yes |
| F | Radar X-band | 0.180 | 4.250 | 0.595 (0.330) | 0.531 (1.590) | 0.540 | 0.457–0.700 | 0.00 | 0.00 | Yes |
| G | Radar S-band | 0.070 | 12.450 | 1.958 (2.490) | 1.081 (2.823) | 0.895 | 0.422–1.915 | 0.00 | 0.00 | Yes |
| H | Group Z | 0.070 | 22.540 | 3.429 (5.599) | 1.416 (3.610) | 1.245 | 0.462–2.840 | 8.33 | 0.00 | Yes |
| I | Group Z + VHF fixed (IC-M505) | 0.160 | 39.460 | 6.734 (10.706) | 2.345 (4.094) | 1.55 | 0.640–7.217 | 20.83 | 8.33 | Yes * |
| J | Group Z + VHF fixed (Sailor 6006) | 0.560 | 27.520 | 6.227 (7.690) | 3.170 (3.170) | 2.300 | 1.110–9.390 | 16.66 | 4.16 | Yes * |
| K | Group Z + MF/HF transceiver | 0.230 | 20.160 | 3.144 (5.031) | 1.332 (3.386) | 0.970 | 0.512–2.302 | 4.16 | 0.00 | Yes |
Larger surveys are desired to verify our findings and to provide reliable knowledge on radio hazard safety assessment for marine ship transmitters and the electromagnetic compatibility (EMC). As indicated in [
15], the sensitivity of the location and standardised and well-described data collection settings are significantly important and should be considered in the comparison of different studies. To reduce electromagnetic fields, marine vessel designers may use low permeable materials, such as glass reinforced plastic (GRP), wood, aluminium hulls in the vessel and equipment construction [
16]. The magnetic fields reduce rapidly with distance; hence, equipment containing inevitable magnetic sources, such as electric motors and transformers, should be located as far away as possible from areas normally occupied by crew members and passengers.
4. Conclusions
In this investigation, we performed measurements and analysed radio frequency radiation emitted by the transmitters aboard a marine vessel, focusing on areas normally occupied by crew members and passengers. In total, 528 electric field measurements were taken. Additionally, we developed a new data collection protocol and performed various scenarios to accurately measure the radiation from all transmitters. Under the normal operating conditions, there were a few marine ship transmitters and antennas transmitting continuously, and other radios operate intermittently. By considering this, for the first time, we report measuring the electric field from each transmitter condition, which is insignificant, and this must be carefully taken into account for future studies. Our results show that the electric field levels were highest on the bridge roof and the lowest in the upper deck, and the measured values were within a range of 0.001–39.46 V/m. The limits for the general public were exceeded on the bridge roof; nonetheless, the occupational limits were respected everywhere. Hence, this complies with the occupational and general public reference levels of the ICNIRP guidelines and the ARPANSA standards. Some further conclusions that can be drawn from this paper are: (i) electric field levels were high with the VHF fixed (Sailor 6006) transmitter; and (ii) high frequency electric field levels that are radiated from the vessels’ transmitters on the bridge roof will not have much impact for crew members and passengers. Nevertheless, this study should be useful as a reference for many researchers and industry professionals without direct access to the necessary equipment. Further research is desired to determine the electric field levels for a larger amount of ships using the proposed protocol in this paper. Such research would provide a basis for establishing safety distances and support the development of guidelines by suitable authorities.


