Spatial Characteristics and Driving Factors of Provincial Wastewater Discharge in China
Abstract
:1. Introduction
2. Data Sources and Research Methods
2.1. Data Sources
2.2. Research Methods
2.2.1. Exploratory Spatial Data Analysis (ESDA) Method
- (a)
- Global Spatial Autocorrelation. It reflects the agglomeration of the research object in the whole space. The index of the Moran’s I is calculated to reflect the spatial agglomeration and its correlation. The formula is:in the formula, represents the total number of research areas; and represents the total wastewater in area and area respectively; is the annual average value of wastewater in different provinces. represents the spatial weight matrix, which is calculated by the nearest neighbor classification algorithm. ranges from −1 to 1. If is less than 0, it indicates that the relationship among wastewater of different provinces is spatially negative and shows a strong spatial heterogeneity; if exceeds 0, it indicates that the relationship among the wastewater of the different provinces is spatially positive and the wastewater discharge of different provinces is spatially intensive, which means it exerts certain effects among one another; if equals 0, it shows that the distribution of the provincial wastewater is random. The significance is measured by the Monte Carlo method of the Geoda software. Indicators of feedback include E(I) (the value of the mathematical expectation), representing an expected value of a scatter random variable, which is the summation of the probability of each possible outcome in the test; Sd. (the standard deviation) representing the arithmetic square root of variance, which reflects the discrete degree between individuals in the group; P(I) (the significance level)representing the probability of error that population parameter falls beyond a certain area.
- (b)
- Local Spatial Autocorrelation. It reflects the spatial difference of the wastewater in the whole country, but it is difficult to show the spatial differences among provinces. The interaction among provinces close to each other should be measured by these methods, which include the Moran scatter diagram and the statistic of the Local Moran’s . The Moran scatter diagram describes the correlation between the variable and the lagging vector, which shows the degree of correlation and differentiation among the value of the spatial unit. The diagram consists of four quadrants, including high-high (HH) type, high-low (HL) type, low-high (LH) type and low-low (LL) type. These four types represent four kinds of relationship between wastewater discharge of one province and that of its neighboring provinces respectively. HH type indicates that wastewater discharge of one province and wastewater discharge of its surrounding provinces are very high (the relationship between them is spatially positive). HL type indicates that wastewater discharge of one province is high but wastewater discharge of its surrounding provinces is low (the relationship between them is spatially negative and the difference is significant). LH type indicates that wastewater discharge of one province is low but that of its neighboring provinces is high (the relationship between them is spatially negative and the difference is significant) and LL type indicates that wastewater discharge of one province and that of its neighboring provinces are very low (the relationship between them is spatially positive).
2.2.2. Logarithmic Mean Divisia Index (LMDI) Model
3. The Spatio-Temporal Features of Wastewater Discharge
3.1. The Temporal Evolution of the Total Wastewater in China
3.2. The Spatial Distribution Change of the Provincial Wastewater Discharge
3.3. The Spatial Variation of the Provincial Wastewater Discharge
4. Analysis of the Driving Factors of Wastewater Discharge
4.1. The Effect of the Driving Factors on the Added Value of the Wastewater Discharge
4.1.1. The Effect of the Economy of Scale on the Value Added of Wastewater Discharge
4.1.2. The Effect of Technological Advances on the Added Value of Wastewater Discharge
4.1.3. The Effect of the Efficiency of the Water Resource Utilization on the Added Value of Wastewater Discharge
4.1.4. The Effect of the Population on the Added Value of Wastewater Discharge
4.2. Recommendations for Reducing Wastewater Discharge Based the Spatial Difference of the Driving Factors
4.2.1. Two-Factor Dominant Type
4.2.2. Three-Factor Leading Type
4.2.3. Four-Factor Antagonistic Type
5. Conclusions
Acknowledgments
Author Contributions
Conflicts of Interest
References
- Lee, S.; Oh, D.W. Economic growth and the environment in China: Empirical evidence using prefecture level data. China Econ. Rev. 2015, 36, 73–85. [Google Scholar] [CrossRef]
- Sieren, F. What Should a China Manager Know about China’s Economy, Politics and Society? In The China Management Handbook; Palgrave Macmillan: London, UK, 2003. [Google Scholar]
- Li, Q.; Song, J.; Wang, E.; Hu, H.; Zhang, J.; Wang, Y. Economic growth and pollutant emissions in China: A spatial econometric analysis. Stoch. Environ. Res. Risk Assess. 2014, 2, 429–442. [Google Scholar] [CrossRef]
- Ministry of Environmental Protection, P.R. China. China Environmental Quality Report; China Environmental Press: Beijing, China, 2011. (In Chinese)
- Tang, Z.; Gong, P.; Liu, W.; Li, J. Sensitivity of Chinese industrial wastewater discharge reduction to direct input coefficients in an input-output context. Chin. Geogr. Sci. 2015, 25, 85–97. [Google Scholar] [CrossRef]
- Chen, M.; Lu, D.; Zha, L. The comprehensive evaluation of China’s urbanization and effects on resources and environment. J. Geogr. Sci. 2010, 20, 17–30. [Google Scholar] [CrossRef]
- Chen, Y. Water Resources Research in Northwest China; Springer: Dordrecht, The Netherlands, 2014. [Google Scholar]
- General Office of the State Council. The 24th, Issued by the General Office of the State Council on the 12th Five-Year Plan National Urban Sewage Treatment and Recycling Facilities Construction Plan. Available online: http://www.gov.cn/zwgk/2012–05/04/content_2129670.htm (accessed on 27 December 2015).
- Hu, H.Y.; Zhao, W.Q.Y. Basic strategies and technology requirements for industrial wastewater pollution control. Res. Environ. Sci. 2010, 7, 861–868. (In Chinese) [Google Scholar]
- Zhao, S.; Wang, H.M.; Qiu, L. Investment efficiency analysis of Chinese industrial wastewater treatment based on expansion-type DEA. Commun. Comput. Inf. Sci. 2011, 159, 342–347. [Google Scholar]
- Zheng, X.; Zhang, Z.; Yu, D.; Chen, X.F.; Cheng, R.; Min, S.; Wang, J.Q.; Xiao, Q.C.; Wang, J.H. Overview of membrane technology applications for industrial wastewater treatment in China to increase water supply. Resour. Conserv. Recycl. 2015, 105, 1–10. [Google Scholar] [CrossRef]
- Prieto, M.A.; Prieto, I.; Vázquez, J.A.; Ferreira, I.C. An environmental management industrial solution for the treatment and reuse of mussel wastewaters. Sci. Total Environ. 2015, 538, 117–128. [Google Scholar] [CrossRef] [PubMed]
- Li, H.Y.; Du, X.Y.; Wang, H.B.; Lv, C.Y.; Wang, X.; Li, F.S. Research on the spatio-temporal variation of industrial wastewater pollutants in the three provinces of northeast China. Res. Environ. Sci. 2008, 2, 168–174. (In Chinese) [Google Scholar]
- Su, D.; Wang, T.; Bai, L. Research on the spatio-temporal variation of pollutant discharged from industrial wastewater in the Liaohe River Basin. Ecol. Environ. Sci. 2010, 19, 2953–2959. (In Chinese) [Google Scholar]
- Zhou, J.; Yang, G.S. Study on the evolvement of the relationship between industrial wastewater discharge and economic growth in Jiangsu Province. Geogr. Res. 2007, 26, 931–939. (In Chinese) [Google Scholar]
- Usama, A.M.; Choong, W.W.; Low, S.T.; Abdul, H.M. Investigating the environmental Kuznets curve (EKC) hypothesis by utilizing the ecological footprint as an indicator of environmental degradation. Ecol. Indic. 2015, 48, 315–323. [Google Scholar]
- Kaika, D.; Zervas, E. The Environmental Kuznets Curve (EKC) theory—Part A: Concept, causes and the CO2 emissions case. Energy Policy 2013, 62, 1392–1402. [Google Scholar] [CrossRef]
- Hettige, H.; Mani, M.; Wheeler, D. Industrial pollution in economic development: The Environmental Kuznets Curve revisited. J. Dev. Econ. 2000, 62, 445–476. [Google Scholar] [CrossRef]
- Chang, K. The Environmental Kuznets Curve effects of energy intensity and emission intensity on optimizing Chinese emission-reduction under the constraint of energy-saving policy. WSEAS Trans. Syst. 2014, 13, 403. [Google Scholar]
- Chen, G.Y.; Li, H.T.; Liang, H.T. The relationship between industrial waste discharge and economic growth in Shanxi, China. Resour. Sci. 2013, 35, 1184–1193. [Google Scholar]
- Tang, Z.P.; Fu, X.; Zhou, Z.E. Identify important coefficients in China’s sectors of discharge amount of industrial wastewater. China Popul. Resour. Environ. 2008, 5, 123–127. (In Chinese) [Google Scholar]
- Zhao, C.; Chen, B. Driving force analysis of the agricultural water footprint in China based on the LMDI method. Environ. Sci. Technol. 2014, 48, 12723–12731. [Google Scholar] [CrossRef] [PubMed]
- Geng, Y.; Wang, M.; Sarkis, J.; Xue, B.; Zhang, L.; Fujita, T.; Yu, X.M.; Ren, W.X.; Zhang, L.M.; Dong, H.J. Spatial-temporal patterns and driving factors for industrial wastewater emission in China. J. Clean. Prod. 2014, 4, 116–124. [Google Scholar] [CrossRef]
- Sun, C.Z.; Xie, W.; Zou, W. Contribution ratio measurement of water use efficiency driving effects and spatial driving type in China. Geogr. Sci. 2011, 10, 1213–1220. (In Chinese) [Google Scholar]
- Sun, C.Z.; Zhao, L.S.; Zou, W.; Zheng, D.F. Water resource utilization efficiency and spatial spillover effects in China. J. Geogr. Sci. 2014, 5, 771–787. [Google Scholar] [CrossRef]
- Massoud, M.A.; Tareen, J.; Tarhini, A.; Nasr, J.; Jurdi, M. Effectiveness of wastewater management in rural areas of developing countries: A case of Al-Chouf Caza in Lebanon. Environ. Monit. Assess. 2010, 161, 61–69. [Google Scholar] [CrossRef] [PubMed]
- Yuan, J.L.; Gu, Z.M.; Ye, J.Y.; Zhu, J.J.; Hu, T.J.; Wang, Y.C.; Wang, Z.Z. Toxicity of printing and dyeing wastewater and sediment on the early development stages of the hemibarbus maculates in the Taihu Lake. Environ. Sci. 2012, 3, 762–768. (In Chinese) [Google Scholar]
- National Bureau of Statistics, China; Ministry of Environmental Protection, China. China Statistic Yearbook on Environment; China Statistics Press: Beijing, China, 2002–2013. (In Chinese)
- National Bureau of Statistics, China. China Statistic Yearbook; China Statistics Press: Beijing, China, 2002–2013. (In Chinese)
- The National Bureau of Statistics of the People’s Republic of China. Available online: http://www.stats.gov.cn/ (accessed on 27 December 2015).
- Ang, B.W.; Liu, F.L. A new energy decomposition method: Perfect in decomposition and consistent in aggregation. Energy 2001, 26, 537–548. [Google Scholar] [CrossRef]
- Ang, B.W. Decomposition of industrial energy consumption: The energy intensity approach. Energy Econ. 1994, 3, 163–174. [Google Scholar] [CrossRef]
- Ang, B.W.; Zhang, F.Q.; Choi, K.H. Factorizing changes in energy and environmental indicators through decomposition. Energy 1998, 6, 489–495. [Google Scholar] [CrossRef]
- Ang, B.W. Decomposition analysis for policymaking in energy: Which is the preferred method? Energy Policy 2004, 9, 1131–1139. [Google Scholar] [CrossRef]
- Ding, L.; Huang, Y.L.; Liu, Y.L.; Liu, C.; Cheng, S.G. Spatio-temporal variability of sudden environmental pollution incidents and influencing factors in China, 1995–2012. Prog. Geogr. 2015, 6, 749–760. (In Chinese) [Google Scholar]
- Bao, Y.C.; Li, X. Spatial data analysis and spatial models. Geogr. Res. 1999, 2, 185–190. [Google Scholar]
- Tamazian, A.; Rao, B.B. Do economic, financial and institutional developments matter for environmental degradation? Evidence from transitional economies. Energy Econ. 2010, 32, 137–145. [Google Scholar] [CrossRef] [Green Version]
- Shannon, M.A.; Bohn, P.W.; Elimelech, M.; Georgiadis, J.G.; Mariñas, B.J.; Mayes, A.M. Science and technology for water purification in the coming decades. Nature 2008, 452, 301–310. [Google Scholar] [CrossRef] [PubMed]
- Hoekstra, A.Y.; Chapagain, A.K. Water footprints of nations: Water use by people as a function of their consumption pattern. In Integrated Assessment of Water Resources and Global Change; Springer: Dordrecht, The Netherlands, 2007; pp. 35–48. [Google Scholar]
- Hu, C.S. The science technology support strategy of Jiangxi Province in central China. China Sci. Technol. Forum 2009, 1, 54–58. (In Chinese) [Google Scholar]
- Zhang, T.X.; Feng, D.Y.; Sun, X.H. A discussion about the strategy on human resources in the west. Popul. Econ. 2003, 1, 35–39. (In Chinese) [Google Scholar]
- Sun, C.Z.; Liu, Y.Y. Analysis of the spatial-temporal pattern of water resources utilization relative efficiency based on DEA-ESDA in China. Resour. Sci. 2009, 10, 1696–1703. (In Chinese) [Google Scholar]
- Shi, T.; Zhang, X.; Du, H.; Shi, H. Urban water resource utilization efficiency in China. Chin. Geogr. Sci. 2015, 25, 684–697. [Google Scholar] [CrossRef]
- Prasse, C.; Stalter, D.; Schulte-Oehlmann, U.; Oehlmann, J.; Ternes, T.A. Spoilt for choice: A critical review on the chemical and biological assessment of current wastewater treatment technologies. Water Res. 2015, 87, 237–270. [Google Scholar] [CrossRef] [PubMed]
- Wu, Q.; Dong, Z.F.; Zhang, B.; Ge, C.Z. Pollution rights trading: Gradually showing booming trend. Environ. Econ. 2014, 1, 37–41. (In Chinese) [Google Scholar]
- Li, Y.S.; Wu, Y.Y.; Ye, W.L.; Gu, P. Policy framework of the compensation for the use of the water pollution rights and its trading. Environ. Econ. 2009, 4, 24–28. (In Chinese) [Google Scholar]
- Guo, X.D.; Lu, D.D.; Liu, W.D.; Bai, Y.P.; Chen, M.X. Analysis of water-saving measures and its effect under the background of water-saving society construction—A case of Hexi region of Gansu. J. Arid Land Resour. Environ. 2013, 7, 1–7. (In Chinese) [Google Scholar]
- Kundzewicz, Z.W.; Mata, L.J.; Arnell, N.W.; Doll, P.; Jimenez, B.; Miller, K.; Okl, T.; Sen, Z.; Shiklomanov, I. The implications of projected climate change for freshwater resources and their management. Hydrol. Sci. J. 2008, 53, 3–10. [Google Scholar] [CrossRef]
- Liu, C.; Liu, W.; Lu, D.; Chen, M.; Xu, M.; Dong, X. China’s provincial eco-compensation difference in 2004–2011. Geogr. Sci. 2015, 12, 1897–1910. (In Chinese) [Google Scholar]
- Ruiz-Rosa, I.; García-Rodríguez, F.J.; Mendoza-Jiménez, J. Development and application of a cost management model for wastewater treatment and reuse processes. J. Clean. Prod. 2015, 113, 299–310. [Google Scholar] [CrossRef]
- Warburton, J.; Horn, L. China’s environmental crisis: What does it mean for development? Development 2007, 50, 48–56. [Google Scholar] [CrossRef]
- Tsagarakis, K.P.; Mara, D.D.; Angelakis, A.N. Wastewater management in Greece: Experience and lessons for developing countries. Water Sci. Technol. 2001, 44, 163–172. [Google Scholar] [PubMed]
- Sylaios, G.; Gikas, G.; Tsihrintzis, V.A. Sustainable Solutions to Wastewater Management: Maximizing the Impact of Territorial Co-operation. Environ. Process. 2016, 3, 1–3. [Google Scholar] [CrossRef]
- Mei, Y.; Feng, S. Water pollution in China: Current status, future trends and countermeasures. Chin. Geogr. Sci. 1993, 3, 24–35. [Google Scholar] [CrossRef]


| Year | Moran’s I | E(I) | Sd. | P(I) |
|---|---|---|---|---|
| 2002 | 0.2182 | −0.0333 | 0.0109 | 0.0160 |
| 2003 | 0.2237 | −0.0333 | 0.0106 | 0.0127 |
| 2004 | 0.2386 | −0.0333 | 0.0109 | 0.0091 |
| 2005 | 0.2210 | −0.0333 | 0.0105 | 0.0131 |
| 2006 | 0.2438 | −0.0333 | 0.0105 | 0.0069 |
| 2007 | 0.2568 | −0.0333 | 0.0105 | 0.0047 |
| 2008 | 0.2517 | −0.0333 | 0.0108 | 0.0061 |
| 2009 | 0.2673 | −0.0333 | 0.0108 | 0.0039 |
| 2010 | 0.2725 | −0.0333 | 0.0108 | 0.0033 |
| 2011 | 0.2842 | −0.0333 | 0.0106 | 0.0021 |
| 2012 | 0.2649 | −0.0333 | 0.0104 | 0.0035 |
| 2013 | 0.2519 | −0.0333 | 0.0104 | 0.0051 |
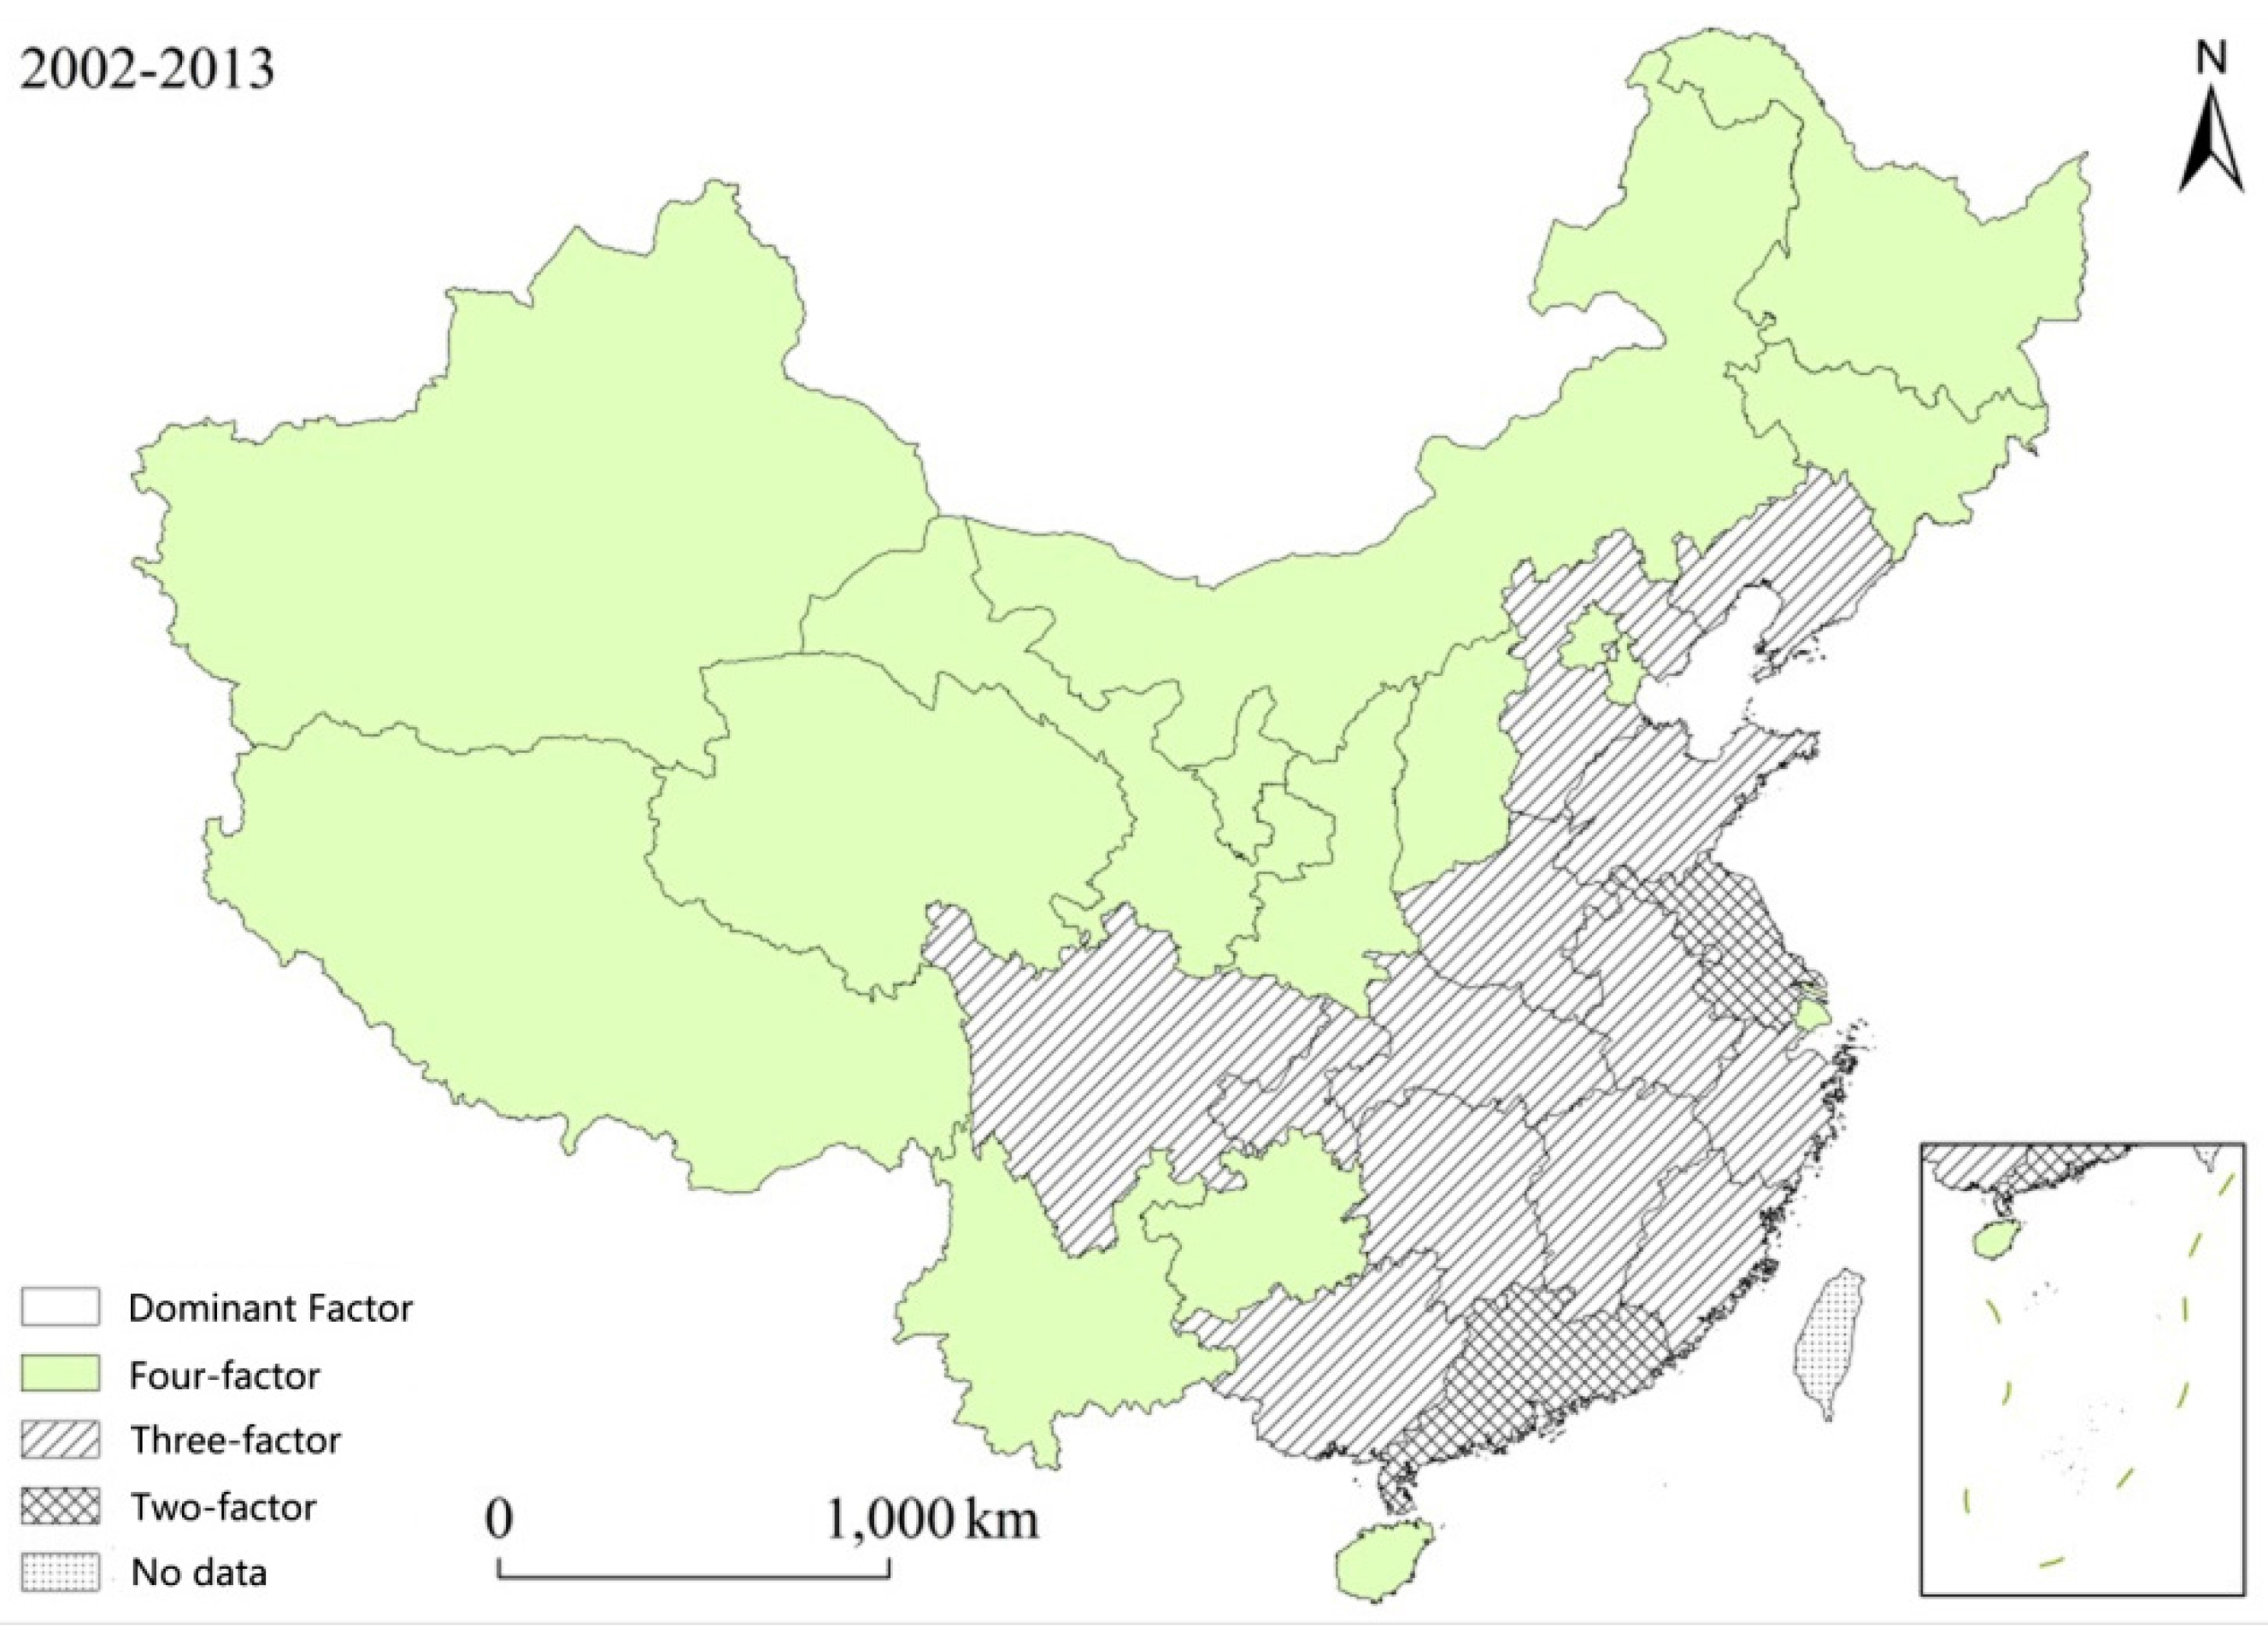
| The Classfication of the Main Driving Factors | Province | efc | tec | eco | pop | All |
|---|---|---|---|---|---|---|
| Two-factor dominant type | Jiangsu | 6.79 | 54.68 | 53.71 | 2.01 | 117.19 |
| Guangdong | 25.48 | 69.72 | 56.06 | 9.03 | 160.29 | |
| Three-factor leading type | Hubei | 1.94 | 27.93 | 30.91 | 0.49 | 61.27 |
| Sichuan | 3.59 | 29.04 | 31.22 | 0.21 | 64.06 | |
| Zhejiang | 6.53 | 30.19 | 29.46 | 3.01 | 69.19 | |
| Hunan | 4.59 | 30.5 | 30.76 | 1.47 | 67.32 | |
| Shandong | 13.49 | 29.79 | 33.72 | 1.74 | 78.74 | |
| Henan | 9.61 | 28.37 | 32.14 | 0.08 | 70.2 | |
| Jiangxi | 3.9 | 15.59 | 18.2 | 0.7 | 38.39 | |
| Chongqing | 1.86 | 17.88 | 18.07 | 0.82 | 38.63 | |
| Liaoning | 2.91 | 24.77 | 23.4 | 0.61 | 51.69 | |
| Fujian | 0.1 | 20.46 | 23.66 | 1.22 | 45.44 | |
| Anhui | 5.3 | 19.26 | 24.26 | 0.28 | 49.1 | |
| Hebei | 9.58 | 24.1 | 21.79 | 1.61 | 57.08 | |
| Guangxi | 5.39 | 24.51 | 26.43 | 0.00 | 56.33 | |
| Four-factorantagonistic type | Hainan | 0.23 | 3.55 | 3.65 | 0.24 | 7.67 |
| Ningxia | 0.12 | 3.74 | 4.23 | 0.28 | 8.37 | |
| Qinghai | 1.68 | 3.8 | 2.32 | 0.11 | 7.91 | |
| Tibet | 0.28 | 0.48 | 0.36 | 0.035 | 1.155 | |
| Tianjin | 1.43 | 7.36 | 6.22 | 2.23 | 17.24 | |
| Xinjiang | 1.62 | 6.29 | 7.43 | 0.81 | 16.15 | |
| Gansu | 2.84 | 6.5 | 5.49 | 0.08 | 14.91 | |
| Yunnan | 6.55 | 10.56 | 12.15 | 0.53 | 29.79 | |
| Shanxi | 3.58 | 12.74 | 13.49 | 0.19 | 30 | |
| Inner Mongolia | 3.33 | 9.2 | 10.08 | 0.28 | 22.89 | |
| Guizhou | 4.14 | 9.42 | 9.46 | 0.38 | 23.4 | |
| Shanxi | 2.35 | 10.51 | 10.8 | 0.87 | 24.53 | |
| Beijing | 3.49 | 10.76 | 7.78 | 3.45 | 25.48 | |
| Jilin | 0.47 | 9.35 | 11.78 | 0.11 | 21.71 | |
| Shanghai | 1.78 | 14.73 | 11.79 | 4.62 | 32.92 | |
| Heilongjiang | 9.28 | 16.84 | 11.23 | 0.042 | 37.392 |
© 2016 by the authors; licensee MDPI, Basel, Switzerland. This article is an open access article distributed under the terms and conditions of the Creative Commons Attribution (CC-BY) license (http://creativecommons.org/licenses/by/4.0/).
Share and Cite
Chen, K.; Liu, X.; Ding, L.; Huang, G.; Li, Z. Spatial Characteristics and Driving Factors of Provincial Wastewater Discharge in China. Int. J. Environ. Res. Public Health 2016, 13, 1221. https://doi.org/10.3390/ijerph13121221
Chen K, Liu X, Ding L, Huang G, Li Z. Spatial Characteristics and Driving Factors of Provincial Wastewater Discharge in China. International Journal of Environmental Research and Public Health. 2016; 13(12):1221. https://doi.org/10.3390/ijerph13121221
Chicago/Turabian StyleChen, Kunlun, Xiaoqiong Liu, Lei Ding, Gengzhi Huang, and Zhigang Li. 2016. "Spatial Characteristics and Driving Factors of Provincial Wastewater Discharge in China" International Journal of Environmental Research and Public Health 13, no. 12: 1221. https://doi.org/10.3390/ijerph13121221


