
Changing Diet Quality in China during 2004–2011


Abstract
:1. Introduction
2. Materials and Methods
2.1. Study Subjects
2.2. Assessment of Food Consumption and Nutrient Intake
2.3. Components, Cut-Off Values and Scoring of the DQI
2.3.1. Diet Variety
2.3.2. Fruits and Vegetables
2.3.3. Total Energy, Calcium
2.3.4. Total Carbohydrates, Total Fat, Saturated Fat, and Protein
2.3.5. Sodium and Alcohol
2.4. Co-Variates
2.5. Statistical Analysis
3. Results
3.1. Descriptive Analysis of Confounders
3.2. Trend of DQI Scores and Its Components
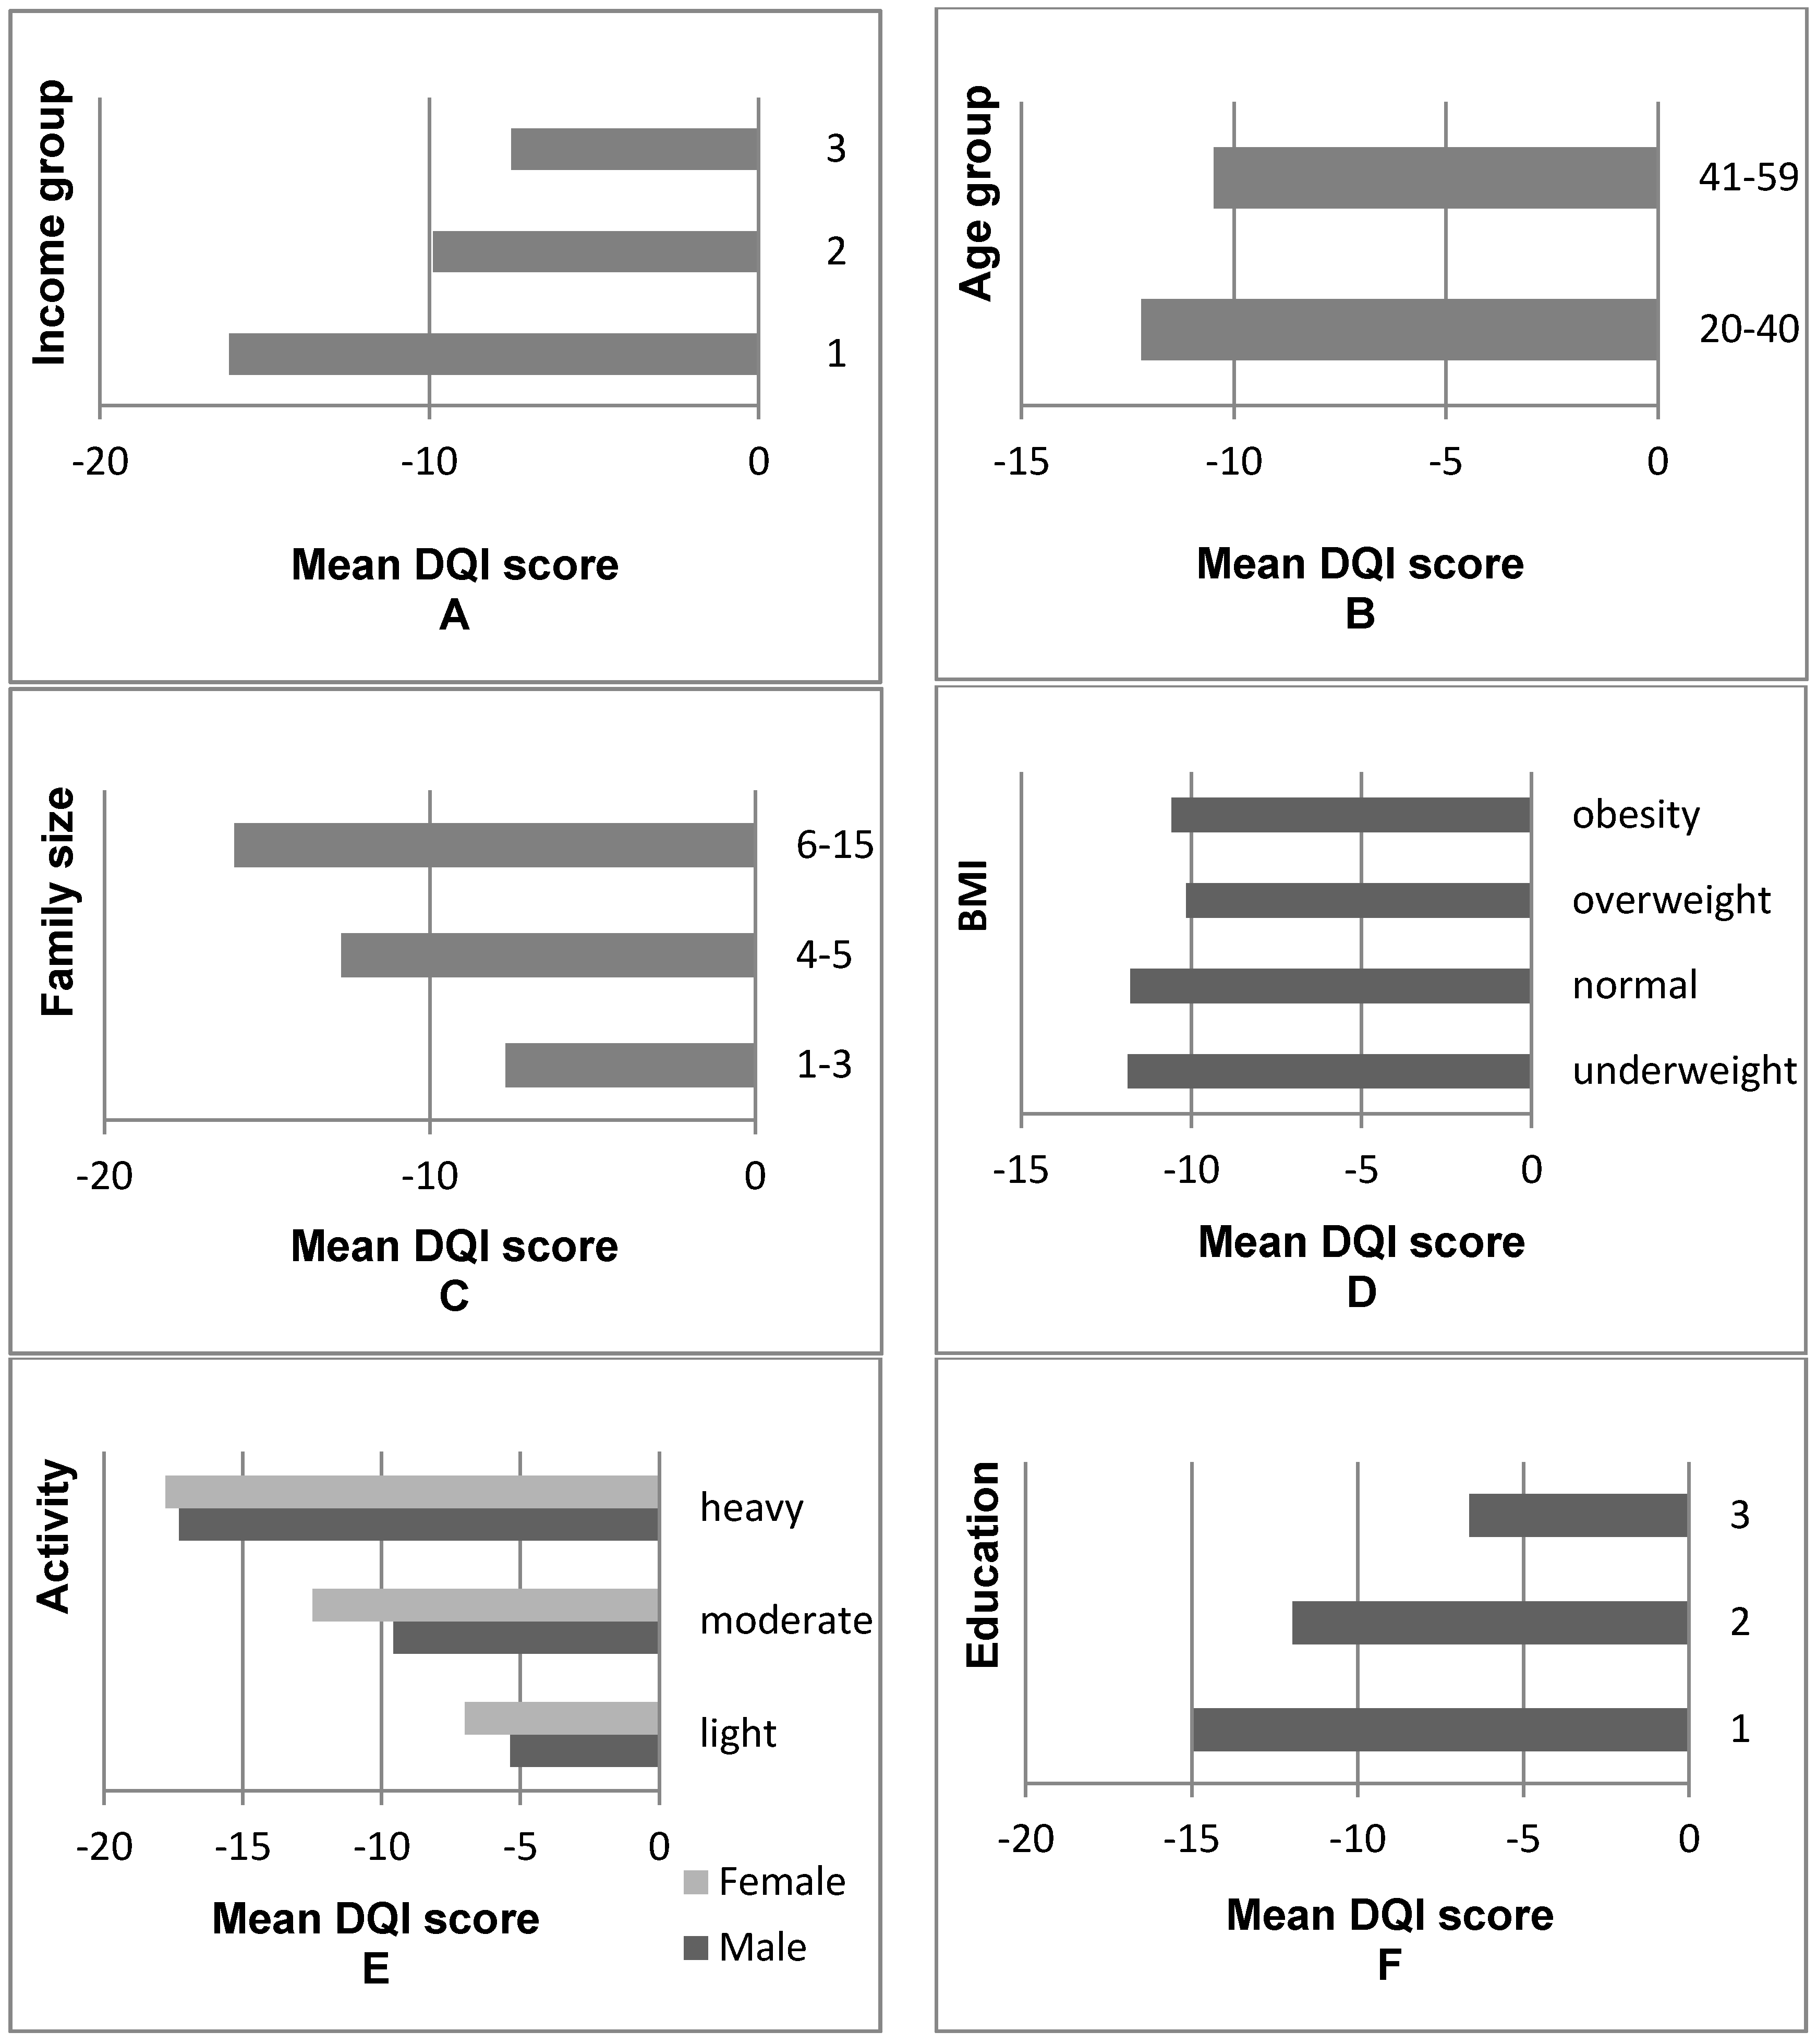
3.3. Analysis of the DQI Scores of Chinese Residents Regarding Various Aspects
3.4. Analysis of the Association between Co-Variants and the DQI Scores
4. Discussion
4.1. The Change of the Total DQI Score over the Eight-Year Period
4.2. The Factors Associated with DQI Scores
4.3. Limitation of the Present Study
4.4. The Advantages of the Present Study
5. Conclusions
Supplementary Materials
Acknowledgments
Author Contributions
Conflicts of Interest
References
- McNaughton, S.A.; Ball, K.; Crawford, D.; Mishra, G.D. An index of diet and eating patterns is a valid measure of diet quality in an Australian population. J. Nutr. 2008, 138, 86–93. [Google Scholar] [PubMed]
- Collins, C.E.; Young, A.F.; Hodge, A. Diet quality is associated with higher nutrient intake and self-rated health in mid-aged women. J. Am. Coll. Nutr. 2008, 27, 146–157. [Google Scholar] [CrossRef] [PubMed]
- Kaluza, J.; Hakansson, N.; Brzozowska, A.; Wolk, A. Diet quality and mortality: A population-based prospective study of men. Eur. J. Clin. Nutr. 2009, 63, 451–457. [Google Scholar] [CrossRef] [PubMed]
- Tucker, K.L. Dietary patterns, approaches, and multicultural perspective. Appl. Physiol. Nutr. Metab. 2010, 35, 211–218. [Google Scholar] [CrossRef] [PubMed]
- Verger, E.O.; Mariotti, F.; Holmes, B.A.; Paineau, D.; Huneau, J.F. Evaluation of a diet quality index based on the probability of adequate nutrient intake (pandiet) using national French and U.S. dietary surveys. PLoS ONE 2012, 7, e42155. [Google Scholar] [CrossRef] [PubMed]
- Zarrin, R.; Ibiebele, T.I.; Marks, G.C. Development and validity assessment of a diet quality index for Australians. Asia Pac. J. Clin. Nutr. 2013, 22, 177–187. [Google Scholar] [PubMed]
- Kim, S.; Haines, P.S.; Siega-Riz, A.M.; Popkin, B.M. The diet quality index-international (DQI-I) provides an effective tool for cross-national comparison of diet quality as illustrated by China and the United States. J. Nutr. 2003, 133, 3476–3484. [Google Scholar] [PubMed]
- Azadbakht, L.; Mirmiran, P.; Esmaillzadeh, A.; Azizi, F. Dietary diversity score and cardiovascular risk factors in tehranian adults. Public Health Nutr. 2006, 9, 728–736. [Google Scholar] [CrossRef] [PubMed]
- Salas-Salvadó, J.; Martinez-González, M.Á.; Bulló, M.; Ros, E. The role of diet in the prevention of type 2 diabetes. Nutr. Metab. Cardiovasc. Dis. 2011, 21 (Suppl. 2), B32–B48. [Google Scholar] [CrossRef] [PubMed]
- Hu, F.B. Globalization of diabetes: The role of diet, lifestyle, and genes. Diabetes Care 2011, 34, 1249–1257. [Google Scholar] [CrossRef] [PubMed] [Green Version]
- Thomas, T.; Pfeiffer, A.F.H. Foods for the prevention of diabetes: How do they work? Diabetes/Metab. Res. Rev. 2012, 28, 25–49. [Google Scholar] [CrossRef] [PubMed]
- Gao, Z.; Yu, X.; Lee, J.-Y. Consumer demand for diet quality: Evidence from the healthy eating index consumer demand for diet quality: Evidence from the healthy eating index. Aust. J. Agric. Resour. Econ. 2013, 57, 301–319. [Google Scholar] [CrossRef]
- Flores, G.; Lin, H. Factors predicting overweight in U.S. kindergartners. Am. J. Clin. Nutr. 2013, 97, 1178–1187. [Google Scholar] [CrossRef] [PubMed]
- Gubbels, J.S.; van Assema, P.; Kremers, S.P. Physical activity, sedentary behavior, and dietary patterns among children. Curr. Nutr. Rep. 2013, 2, 105–112. [Google Scholar] [CrossRef] [PubMed]
- Roytio, H.; Jaakkola, J.; Hoppu, U.; Poussa, T.; Laitinen, K. Development and evaluation of a stand-alone index for the assessment of small children’s diet quality. Public Health Nutr. 2015, 18, 1941–1949. [Google Scholar] [CrossRef] [PubMed]
- Zhang, J.; Wang, H.; Wang, Y.; Xue, H.; Wang, Z.; Du, W.; Su, C.; Zhang, J.; Jiang, H.; Zhai, F.; et al. Dietary patterns and their associations with childhood obesity in China. Br. J. Nutr. 2015, 113, 1978–1984. [Google Scholar] [CrossRef] [PubMed]
- Batis, C.; Mendez, M.A.; Gordon-Larsen, P.; Sotres-Alvarez, D.; Adair, L.; Popkin, B. Using both principal component analysis and reduced rank regression to study dietary patterns and diabetes in Chinese adults. Public Health Nutr. 2016, 19, 195–203. [Google Scholar] [CrossRef] [PubMed]
- Yang, G.; Kong, L.; Zhao, W.; Wan, X.; Zhai, Y.; Chen, L.C.; Koplan, J.P. Emergence of chronic non-communicable diseases in China. Lancet 2008, 372, 1697–1705. [Google Scholar] [CrossRef]
- Whiting, D.R.; Guariguata, L.; Weil, C.; Shaw, J. Idf diabetes atlas: Global estimates of the prevalence of diabetes for 2011 and 2030. Diabetes Res. Clin. Pract. 2011, 94, 311–321. [Google Scholar] [CrossRef] [PubMed]
- Hong, X.; Xu, F.; Wang, Z.; Liang, Y.; Li, J. Dietary patterns and the incidence of hyperglyacemia in China. Public Health Nutr. 2016, 19, 131–141. [Google Scholar] [CrossRef] [PubMed]
- Wang, H.; Du, S.; Zhai, F.; Popkin, B.M. Trends in the distribution of body mass index among Chinese adults, aged 20–45 years (1989–2000). Int. J. Obes. (2005) 2007, 31, 272–278. [Google Scholar] [CrossRef] [PubMed]
- Dearth-Wesley, T.; Wang, H.; Popkin, B.M. Under- and overnutrition dynamics in Chinese children and adults (1991–2004). Eur. J. Clin. Nutr. 2008, 62, 1302–1307. [Google Scholar] [CrossRef] [PubMed]
- Wildman, R.P.; Gu, D.; Muntner, P.; Wu, X.; Reynolds, K.; Duan, X.; Chen, C.S.; Huang, G.; Bazzano, L.A.; He, J. Trends in overweight and obesity in Chinese adults: Between 1991 and 1999–2000. Obesity 2008, 16, 1448–1453. [Google Scholar] [CrossRef] [PubMed]
- National Center for Chronic and Non-Communicable Disease Control and Prevention. Report on Chronic Disease Risk Factor Surveillance in China; Military Medical Science Press: Beijing, China, 2010. (In Chinese) [Google Scholar]
- Xi, B.; Liang, Y.; He, T.; Reilly, K.H.; Hu, Y.; Wang, Q.; Yan, Y.; Mi, J. Secular trends in the prevalence of general and abdominal obesity among Chinese adults, 1993–2009. Obes. Rev. 2012, 13, 287–296. [Google Scholar] [CrossRef] [PubMed]
- Li, M.Z.; Su, L.; Liang, B.Y.; Tan, J.J.; Chen, Q.; Long, J.X.; Xie, J.J.; Wu, G.L.; Yan, Y.; Guo, X.J.; et al. Trends in prevalence, awareness, treatment, and control of diabetes mellitus in mainland China from 1979 to 2012. Int. J. Endocrinol. 2013, 2013, 753150. [Google Scholar] [CrossRef] [PubMed]
- Zuo, H.; Shi, Z.; Hussain, A. Prevalence, trends and risk factors for the diabetes epidemic in China: A systematic review and meta-analysis. Diabetes Res. Clin. Pract. 2014, 104, 63–72. [Google Scholar] [CrossRef] [PubMed]
- Zheng, Z.; Gao, Y.; Zhao, Y. The effect of income growth on urban food consumption patterns. China Econ. Q. 2015, 15, 263–288. (In Chinese) [Google Scholar]
- Tian, X.; Yu, X. Using semiparametric models to study nutrition improvement and dietary change with different indices: The case of China. Food Policy 2015, 53, 67–81. [Google Scholar] [CrossRef]
- Tian, X.; Yu, X. The demand for nutrients in China. Front. Econ. China 2013, 8, 186–206. [Google Scholar]
- Du, S.; Mroz, T.A.; Zhai, F.; Popkin, B.M. Rapid income growth adversely affects diet quality in China—Particularly for the poor! Soc. Sci. Med. (1982) 2004, 59, 1505–1515. [Google Scholar] [CrossRef] [PubMed]
- Xiao, H.; Wang, Z. Rural households dietary quality status and its influence factors analysis in Chinese poor areas. Chin. Rural Econ. 2008, 2, 60–75. (In Chinese) [Google Scholar]
- Zeng, F.F.; Xue, W.Q.; Cao, W.T.; Wu, B.H.; Xie, H.L.; Fan, F.; Zhu, H.L.; Chen, Y.M. Diet-quality scores and risk of hip fractures in elderly urban Chinese in Guangdong, China: A case-control study. Osteoporos. Int. 2014, 25, 2131–2141. [Google Scholar] [CrossRef] [PubMed]
- Liu, J.; Shively, G.E.; Binkley, J.K. Access to variety contributes to dietary diversity in China. Food Policy 2014, 49, 323–331. [Google Scholar] [CrossRef]
- Cheng, G.; Duan, R.; Kranz, S.; Libuda, L.; Zhang, L. Development of a dietary index to assess overall diet quality for Chinese school-aged children: The Chinese children dietary index. J. Acad. Nutr. Diet. 2016, 116, 608–617. [Google Scholar] [CrossRef] [PubMed]
- Chan, R.; Leung, J.; Woo, J. A prospective cohort study to examine the association between dietary patterns and sarcopenia in Chinese community-dwelling older people in Hong Kong. J. Am. Med. Dir. Assoc. 2016, 17, 336–342. [Google Scholar] [CrossRef] [PubMed]
- Stookey, J.D.; Wang, Y.; Ge, K.; Lin, H.; Popkin, B.M. Measuring diet quality in China: The INFH-UNC-CH diet quality index. Eur. J. Clin. Nutr. 2000, 54, 811–821. [Google Scholar] [CrossRef] [PubMed]
- Zhang, B.; Zhai, F.Y.; Du, S.F.; Popkin, B.M. The China health and nutrition survey, 1989–2011. Obes. Rev. 2014, 15, 2–7. [Google Scholar] [CrossRef] [PubMed]
- Institute of Nutrition and Food Safety. China Food Composition 2004; Peking University Medical Press: Beijing, China, 2004. (In Chinese) [Google Scholar]
- Institute of Nutrition and Food Safety. China Food Composition 2002; Peking University Medical Press: Beijing, China, 2002. (In Chinese) [Google Scholar]
- Institute of Nutrition and Food Safety. China Food Composition 2009; Peking University Medical Press: Beijing, China, 2009. (In Chinese) [Google Scholar]
- Xu, X.; Hall, J.; Byles, J.; Shi, Z. Assessing dietary quality of older Chinese people using the Chinese Diet Balance Index (DBI). PLoS ONE 2015, 10, e0121618. [Google Scholar] [CrossRef] [PubMed]
- Wang, Z.H.; Zhai, F.Y.; Wang, H.J.; Zhang, J.G.; Du, W.W.; Su, C.; Zhang, J.; Jiang, H.R.; Zhang, B. Secular trends in meat and seafood consumption patterns among Chinese adults, 1991–2011. Eur. J. Clin. Nutr. 2015, 69, 227–233. [Google Scholar] [CrossRef] [PubMed]
- Trichopoulou, A.; Costacou, T.; Bamia, C.; Trichopoulos, D. Adherence to a mediterranean diet and survival in a greek population. N. Engl. J. Med. 2003, 348, 2599–2608. [Google Scholar] [CrossRef] [PubMed]
- Fung, T.T.; Rexrode, K.M.; Mantzoros, C.S.; Manson, J.E.; Willett, W.C.; Hu, F.B. Mediterranean diet and incidence of and mortality from coronary heart disease and stroke in women. Circulation 2009, 119, 1093–1100. [Google Scholar] [CrossRef] [PubMed]
- Scali, J.; Richard, A.; Gerber, M. Diet profiles in a population sample from Mediterranean southern France. Public Health Nutr. 2001, 4, 173–182. [Google Scholar] [CrossRef] [PubMed]
- Bodnar, L.M.; Siega-Riz, A.M. A diet quality index for pregnancy detects variation in diet and differences by sociodemographic factors. Public Health Nutr. 2002, 5, 801–809. [Google Scholar] [CrossRef] [PubMed]
- Wong, J.E.; Parnell, W.R.; Howe, A.S.; Black, K.E.; Skidmore, P.M. Development and validation of a food-based diet quality index for New Zealand adolescents. BMC Public Health 2013, 13, 562. [Google Scholar] [CrossRef] [PubMed]
- Fulgoni, V.L., 3rd; Chu, Y.; O’Shea, M.; Slavin, J.L.; DiRienzo, M.A. Oatmeal consumption is associated with better diet quality and lower body mass index in adults: The national health and nutrition examination survey (NHANES), 2001–2010. Nutr. Res. 2015, 35, 1052–1059. [Google Scholar] [CrossRef] [PubMed]
- Darmon, N.; Drewnowski, A. Does social class predict diet quality? Am. J. Clin. Nutr. 2008, 87, 1107–1117. [Google Scholar] [PubMed]
- De, Z.; Yu, X. Calorie elasticities with income dynamics: Evidence from the literature. Appl. Econ. Perspect. Policy 2015, 37, 575–601. [Google Scholar]
- Ha, D.T.P.; Feskens, E.J.; Deurenberg, P.; le Mai, B.; Khan, N.C.; Kok, F.J. Nationwide shifts in the double burden of overweight and underweight in Vietnamese adults in 2000 and 2005: Two national nutrition surveys. BMC Public Health 2011, 11, 62. [Google Scholar] [CrossRef] [PubMed]
- Drewnowski, A.; Monsivais, P.; Maillot, M.; Darmon, N. Low-energy-density diets are associated with higher diet quality and higher diet costs in French adults. J. Am. Diet. Assoc. 2007, 107, 1028–1032. [Google Scholar] [CrossRef] [PubMed]
- Huang, J. Social development, urbanization and food consumption. Soc. Sci. China 1999, 4, 102–106. (In Chinese) [Google Scholar]
- Guenther, P.M.; Kott, P.S.; Carriquiry, A.L. Development of an approach for estimating usual nutrient intake distributions at the population level. J. Nutr. 1997, 127, 1106–1112. [Google Scholar] [PubMed]

| Control Variables | DQI (<−20) | DQI (−20~−10) | DQI (−10~0) | DQI (>0) | Total | |||||
|---|---|---|---|---|---|---|---|---|---|---|
| Mean | SD 1 | Mean | SD 1 | Mean | SD 1 | Mean | SD 1 | Mean | SD 1 | |
| Income | 6648 | 9053 | 8581 | 10,930 | 10,155 | 11,998 | 10,335 | 12,606 | 8821 | 11,255 |
| Activity level 2 | 3.24 | 0.88 | 2.95 | 0.90 | 2.78 | 0.88 | 2.57 | 0.80 | 2.90 | 0.90 |
| Education 3 | 1.82 | 0.76 | 1.98 | 0.78 | 2.10 | 0.79 | 2.19 | 0.78 | 2.02 | 0.79 |
| Age | 42.19 | 10.66 | 42.75 | 10.33 | 43.03 | 10.35 | 43.15 | 10.05 | 42.75 | 10.37 |
| Gender 4 | ||||||||||
| Male (%) | 13.66 | 0.00 | 10.42 | 0.00 | 9.87 | 0.00 | 12.95 | 0.00 | 46.90 | 0.00 |
| Female (%) | 15.57 | 0.00 | 12.29 | 0.00 | 11.18 | 0.00 | 14.06 | 0.00 | 53.10 | 0.00 |
| BMI | 23.38 | 3.56 | 23.51 | 3.69 | 23.61 | 3.98 | 23.73 | 3.89 | 23.55 | 3.77 |
| Children ratio | 0.20 | 0.18 | 0.19 | 0.17 | 0.18 | 0.18 | 0.16 | 0.17 | 0.18 | 0.17 |
| Old people ratio | 0.06 | 0.12 | 0.06 | 0.13 | 0.06 | 0.13 | 0.06 | 0.13 | 0.06 | 0.13 |
| Family size | 4.47 | 1.75 | 4.22 | 1.70 | 3.98 | 1.57 | 3.78 | 1.48 | 4.12 | 1.66 |
| Householder status | ||||||||||
| Activity level 2 | 3.16 | 1.12 | 2.81 | 1.19 | 2.60 | 1.20 | 2.32 | 1.14 | 2.73 | 1.20 |
| Education 3 | 1.79 | 0.76 | 1.95 | 0.78 | 2.08 | 0.79 | 2.17 | 0.78 | 1.99 | 0.79 |
| Age | 45.98 | 8.87 | 46.13 | 8.69 | 46.47 | 8.66 | 46.32 | 8.38 | 46.21 | 8.65 |
| Gender 4 | ||||||||||
| Male (%) | 19.96 | 0.00 | 15.30 | 0.00 | 14.77 | 0.00 | 18.46 | 0.00 | 68.49 | 0.00 |
| Female (%) | 9.27 | 0.00 | 7.42 | 0.00 | 6.28 | 0.00 | 8.54 | 0.00 | 31.51 | 0.00 |
| Cook status | ||||||||||
| Activity level 2 | 3.04 | 1.09 | 2.68 | 1.14 | 2.45 | 1.12 | 2.19 | 1.07 | 2.61 | 1.15 |
| Education 3 | 1.64 | 0.73 | 1.83 | 0.78 | 1.95 | 0.80 | 2.04 | 0.81 | 1.86 | 0.79 |
| Age | 43.70 | 8.50 | 44.25 | 8.33 | 44.70 | 8.08 | 44.89 | 7.96 | 44.36 | 8.24 |
| Currently smoking 2 | ||||||||||
| Yes (%) | 8.15 | 0.00 | 6.49 | 0.00 | 6.04 | 0.00 | 7.66 | 0.00 | 28.35 | 0.00 |
| No (%) | 21.07 | 0.00 | 16.22 | 0.00 | 15.01 | 0.00 | 19.35 | 0.00 | 71.65 | 0.00 |
| Region 4 | ||||||||||
| South (%) | 13.06 | 0.00 | 12.67 | 0.00 | 12.56 | 0.00 | 16.56 | 0.00 | 54.85 | 0.00 |
| North (%) | 16.17 | 0.00 | 10.05 | 0.00 | 8.49 | 0.00 | 10.45 | 0.00 | 45.15 | 0.00 |
| Urbanization index 5 | 59.20 | 19.15 | 65.56 | 19.71 | 69.82 | 19.57 | 74.26 | 18.27 | 66.95 | 20.01 |
| Number of observations | 4043 | 3142 | 2912 | 3736 | 13,833 | |||||
| Role | Components | 2004 (n = 3083) | 2006 (n = 3069) | 2009 (n = 3319) | 2011 (n = 4362) | p 2 | Net Change 3 | Contribution 4 | ||||
|---|---|---|---|---|---|---|---|---|---|---|---|---|
| Mean | SD 1 | Mean | SD 1 | Mean | SD 1 | Mean | SD 1 | |||||
| Total DQI score | −9.24 | 19.31 | −7.22 | 18.65 | −13.13 | 15.88 | −13.78 | 15.00 | 0.15 | −4.54 | − | |
| under-nutrition | Diet variety | −6.84 | 3.69 | −6.42 | 3.79 | −5.60 | 3.64 | −5.42 | 3.68 | 0.01 | 1.42 | + |
| Fruit and vegetables | −5.74 | 3.74 | −5.49 | 3.70 | −5.53 | 3.60 | −6.90 | 3.72 | 0.34 | −1.16 | − | |
| Protein | −0.51 | 1.85 | −0.53 | 1.89 | −0.46 | 1.84 | −0.34 | 1.61 | 0.12 | 0.17 | + | |
| Calcium | −7.88 | 3.56 | −8.10 | 3.39 | −8.42 | 3.16 | −8.93 | 2.71 | 0.02 | −1.05 | − | |
| over-nutrition | Saturated fat | 0.59 | 2.20 | 0.73 | 2.44 | 0.04 | 0.57 | 0.02 | 0.43 | 0.12 | −0.57 | + |
| Sodium | 7.44 | 3.69 | 6.91 | 3.78 | 0.20 | 1.17 | 0.15 | 1.00 | 0.06 | −7.29 | + | |
| Alcohol | 0.39 | 1.40 | 0.39 | 1.42 | 0.32 | 1.24 | 0.31 | 1.25 | 0.05 | −0.08 | + | |
| under- and over-nutrition | Energy | −1.78 | 5.66 | −1.91 | 5.63 | −2.12 | 5.60 | −3.40 | 5.77 | 0.14 | −1.62 | − |
| Total carbohydrate | 1.29 | 5.77 | 2.33 | 5.84 | 2.92 | 5.26 | 4.49 | 5.41 | 0.03 | 3.20 | − | |
| Total fat | 3.79 | 5.97 | 4.86 | 5.77 | 5.53 | 5.23 | 6.24 | 5.04 | 0.01 | 2.45 | − | |
| Control Variables | Coefficient | 95% CI | p |
|---|---|---|---|
| Income 1 | |||
| Middle income | 4.816 | (3.966, 5.666) | <0.001 |
| High income | 5.316 | (4.327, 6.304) | <0.001 |
| Activity level 2 | −1.891 | (−2.478, −1.304) | <0.001 |
| Education 3 | 0.257 | (−0.300, 0.814) | 0.366 |
| Age 4 | 1.318 | (0.595, 2.042) | <0.001 |
| Gender 5 | 0.187 | (−0.469, 0.843) | 0.576 |
| BMI 6 | |||
| Underweight | −0.125 | (−1.505, 1.256) | 0.859 |
| Overweight | 1.513 | (0.892, 2.134) | <0.001 |
| Obesity | 1.883 | (0.962, 2.805) | <0.001 |
| Children ratio | −2.631 | (−4.913, −0.349) | 0.024 |
| Old people ratio | −2.609 | (−5.329, 0.111) | 0.060 |
| Family size 7 | |||
| 4–5 | −2.128 | (−2.935, −1.321) | <0.001 |
| 6–15 | −3.389 | (−4.504, −2.274) | <0.001 |
| Householder status | |||
| Activity level 2 | 0.041 | (−0.719, 0.801) | 0.916 |
| Education 3 | 0.469 | (−0.238, 1.176) | 0.193 |
| Age 4 | −0.052 | (−0.112, 0.009) | 0.095 |
| Gender 5 | 0.151 | (−0.626, 0.927) | 0.703 |
| Cook status | |||
| Activity level 2 | −1.602 | (−2.352, −0.852) | <0.001 |
| Education 3 | 0.701 | (0.050, 1.352) | 0.035 |
| Age 4 | 0.079 | (0.019, 0.139) | 0.010 |
| Currently smoking 8 | 0.580 | (−0.208, 1.368) | 0.149 |
| Year 9 | −1.606 | (−1.741, −1.471) | <0.001 |
| Region 10 | 5.200 | (4.450, 5.949) | <0.001 |
| Urbanization index 11 | 0.097 | (0.071, 0.123) | <0.001 |
| constant | −14.863 | (−18.715, −11.011) | <0.001 |
© 2016 by the authors; licensee MDPI, Basel, Switzerland. This article is an open access article distributed under the terms and conditions of the Creative Commons Attribution (CC-BY) license (http://creativecommons.org/licenses/by/4.0/).
Share and Cite
Huang, Y.; Wang, H.; Tian, X. Changing Diet Quality in China during 2004–2011. Int. J. Environ. Res. Public Health 2017, 14, 13. https://doi.org/10.3390/ijerph14010013
Huang Y, Wang H, Tian X. Changing Diet Quality in China during 2004–2011. International Journal of Environmental Research and Public Health. 2017; 14(1):13. https://doi.org/10.3390/ijerph14010013
Chicago/Turabian StyleHuang, Yingying, Hui Wang, and Xu Tian. 2017. "Changing Diet Quality in China during 2004–2011" International Journal of Environmental Research and Public Health 14, no. 1: 13. https://doi.org/10.3390/ijerph14010013