
Impact of Air Pollutants on Outpatient Visits for Acute Respiratory Outcomes

Abstract
:1. Introduction
2. Materials and Methods
2.1. Outpatient Data
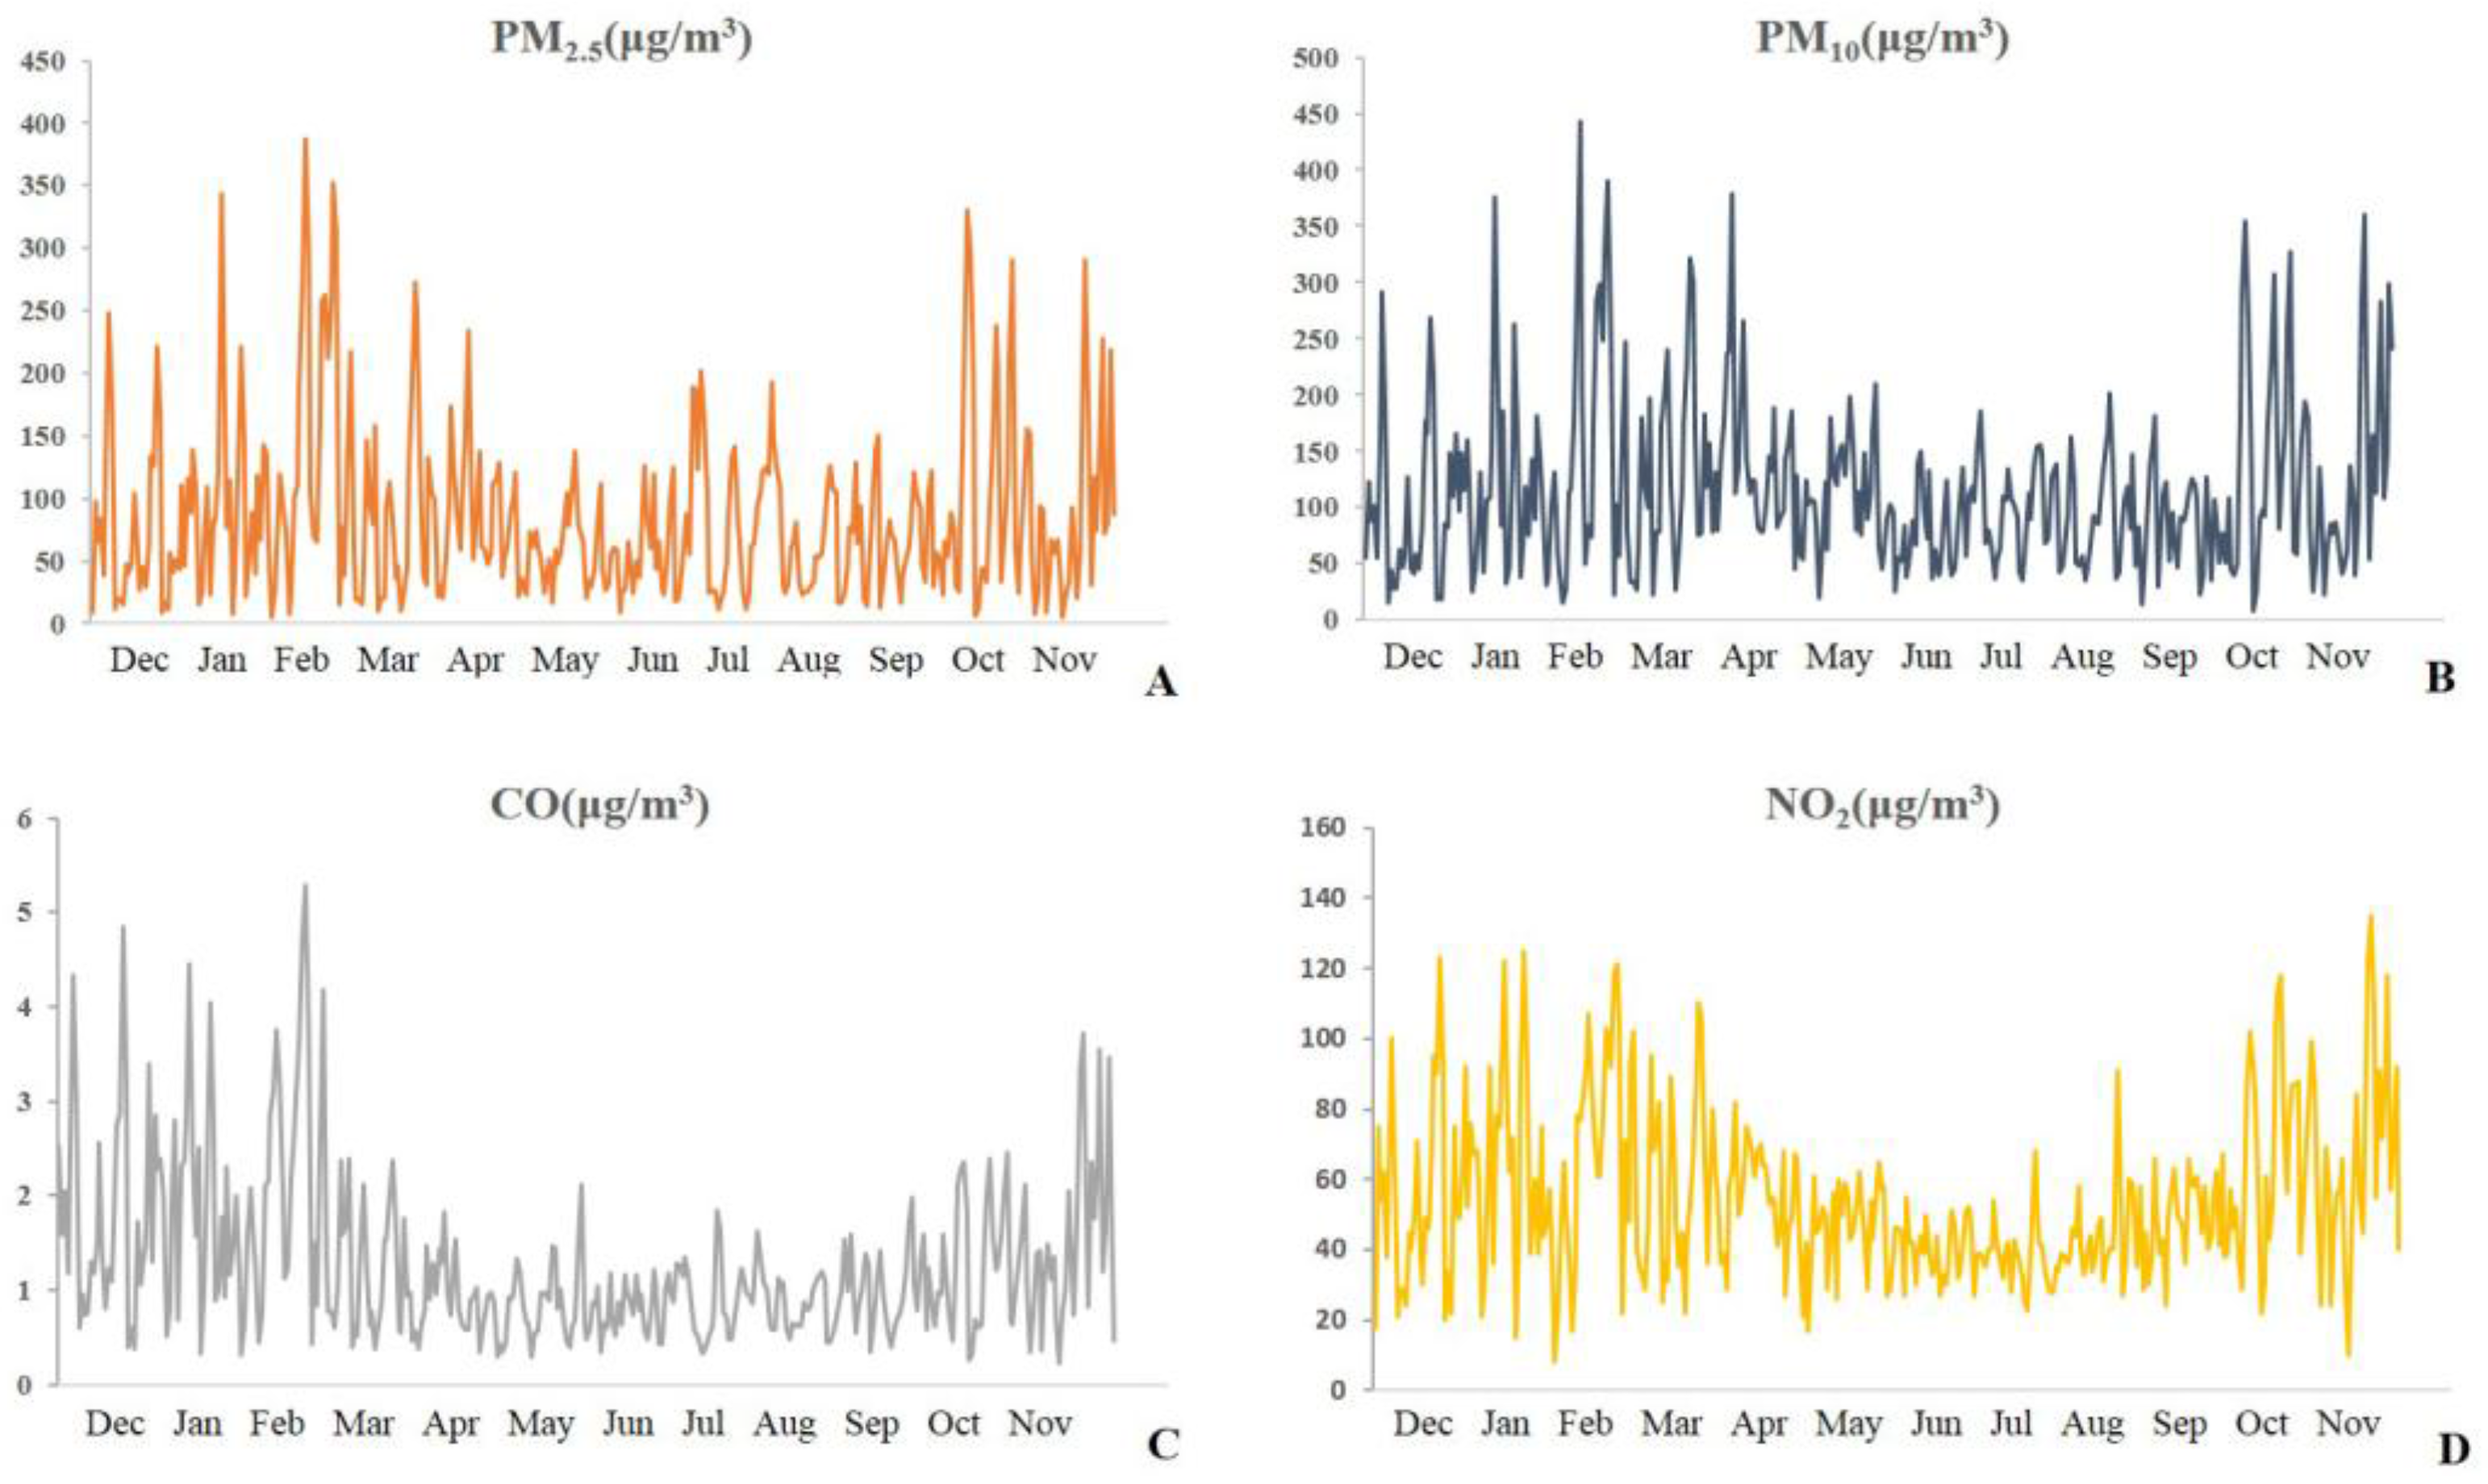
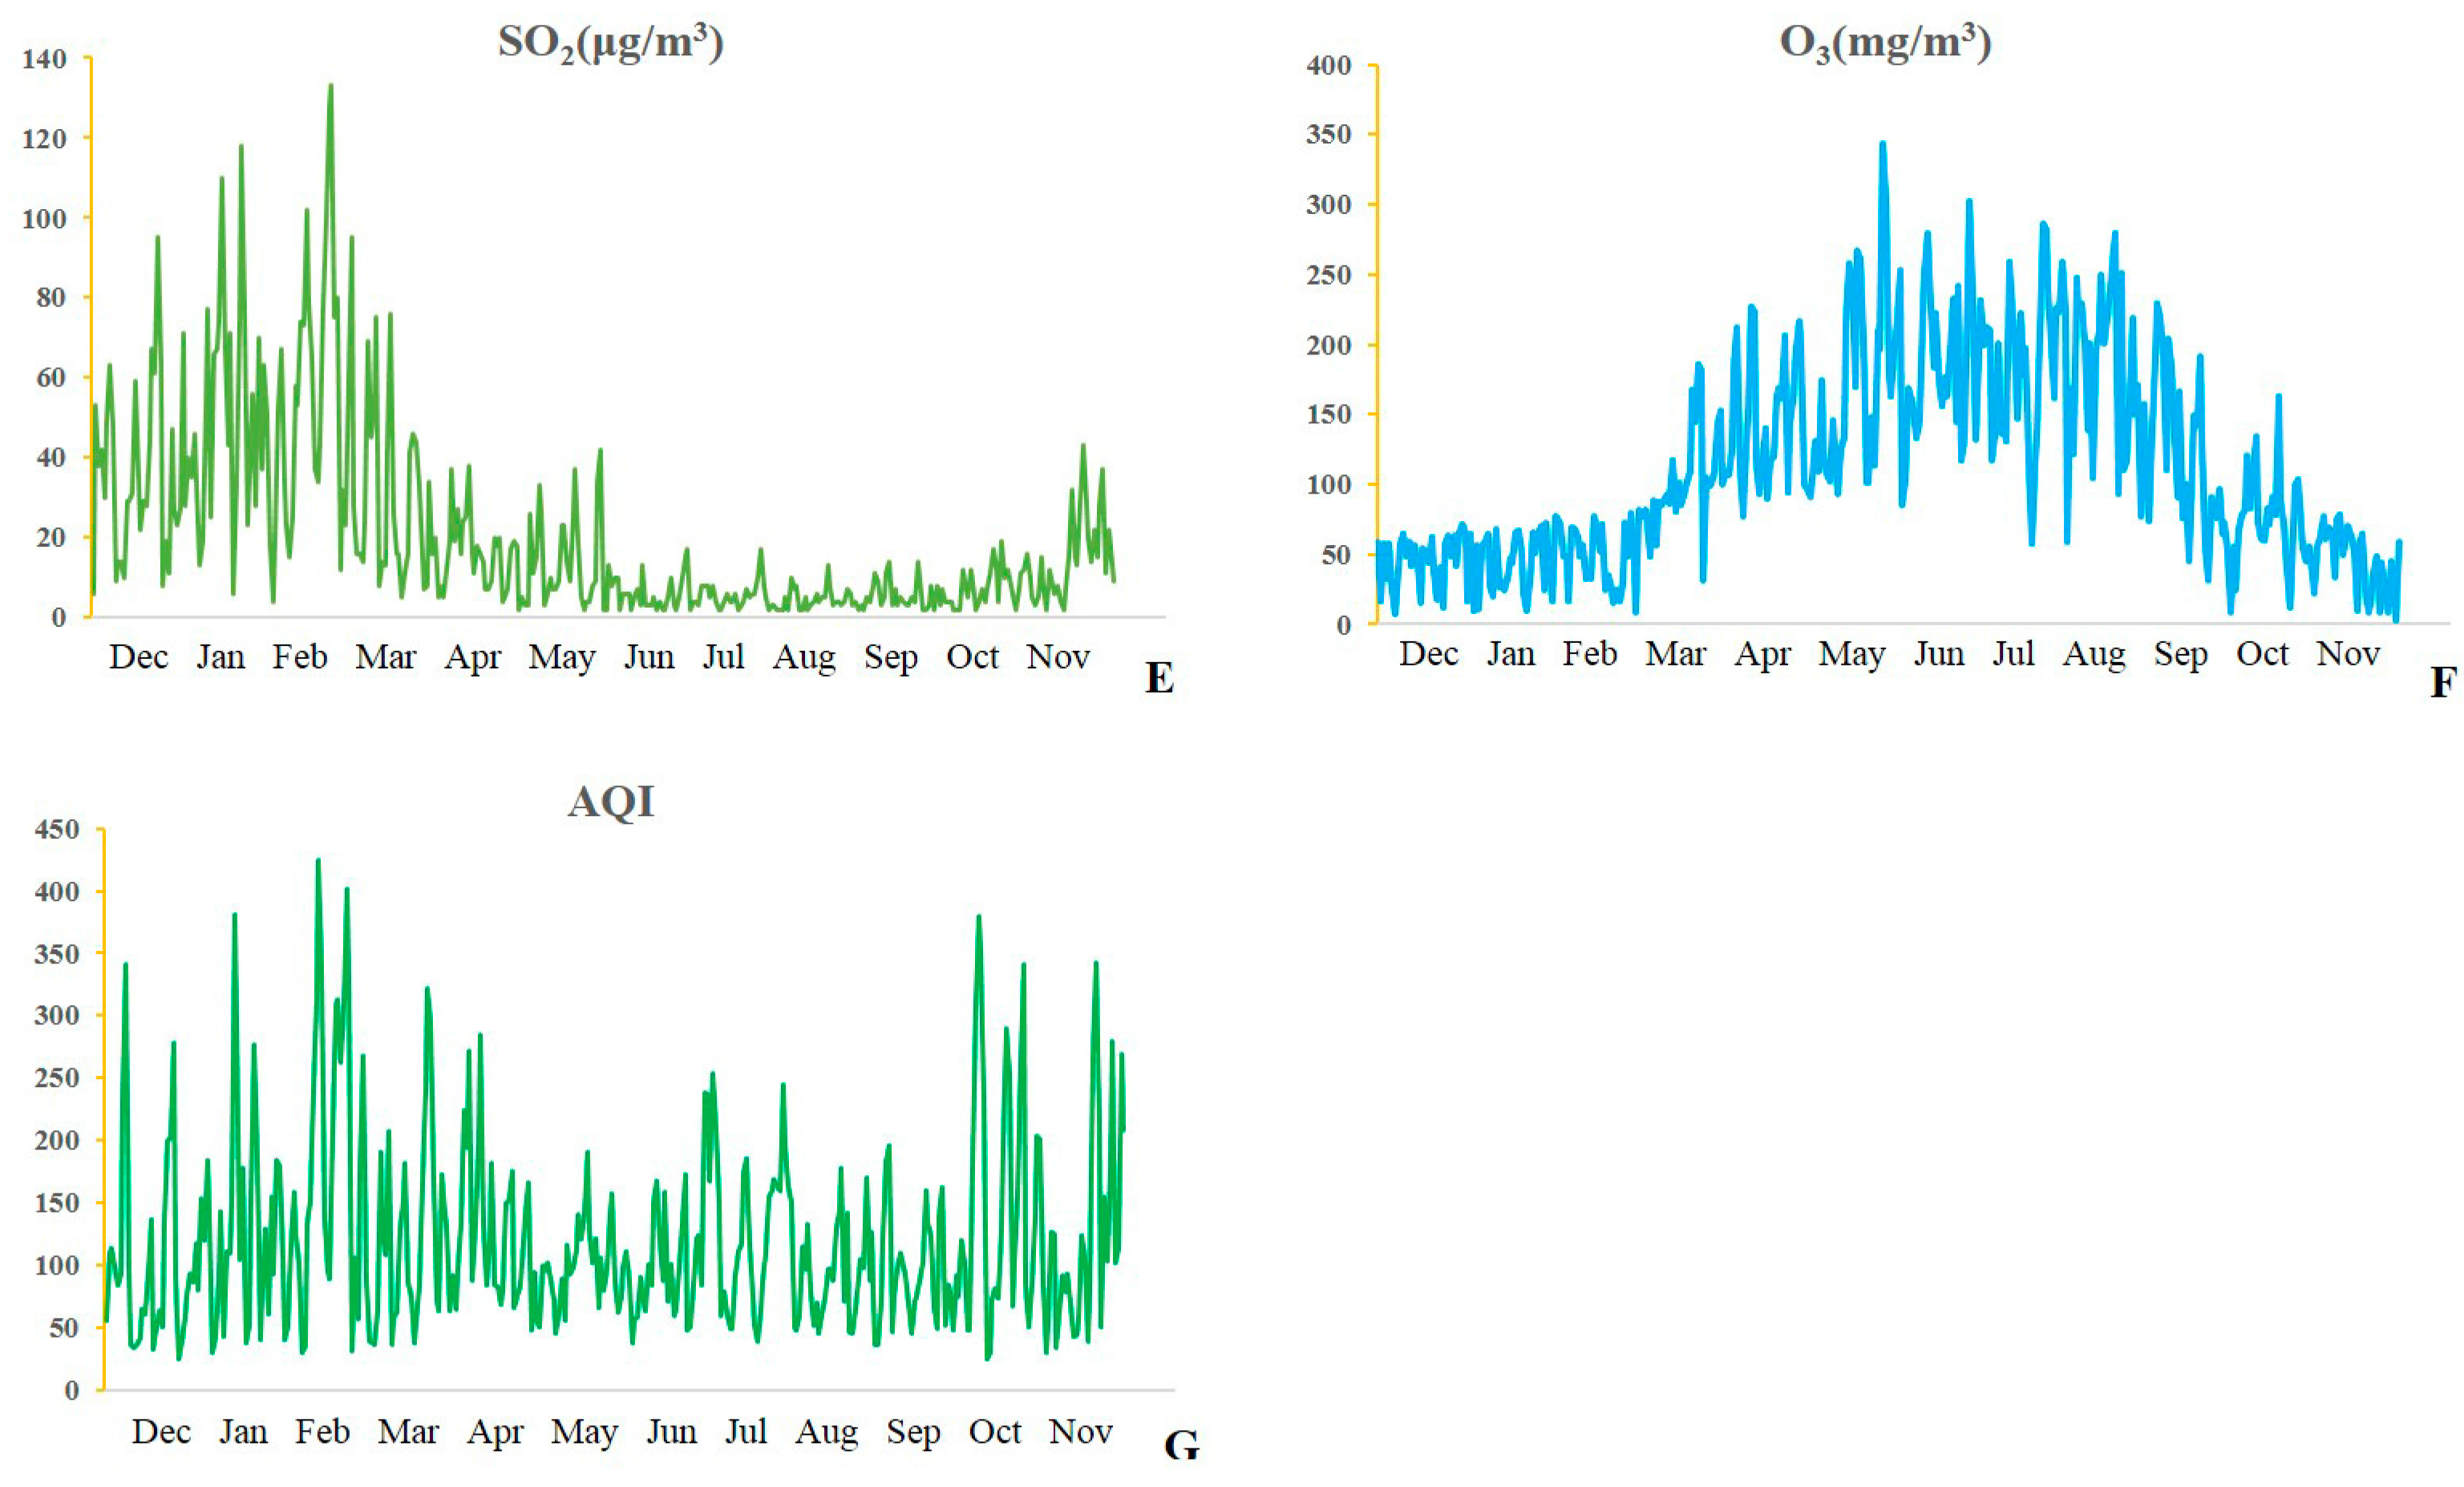
2.2. Environmental Data
2.3. Statistical Analysis
3. Results
4. Discussion
5. Conclusions
Acknowledgments
Author Contributions
Conflicts of Interest
References
- Rohde, R.A.; Muller, R.A. Air Pollution in China: Mapping of Concentrations and Sources. PLoS ONE 2015, 10, e0135749. [Google Scholar] [CrossRef] [PubMed]
- Faustini, A.; Stafoggia, M.; Colais, P.; Berti, G.; Bisanti, L.; Cadum, E.; Cernigliaro, A.; Mallone, S.; Scarnato, C.; Forastiere, F.; et al. Air pollution and multiple acute respiratory outcomes. Eur. Respir. J. 2013, 42, 304–313. [Google Scholar] [CrossRef] [PubMed]
- Yi, Q.; Hong, Y.C.; Kim, H. Seasonal effect of PM(10) concentrations on mortality and morbidity in Seoul, Korea: A temperature-matched case-crossover analysis. Environ. Res. 2010, 110, 89–95. [Google Scholar] [CrossRef] [PubMed]
- Medina-Ramon, M.; Zanobetti, A.; Schwartz, J. The effect of ozone and PM10 on hospital admissions for pneumonia and chronic obstructive pulmonary disease: A national multicity study. Am. J. Epidemiol. 2006, 163, 579–588. [Google Scholar] [CrossRef] [PubMed]
- Zanobetti, A.; Schwartz, J. Air pollution and emergency admissions in Boston, MA. J. Epidemiol. Community Health 2006, 60, 890–895. [Google Scholar] [CrossRef] [PubMed]
- Tsai, S.S.; Chang, C.C.; Yang, C.Y. Fine particulate air pollution and hospital admissions for chronic obstructive pulmonary disease: A case-crossover study in Taipei. Int. J. Environ. Res. Public Health 2013, 10, 6015–6026. [Google Scholar] [CrossRef] [PubMed]
- Dominici, F.; Peng, R.D.; Bell, M.L.; Pham, L.; McDermott, A.; Zeger, S.L.; Samet, J.M. Fine particulate air pollution and hospital admission for cardiovascular and respiratory diseases. JAMA 2006, 295, 1127–1134. [Google Scholar] [CrossRef] [PubMed]
- Cheng, M.H.; Chiu, H.F.; Yang, C.Y. Coarse Particulate Air Pollution Associated with Increased Risk of Hospital Admissions for Respiratory Diseases in a Tropical City, Kaohsiung, Taiwan. Int. J. Environ. Res. Public Health 2015, 12, 13053–13068. [Google Scholar] [CrossRef] [PubMed]
- Neupane, B.; Jerrett, M.; Burnett, R.T.; Marrie, T.; Arain, A.; Loeb, M. Long-term exposure to ambient air pollution and risk of hospitalization with community-acquired pneumonia in older adults. Am. J. Respir. Crit. Care Med. 2010, 181, 47–53. [Google Scholar] [CrossRef] [PubMed]
- Zheng, X.Y.; Ding, H.; Jiang, L.N.; Chen, S.W.; Zheng, J.P.; Qiu, M.; Zhou, Y.X.; Chen, Q.; Guan, W.J. Association between Air Pollutants and Asthma Emergency Room Visits and Hospital Admissions in Time Series Studies: A Systematic Review and Meta-Analysis. PLoS ONE 2015, 10, e0138146. [Google Scholar] [CrossRef] [PubMed]
- Liu, P.; Wang, X.; Fan, J.; Xiao, W.; Wang, Y. Effects of Air Pollution on Hospital Emergency Room Visits for Respiratory Diseases: Urban-Suburban Differences in Eastern China. Int. J. Environ. Res. Public Health 2016, 13, 341. [Google Scholar] [CrossRef] [PubMed]
- Noh, J.; Sohn, J.; Cho, J.; Cho, S.K.; Choi, Y.J.; Kim, C.; Shin, D.C. Short-term Effects of Ambient Air Pollution on Emergency Department Visits for Asthma: An Assessment of Effect Modification by Prior Allergic Disease History. J. Prev. Med. Public Health 2016, 49, 329–341. [Google Scholar] [CrossRef] [PubMed]
- Wichmann, J.; Voyi, K. Ambient air pollution exposure and respiratory, cardiovascular and cerebrovascular mortality in Cape Town, South Africa: 2001–2006. Int. J. Environ. Res. Public Health 2012, 9, 3978–4016. [Google Scholar] [CrossRef] [PubMed] [Green Version]
- Romieu, I.; Gouveia, N.; Cifuentes, L.A.; de Leon, A.P.; Junger, W.; Vera, J.; Strappa, V.; Hurtado-Díaz, M.; Miranda-Soberanis, V.; Rojas-Bracho, L.; et al. Multicity study of air pollution and mortality in Latin America (the ESCALA study). Res. Rep. Health Eff. Inst. 2012, 171, 5–86. [Google Scholar]
- Peng, R.D.; Chang, H.H.; Bell, M.L.; McDermott, A.; Zeger, S.L.; Samet, J.M.; Dominici, F. Coarse particulate matter air pollution and hospital admissions for cardiovascular and respiratory diseases among Medicare patients. JAMA 2008, 299, 2172–2179. [Google Scholar] [CrossRef] [PubMed]
- Tian, L.; Ho, K.F.; Wang, T.; Qiu, H.; Pun, V.C.; Chan, C.S.; Louie, P.K.; Yu, I.T. Ambient carbon monoxide and the risk of hospitalization due to chronic obstructive pulmonary disease. Am. J. Epidemiol. 2014, 180, 1159–1167. [Google Scholar] [CrossRef] [PubMed]
- Tian, L.; Qiu, H.; Pun, V.C.; Lin, H.; Ge, E.; Chan, J.C.; Louie, P.K.; Ho, K.F.; Yu, I.T. Ambient carbon monoxide associated with reduced risk of hospital admissions for respiratory tract infections. Am. J. Respir. Crit. Care Med. 2013, 188, 1240–1245. [Google Scholar] [CrossRef] [PubMed]
- Tam, W.W.; Wong, T.W.; Ng, L.; Wong, S.Y.; Kung, K.K.; Wong, A.H. Association between air pollution and general outpatient clinic consultations for upper respiratory tract infections in Hong Kong. PLoS ONE 2014, 9, e86913. [Google Scholar] [CrossRef] [PubMed] [Green Version]
- Mehta, A.J.; Schindler, C.; Perez, L.; Probst-Hensch, N.; Schwartz, J.; Brändl, O.; Karrer, W.; Tschopp, J.M.; Rochat, T.; Künzli, N.; et al. Acute respiratory health effects of urban air pollutants in adults with different patterns of underlying respiratory disease. Swiss Med. Wkly. 2012, 142. [Google Scholar] [CrossRef] [PubMed] [Green Version]
- Maclure, M. The case-crossover design: A method for studying transient effects on the risk of acute events. Am. J. Epidemiol. 1991, 133, 144–153. [Google Scholar] [PubMed]
- Guan, W.J.; Zheng, X.Y.; Chung, K.F.; Zhong, N.S. Impact of air pollution on the burden of chronic respiratory diseases in China: Time for urgent action. Lancet 2016, 388, 1939–1951. [Google Scholar] [CrossRef]
- Hetland, R.B.; Cassee, F.R.; Refsnes, M.; Schwarze, P.E.; Låg, M.; Boere, A.J.; Dybing, E. Release of inflammatory cytokines, cell toxicity and apoptosis in epithelial lung cells after exposure to ambient airparticles of different size fractions. Toxicol. In Vitro 2004, 18, 203–212. [Google Scholar] [CrossRef]
- Wu, W.; Samet, J.M.; Ghio, A.J.; Devlin, R.B. Activation of the EGF receptor signaling pathway in airway epithelial cells exposed to Utah Valley PM. Am. J. Physiol. Lung Cell Mol. Physiol. 2001, 281, L483–L489. [Google Scholar] [PubMed]
- Zelikoff, J.T.; Schermerhorn, K.R.; Fang, K.; Cohen, M.D.; Schlesinger, R.B. A role for associated transition metals in the immunotoxicity of inhaled ambient particulate matter. Environ. Health Perspect. 2002, 110 (Suppl. 5), 871–875. [Google Scholar] [CrossRef] [PubMed]
- Costa, D.L.; Dreher, K.L. Bioavailable transition metals in particulate matter mediate cardiopulmonary injury inhealthy and compromisedanimal models. Environ. Health Perspect. 1997, 105 (Suppl. 5), 1053–1060. [Google Scholar] [CrossRef] [PubMed]
- Ogino, K.; Zhang, R.; Takahashi, H.; Takemoto, K.; Kubo, M.; Murakami, I.; Wang, D.H.; Fujikura, Y. Allergic airway inflammation by nasal inoculation of particulate matter (PM2.5) in NC/Nga mice. PLoS ONE 2014, 9, e92710. [Google Scholar] [CrossRef] [PubMed]
- Navidi, W. Bidirectional case-crossover designs for exposures with time trends. Biometrics 1998, 54, 596–605. [Google Scholar] [CrossRef] [PubMed]


| Pollutants | Median | Meteorological Parameters | Median | Outcomes | Median |
|---|---|---|---|---|---|
| PM2.5 (μg/m3) | 66 | PRS-mean (kPa) | 101.24 | URTI (no.) | 96 |
| PM10 (μg/m3) | 101 | T-mean (°C) | 15.5 | AB (no.) | 28 |
| CO (mg/m3) | 1.01 | T-max (°C) | 21.5 | CAP (no.) | 18 |
| NO2 (μg/m3) | 49 | RH-mean (%) | 52 ± 19 * | AECOPD (no.) | 2 |
| SO2 (μg/m3) | 11 | AE-asthma (no.) | 1 | ||
| O3 (μg/m3) | 92 | AEBX (no.) | 3 |
| Pollutants | PM2.5 | PM10 | CO | NO2 | SO2 | O3 |
|---|---|---|---|---|---|---|
| PM2.5 | 1.000 | 0.877 * | 0.852 * | 0.675 * | 0.476 * | −0.073 |
| PM10 | 0.877 * | 1.000 | 0.713 * | 0.735 * | 0.515 * | −0.024 |
| CO | 0.852 * | 0.713 * | 1.000 | 0.748 * | 0.684 * | −0.396 * |
| NO2 | 0.675 * | 0.735 * | 0.748 * | 1.000 | 0.634 * | −0.361 * |
| SO2 | 0.476 * | 0.515 * | 0.684 * | 0.634 * | 1.000 | −0.474 * |
| O3 | −0.073 | −0.024 | −0.396 * | −0.361 * | −0.474 * | 1.000 |
| Outcomes | PM2.5 | PM10 | CO | NO2 | SO2 | O3 |
|---|---|---|---|---|---|---|
| ORs 95% CI | ORs 95% CI | ORs 95% CI | ORs 95% CI | ORs 95% CI | ORs 95% CI | |
| URTI | ||||||
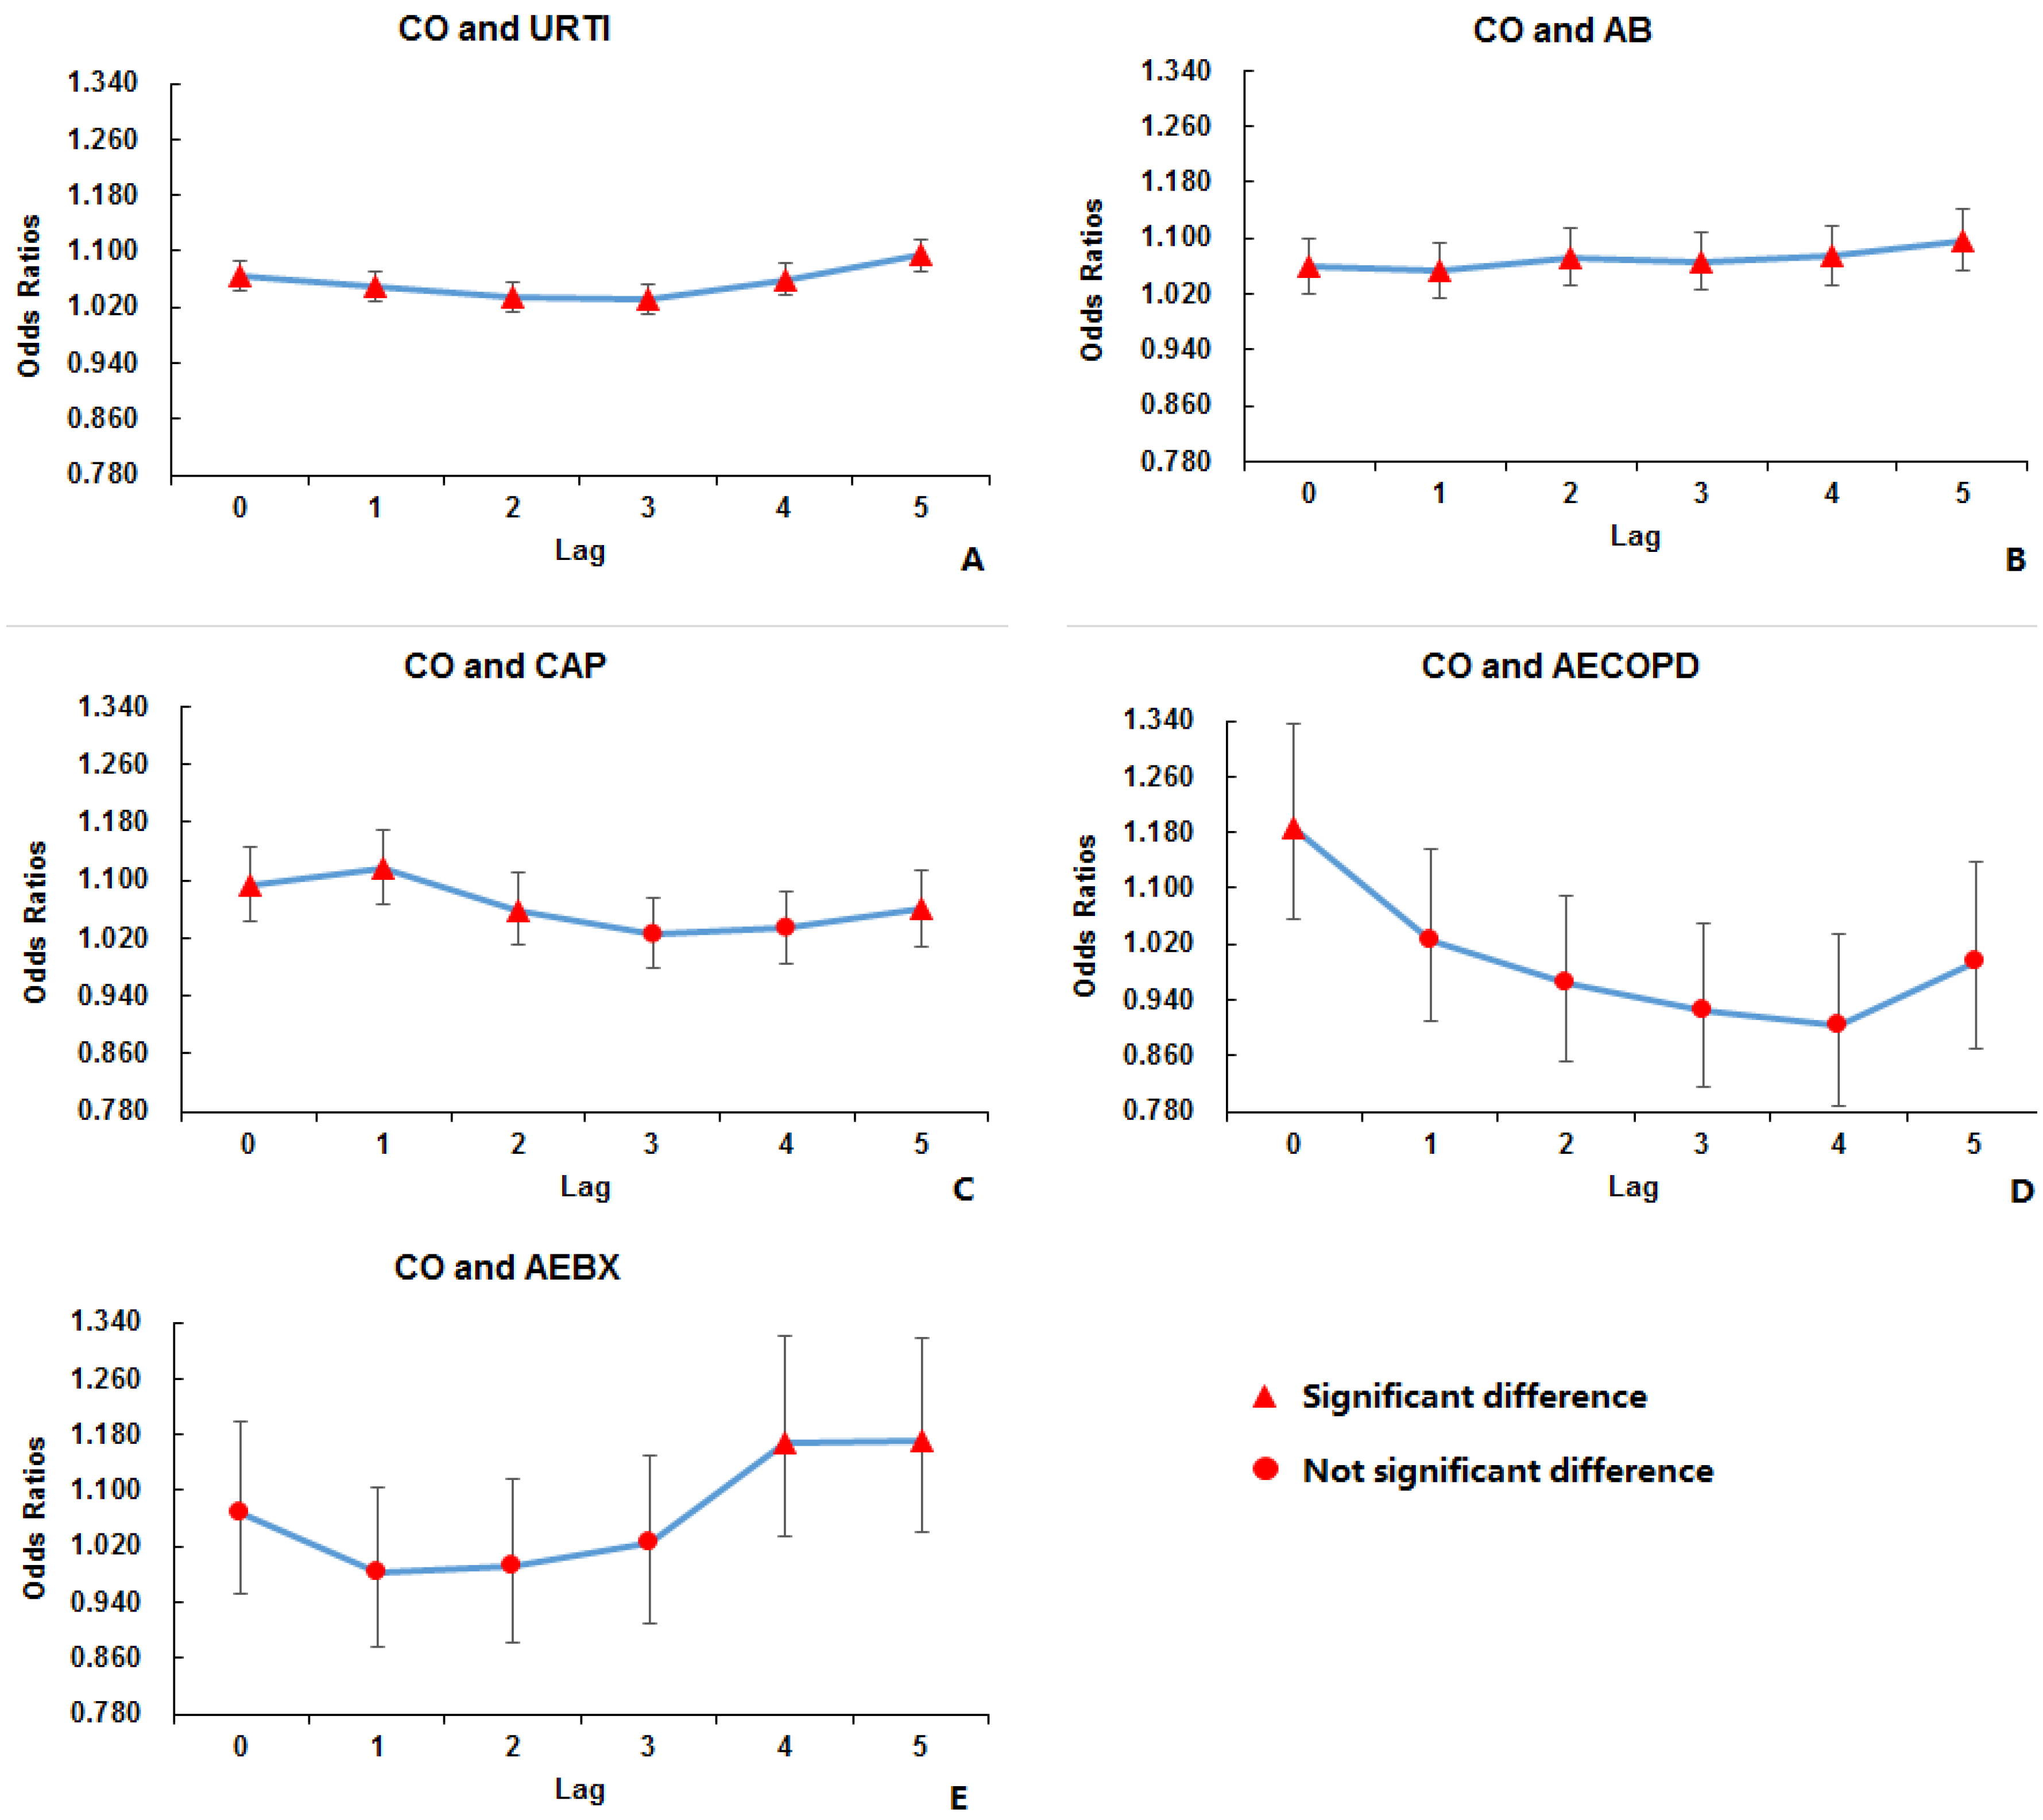
| lag 0 | 1.001 * 1.000–1.001 | 1.001 * 1.000–1.001 | 1.064 * 1.042–1.086 | 1.002 * 1.002–1.003 | 1.003 * 1.002–1.004 | 1.000 1.000–1.000 |
| lag 1 | 1.000 1.000–1.001 | 1.000 1.000–1.001 | 1.049 * 1.028–1.071 | 1.002 * 1.001–1.002 | 1.002 * 1.002–1.003 | 0.999 * 0.999–1.000 |
| lag 2 | 1.000 1.000–1.000 | 1.000 1.000–1.000 | 1.033 * 1.012–1.055 | 1.001 * 1.000–1.001 | 1.001 * 1.001–1.002 | 0.999 * 0.999–0.999 |
| lag 3 | 1.000 1.000–1.001 | 1.000 1.000–1.000 | 1.032 * 1.010–1.054 | 1.001 * 1.001–1.002 | 1.002 * 1.001–1.003 | 1.000 0.999–1.000 |
| lag 4 | 1.001 * 1.000–1.001 | 1.000 1.000–1.001 | 1.060 * 1.037–1.083 | 1.002 * 1.001–1.003 | 1.002 * 1.002–1.003 | 1.000 1.000–1.001 |
| lag 5 | 1.001 * 1.001–1.001 | 1.001 * 1.000–1.001 | 1.095 * 1.071–1.118 | 1.003 * 1.002–1.003 | 1.003 * 1.002–1.004 | 1.000 1.000–1.001 |
| AB | ||||||
| lag 0 | 1.001 * 1.000–1.001 | 1.001 * 1.000–1.001 | 1.059 * 1.020–1.099 | 1.003 * 1.001–1.004 | 1.002 * 1.001–1.004 | 1.000 0.999–1.000 |
| lag 1 | 1.001 * 1.000–1.001 | 1.001 * 1.000–1.001 | 1.053 * 1.014–1.094 | 1.001 1.000–1.003 | 1.002 * 1.001–1.004 | 1.000 0.999–1.001 |
| lag 2 | 1.001 * 1.001–1.002 | 1.001 * 1.000–1.001 | 1.072 * 1.032–1.114 | 1.002 * 1.000–1.003 | 1.003 * 1.001–1.004 | 1.000 0.999–1.000 |
| lag 3 | 1.001 * 1.000–1.001 | 1.001 * 1.000–1.001 | 1.066 * 1.026–1.107 | 1.002 * 1.001–1.004 | 1.004 * 1.002–1.005 | 1.000 0.999–1.000 |
| lag 4 | 1.001 * 1.000–1.001 | 1.001 * 1.000–1.001 | 1.074 * 1.033–1.118 | 1.003 * 1.001–1.004 | 1.003 * 1.002–1.004 | 1.000 0.999–1.001 |
| lag 5 | 1.001 * 1.000–1.001 | 1.001 * 1.000–1.001 | 1.097 * 1.054–1.141 | 1.002 * 1.001–1.004 | 1.003 * 1.001–1.004 | 1.000 0.999–1.000 |
| CAP | ||||||
| lag 0 | 1.001 * 1.000–1.001 | 1.000 1.000–1.001 | 1.093 * 1.044–1.146 | 1.002 * 1.000–1.004 | 1.003 * 1.002–1.005 | 0.999 * 0.998–1.000 |
| lag 1 | 1.001 * 1.000–1.001 | 1.001 * 1.000–1.001 | 1.117 * 1.066–1.170 | 1.003 * 1.001–1.004 | 1.004 * 1.002–1.006 | 0.999 * 0.998–1.000 |
| lag 2 | 1.000 1.000–1.001 | 1.001 * 1.000–1.001 | 1.059 * 1.010–1.111 | 1.002 1.000–1.003 | 1.003 * 1.002–1.005 | 1.000 0.999–1.000 |
| lag 3 | 1.000 1.000–1.001 | 1.000 1.000–1.000 | 1.026 0.978–1.076 | 1.001 0.999–1.003 | 1.003 * 1.001–1.005 | 1.000 0.999–1.000 |
| lag 4 | 1.000 1.000–1.001 | 1.000 1.000–1.001 | 1.033 0.983–1.085 | 1.001 0.999–1.003 | 1.002 * 1.001–1.004 | 0.999 0.999–1.000 |
| lag 5 | 1.001 * 1.000–1.001 | 1.000 1.000–1.001 | 1.060 1.009–1.113 | 1.001 1.000–1.003 | 1.003 * 1.001–1.004 | 1.000 0.999–1.001 |
| AECOPD | ||||||
| lag 0 | 1.001 1.000–1.003 | 1.001 * 1.000–1.003 | 1.188 * 1.056–1.335 | 1.004 1.000–1.008 | 1.005 * 1.001–1.010 | 1.002 1.000–1.004 |
| lag 1 | 1.001 0.999–1.002 | 1.000 0.999–1.002 | 1.025 0.910–1.155 | 1.001 0.997–1.005 | 1.002 0.997–1.007 | 1.000 0.998–1.002 |
| lag 2 | 1.001 0.999–1.002 | 1.000 0.998–1.001 | 0.963 0.851–1.090 | 0.999 0.994–1.003 | 1.000 0.995–1.005 | 1.000 0.998–1.002 |
| lag 3 | 1.000 0.998–1.001 | 0.999 * 0.997–1.000 | 0.924 0.814–1.049 | 0.998 0.994–1.003 | 0.998 0.993–1.002 | 0.999 0.997–1.001 |
| lag 4 | 0.999 0.998–1.001 | 1.000 0.998–1.001 | 0.903 0.789–1.033 | 0.998 0.994–1.003 | 0.998 0.994–1.003 | 0.999 0.998–1.001 |
| lag 5 | 1.000 0.998–1.001 | 1.000 0.999–1.001 | 0.996 0.871–1.139 | 1.000 0.996–1.004 | 1.000 0.995–1.005 | 1.000 0.998–1.002 |
| AE-asthma | ||||||
| lag 0 | 1.001 0.999–1.003 | 1.000 0.998–1.002 | 1.013 0.848–1.209 | 1.000 0.994–1.006 | 1.000 0.993–1.006 | 1.000 0.997–1.003 |
| lag 1 | 1.001 0.999–1.003 | 1.000 0.999–1.002 | 1.147 0.956–1.375 | 1.005 0.999–1.011 | 1.004 0.997–1.010 | 1.000 0.997–1.003 |
| lag 2 | 0.999 0.997–1.001 | 0.999 0.997–1.001 | 0.944 0.790–1.128 | 0.998 0.991–1.004 | 0.998 0.991–1.005 | 1.001 0.998–1.004 |
| lag 3 | 0.998 0.995–1.000 | 0.999 0.997–1.001 | 0.872 0.725–1.047 | 0.996 0.990–1.003 | 1.000 0.993–1.006 | 1.001 0.999–1.004 |
| lag 4 | 0.999 0.996–1.001 | 0.999 0.997–1.001 | 0.899 0.742–1.089 | 0.994 0.988–1.001 | 0.999 0.993–1.006 | 1.004 *1.001–1.007 |
| lag 5 | 1.000 0.998–1.002 | 1.0000.998–1.002 | 1.047 0.868–1.261 | 1.001 0.995–1.007 | 1.001 0.995–1.008 | 1.001 0.998–1.004 |
| AEBX | ||||||
| lag 0 | 1.000 0.998–1.001 | 1.000 0.999–1.001 | 1.069 0.952–1.199 | 1.000 0.996–1.004 | 1.002 0.997–1.006 | 0.999 0.997–1.000 |
| lag 1 | 0.999 0.998–1.000 | 1.000 0.999–1.001 | 0.983 0.876–1.103 | 0.998 0.994–1.002 | 1.000 0.996–1.004 | 0.998 * 0.996–1.000 |
| lag 2 | 0.999 0.998–1.000 | 0.999 0.998–1.000 | 0.993 0.881–1.118 | 0.998 0.994–1.002 | 1.000 0.995–1.004 | 0.999 0.997–1.000 |
| lag 3 | 1.000 0.998–1.001 | 0.999 0.998–1.001 | 1.024 0.911–1.150 | 0.999 0.995–1.003 | 1.000 0.996–1.004 | 0.998 * 0.996–1.000 |
| lag 4 | 1.001 1.000–1.003 | 1.001 1.000–1.002 | 1.169 * 1.035–1.320 | 1.006 * 1.002–1.010 | 1.005 * 1.001–1.010 | 0.999 0.997–1.001 |
| lag 5 | 1.001 * 1.000–1.003 | 1.001 * 1.000–1.003 | 1.170 * 1.039–1.318 | 1.003 0.999–1.007 | 1.004 0.999–1.008 | 1.000 0.999–1.002 |
© 2017 by the authors; licensee MDPI, Basel, Switzerland. This article is an open access article distributed under the terms and conditions of the Creative Commons Attribution (CC-BY) license (http://creativecommons.org/licenses/by/4.0/).
Share and Cite
Li, R.; Jiang, N.; Liu, Q.; Huang, J.; Guo, X.; Liu, F.; Gao, Z. Impact of Air Pollutants on Outpatient Visits for Acute Respiratory Outcomes. Int. J. Environ. Res. Public Health 2017, 14, 47. https://doi.org/10.3390/ijerph14010047
Li R, Jiang N, Liu Q, Huang J, Guo X, Liu F, Gao Z. Impact of Air Pollutants on Outpatient Visits for Acute Respiratory Outcomes. International Journal of Environmental Research and Public Health. 2017; 14(1):47. https://doi.org/10.3390/ijerph14010047
Chicago/Turabian StyleLi, Ran, Ning Jiang, Qichen Liu, Jing Huang, Xinbiao Guo, Fan Liu, and Zhancheng Gao. 2017. "Impact of Air Pollutants on Outpatient Visits for Acute Respiratory Outcomes" International Journal of Environmental Research and Public Health 14, no. 1: 47. https://doi.org/10.3390/ijerph14010047