Article

Evaluation of Potential Average Daily Doses (ADDs) of PM2.5 for Homemakers Conducting Pan-Frying Inside Ordinary Homes under Four Ventilation Conditions

Department of Environmental Health Sciences, Soonchunhyang University, Asan 31538, Korea
*
Author to whom correspondence should be addressed.
Int. J. Environ. Res. Public Health 2017, 14(1), 78; https://doi.org/10.3390/ijerph14010078
Submission received: 19 September 2016 / Revised: 21 December 2016 / Accepted: 6 January 2017 / Published: 13 January 2017
(This article belongs to the Section Global Health)

Abstract

:
Several studies reported that commercial barbecue restaurants likely contribute to the indoor emission of particulate matters with a diameter of 2.5 micrometers or less (PM2.5) while pan-frying meat. However, there is inadequate knowledge of exposure level to indoor PM2.5 in homes and the contribution of a typical indoor pan-frying event. We measured the indoor PM2.5 concentration and, using Monte-Carlo simulation, estimated potential average daily dose (ADD) of PM2.5 for homemakers pan-frying a piece of pork inside ordinary homes. Convenience-based sampling at 13 homes was conducted over four consecutive days in June 2013 (n = 52). Although we pan-fried 100 g pork for only 9 min, the median (interquartile range, IQR) value was 4.5 (2.2–5.6) mg/m3 for no ventilation and 0.5 (0.1–1.3) mg/m3 with an active stove hood ventilation system over a 2 h sampling interval. The probabilities that the ADDs from inhalation of indoor PM2.5 would be higher than the ADD from inhalation of PM2.5 on an outdoor roadside (4.6 μg/kg·day) were 99.44%, 97.51%, 93.64%, and 67.23%, depending on the ventilation conditions: (1) no window open; (2) one window open in the kitchen; (3) two windows open, one each in the kitchen and living room; and (4) operating a forced-air stove hood, respectively.

1. Introduction

According to statistics reported in 2013, the number of deaths in South Korea due to cancer was 149 per 100,000: 34 from lung cancer, 22.6 from liver cancer, 18.2 from stomach cancer, and 74.2 from other cancers [1]. Yu et al. reported in 2006 that exposure to indoor toxic compounds emitted during cooking activity at home was likely a risk factor increasing the incidence of lung cancer among nonsmoking women [2]. Particulate matters with a diameter of 2.5 micrometers or less PM2.5 particles emitted during pan-frying can be harmful to human health due to their relatively small size and corresponding ability to penetrate deep into the lungs and enter the blood stream unfiltered. The results of many studies have indicated that PM2.5, particulate matter with an aerodynamic diameter equal to or smaller than 2.5 μm, could be produced during cooking activities [3,4,5,6], and it has been reported that acute reduction of lung function was associated with exposure to PM2.5 during cooking activities [7,8]. In 2010, the International Agency for Research on Cancer (IARC), a specialized cancer agency of the World Health Organization (WHO), reported that emissions from high-temperature frying are probably carcinogenic to humans (Group 2A) although there is limited evidence in humans for the carcinogenicity of emissions from high-temperature frying. However, there is sufficient evidence in experimental animals for the carcinogenicity of emissions from high-temperature unrefined rapeseed oil [9]. Therefore, cooking related indoor PM2.5 levels should be carefully monitored due to their potential harmful characteristics, as we described above.
According to a report from the Ministry of Environment of South Korea [10], the amount of PM2.5 produced by pan-frying meats was 3022 tons/year, assuming a meat consumption rate of 31.3 kg/year per person. Because pan-fried pork belly is a popular dish among Koreans at home [11], it is probable that homemakers are exposed to high levels of PM2.5 emitted during the pork pan-frying process. They are also potentially exposed to secondary particles formed by combination of chemicals derived from the oxidation of primary gases produced during pan-frying.
Many researchers have reported that commercial barbecue restaurants likely contribute to the emission of toxic chemicals and PM2.5 into indoor and outdoor air during the commercial food pan-frying or pan-frying process [12]. According to a recent report in South Korea, PM2.5 emitted from commercial restaurants serving barbecue accounted for 8.7% of all the PM2.5 produced in Gyeonggi Province [13]. However, information on the indoor PM2.5 concentration in homes contributed to by residential pan-frying, and the degree of PM2.5 reduction related to the ventilation conditions prevalent in homes, is insufficient.
We conducted this study to evaluate the potential indoor exposure and average daily dose of homemakers to PM2.5 generated during pan-frying meat in ordinary South Korean homes. To this end, four different arrangements of ventilation were simulated.

2. Materials and Methods
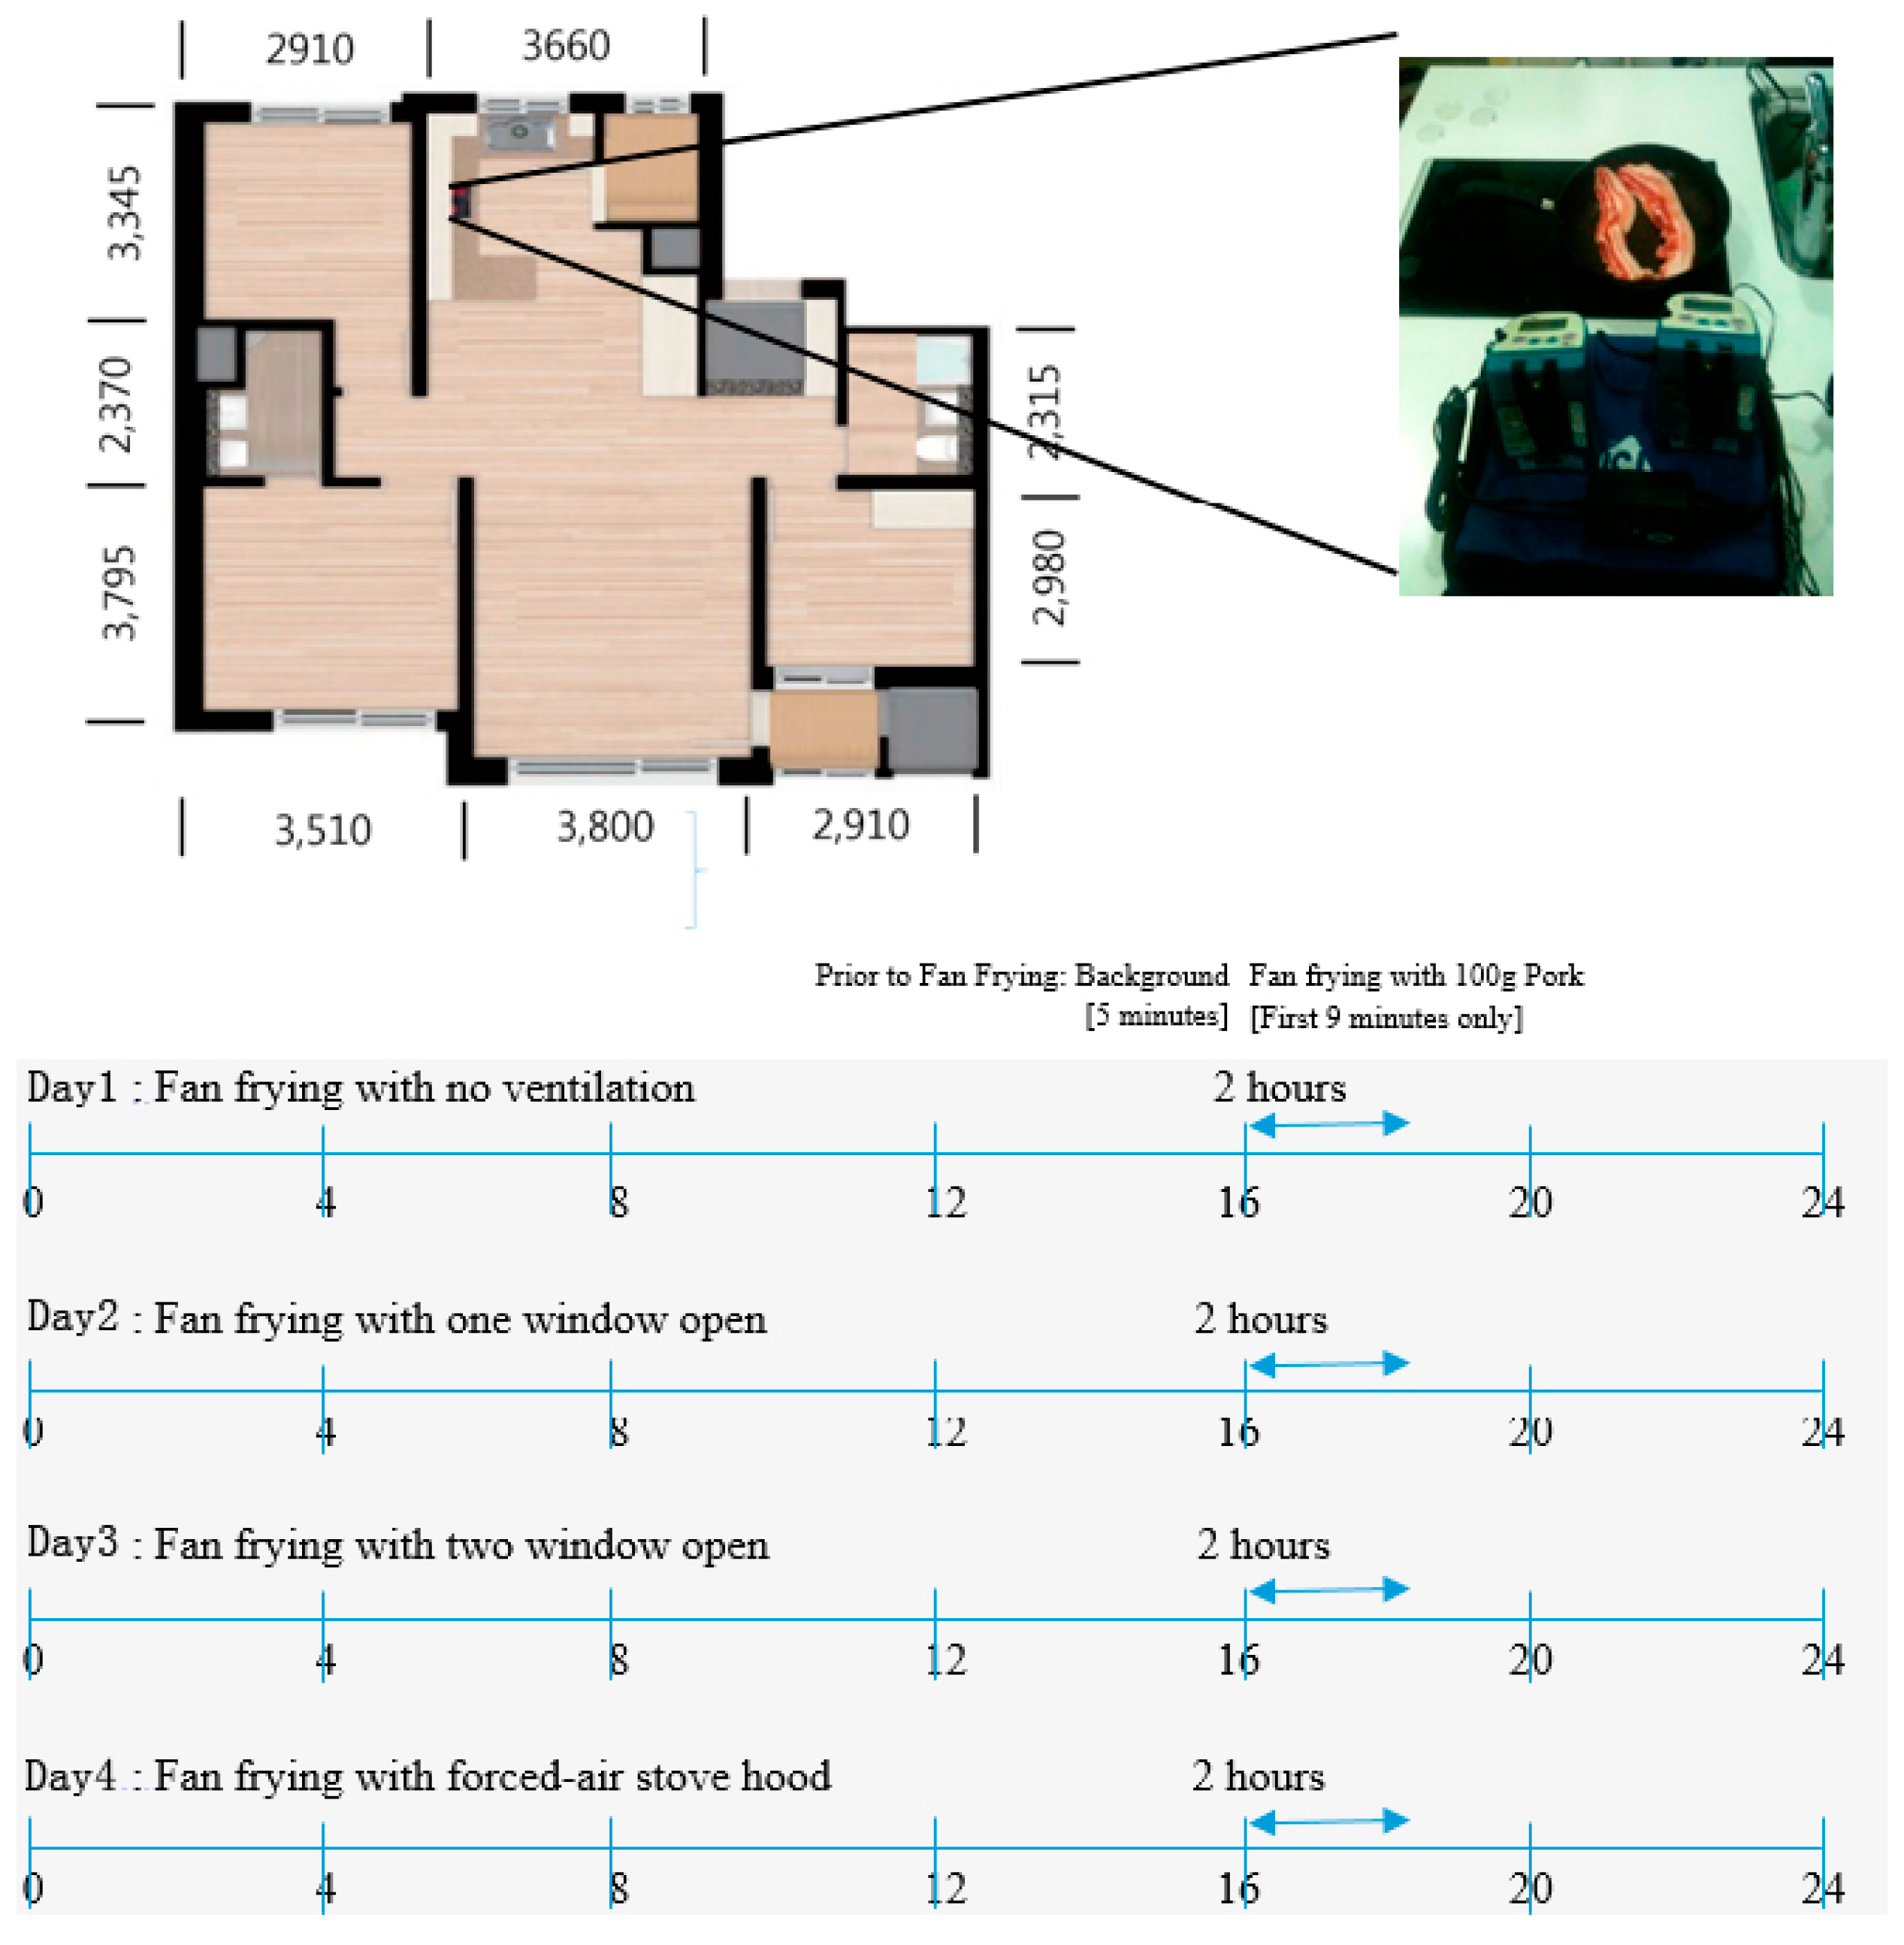
2.1. Sampling Sites

Convenience-based sampling in 13 homes (six single houses, six apartments, and one multiunit) was conducted over four consecutive days to measure the indoor PM2.5 concentration levels. Our experiments (n = 52) were conducted from June to December 2013 in Cheonan and Seoul, South Korea.
The total floor area of these homes ranged from 52.8 to 112.2 m2 and the approximate height from floor to ceiling was 2.5 m or less in each home. We conducted four measurements per house per day. During our experiments, operating a fan or air conditioning system was not allowed. For one day before the experiment in each home, pan-frying other meats or fishes was not allowed by our monitoring agents. Characteristics of our sampling sites are summarized in Table 1.

2.2. Pan-Frying Process and Ventilation Conditions Applied

Our experiments were done by simulating the barbequing of pork belly (100 g) for 9 min over a 2-h measurement period per trial under four different ventilation conditions. With our pre-established standard operating protocol, a portion of pork belly (100 g) was pan-fried for 9 min: 3 min on Side A, 3 min on Side B; then 1.5 min for Side A again, and a final 1.5 min for Side B again. We used the same nonstick pans for every experiment without cooking oil. Pan-frying in all houses was done with their gas-ranges using natural gas (41.0–44.4 MJ/Nm3) supplied by our national distributor, Korea Gas Corporation [14].
The ventilation conditions were as follows: (1) No windows open; (2) one window, of size 0.5 ± 0.28 m2, open in the kitchen was selected as the simplest natural ventilation method, where no forced-air stove-hood operation system is available; (3) two windows open, both in the kitchen and the living room (window size on the opposite side of the kitchen, 2.3 ± 0.20 m2), likely increasing natural ventilation by allowing air circulation and expelling it from both ends (kitchen and living room); and (4) forced-air stove-hood operating during the entire pan-frying process. All households had a gas-range hood and windows, and no other windows were opened during the experiment. Floor area (5.3–11.2 m2) of the kitchen was approximately 10% of entire floor area (52.8–112 m2) and no separation door existed between the kitchen and living room of any of the houses (Figure 1).
To avoid the carry-over effect of PM2.5 concentrations between simulations and to minimize the effect of non-target sources contributing to our PM2.5 measurement results [15], we took measurements of the background PM2.5 concentrations inside the kitchen and outside the kitchen window for five minutes before and after conducting our experiments. Later, we subtracted the indoor background concentration from our indoor values.

2.3. PM2.5 Measurement

We used real-time PM2.5 monitors (Sidepak, TSI, Shoreview, MN, USA) to measure the indoor PM2.5 levels (flow rate 1.7 L/min) as a stationary sampler. Every day prior to PM2.5 monitoring, we performed zero calibration and checked the flow rate [16]. Our monitor was 50 cm from the stove hood fan and 1 m above the kitchen floor. We used two Sidepaks for each experiment. We applied 0.65 as a Sidepak correction factor of PM2.5 concentrations over the pork pan-frying process according to the previous study results, reporting real-time particle monitor calibration factors for multiple indoor emission sources by comparing the outcome of real-time laser photometers, including Sidepak, and a filter-based PM2.5 gravimetric sampler to quantify the monitor calibration factors (CFs) [17]. We kept a minimum distance of 50 cm between the two Sidepaks. The final distributions of PM2.5 concentrations, according to four ventilation conditions, were obtained from the 13 PM2.5 median concentration values for 13 sampling sites. At each pan-frying trail, we took a PM2.5 concentration value every 1 min over a 2 h sampling period.

2.4. Average Daily Dose

The PM2.5 doses inhaled by housewives on monitoring days, under four different ventilation conditions, was determined using Equation (1), adopted from the average daily dose calculation handbook [18] of U.S. Environmental Protection Agency (EPA), as well as from the Korean exposure handbook [19].
ADD   ( mg / kg · day ) = C × IR × ET BW × AT × 1000
C: Arithmetic mean concentration of the PM2.5 (mg/m3); IR: inhalation rate (L/min); BW: body weight (kg); ET: exposure time (min); AT: average time (days).
ADD is the average daily dose (milligrams per kilogram per day, mg/kg·day) by inhalation. Here, C is the average value of the 13 median PM2.5 concentrations from pan-frying pork (mg/m3) measured over a 2 h period in houses. IR is the estimated air inhalation rate (L/min) and BW, ET, and AT are the estimated body weight (kg), exposure time (min), and average time (days) for housewives, respectively [20]. The PM2.5 ADD by inhalation obtained for housewives on monitoring days, with different ventilation conditions, was compared with their estimated PM2.5 ADD by inhalation of roadside PM2.5 levels.
According to the Korean exposure handbook [19], we applied the inhalation rate 10.9 ± 3.8 L/min for adult women (average body weight 56.4 ± 7.81 kg) assuming pan-frying pork at home once a week for 35 years (until their retirement at the age of 60 years). We also assumed that the pork pan-frying related cooking time was 65 min [21]. For the comparison purposes, we used the 24-h outdoor PM2.5 standard (0.05 mg/m3) from the Korea National Ambient Air Quality scale [22]. For this comparison, we assumed that the women worked outside and they were exposed to roadside PM2.5 for 8 h/day (daytime) and 40 h/week for 35 years (until their retirement at the age of 60 years). For calculation of ADD by inhalation of roadside PM2.5, we applied the same inhalation rate (10.9 ± 3.8 L/min) for women working outside, near roadsides [19]. Under assumptions of 8 h working time outside for 7 days over 35 years, we obtained 4.6 mg/kg·day.

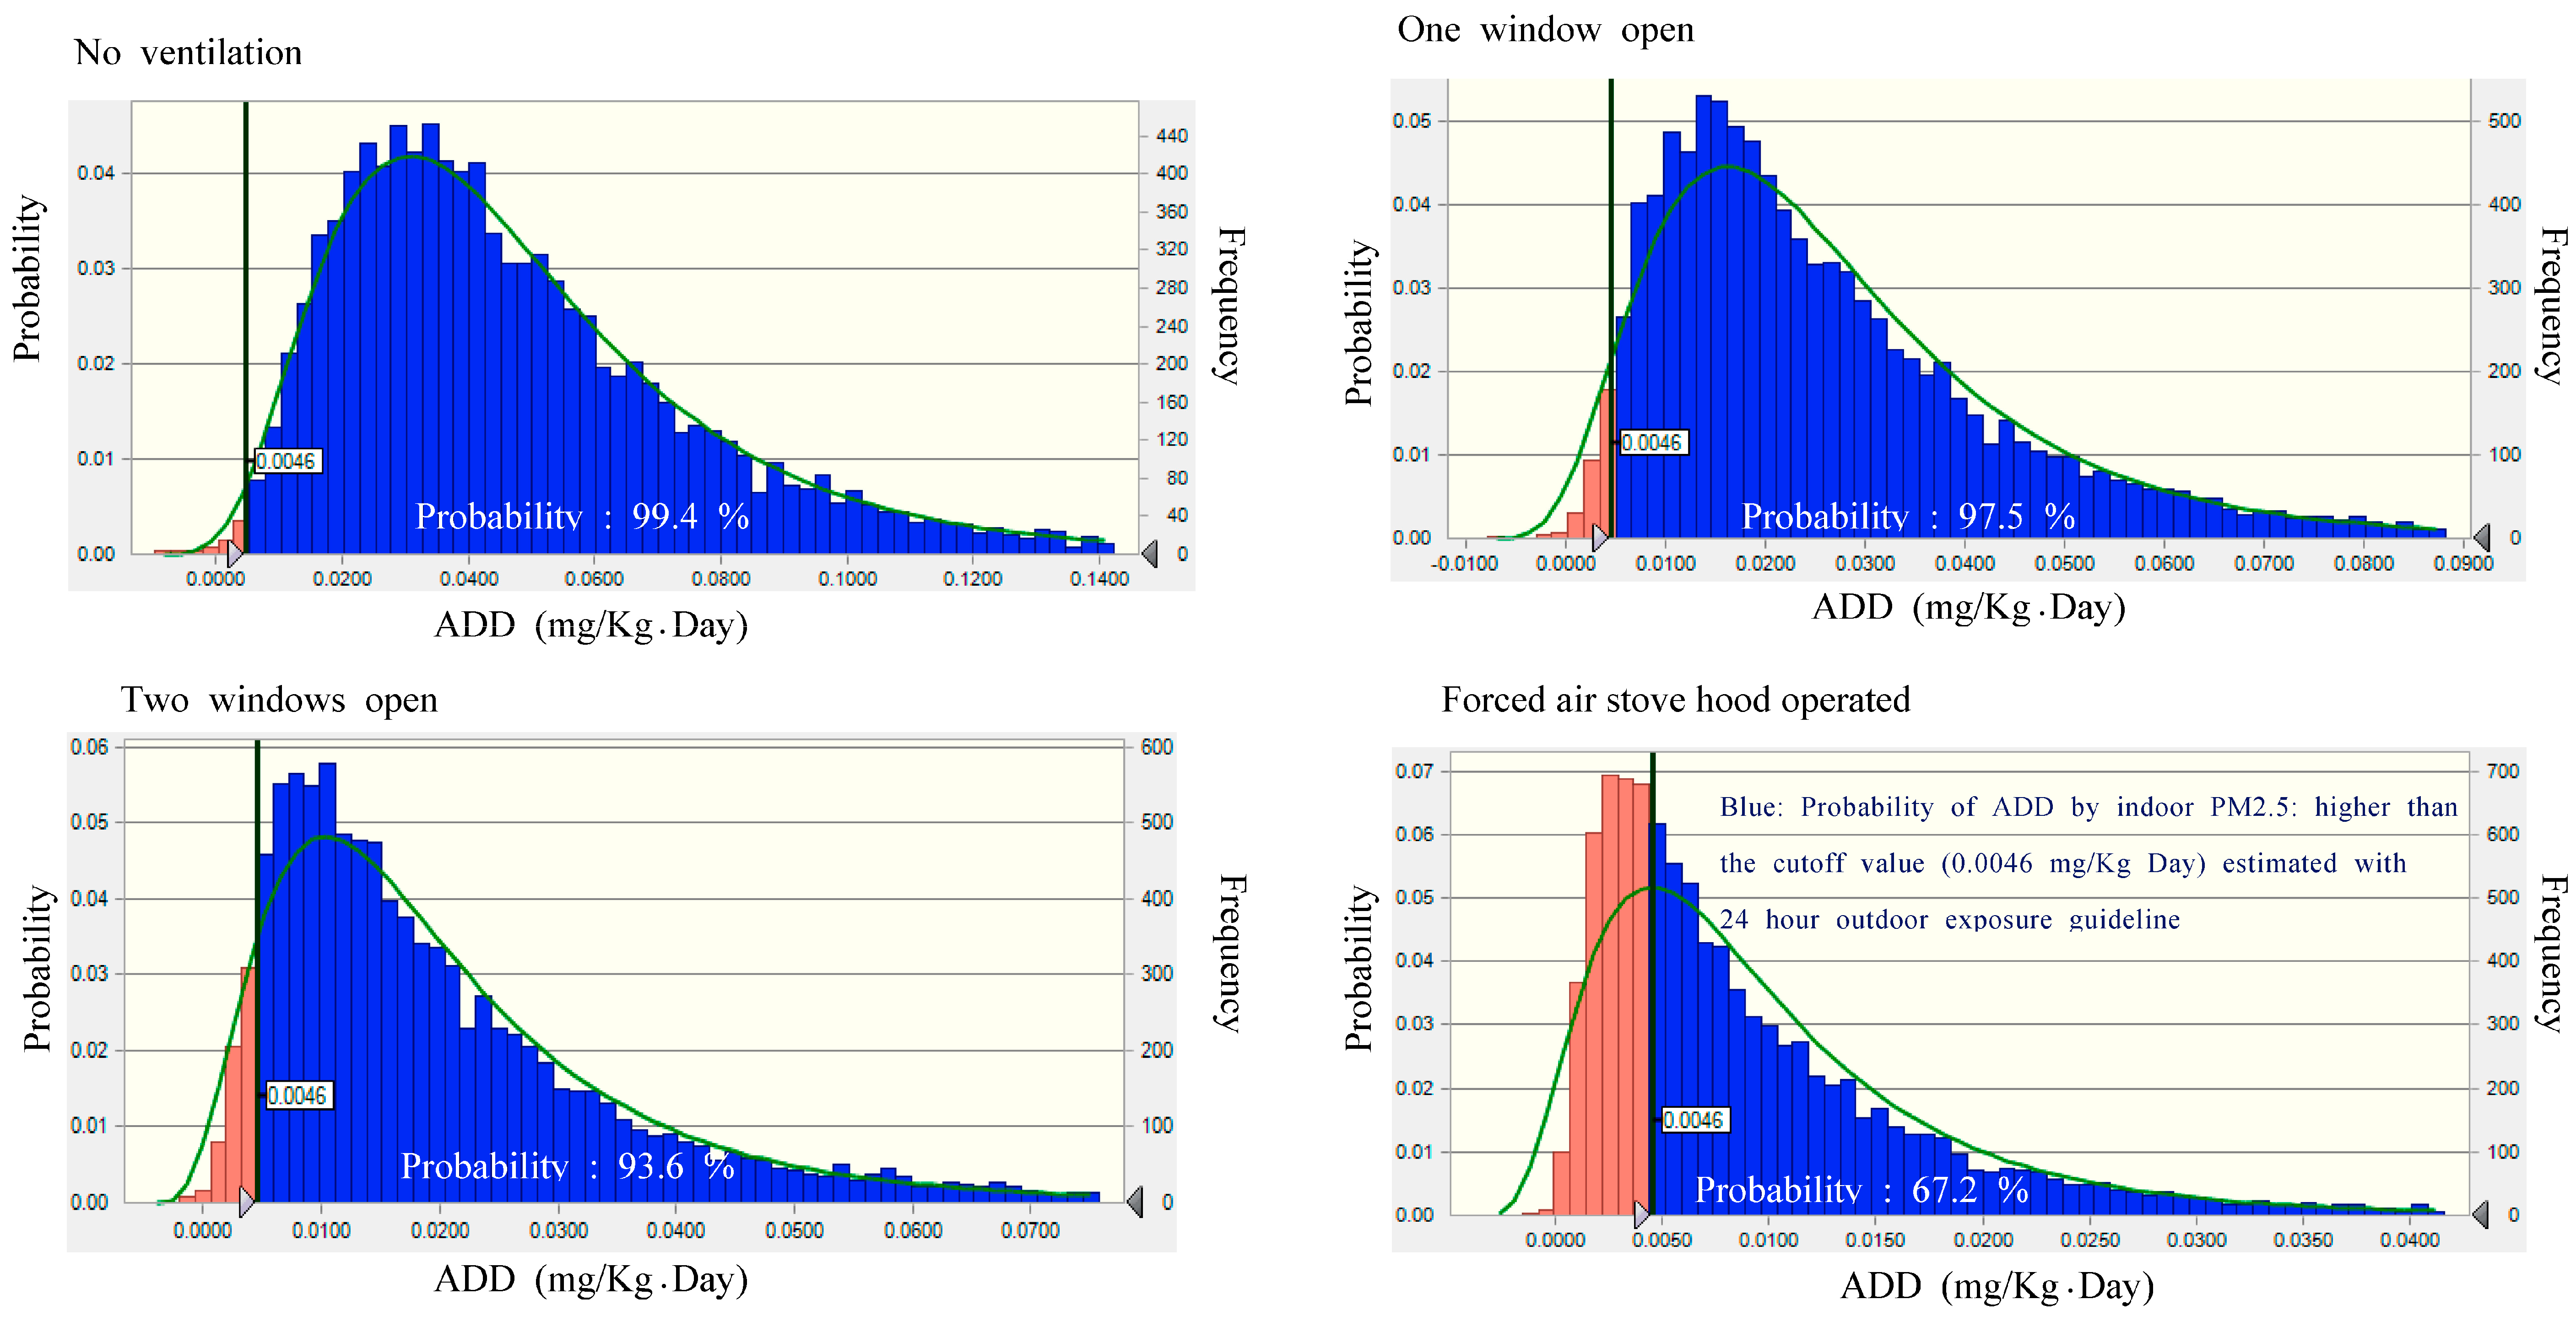
2.5. Probabilistic Modeling: ADD Distribution by Monte-Carlo Simulation

Using a Monte-Carlo simulation with Crystal Ball (version 11, Oracle, Redwood Shores, CA, USA), we compared probabilistic distributions of ADDs for inhalation of indoor as well as outdoor PM2.5 particles for homemakers. For this simulation, we assumed that indoor or outdoor PM2.5 concentrations were log-normally distributed while the distributions of body weight and inhalation rate were normal and that of exposure duration was a constant value. To obtain the probabilistic distribution, we repeated the simulation procedure 10,000 times.

2.6. Statistical Analysis

The distributions of indoor PM2.5 concentrations under each different ventilation condition was compared with the results obtained with no ventilation using the Wilcoxon rank-sum test.

3. Results

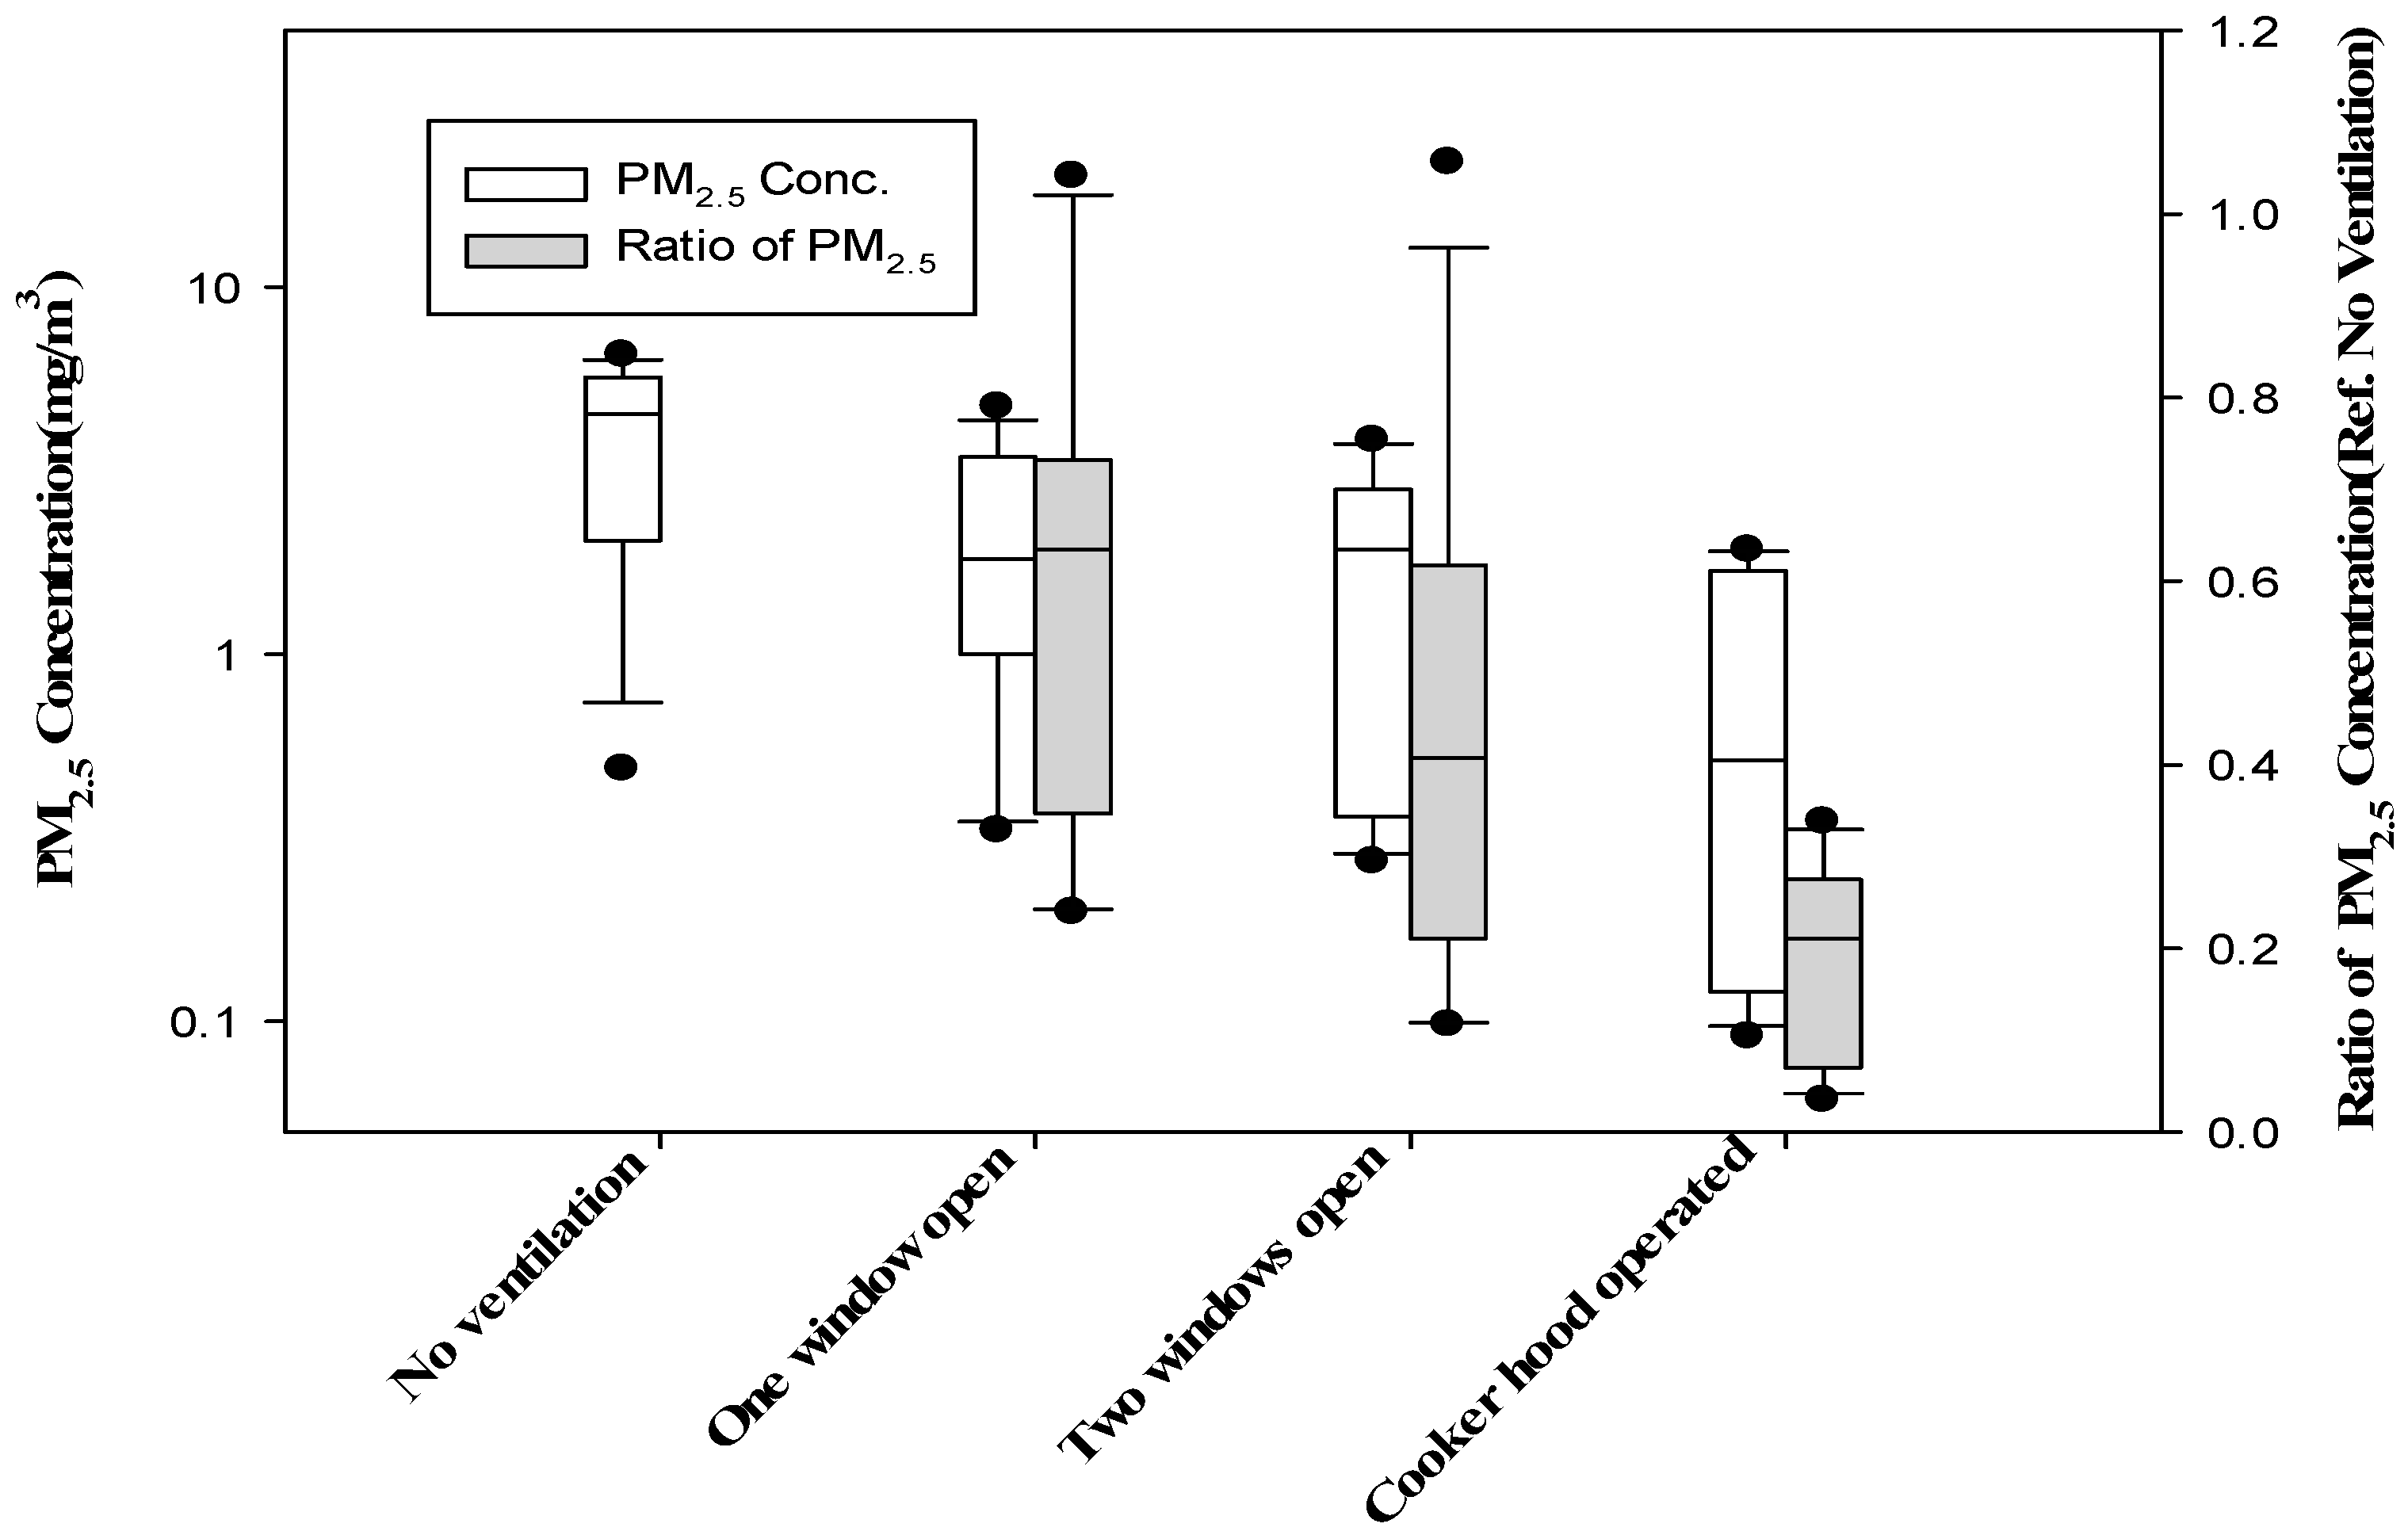
3.1. Indoor PM2.5 Levels According to Ventilation Conditions

We obtained different median (interquartile range, IQR) PM2.5 concentrations (n = 13 per each ventilation scenario), over a 2 h sampling period, in relation to the different ventilation conditions: 4.5 (2.2–5.6) mg/m3 for no ventilation, 1.8 (1.4–3.3) mg/m3 or 1.9 (0.4–2.5) mg/m3 for one or two windows open, and 0.5 (0.1–1.3) mg/m3 with the forced-air stove hood ventilator operating (Table 2). In detail, the median (IQR) concentrations of indoor PM2.5 during the first 9 min fan-prying period were 5.1 (3.0–9.2), 5.0 (1.7–7.0), 3.8 (1.3–6.2), and 1.16 (0.2–2.3) mg/m3, respectively. The corresponding dissipation kinetics after cooking was completed were 38.2 (26.6–79.4), 47.4 (17.0–84.6), 54.7 (20.1–99.9) and 55.2 (6.5–78.7) μg/m3 (Table 3).
The median (interquartile range) of the ratio of PM2.5 concentrations with one or two windows open, or with cooker stove hood operating; to the concentrations without ventilation, for each paired observation for each home were 0.63 (0.40–0.69), 0.41 (0.23–0.56), or 0.17 (0.08–0.25), respectively (Figure 2).

3.2. Average Daily Dose (ADD) of Homemakers

On the basis of the arithmetic mean values of the PM2.5 concentrations observed during pork pan-frying, under the ventilation conditions and exposure scenario mentioned above, we obtained average daily PM2.5 doses of 48.1, 27.4, 21.2 and 10.0 μg/kg·day, respectively, while the dose from roadside PM2.5 was 4.6 μg/kg·day. Also, the median (IQR) value of ADD by inhalation of indoor PM2.5 due to exposure to the pan-frying process, from our Monte-Carlo simulation, was 41.7 (26.9–62.8), 22.1 (13.8–35.3), 16.4 (9.6–27.6) and 7.0 (3.8–12.7), according to the corresponding ventilation condition, separately (Table 2). The probabilities that the ADDs from inhalation of indoor PM2.5 would be higher than the ADD by inhalation of outdoor roadside PM2.5 (4.6 μg/kg·day) were 99.4%, 97.5%, 93.6% and 67.2%, depending on the ventilation conditions (no ventilation, one window open, two windows open, stove hood operating, respectively) (Figure 3).

4. Discussion

Our study indicated that the levels of indoor PM2.5 due to pan-frying in home kitchens were significantly high. Even though we pan-fried 100 g pork for only 9 min, the median values of PM2.5 levels were 4.5 mg/m3 for no ventilation and 0.5 mg/m3 with operation of the forced-air stove hood ventilation system with a 2 h interval were approximately 10 to 90 times higher than the 24-h outdoor PM2.5 standard (0.05 mg/m3) from the Korea National Ambient Air Quality recommendations [22]. We used the Korean NAAQS as a reference for comparison because we do not have specific standards for indoor PM2.5 levels. Our findings indicate that the pork pan-frying process contributes substantially to indoor PM2.5 concentration levels at the ordinary Korean house and that this exposure is particularly elevated when ventilation is not available.
Our study results are supported by those of previous studies characterizing indoor PM exposure levels at Korean style barbeque restaurant. According to Lee et al. (2001) [23], the average levels of PM2.5 at the Korean barbecue style restaurant in Hong Kong were as high as 1.17 mg/m3, respectively. The level obtained in Hong Kong was similar to our study results (1.8 mg/m3: one window open, 1.9 mg/m3: two windows open, 0.5 mg/m3: forced air stove hood applied). Another Chinese study reported that personal exposure level to PM2.5 from burning biomass ranged from 0.136 to 0.162 mg/m3 [24].
Our median value (0.5 mg/m3) of PM2.5 concentrations, even with the best ventilation (i.e., operating a stove hood), was approximately 2–3 times higher than the value obtained from the Chinese study above [24], or the value (0.15 mg/m3) obtained from a casino [8], similar to the level obtained from the smoking areas (0.1 to 0.98 mg/m3) in computer game rooms or night clubs [25]. Because our PM2.5 results were obtained from sampling of stationary bases, rather than from personal monitoring, further exploration of the basis for the differences in distributions of PM2.5 levels between our study and their studies is limited. Nevertheless, our study revealed the potential for high levels of exposure to PM2.5 concentrations during pan-frying meat in ordinary households, especially in unventilated kitchens.
This study has some limitations. First, the sample size of our study was not large and we recruited the study homes at two cities, Seoul and Cheonan. Since Seoul and Cheonan are both highly urbanized areas, we assumed that the life patterns of people in the two cities were not different and there was no systemic difference in terms of cooking methods. The outcomes of the Monte Carlo simulation, which can provide the estimation of the probabilistic distribution of the ADDs of PM2.5 for the young, female Korean population, should be interpreted with care since we estimated the ADDs according to the Korean exposure handbook [19] and we applied the inhalation rate 10.9 ± 3.8 L/min for female, adult Korean women (average body weight 56.4 ± 7.81 kg) assuming that they pan-fry pork at home once a week for 35 years (until their retirement at the age of 60 years). Because we randomly selected 13 homes (four measurements per home) of typical house types (i.e., one multi-unit house, six single houses and six apartments) for young adult couples found in South Korea, the distributions of the concentrations should not be systematically biased. According to statistics from Korea [26], it has been reported that 47% of Koreans live in apartments while the rest of the population live in single or multi-unit houses. In our study, 46% of results were conducted in apartments (24 results from apartments, 24 results from single-units, and 4 results from a multi-unit house). Nevertheless, generalization of our study outcomes to other study populations may be limited. Second, because we conducted stationary monitoring in kitchens over a 2-h interval to determine a daily peak level, rather than 24-h personal sampling, we could not provide personal exposure levels. Third, we could not measure air exchange or ventilation rate because of limitations in our time and funding. The concentrations observed in the first 4 sites and those observed in the last 9 sites seem to differ. This may be due to the increased air exchange rates in the first 4 sites. In future research, measurement of the ventilation and/or air exchange rates would improve the interpretation of the effects of open windows on indoor PM2.5 levels. Nevertheless, to our knowledge, this study is the first study to provide the average daily dose by inhalation of indoor PM2.5 during pork pan frying and to evaluate quantitatively the effectiveness of ventilation in Korean residential kitchens while pan-frying meat.

5. Conclusions

Our study provided quantitative evidence that, in South Korea, the probability of having high ADD due to exposure to indoor PM2.5 during the pan-frying process is likely to be reduced by half with a forced-air stove hood at home. Ventilation through a window has a relatively minor impact on daily exposure. Operating a forced-air stove hood system is highly recommended for protecting homemakers from high PM2.5 exposure levels during the pan-frying process in South Korean homes.

Acknowledgments

The authors deeply appreciate the assistance of the 13 homemakers who opened their homes to us over four consecutive days for our study. This study was funded by Environmental Health Research Center Project (2016001360002) by Korea Environmental Industry & Technology Institute, Ministry of Environment, South Korea.

Author Contributions

Sungroul Kim designed this study and conducted interpretation of the quantitative aspects of data analysis. Seonyeob Lee performed modeling simulation and Sol Yu provided editorial efforts. Sungroul Kim supervised the whole study.

Conflicts of Interest

The authors declare no conflict of interest.

References

  1. Statistics Korea. The Cause of Death Statistics 2013. Available online: http://kostat.go.kr/portal/korea/kor_nw/2/1/index.board?bmode=read&aSeq=330181 (accessed on 16 February 2015).
  2. Yu, I.T.S.; Chiu, Y.L.; Au, J.S.K.; Wong, T.W.; Tang, J.L. Dose-response relationship between cooking fumes exposures and lung cancer among Chinese nonsmoking women. Cancer Res. 2006, 66, 4961–4967. [Google Scholar] [CrossRef] [PubMed]
  3. Abt, E.; Suh, H.H.; Allen, G.; Petros, K. Characterization of Indoor Particle Sources: A Study Conducted in the Metropolitan Boston Area. Environ. Health Perspect. 2000, 108, 35–44. [Google Scholar] [CrossRef] [PubMed]
  4. Long, C.M.; Suh, H.H.; Koutrakis, P. Characterization of Indoor Particle Sources Using Continuous Mass and Size Monitors. J. Air Waste Manag. Assoc. 2000, 50, 1236–1250. [Google Scholar] [CrossRef] [PubMed]
  5. Lee, J.B.; Kim, H.J.; Jung, K.; Kim, S.D. Emission Characteristics of Particulate Matters from Under-fired Charbroiling Cooking Process using the Hood Method. J. Environ. Health Sci. 2009, 35, 315–321. [Google Scholar] [CrossRef]
  6. Rim, D.; Wallace, L.A.; Nabinger, S.; Persily, A. Reduction of exposure to ultrafine particles by kitchen exhaust hoods: The effects of varying flow rates, particle size, and burner position. Sci. Total Environ. 2012, 432, 350–356. [Google Scholar] [CrossRef] [PubMed]
  7. Jarvis, D.; Chinn, S.; Luczynska, C.; Burney, P. Association of respiratory symptoms and lung function in young adults with use of domestic gas appliances. Lancet 1996, 347, 426–431. [Google Scholar] [CrossRef]
  8. Travers, M.J. Casino Air Monitoring Study East Saint Louis, Illinois. Available online: htp://tobaccofreeair.org/documents/IllinoisCasinoAirMonitoringReport.pdf (accessed on 15 May 2015).
  9. IARC. HIGH-TEMPERATURE FRYING, Leon, France. Available online: http://monographs.iarc.fr/ENG/Monographs/vol95/mono95-7.pdf (accessed on 2 February 2016).
  10. Ministry of Environment. Source Appointment of PM2.5. National Institute of Environmental Research. Sejong, South Korea. Available online: http://www.prism.go.kr/homepage/researchCommon/retrieveResearchDetailPopup.do;jsessionid=B45E976CBC454200C4532494792FB6EB.node02?research_id=1480000-200900330 (accessed on 25 February 2015).
  11. National Institute of Animal Science. Livestock Management Issue Report. Available online: http://www.nias.go.kr/front/prboardView.nias?cmCode=M090814150936066&boardSeqNum=278&columnName=&searchStr=&currPage=1 (accessed on 20 April 2015).
  12. Taner, S.; Pekey, B.; Pekey, H. Fine particulate matter in the indoor air of barbeque restaurants: Elemental compositions, sources and health risks. Sci. Total Environ. 2013, 454–455, 79–87. [Google Scholar] [CrossRef] [PubMed]
  13. Kim, D.Y. Levels Air Pollutants at Barbeque Restaurants. Available online: http://www.gri.re.kr/korea/jsp/policy/gri_view.jsp?idx=2917:3529&go=13&gogroup= (accessed on 10 January 2015).
  14. Korea Gas Corporation. Available online: http://www.kogas.or.kr (accessed on 2 February 2016).
  15. Pakey, B.; Bozkurt, Z.B.; Pekey, H.; Dogan, G.; Zararsiz, A.; Efe, N.; Tuncel, G. Indoor/outdoor concentrations and elemental composition of PM10/PM2.5 in urban/industrial areas of Kocaeli city, Turkey. Indoor Air 2010, 20, 112–125. [Google Scholar] [CrossRef] [PubMed]
  16. Kim, S.; Sohn, J.; Lee, K. Exposure to Particulate matters (PM2.5) and airborne nicotine in computer game rooms after implementation of smoke-free legislation in South Korea. Nicotine Tob. Res. 2012, 12, 1246–1253. [Google Scholar] [CrossRef] [PubMed]
  17. Dacunto, P.J.; Cheng, K.C.; Acevedo-Bolton, V.; Jiang, R.T.; Klepeis, N.E.; Repace, J.L.; Ott, W.R.; Hildemann, L.M. Real-time particle monitor calibration factors and PM2.5 emission factors for multiple indoor sources. Environ. Sci. Process. Impacts 2013, 15, 1511–1519. [Google Scholar] [CrossRef]
  18. United States Environmental Protection Agency. Guidelines for Exposure Assessment. Available online: http://cfpub.epa.gov/ncea/cfm/recordisplay.cfm?deid=15263#Download (accessed on 15 January 2015).
  19. Jang, J.Y.; Jo, S.N.; Kim, S.Y.; Kim, S.J.; Cheong, H.K. Korean Exposure Factors Handbook. Available online: http://m.riss.kr/search/detail/DetailView.do?p_mat_type=d7345961987b50bf&control_no=1f310160f0f75c15ffe0bdc3ef48d419 (accessed on 15 March 2015).
  20. Kim, S.R.; Halden, R.U.; Buckley, T.J. Volatile Organic Compounds in Human Milk: Methods and Measurements. Environ. Sci. Technol. 2007, 41, 1662–1667. [Google Scholar] [CrossRef] [PubMed]
  21. Statistics Korea. Average Time Spent on Activities by Age Group—20 Years Old & Over, 65 Years Old & Over (Cont’d). Available online: http://kostat.go.kr (accessed on 20 March 2015).
  22. Ministry of Environment. Korea National Ambient Air Quality Standard. Available online: http://www.me.go.kr/mamo/web/index.do?menuId=586 (accessed on 20 June 2015).
  23. Lee, S.C.; Li, W.M.; Chan, L.Y. Indoor air quality at restaurants with different styles of cooking in metropolitan Hong Kong. Sci. Total Environ. 2001, 279, 181–193. [Google Scholar] [CrossRef]
  24. Hu, W.; Downward, G.S.; Reiss, B.; Xu, J.; Bassig, B.A.; Hosgood, H.D.; Zhang, L.; Seow, W.J.; Wu, G.; Chapman, R.S.; et al. Personal and Indoor PM2.5 Exposure from Burning Solid Fuels in Vented and Unvented Stoves in a Rural Region of China with a High Incidence of Lung Cancer. Environ. Sci. Technol. 2015, 48, 8456–8464. [Google Scholar] [CrossRef] [PubMed]
  25. Kim, B.K.; Yun, D.M.; Kim, S.R. Assessment of Secondhand Smoke Exposure Levels by Measuring PM2.5 Concentration at Various Smoking Hotspot Place Inside and Outside Campus. J. Korean Soc. Res. Nicotine Tob. 2014, 5, 76–85. [Google Scholar]
  26. Statistics Korea. Available online: http://kostat.go.kr/portal/korea/index.action (accessed on 15 January 2015).
Figure 1. Floor layout of a typical sampling site (unit of length: mm) and schematic of sampling frequency and duration.
Ijerph 14 00078 g001
Figure 2. Distributions of median indoor particulate matters with a diameter of 2.5 micrometers or less (PM2.5) concentrations obtained at each sampling site according to ventilation condition and distribution of ratios of PM2.5 concentrations obtained with ventilation, to those without ventilation; Concentrations were lower than the reference (p < 0.05).
Ijerph 14 00078 g002
Figure 3. Distribution of average daily dose obtained from Monte Carlo simulation with the distribution of indoor PM2.5 levels observed under different ventilation conditions, and the probability of ADD by indoor PM2.5 which was higher (Blue) than the ADD (0.0046 mg/kg·day) estimate for roadside PM2.5.
Ijerph 14 00078 g003
Table 1. Characteristics of sampling sites.
Site No.House TypeArea (m2)Height (m)Indoor SmokingAir Conditioner
1Single house66.02.4NoNo
2Apartment52.82.0NoNo
3Apartment52.82.0NoNo
4Single house66.02.0NoNo
5Single house66.02.5NoNo
6Apartment112.22.2NoNo
7Multi units92.42.2NoNo
8Single house108.92.0NoNo
9Single house66.02.5NoNo
10Single house52.82.5NoNo
11Apartment112.22.3NoNo
12Apartment108.92.3NoNo
13Apartment92.42.3NoNo
Table 2. Distributions of average daily doses (ADDs) from Monte-Carlo simulation using the distribution of indoor PM2.5 levels observed under different ventilation conditions, as well as outdoor PM2.5 levels obtained from urban roadsides.
CaptionADD (mg/kg·Day)PM2.5 Concentration (mg/m3) *Exposure Time (min/Day)Exposure Frequency (Weekly)Life Time Exposure Duration ** (Year)
from Equation (1)from Simulation (n = 10,000)from Measurements
Median (IQR) Mean (95% CI)Median (IQR) Mean ± SD
No ventilation0.04810.0417 (0.0269–0.0628)0.0496 (0.0490, 0.0502)4.51 (2.24–5.64)3.83 ± 1.9865 135
One window open0.02740.0221 (0.0138–0.0353)0.0280 (0.0276, 0.0284)1.82 (1.35–3.28)2.18 ± 1.3865 135
Two windows open0.02120.0164 (0.0096–0.0276)0.0217 (0.0213, 0.0221)1.93 (0.42–2.51)1.69 ± 1.2965135
Forced-air stove hood0.01000.0070 (0.0038–0.0127)0.0070 (0.0068, 0.0072)0.51 (0.13–1.33)0.79 ± 0.7465135
Urban roadside ***0.0046NANA0.05 480735
IQR: interquartile range, CI: confidence interval, SD: standard deviation, NA: not available. * The distributions of PM2.5 concentrations were obtained from the 13 PM2.5 median concentration values for 13 sampling sites (real-time based 2 h measuring with pan-frying for the first 9 min), Median (IQR) background PM2.5 concentration were 0.022 (0.012–0.042) mg/m3. ** For housewife aged 25 years; *** Data from Air Korea (2016) [22].
Table 3. Distributions of indoor PM2.5 concentrations during the first 9 min of cooking period and the dissipation kinetics after cooking was completed.
Type of VentilationPM2.5 Concentration (μg/m3) during the First 9 min Fan-Prying PeriodDissipation Kinetics ((μg/m3)/min) after Cooking Was Completed
Median25%ile75%ileMedian25%ile75%ile
No ventilation5142.22958.29228.738.2 26.6 79.4
One window open4970.61668.66990.847.4 17.0 84.6
Two windows open3777.21348.86192.654.7 20.1 99.9
Forced-air stove hood1159.6183.32269.255.2 6.5 78.7

