Using Structural Equation Modeling to Assess the Links between Tobacco Smoke Exposure, Volatile Organic Compounds, and Respiratory Function for Adolescents Aged 6 to 18 in the United States

Abstract
:1. Introduction
2. Materials and Methods
3. Results
3.1. Descriptive Statstics
3.2. Model Fitting
4. Discussion
5. Conclusions
Acknowledgments
Author Contributions
Conflicts of Interest
References
- Stapleton, M.; Howard-Thompson, A.; George, C.; Hoover, R.M.; Self, T.H. Smoking and asthma. J. Am. Board. Fam. Med. 2011, 24, 313–322. [Google Scholar] [CrossRef] [PubMed]
- Rumchev, K.; Spickett, J.; Bulsara, M.; Phillips, M.; Stick, S. Association of domestic exposure to volatile organic compounds with asthma in young children. Thorax 2004, 59, 746–751. [Google Scholar] [CrossRef] [PubMed]
- Nurmatov, U.; Tagieva, N.; Semple, S.; Devereux, G.; Sheikh, A. Volatile organic compounds and risk of asthma and allergy: A systematic review and meta-analysis of observational and interventional studies. Prim. Care Respir. J. 2013, 22, PS9–PS15. [Google Scholar] [CrossRef] [PubMed]
- Jaakkola, J.J.; Parise, H.; Kislitsin, V.; Lebedeva, N.I.; Spengler, J.D. Asthma, wheezing, and allergies in Russian schoolchildren in relation to new surface materials in the home. Am. J. Public Health 2004, 94, 560–562. [Google Scholar] [CrossRef] [PubMed]
- Hernandez, M.L.; Herbst, M.; Lay, J.C.; Alexis, N.E.; Brickey, W.J.; Ting, J.P.Y.; Zhou, H.; Peden, D.B. Atopic asthmatic patients have reduced airway inflammatory cell recruitment after inhaled endotoxin challenge compared with healthy volunteers. J. Allergy Clin. Immunol. 2012, 130, 869–876. [Google Scholar] [CrossRef] [PubMed]
- Noah, T.L.; Zhou, H.; Zhang, H.; Horvath, K.; Robinette, C.; Kesic, M.; Meyer, M.; Diaz-Sanchez, D.; Jaspers, I. Diesel exhaust exposure and nasal response to attenuated influenza in normal and allergic volunteers. Am. J. Respir. Crit. Care Med. 2012, 185, 179–185. [Google Scholar] [CrossRef] [PubMed]
- Egen, O.; Beatty, K.; Blackley, D.J.; Brown, K.; Wykoff, R. Health and social conditions of the poorest versus wealthiest counties in the United States. Am. J. Public Health 2017, 107, 130–135. [Google Scholar] [CrossRef] [PubMed]
- Sexton, K.; Ryan, A.D.; Adgate, J.L.; Barr, D.B.; Needham, L.L. Biomarker measurements of concurrent exposure to multiple environmental chemicals and chemical classes in children. J. Toxicol. Environ. Health Part A 2011, 74, 927–942. [Google Scholar] [CrossRef] [PubMed]
- Nurmatov, U.B.; Tagiyeva, N.; Semple, S.; Devereux, G.; Sheikh, A. Volatile organic compounds and risk of asthma and allergy: A systematic review. Eur. Respir. Rev. 2015, 24, 92–101. [Google Scholar] [CrossRef] [PubMed] [Green Version]
- Cannella, W.J. Xylenes and Ethylbenzene. In Kirk-Othmer Encyclopedia of Chemical Technology; Wiley: New York, NY, USA, 2007. [Google Scholar]
- Agency for Toxic Substances and Disease Registry, Public Health Statement Xylene. Available online: https://www.atsdr.cdc.gov/phs/phs.asp?id=293&tid=53 (accessed on 15 September 2017).
- Agency for Toxic Substances and Disease Registry, Public Health Statement Ethylbenzene. Available online: https://www.atsdr.cdc.gov/phs/phs.asp?id=381&tid=66 (accessed on 15 September 2017).
- Centers for Disease Control and Prevention, Glossary of Volatile Organic Compounds. Available online: https://www.cdc.gov/nceh/clusters/fallon/glossary-voc.pdf (accessed on 15 September 2017).
- Lim, S.K.; Shin, H.S.; Yoon, K.S.; Kwack, S.J.; Um, Y.M.; Hyeon, J.H.; Kwak, H.M.; Kim, J.Y.; Kim, T.Y.; Kim, Y.J.; et al. Risk assessment of volatile organic compounds benzene, toluene, ethylbenzene, and xylene (BTEX) in consumer products. J. Toxicol. Environ. Health Part A 2014, 77, 1502–1521. [Google Scholar] [CrossRef] [PubMed]
- Mendell, M.J. Indoor residential chemical emissions as risk factors for respiratory and allergic effects in children: A review. Indoor Air 2007, 17, 259–277. [Google Scholar] [CrossRef] [PubMed]
- Patelarou, E.; Tzanakis, N.; Kelly, F.J. Exposure to indoor pollutants and Wheeze and asthma development during early childhood. Int. J. Environ. Res. Public Health 2015, 12, 3993–4017. [Google Scholar] [CrossRef] [PubMed]
- Byrne, B.M. Structural Equation Modeling wtih MPlus; Routledge: New York, NY, USA, 2012. [Google Scholar]
- Sanchez, B.N.; Budtz-Jorgensen, E.; Ryan, L.M.; Hu, H. Structural equation models: A review with applications to environmental epidemiology. J. Am. Stat. Assoc. 2005, 100, 1443–1455. [Google Scholar] [CrossRef]
- Baja, E.S.; Schwartz, J.D.; Coull, B.A.; Wellenius, G.A.; Vokonas, P.S.; Suh, H.H. Structural equation modeling of the inflammatory response to traffic air pollution. J. Expo. Sci. Environ. Epidemiol. 2013, 23, 268–274. [Google Scholar] [CrossRef] [PubMed]
- Centers for Disease Control and Prevention, National Center for Health Statistics, National Health and Nutrition Examination Survey: 2011–2012 Overview. Available online: https://wwwn.cdc.gov/Nchs/Nhanes/ContinuousNhanes/Overview.aspx?BeginYear=2011 (accessed on 15 September 2017).
- National Health and Nutrition Examination Survey, 2011–2012 Data Documentation, Codebook, and Frequencies: Spirometry-Pre and Post-Bronchodilator. Available online: https://wwwn.cdc.gov/nchs/nhanes/2011-2012/SPX_G.htm (accessed on 15 September 2017).
- Kaur, H.; Singh, J.; Makkar, M.; Singh, K.; Garg, R. Variations in the peak expiratory flow rate with various factors in a population of healthy women of the malwa region of punjab, India. J. Clin. Diagn. Res. 2013, 7, 1000. [Google Scholar] [CrossRef] [PubMed]
- Jat, K.R. Spirometry in children. Prim. Care Respir. J. 2013, 22, 221–229. [Google Scholar] [CrossRef] [PubMed]
- Pirkle, J. Laboratory Procedure Manual: Volatile Organic Compounds (VOCs) Metabolites. Available online: https://www.cdc.gov/Nchs/Data/Nhanes/Nhanes_11_12/UVOC_G_MET_VOC_Metabolites.pdf (accessed on 15 September 2017).
- National Health and Nutrition Examination Survey, 2011–2012 Data Documentation, Codebook, and Frequencies: Demographic Variables & Sample Weights. Available online: https://wwwn.cdc.gov/nchs/nhanes/2011-2012/demo_g.htm (accessed on 15 September 2017).
- Templin, J. Maximum Likelihood and Robust Maximum Likelihood. Available online: https://jonathantemplin.com/files/sem/sem13psyc948/sem13psyc948_lecture02.pdf (accessed on 15 September 2017).
- Bentler, P.M. Comparative fit indexes in structural models. Psychol. Bull. 1990, 107, 238–246. [Google Scholar] [CrossRef] [PubMed]
- Tucker, L.; Lewis, C. A reliability coefficient for maximum likelihood factor analysis. Psychometrika 1973, 38, 1–10. [Google Scholar] [CrossRef]
- Dominici, F.; Peng, R.D.; Barr, C.D.; Bell, M.L. Protecting human health from air pollution: Shifting from a single-pollutant to a multipollutant approach. Epidemiology 2010, 21, 187–194. [Google Scholar] [CrossRef] [PubMed]


| Variable | Label | Num. Missing | Min | Median | Max |
|---|---|---|---|---|---|
| PEF | Peak Expiratory Flow Rate (baseline), in mL/s | 54 | 1336 | 5253 | 13,437 |
| NEV | Extrapolated Volume (baseline), in mL | 54 | 0 | 58 | 201 |
| FVC | Forced Vital Capacity (baseline), in mL | 54 | 592 | 2658 | 7205 |
| NUMCIGH | Average number of cigarettes smoked in the home per day | 4 | 0 | 0 | 40 |
| NSMOKE | Number of smokers in the household | 1 | 0 | 0 | 3 |
| XYLENE1 | 2-Methylhippuric acid (ng/mL) | 23 | 3.5 | 24.3 | 3000.0 |
| XYLENE2 | 3-methipurc acid & 4-methipurc acid (ng/mL) | 23 | 9.1 | 173.0 | 40,100.0 |
| ETHYLBEN | Phenylglyoxylic acid (ng/mL) | 23 | 8.5 | 189.0 | 2250.0 |
| TOLUENE | N-Acetyl-S-(benzyl)-l-cysteine (ng/mL) | 23 | 0.4 | 7.2 | 1180.0 |
| RIDAGEYR | Age in years at screening | 0 | 6 | 11 | 18 |
| HEIGHT | Standing Height (dm) | 3 | 10.6 | 15.0 | 19.1 |
| WEIGHT | Weight (kg/10) | 4 | 1.6 | 4.6 | 17.8 |
| POVERTY | Ratio of family income to poverty | 57 | 0 | 1.4 | 5.0 |
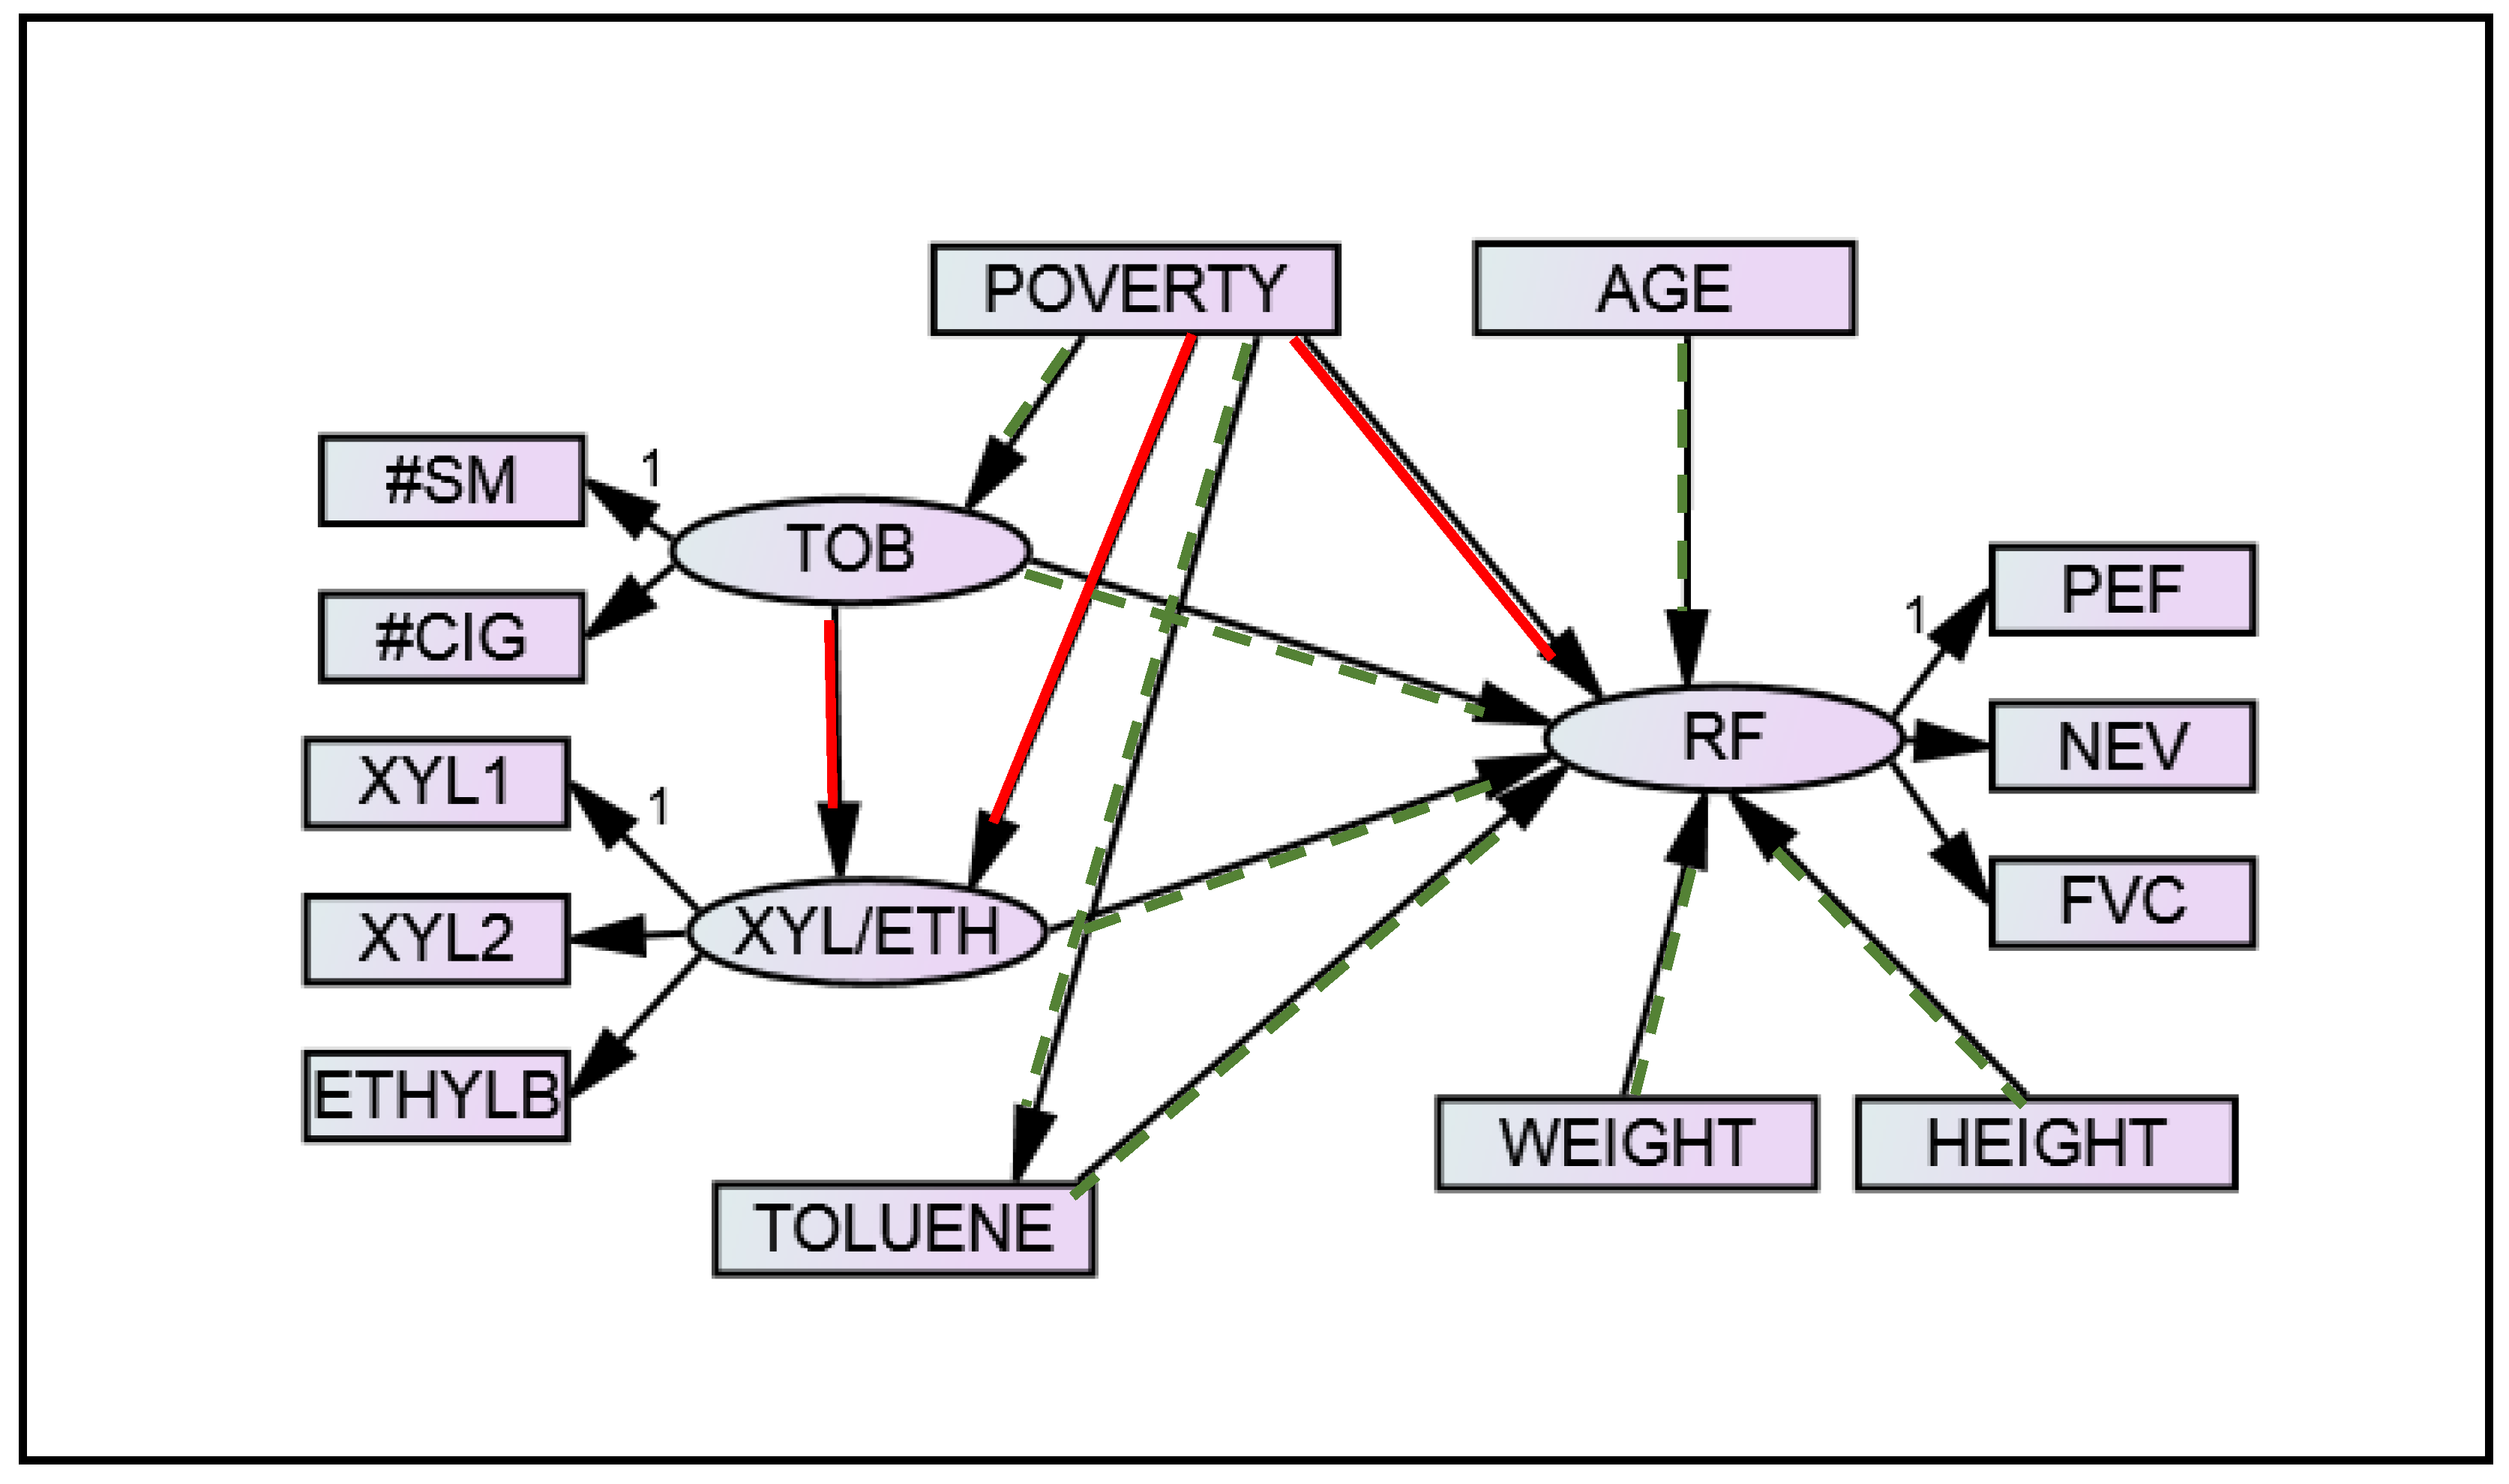
| Latent Variable | Observed Variables | Pearson Correlation Coefficient |
|---|---|---|
| Tobacco | NUMCIGH, NSMOKE | 0.865 *** |
| Xylene/Ethylbenzene | XYLENE1, XYLENE2 | 0.692 *** |
| XYLENE1, ETHYLBEN | 0.172 *** | |
| XYLENE2, ETHYLBEN | 0.235 *** | |
| Respiratory Function | PEF, NEV | 0.495 *** |
| PEF, FVC | 0.877 *** | |
| NEV, FVC | 0.518 *** |
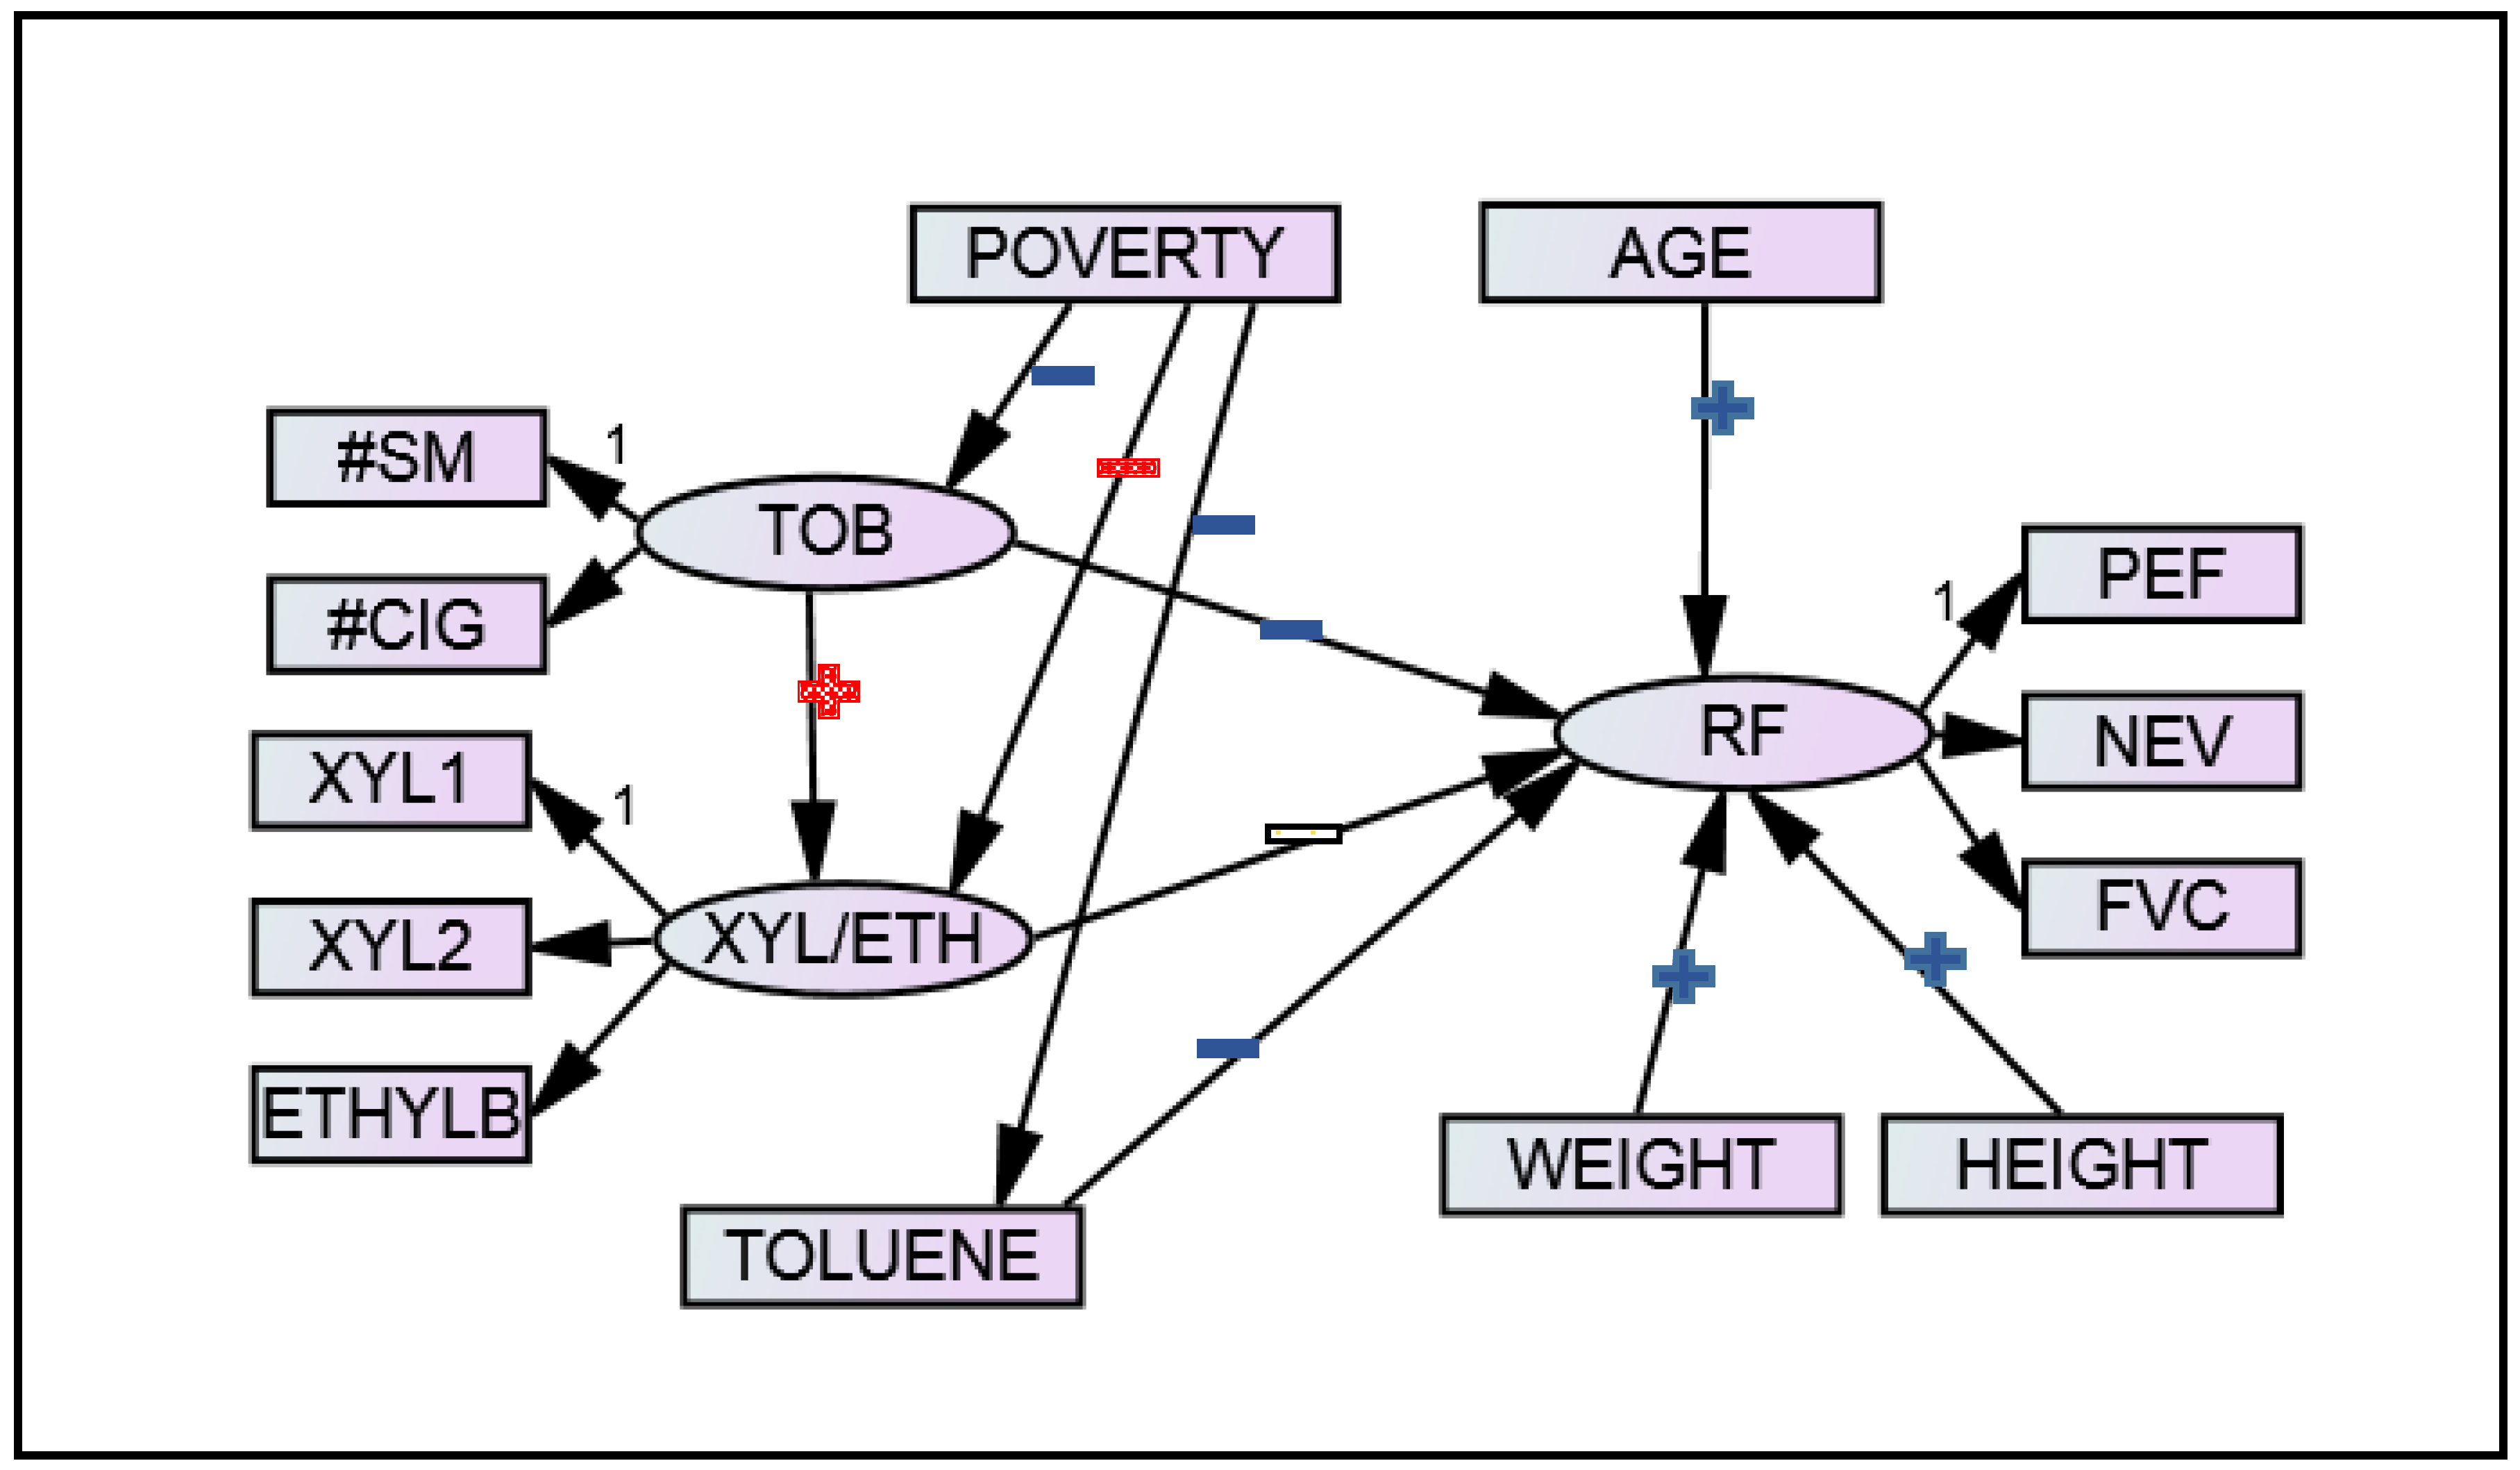
| Effect | Estimate (β) | Standard Error | p-Value |
|---|---|---|---|
| RF 1 ← Tobacco | –0.012 | 0.006 | 0.041 |
| RF ← Xylene/Ethylbenzene | –0.016 | 0.010 | 0.120 |
| RF ← Toluene | –0.019 | 0.010 | 0.050 |
| RF ← Age | 0.065 | 0.022 | 0.004 |
| RF ← Height | 0.738 | 0.059 | <0.001 |
| RF ← Weight | 0.117 | 0.028 | <0.001 |
| Xylene/Ethylbenzene ← Tobacco | 0.025 | 0.018 | 0.177 |
| Tobacco ← Poverty | –0.646 | 0.143 | <0.001 |
| Xylene/Ethylbenzene ← Poverty | –0.010 | 0.035 | 0.781 |
| Toluene ← Poverty | –0.043 | 0.019 | 0.023 |
| Effect | Estimate (β) | Standard Error | p-Value |
|---|---|---|---|
| Total Indirect | 0.009 | 0.004 | 0.017 |
| RF 1 ← Tobacco ← Poverty | 0.008 | 0.004 | 0.033 |
| RF ← Toluene ← Poverty | 0.001 | 0.000 | 0.097 |
| RF ← Xylene/Ethylbenzene ← Poverty | 0.000 | 0.001 | 0.772 |
| RF ← Xylene/Ethylbenzene ← Tobacco ← Poverty | 0.000 | 0.000 | 0.320 |
© 2017 by the authors. Licensee MDPI, Basel, Switzerland. This article is an open access article distributed under the terms and conditions of the Creative Commons Attribution (CC BY) license (http://creativecommons.org/licenses/by/4.0/).
Share and Cite
Shook-Sa, B.E.; Chen, D.-G.; Zhou, H. Using Structural Equation Modeling to Assess the Links between Tobacco Smoke Exposure, Volatile Organic Compounds, and Respiratory Function for Adolescents Aged 6 to 18 in the United States. Int. J. Environ. Res. Public Health 2017, 14, 1112. https://doi.org/10.3390/ijerph14101112
Shook-Sa BE, Chen D-G, Zhou H. Using Structural Equation Modeling to Assess the Links between Tobacco Smoke Exposure, Volatile Organic Compounds, and Respiratory Function for Adolescents Aged 6 to 18 in the United States. International Journal of Environmental Research and Public Health. 2017; 14(10):1112. https://doi.org/10.3390/ijerph14101112
Chicago/Turabian StyleShook-Sa, Bonnie E., Ding-Geng Chen, and Haibo Zhou. 2017. "Using Structural Equation Modeling to Assess the Links between Tobacco Smoke Exposure, Volatile Organic Compounds, and Respiratory Function for Adolescents Aged 6 to 18 in the United States" International Journal of Environmental Research and Public Health 14, no. 10: 1112. https://doi.org/10.3390/ijerph14101112