Article

Factors Effecting the Total Volatile Organic Compound (TVOC) Concentrations in Slovak Households

by
Ľudmila Mečiarová
1,*,
Silvia Vilčeková
1,
Eva Krídlová Burdová
1 and
Jozef Kiselák
2
1
Institute of Environmental Engineering, Faculty of Civil Engineering, Technical University of Košice, Vysokoškolská 4, 04200 Košice, Slovakia
2
Institute of Mathematics, Faculty of Science, Pavol Jozef Šafárik University in Košice, Jesenná 5, 04001 Košice, Slovakia
*
Author to whom correspondence should be addressed.
Int. J. Environ. Res. Public Health 2017, 14(12), 1443; https://doi.org/10.3390/ijerph14121443
Submission received: 17 October 2017 / Revised: 16 November 2017 / Accepted: 20 November 2017 / Published: 23 November 2017
(This article belongs to the Special Issue Indoor Environmental Quality)

Abstract

:
Thirty five Slovak households were selected for an investigation of indoor environmental quality. Measuring of indoor air physical and chemical factors and a questionnaire survey was performed during May 2017. The range of permissible operative temperature was not met in 11% of objects. Relative humidity met the legislative requirements in all monitored homes. Concentrations of total volatile organic compounds (TVOCs) were significantly higher in the apartments than in the family houses. The average TVOC levels in the apartments and family houses were 519.7 µg/m3 and 330.2 µg/m3, respectively. Statistical analysis confirmed the effect of indoor air temperature, relative humidity and particulate matter (PM0.5 and PM1) on the levels of TVOCs. Higher TVOC levels were observed also in homes where it is not a common practice to open windows during cleaning activities. Other factors that had a statistically significant effect on concentrations of volatile organic compounds were heating type, attached garage, location of the apartment within residential building (the floor), as well as number of occupants. Higher TVOC concentrations were observed in indoor than outdoor environment, while further analysis showed the significant impact of indoor emission sources on the level of these compounds in buildings. The questionnaire study showed a discrepancy between objective measurement and subjective assessment in the household environment, and pointed to insufficient public awareness about volatile organic compounds (VOCs).

1. Introduction

When we count the hours spent sleeping, working or at school, we find that humans spend most of their time in confined spaces. This time amounts to around 90% of the time for people in developed countries, and is even greater for vulnerable sectors of the population (young children, people with weakened health, or seniors). Therefore the indoor air quality (IAQ) is a significant problem that needs to be addressed [1,2]. Personal exposure to VOCs has been investigated in a limited number of studies. Gokhale et al. studied the exposure to VOCs in homes, offices and outdoor in Leipzig (Germany). The highest proportion of personal exposure was from households (42–73%), followed by the outdoor environment (18–34%), and offices (2–38%). Benzene, dodecane, decane, methylcyclopentane, triethyltoluene as well as trichloroethylene prevailed in the outdoor environment, while methyl cyclohexane, triethyltoluene, nonane, octane, tetraethyl toluene, and undecane had the highest concentrations in the offices and whereas a group of terpenoides such as 3-carane, limonene, α-pinene, β-pinene, and the aromatic compounds toluene and styrene had the greatest impact in households [3]. Several other studies [4,5,6] have also pointed to the fact that at home we spend about 60–70% of our time at home. Due to this fact, households are among the most investigated microenvironment in terms of IAQ (resp. the occurrence of VOCs and other pollutants). However, the prevalence of individual VOCs as well as their levels are different and vary not only within countries or cities, but also within households themselves (i.e., in different rooms). The most abundant VOCs the indoor air of Puertollano in Spain were formaldehyde and hexanal, followed by butanal, acetone and acetaldehyde in the indoor air of Puertollano in Spain. On the basis of the indoor/outdoor ratio (I/O ratio) it has been found that the presence of sources in indoor environment is common for limonene, α-pinene, hexanal, formaldehyde, pentanal, acetaldehyde, o-xylene, nodecane, and acetone [7]. The risk level for 93 chemicals polluting the indoor air was calculated in Japan. Formaldehyde, acrolein, 1,4–dichlorobenzene, benzene, tetrachloroethylene and benzo (a) pyrene were ranked in the highest risk category [8]. TVOC concentrations were low, however, about four times higher than in outdoor air, indicating the dominant influence of indoor sources in the established apartments in Melbourne (Australia). Much higher concentrations were observed in new or renovated buildings [9]. High concentrations of VOCs are more often reported in newly built than in already occupied residential buildings [9,10,11,12]. However, VOCs levels in many new residential buildings are declining over time due to the fact that the emission strength of structures and furniture decreases with time [13]. This is supported by several articles [10,12], which have dealt with the long-term course of VOCs concentrations in new residential buildings after the users moved in. In these studies, VOC measurements were repeated for three years with an annual interval. The results showed that most VOC concentrations in new households did not show similar levels to older households after two years. Järnström et al. [11] repeated their VOC measurements in newly completed residential buildings during more than a year with an interval of less than six months and found that the most significant decrease in concentrations occurred during the first six months. In addition, the VOCs coming from the construction phase were replaced by new ones the longer the building was use. The same issue was also addressed by Shin and Jo [14], who monitored the development of VOC concentrations for 24 months with a monthly measurement interval in 25 households in different new residential homes. Both TVOC and VOC concentrations showed a decreasing trend during this period. The average TVOC concentration in the first month of measurement was 881 µg/m3 while in the last month was 432 µg/m3. Floor coverings/coatings were the most influential indoor source of VOCs followed by cleaning agents, wood paneling/furniture, paints and moth repellents.
TVOC concentrations in newly decorated rooms ranged from 650 to 690 µg/m3 in Hangzhou (China). The characteristics of the emission source were a key factor influencing the concentration. In addition, the levels were influenced by temperature, humidity, time from the end of the decoration to sampling as well as the time at which the windows and doors were closed before sampling while temperature and humidity were less important factors [15]. Noris et al. investigated the impact of building reconstruction in order to reduce the energy demands on the indoor environmental quality (IEQ) in 16 apartments (eight apartments with continuous mechanical ventilation and eight apartments without mechanical ventilation). Their results indicate an improvement in the levels of chemical pollutants including VOCs in the indoor air. In general, apartments with continuous mechanical ventilation showed a more pronounced improvement in IEQ than apartments without this system [16]. The indoor air in 20 new passive houses and 21 new regular houses in Sweden were evaluated by Langer et al. [17] in Sweden. Significant differences in TVOC and formaldehyde concentrations between passive houses and regular houses indicate the presence of substantial TVOC sources in passive houses, while source of formaldehyde may be more pronounced in regular houses.
In another study, Langer and Bekö [18] investigated the Swedish Housing Stock as well as the relationship between building characteristics and IAQ. Higher concentrations of TVOCs as well as formaldehyde were found in family houses than in dwellings, as well as in dwellings built in between 1955 and 1980 than in new or older apartments. TVOC concentrations were higher in rural areas comparted to cities and in the apartments with natural ventilation compared to those with mechanical ventilation. A significant negative correlation between air exchange and TVOC as well as formaldehyde concentrations reflects the ability of ventilation to reduce the indoor exposure to these compounds. The sum of VOCs in New Delhi (India) ranged from 33.6 to 107.2 µg/m3. Higher concentrations were found in the living rooms, followed by kitchens and bedrooms [19]. Dodson et al. [20] investigated the impact of cellars, garages, and common corridors on VOCs in households. Concentrations in garages were 5–10 times higher than the median concentrations of benzene, toluene, ethylbenzene and xylenes in the indoor environment. The ratio of concentrations in cellars/households was significant for methylene chloride, ethylbenzene, m/p-xylene, o-xylene, and summer ratios tended to be higher than winter ratios. Approximately 20–40% indoor concentrations were associated with petrol sources, such as methyl t-butyl ether, benzene, toluene, ethylbenzene and xylenes for households with attached garages. The cellars contributed to approximately 10–20% of the indoor concentrations. For apartments, approximately 5–10% of indoor concentrations were associated with air from corridor. The use of LPG stoves had more significant impact on VOC concentrations than the use of natural gas stoves in Hong Kong [21]. Guo et al. [22] found that formaldehyde concentrations correlated with the age of the building, while this trend was not observed for VOC concentrations. In the study [23], observed that the type of ventilation system and flat placement correlated with formaldehyde concentrations.
More than 70% of total VOC concentrations in indoor air in Edmonton were assigned to indoor sources where households products were the main contributor, followed by combustion process with tobacco smoke, deodorants, and construction materials. The main outdoor sources of VOCs were the oil and gas industry, transport emissions and biogenic emissions [24]. Building materials were the largest contributor to VOC concentrations in households in Hong Kong, followed by air freshener products, household products, mothballs and painted wood products [25]. Increased concentrations of VOCs in Michigan (USA) were associated with eight sources or activities: the presence of attached garage, recent renovations, older residences, smoking inside, fewer windows and doors, higher CO2 concentrations, and a lower level of ventilation [26]. Ohura et al. [27] compared the quality of indoor (living rooms, bedrooms and kitchens) as well as outdoor air in Japan and China during the summer and winter season between 2006 and 2007. Concentrations of many target VOCs (benzene, toluene, ethylbenzene, xylenes and trimethylbenzene) were significantly higher in China than in Japan. Indoor VOC levels in Japan were similar to those outdoor, while in China they tended to be higher. Outdoor sources, including transport and industrial emissions, as well as human activity, were significant sources of VOC pollution. As can be seen, the results from different countries, cities differ in their conclusions, identified VOC or TVOC levels. Overview of TVOC levels in residential buildings in different countries/cities is illustrated in Figure 1.
The main contribution of the presented research work is finding the dependence between indoor air factors and building characteristics. Determination of TVOC occurrence and analysis of the main factors affecting the TVOC levels in Slovak households are also important outputs due to the fact that this type of data are insufficient. Only limited number of researches were carried out in residential environment in our country [33].

2. Materials and Methods

2.1. Objective Measurement

Experimental measurements focused on determination of TVOC levels were performed in 35 households—18 apartments (B1–B18) and 17 family houses (D19–D35)—in May 2017 (Spring). The air temperature (Ta), relative humidity (RH), mean radiant temperature, concentration of total volatile organic compounds (TVOC), and concentration of particulate matters (PM0.5–PM1) were monitored in each household during 1 h. Measurement of TVOC concentrations were also performed during 1 h in outdoor environment (at a distance approximately 3 m from the building) for determination of I/O ratio. The air temperature as well as relative humidity was monitored with data logger TESTO 175-H2 (Testo, Inc., Lenzkirch, Germany). The concentrations of PM were determined using a HANDHELD 3016 IAQ (Lighthouse Worldwide Solutions, Inc., Fremont, CA, USA). TVOC concentrations were measured with photoionization detector with UV lamp—ppbRAE 3000 (RAE Systems, Inc., San Jose, CA, USA). Data from measuring devices were recorded in a minute interval. Mean radiant temperature in three heights were measured using a Vernon-Jokl globe thermometer (d = 0.01 m) according to EN 7726. Operative temperatures (To) were calculated also according to EN 7726 [34]. This parameter was calculated for comparison with the recommended and permissible values for indoor environment in Slovak legislation. Basic information about measuring devices are summarized in Table 1. Measuring devices were placed in the center of the room in the height approximately 1.1 m above the floor (breathing zone). Household users were asked not to ventilate approximately 2 h before the measurement in the selected room. Before the measurement the household regime was not influenced in any other activities to determine the actual state of IAQ in the selected households. Measurements were carried out before the noon in living rooms during normal operation, but windows and doors were closed throughout the measuring period. Living rooms were chosen for measurement due to the fact that it is a central room of apartments given that all members of household meet in this area and spend time together here.

2.2. Subjective Measurement

Comfort assessment is an important tool for gathering information from building users about their subjective perception of individual indoor environmental quality factors, including air quality, which was also used during this research. Our questionnaire (Appendix A) was based on a study of the current scientific information about occurrence of VOCs in indoor environment and consisted from five main parts: basic information about the building (residential building/family house), basic information about the place of measurement (selected room), information about household regime (smoking, use of fragrances, etc.), specification of IEQ problems (odor, dust, temperature instability, etc.), and occurrence of sick building syndrome symptoms (SBS). The aim of questionnaire survey was to obtain the most accurate information not only from the construction point of view, but also about households regime, that were helpful in analysis of the main factors affecting the TVOC levels in Slovak households.

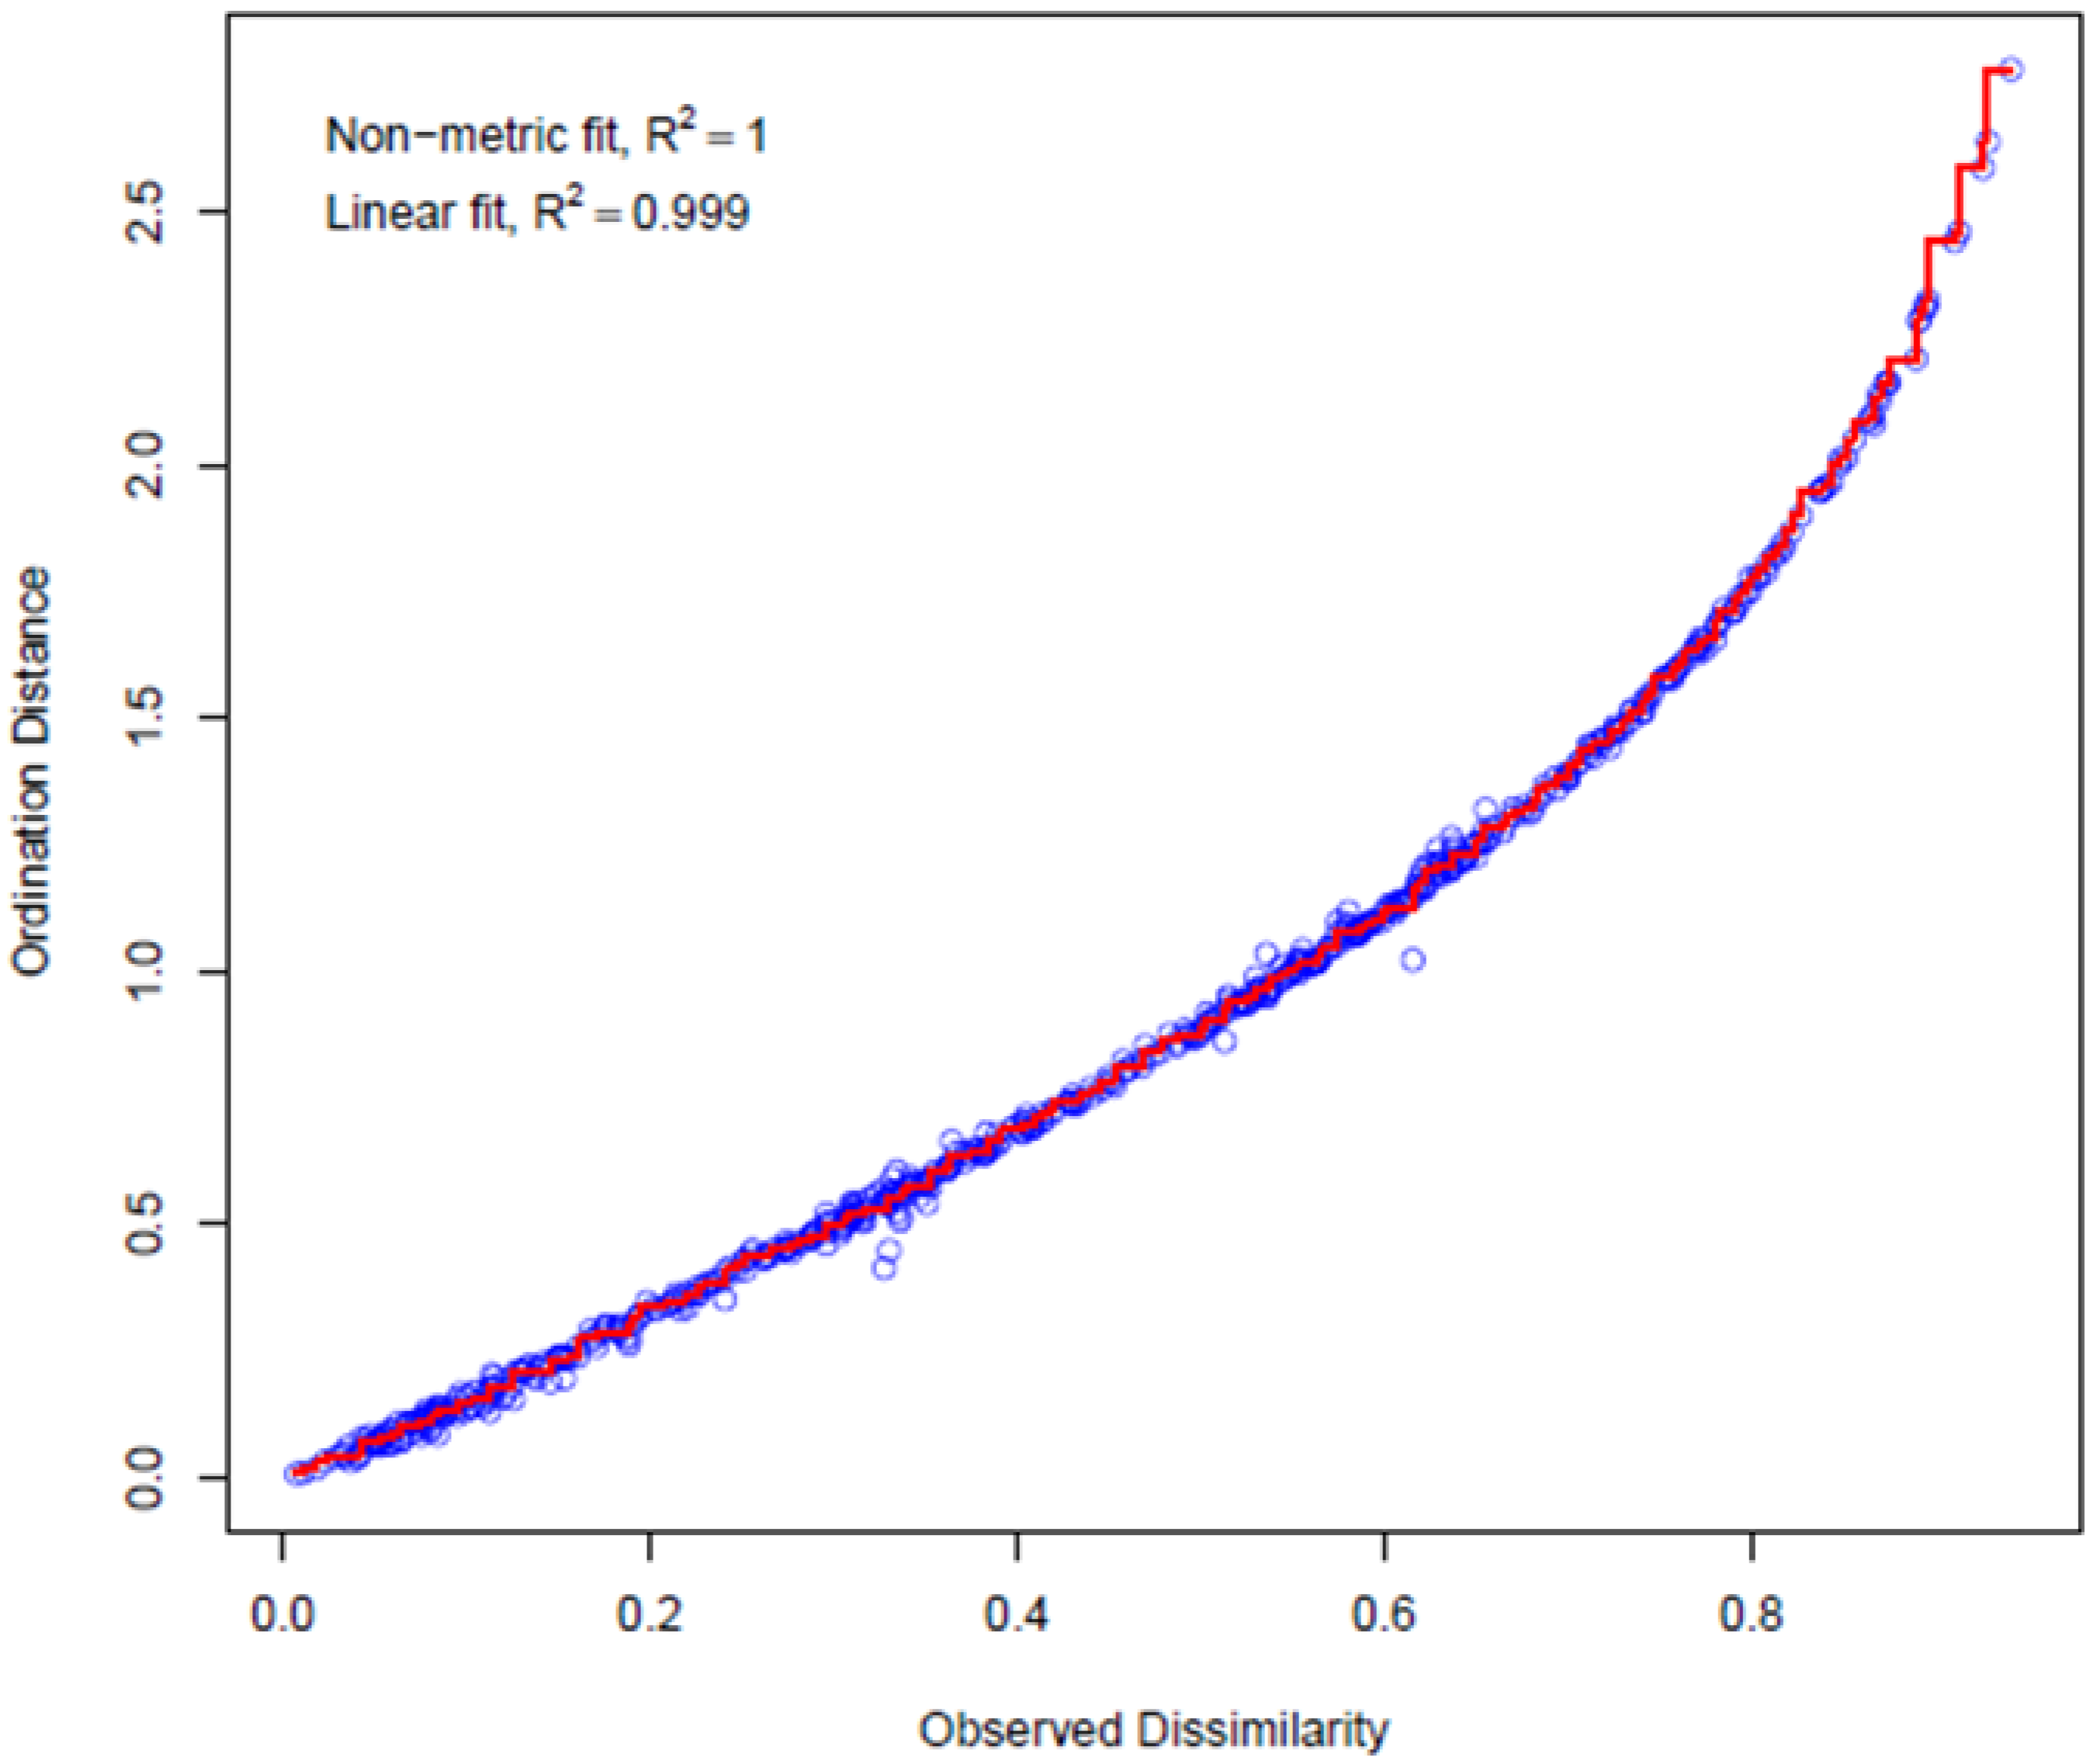
2.3. Statistical Analysis

Results from experimental measurement as well as from questionnaires were statistically evaluated using the R software (The R Foundation for Statistical Computing, Vienna, Austria). All procedures can be found in package vegan (except the Wilcoxon rank sum test). Ordinations were plotted with non-metric multidimensional scaling (NMDS) [35]; using the default settings of vegan’s “metaMDS” procedure and “ordiellipse”, which adds ellipses enclosing all points in the group (ellipsoid hulls) or ellipses of standard deviation, standard error or confidence areas. This allows us to visualize the level of similarity of individual cases of a dataset. It uses adequate dissimilarity measures. Since variances for “TVOC” were large, we have used the Bray Curtis distance (or Sorensen distance), which is a normalization method commonly used in environmental science fields. It has a nice property, that for positive coordinates its value is between zero and one. Procedure “envfit” fits vectors of continuous variables and centroids of levels of class variables (defined as factor in R). The direction of the vector shows the direction of the gradient, and the length of the arrow is proportional to the correlation between the variable and the ordination. It can also assess the significance of the variables using permutation tests. Function stress plot draws a Shepard plot where ordination distances are plotted against community dissimilarities, and the fit is shown as a monotone step line. In addition, stress plot shows two correlations like statistics of goodness of fit. The correlation based on stress is R2 = 1 − S2. The “fit-based R2” is the correlation between the fitted values and ordination distances, or between the step line and the points. This should be linear even when the fit is strongly curved and is often known as the “linear fit”. These two correlations are both based on the residuals in the Shepard plot, but they differ in their null models. In linear fit, the null model is that all ordination distances are equal, and the fit is a flat horizontal line.
Factor variables (year of construction, type of heating, thermal insulation, etc.) and their impact on TVOC levels were then (after finding their significance using permutation tests in the envfit procedure) evaluated using the Wilcoxon rank sum test. The Wilcoxon rank-sum test is a nonparametric alternative to the two sample t-test which is based solely on the order in which the observations from the two samples fall. The exact p-value is determined from the distribution of the Wilcoxon Rank Sum Statistic W. Moreover it returns a “difference in location” measure, which tell as the data differ [36].

2.4. Characteristics of Investigated Households

The basic information about selected objects are shown in Appendix BTable 2 and Table 3, Table A1 and Table A2 (Heating type: CH—central heating, SF—solid fuel heating, G—gas boiler, O—others (electric heater, heat pump); Main building material: CO—combination of materials (burnt brick + porous concrete), PC—porous concrete, CS—clay + stone, BB—burnt brick; Flooring: L—laminate flooring, C—carpet, O—others (PVC, brick, wooden parquet)). Natural ventilation is used in all selected homes. Central heating and plastic windows were a common feature in all apartments, except for B13 and B14, where heating is ensured by electric heaters. Plastic windows were also dominated in family houses. The most prevalent type of heating in family houses was the gas boiler used by 76% of households. 60% of the buildings were thermally insulated, while all residential buildings and 82% of family houses were insulated with polystyrene. Wood-fibre or mineral wool was used for thermal insulation in other family houses. The furnishing in each households were almost identical (living rooms) and consisted from TV wall, sofa, coffee table or smaller cabinets. In some cases (larger floor area of monitored room), the living room was connected to the kitchen.
The predominant materials used in the selected rooms were: particleboard (furniture), laminate flooring, and dispersion paint on walls and ceilings. The monitored room was renovated in less than 30 weeks before the measurement only in four households (three apartments, one family house). The garage has 59% of family houses, while 35% of them have the garage attached to the house with direct entry. Gasoline, paint, solvents, etc., were stored in the garage in all cases. Pets were present in 26% of households. Smoking indoors and problems with mould were confirmed also in 26% of households. 43% of households use fragrances such as air fresheners, scented candles, aromatic sticks or oils, etc. The printer is used in the living room by 11% of households. Newspaper/magazines and toys are stored in living room by 77% and 29% of respondents. Mothballs, which are a significant source of VOCs, are used only by 6% of households. Art supplies are used in the chosen room in 11% of objects. The detergents do not use only 6% of households, on the contrary polishes/waxes for floors or furniture use 23% of households. Frequency of cleaning varied between objects. 74% of the monitored objects has open windows during cleaning activities.

3. Results and Discussion

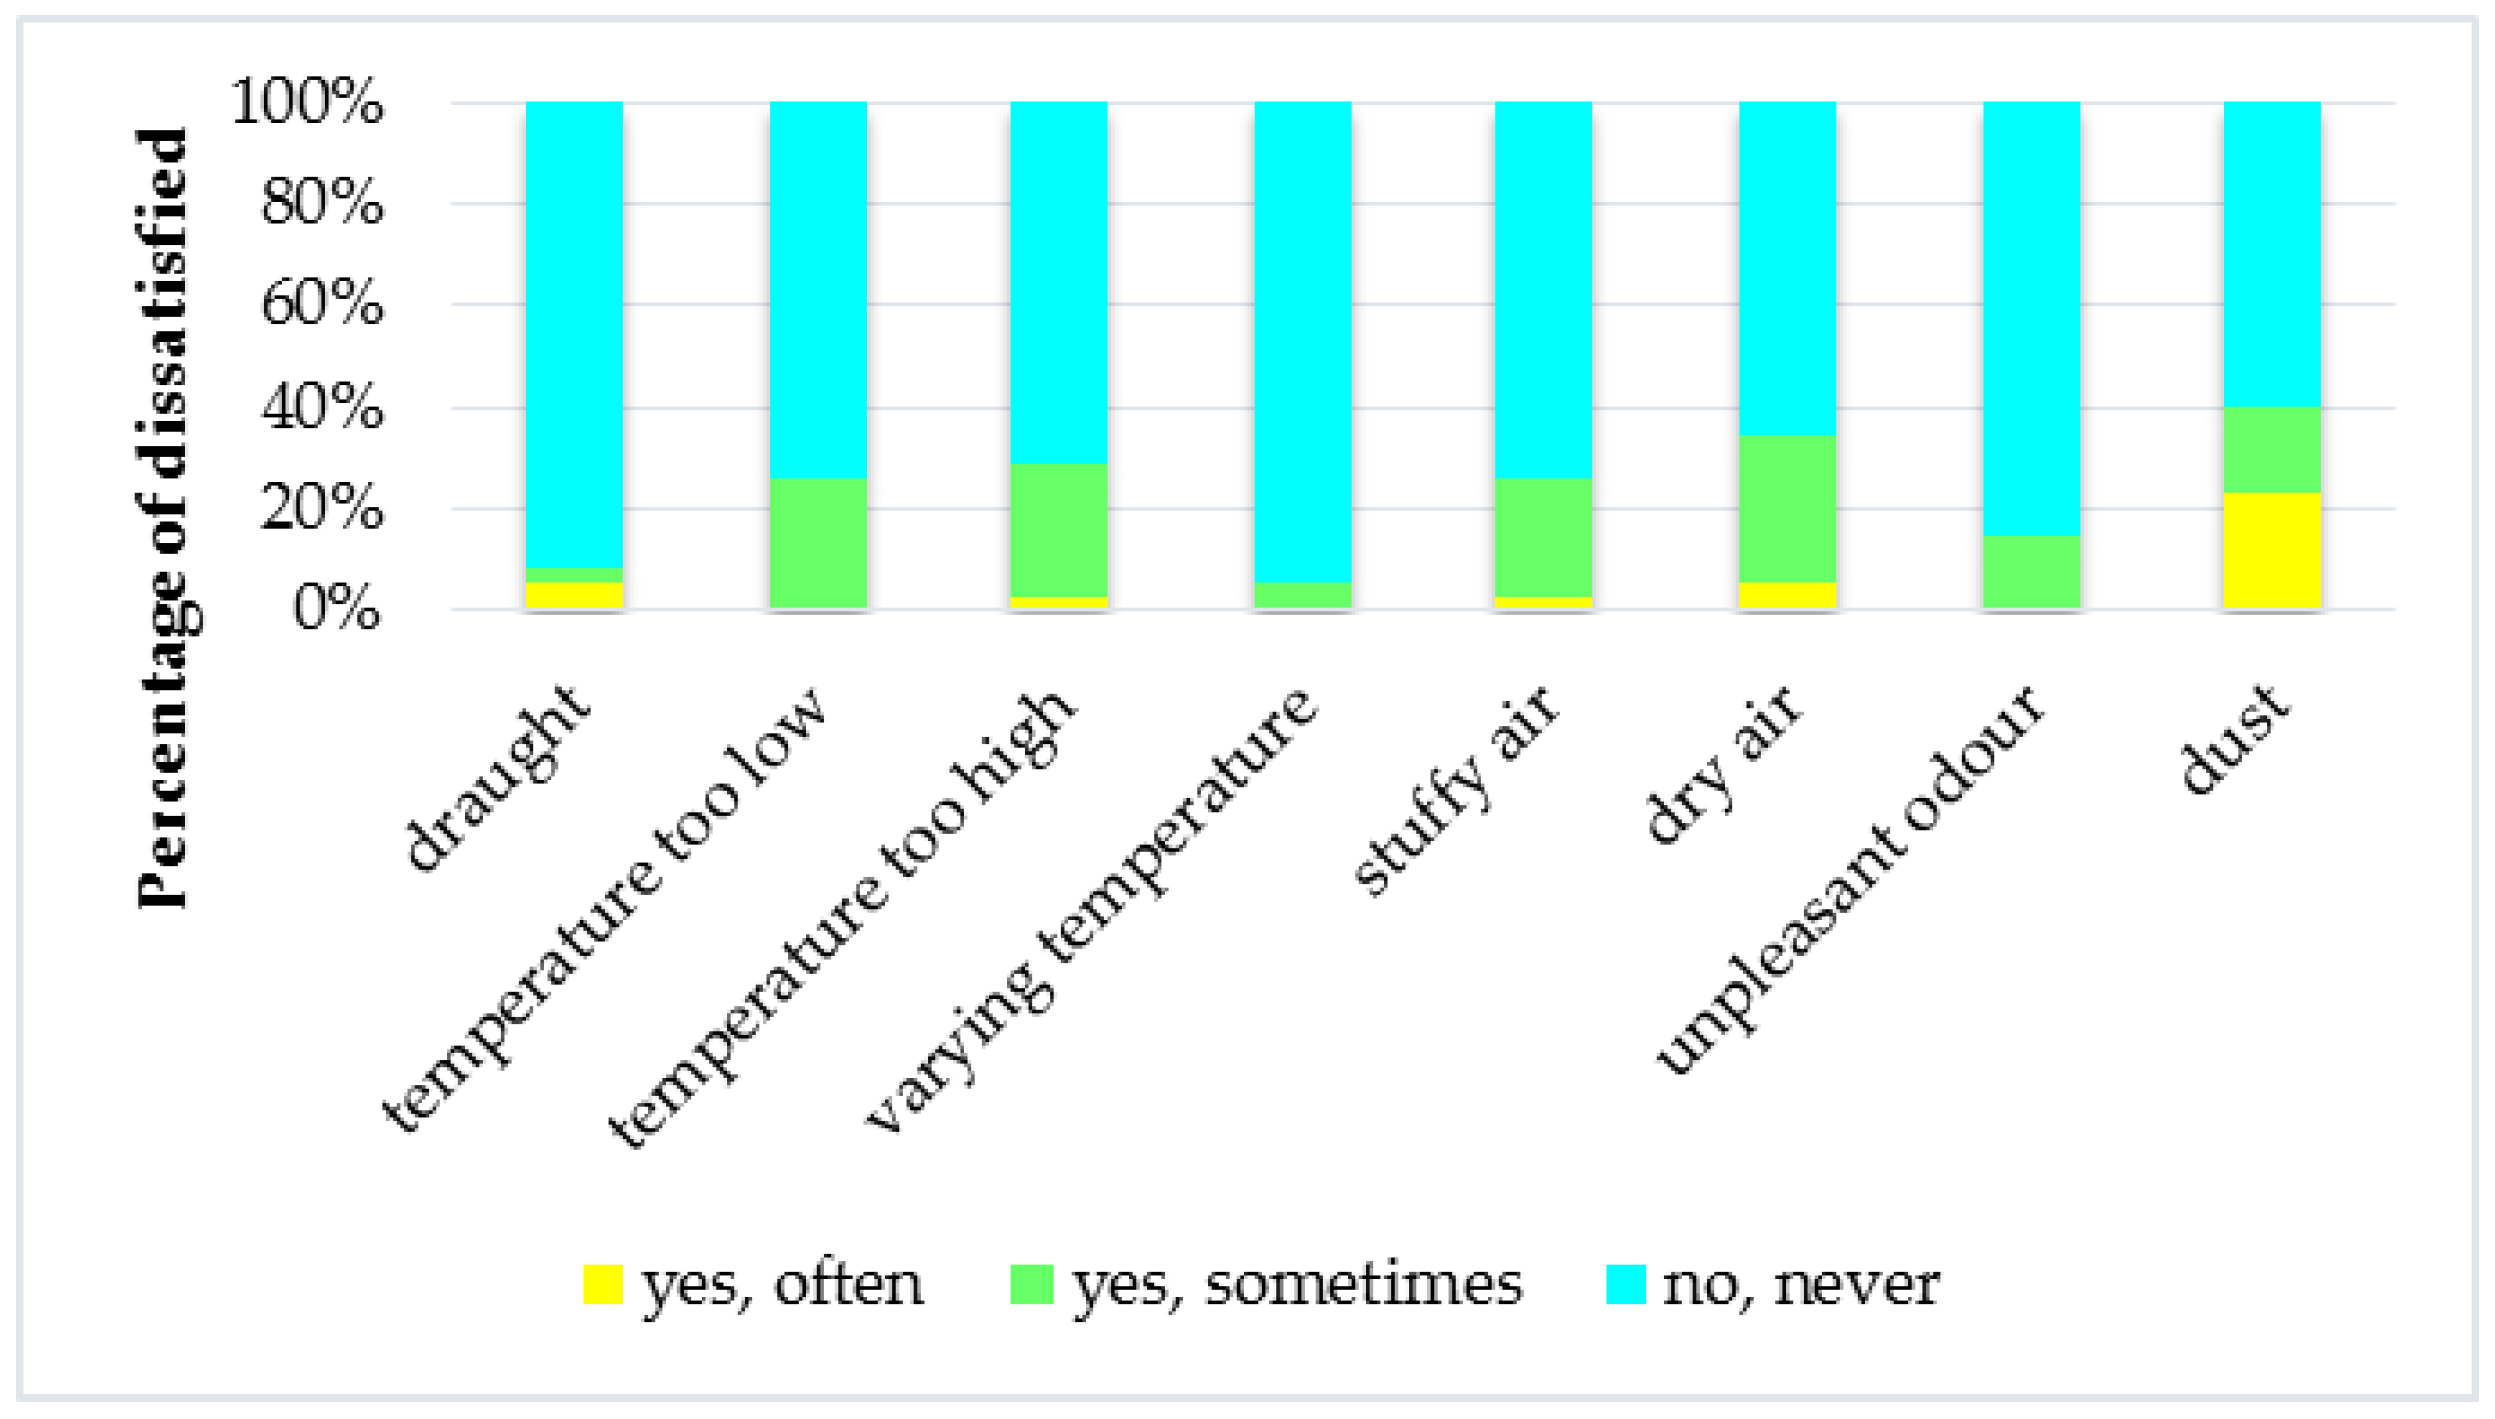
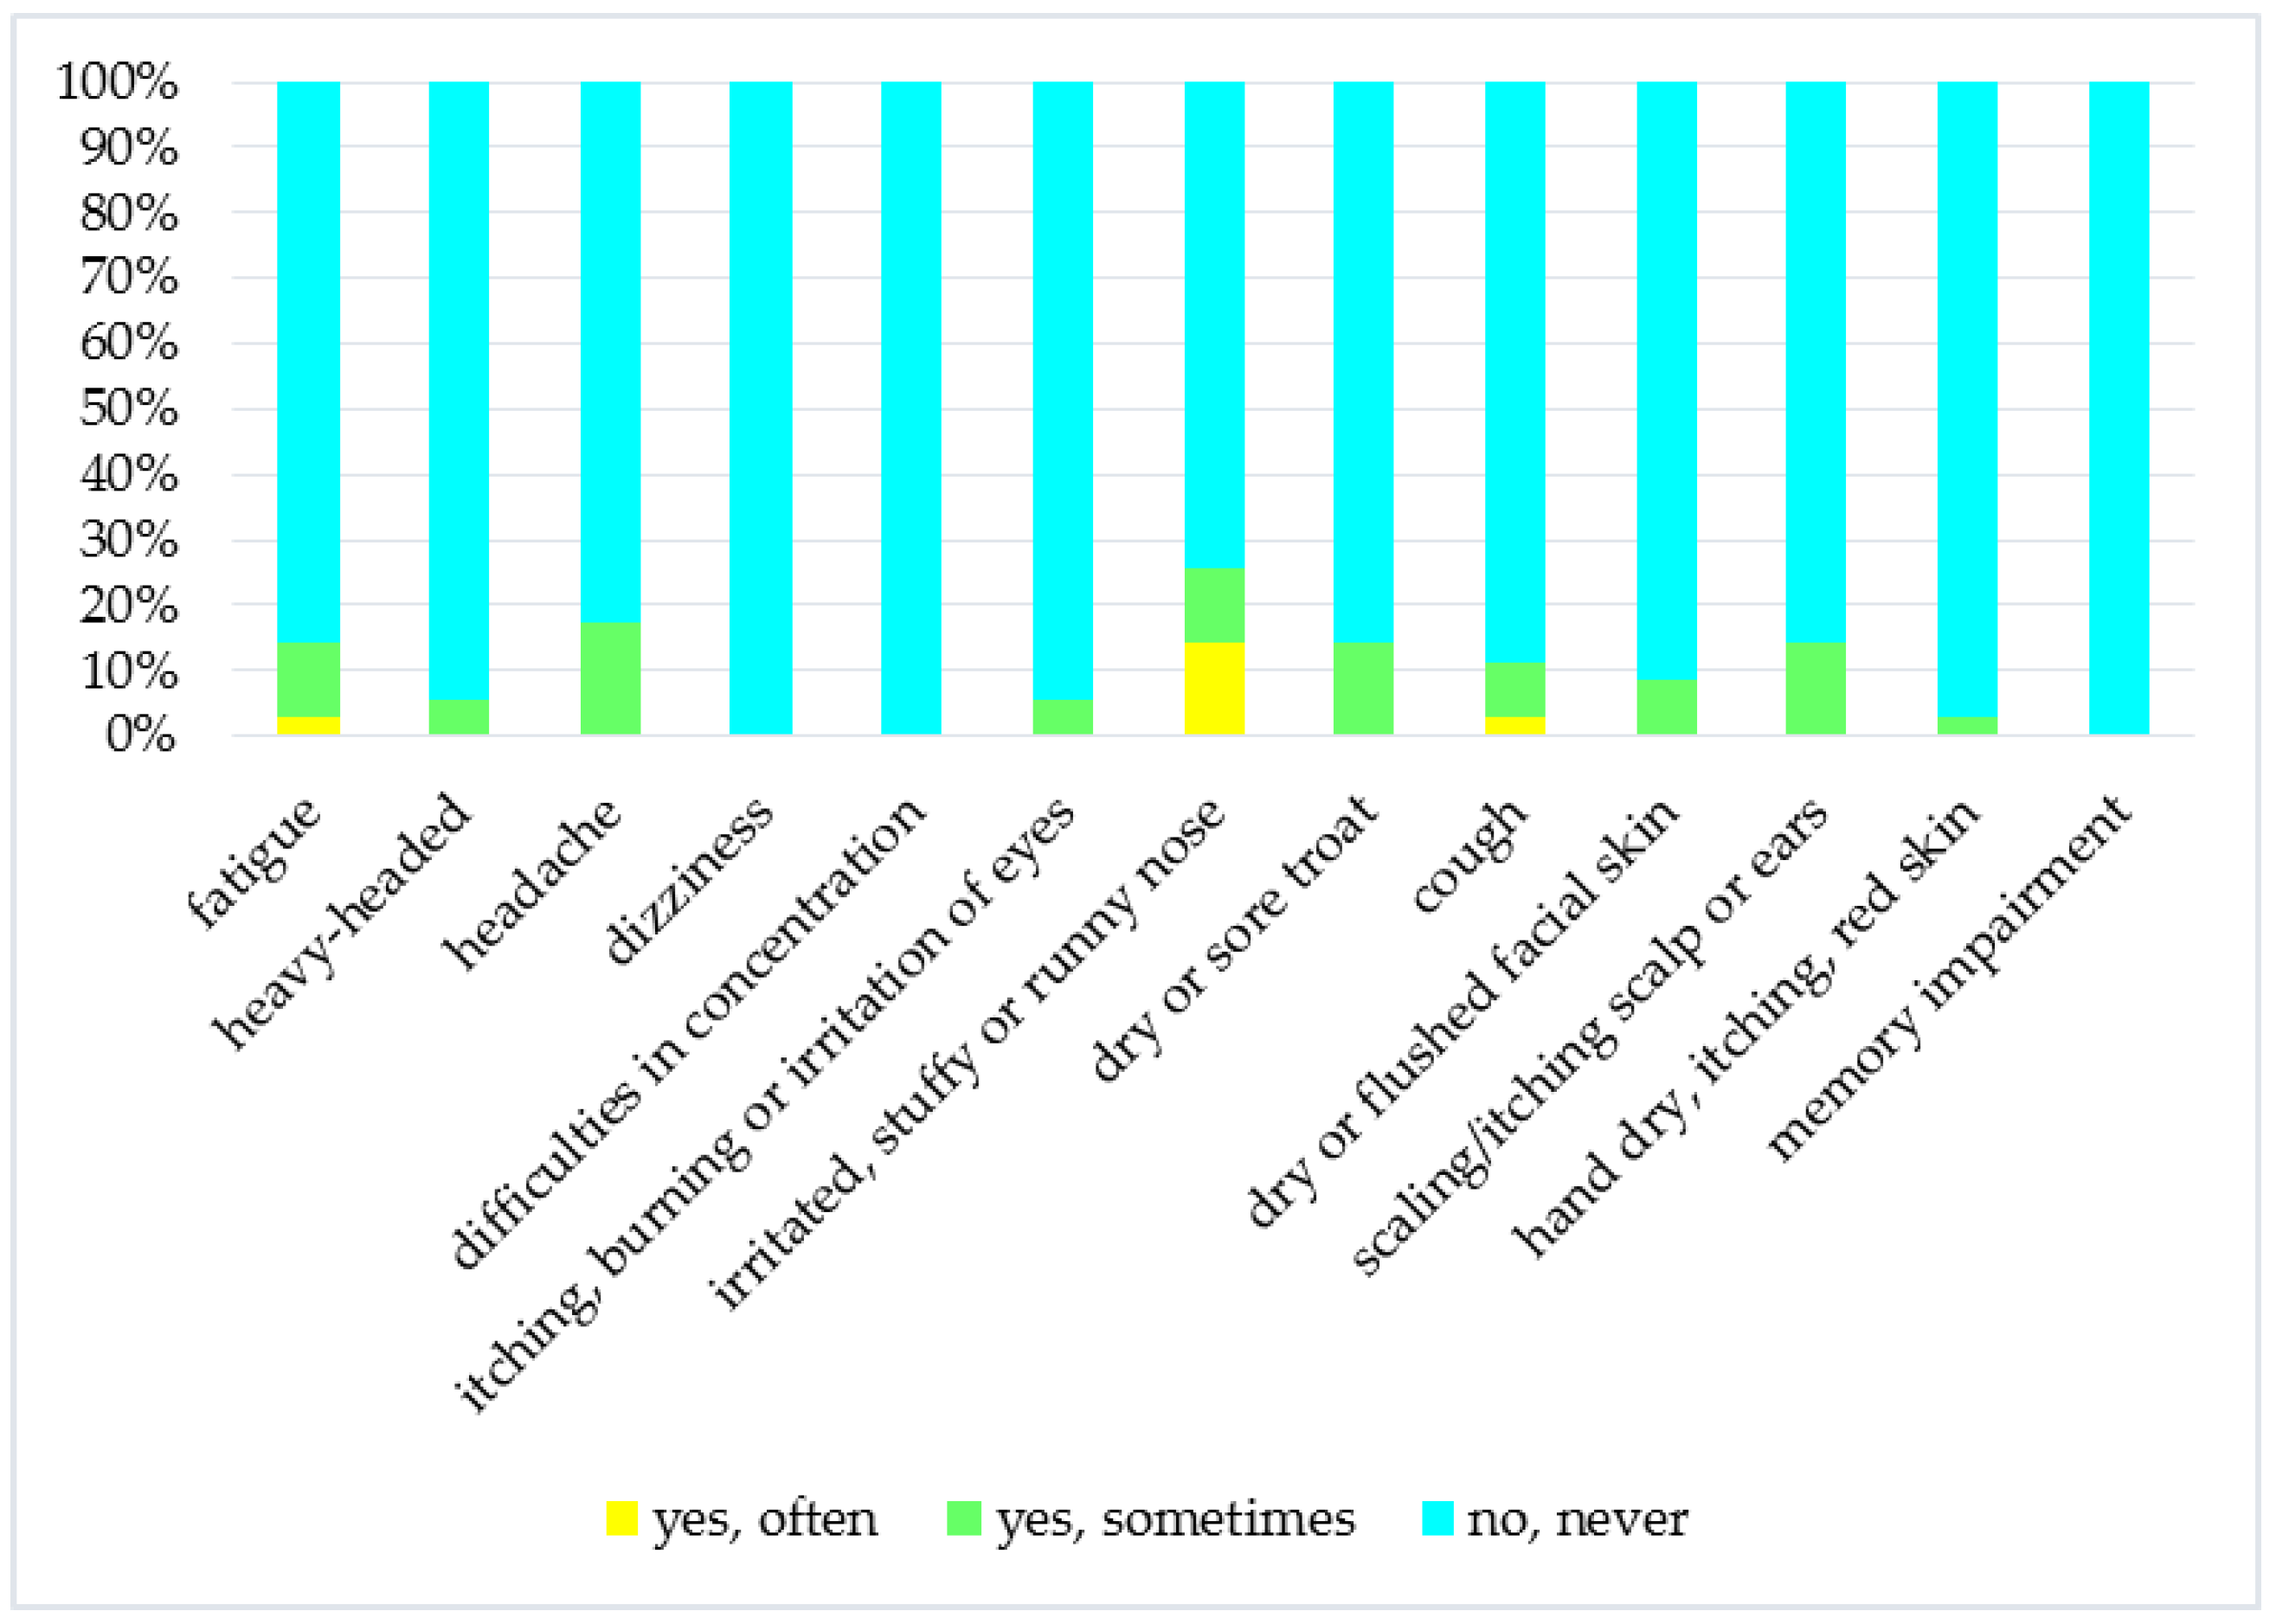
3.1. Subjective Measurement

Questionnaires were filled by 35 respondents (57.1%—women). 51.4% of persons were aged 20 to 35, 25.7% aged 36–50, 11.4% aged 51–55, and 11.4% over the age of 66. Smokers represent 31.4% of respondents. The largest group (45.7%) consisted of households with the number of occupants ≤2 people followed by a group with 3–4 people (34.3%) and a group with number of households users greater than 4 (20%). 85.7% of respondents spend more than 12 h a day at home. Only 8.6% of people completing the questionnaire have a doctor diagnosed asthma and 34.3% have a doctor diagnosed allergy. Figure 2 illustrates the percentage of households that have a problem with factors affecting of IEQ as a draught, temperature too low, temperature too high or varying temperature, stuffy air, unpleasant odour, and dust. As can be seen, the biggest problem in households was dry air and dust. In case of SBS symptoms prevalence, it can be concluded that in households their occurrence is rare (Figure 3).
The most common symptom was irritated or stuffy nose. Comparing the results from monitoring of physical and chemical factors with the results of the questionnaire survey, it was found that users rated individual factors of IEQ more mildly than usual in other types of environment (for example in workplace).

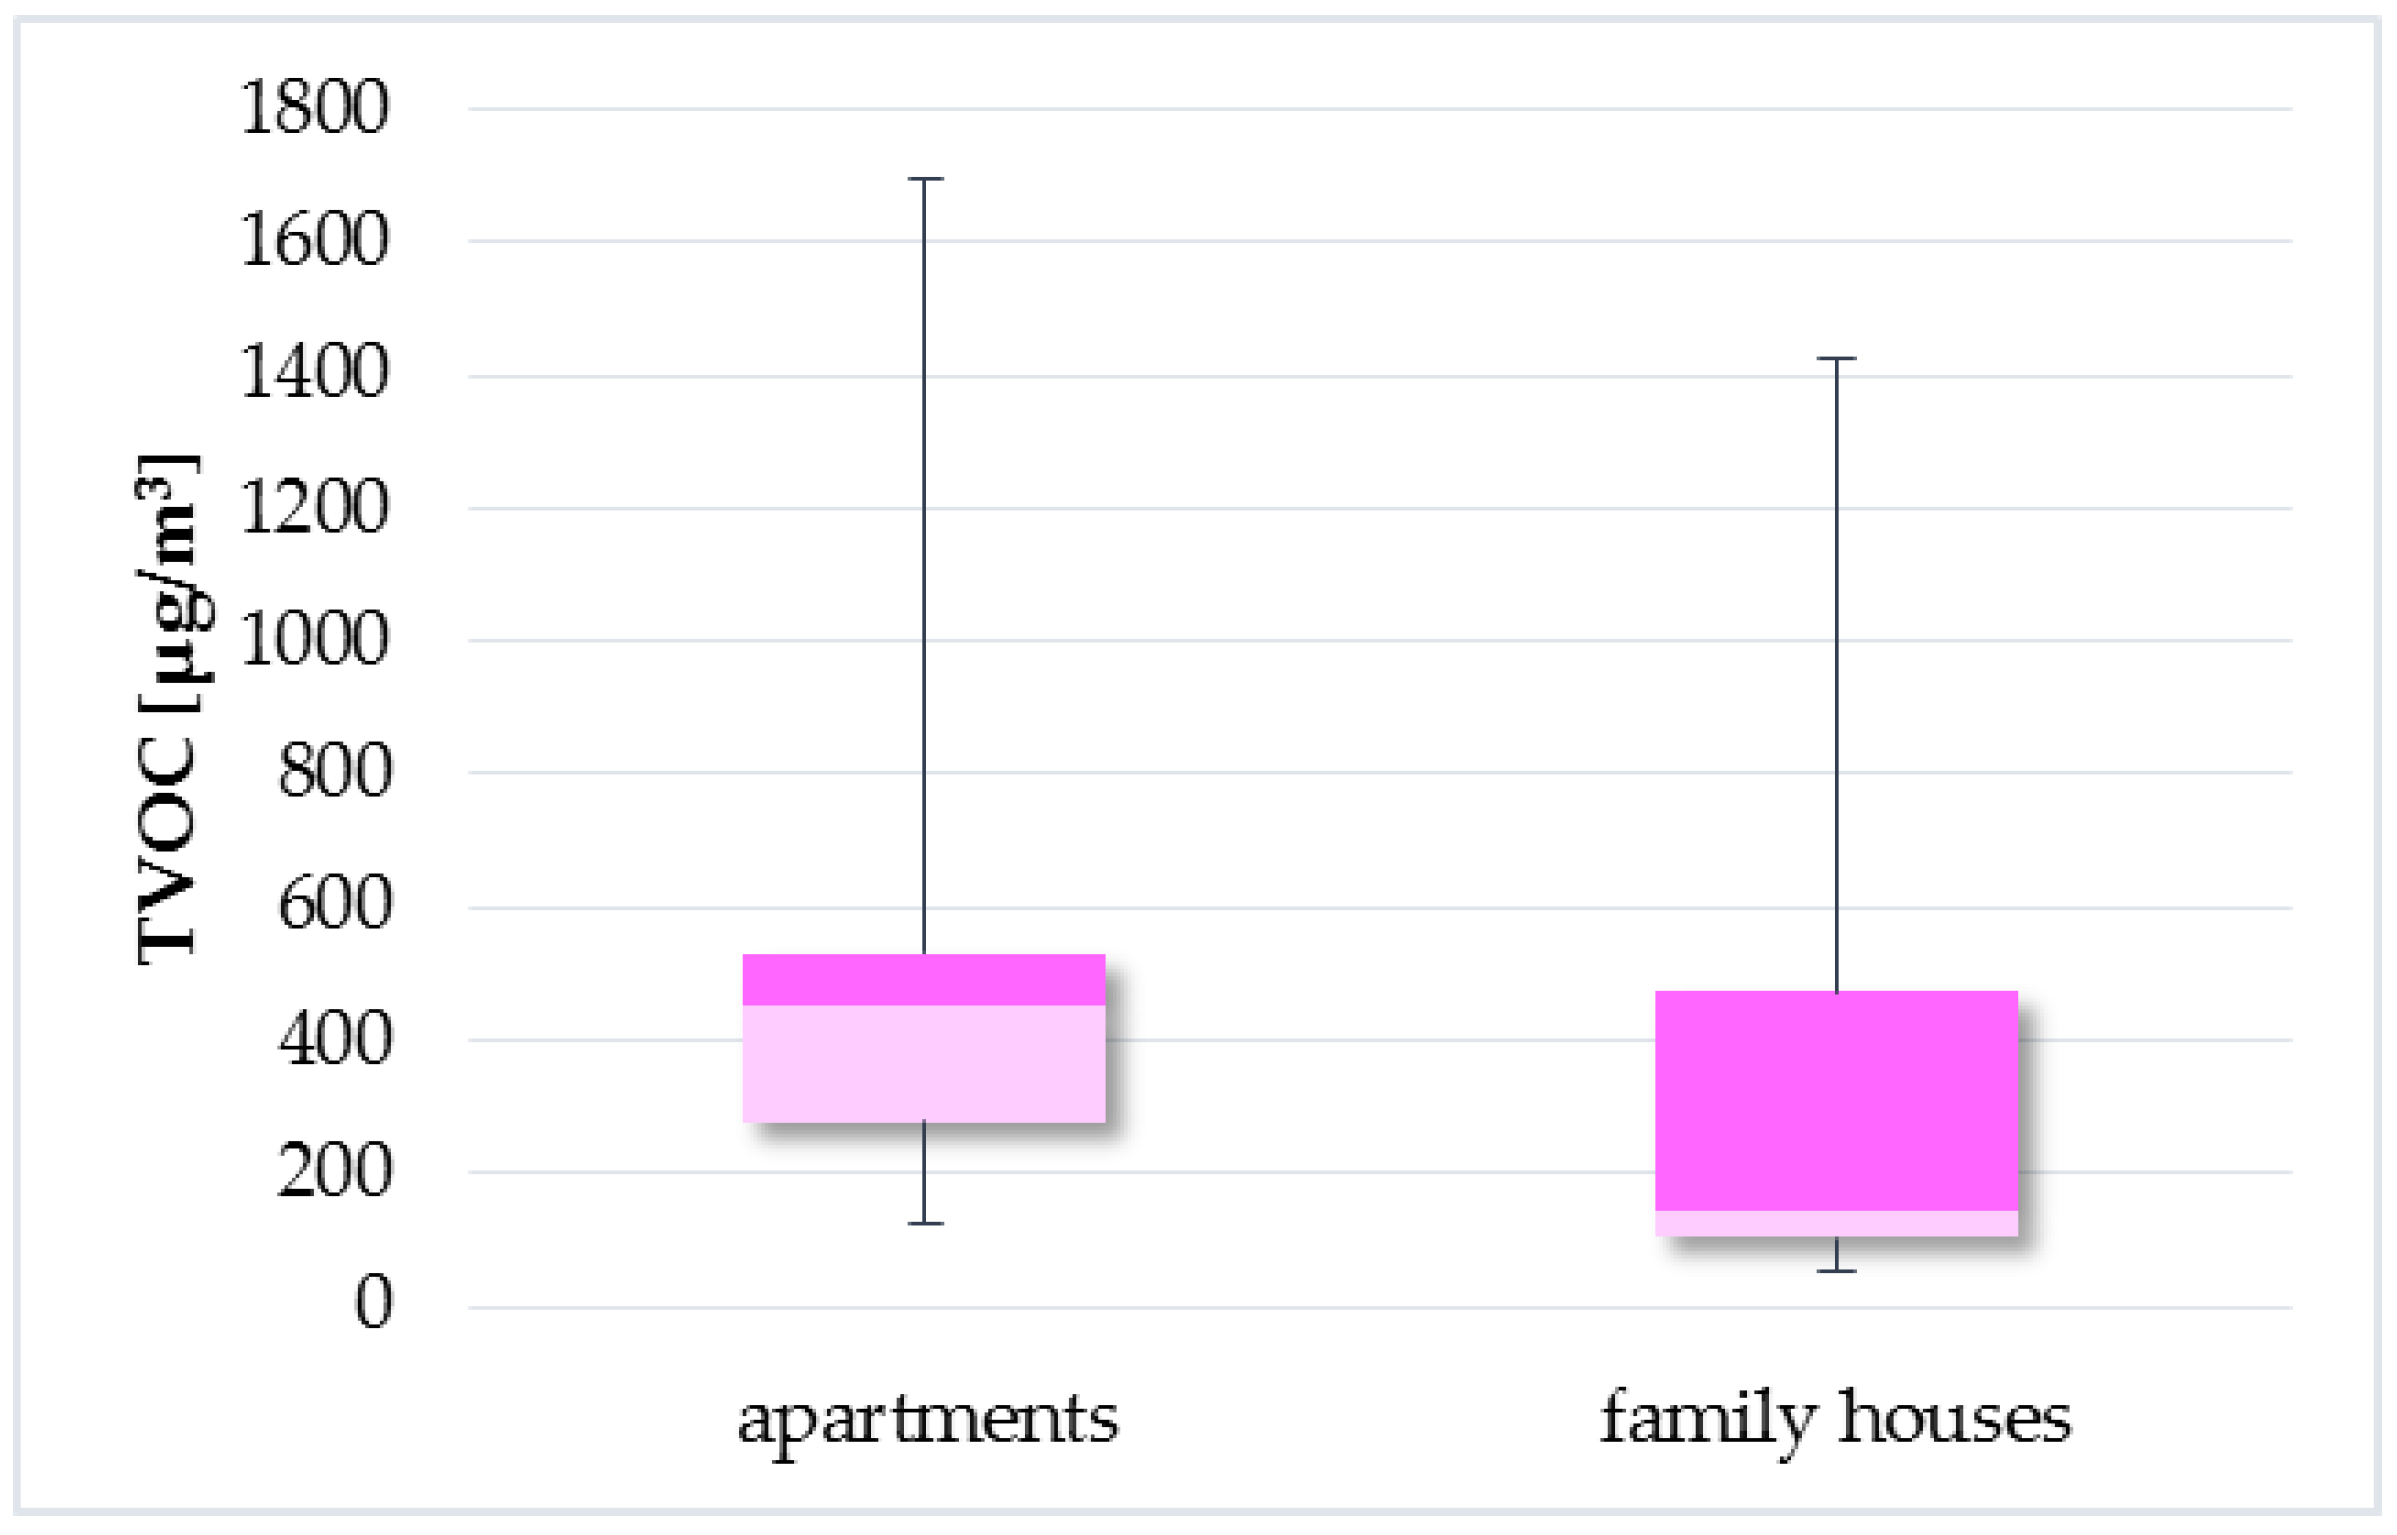
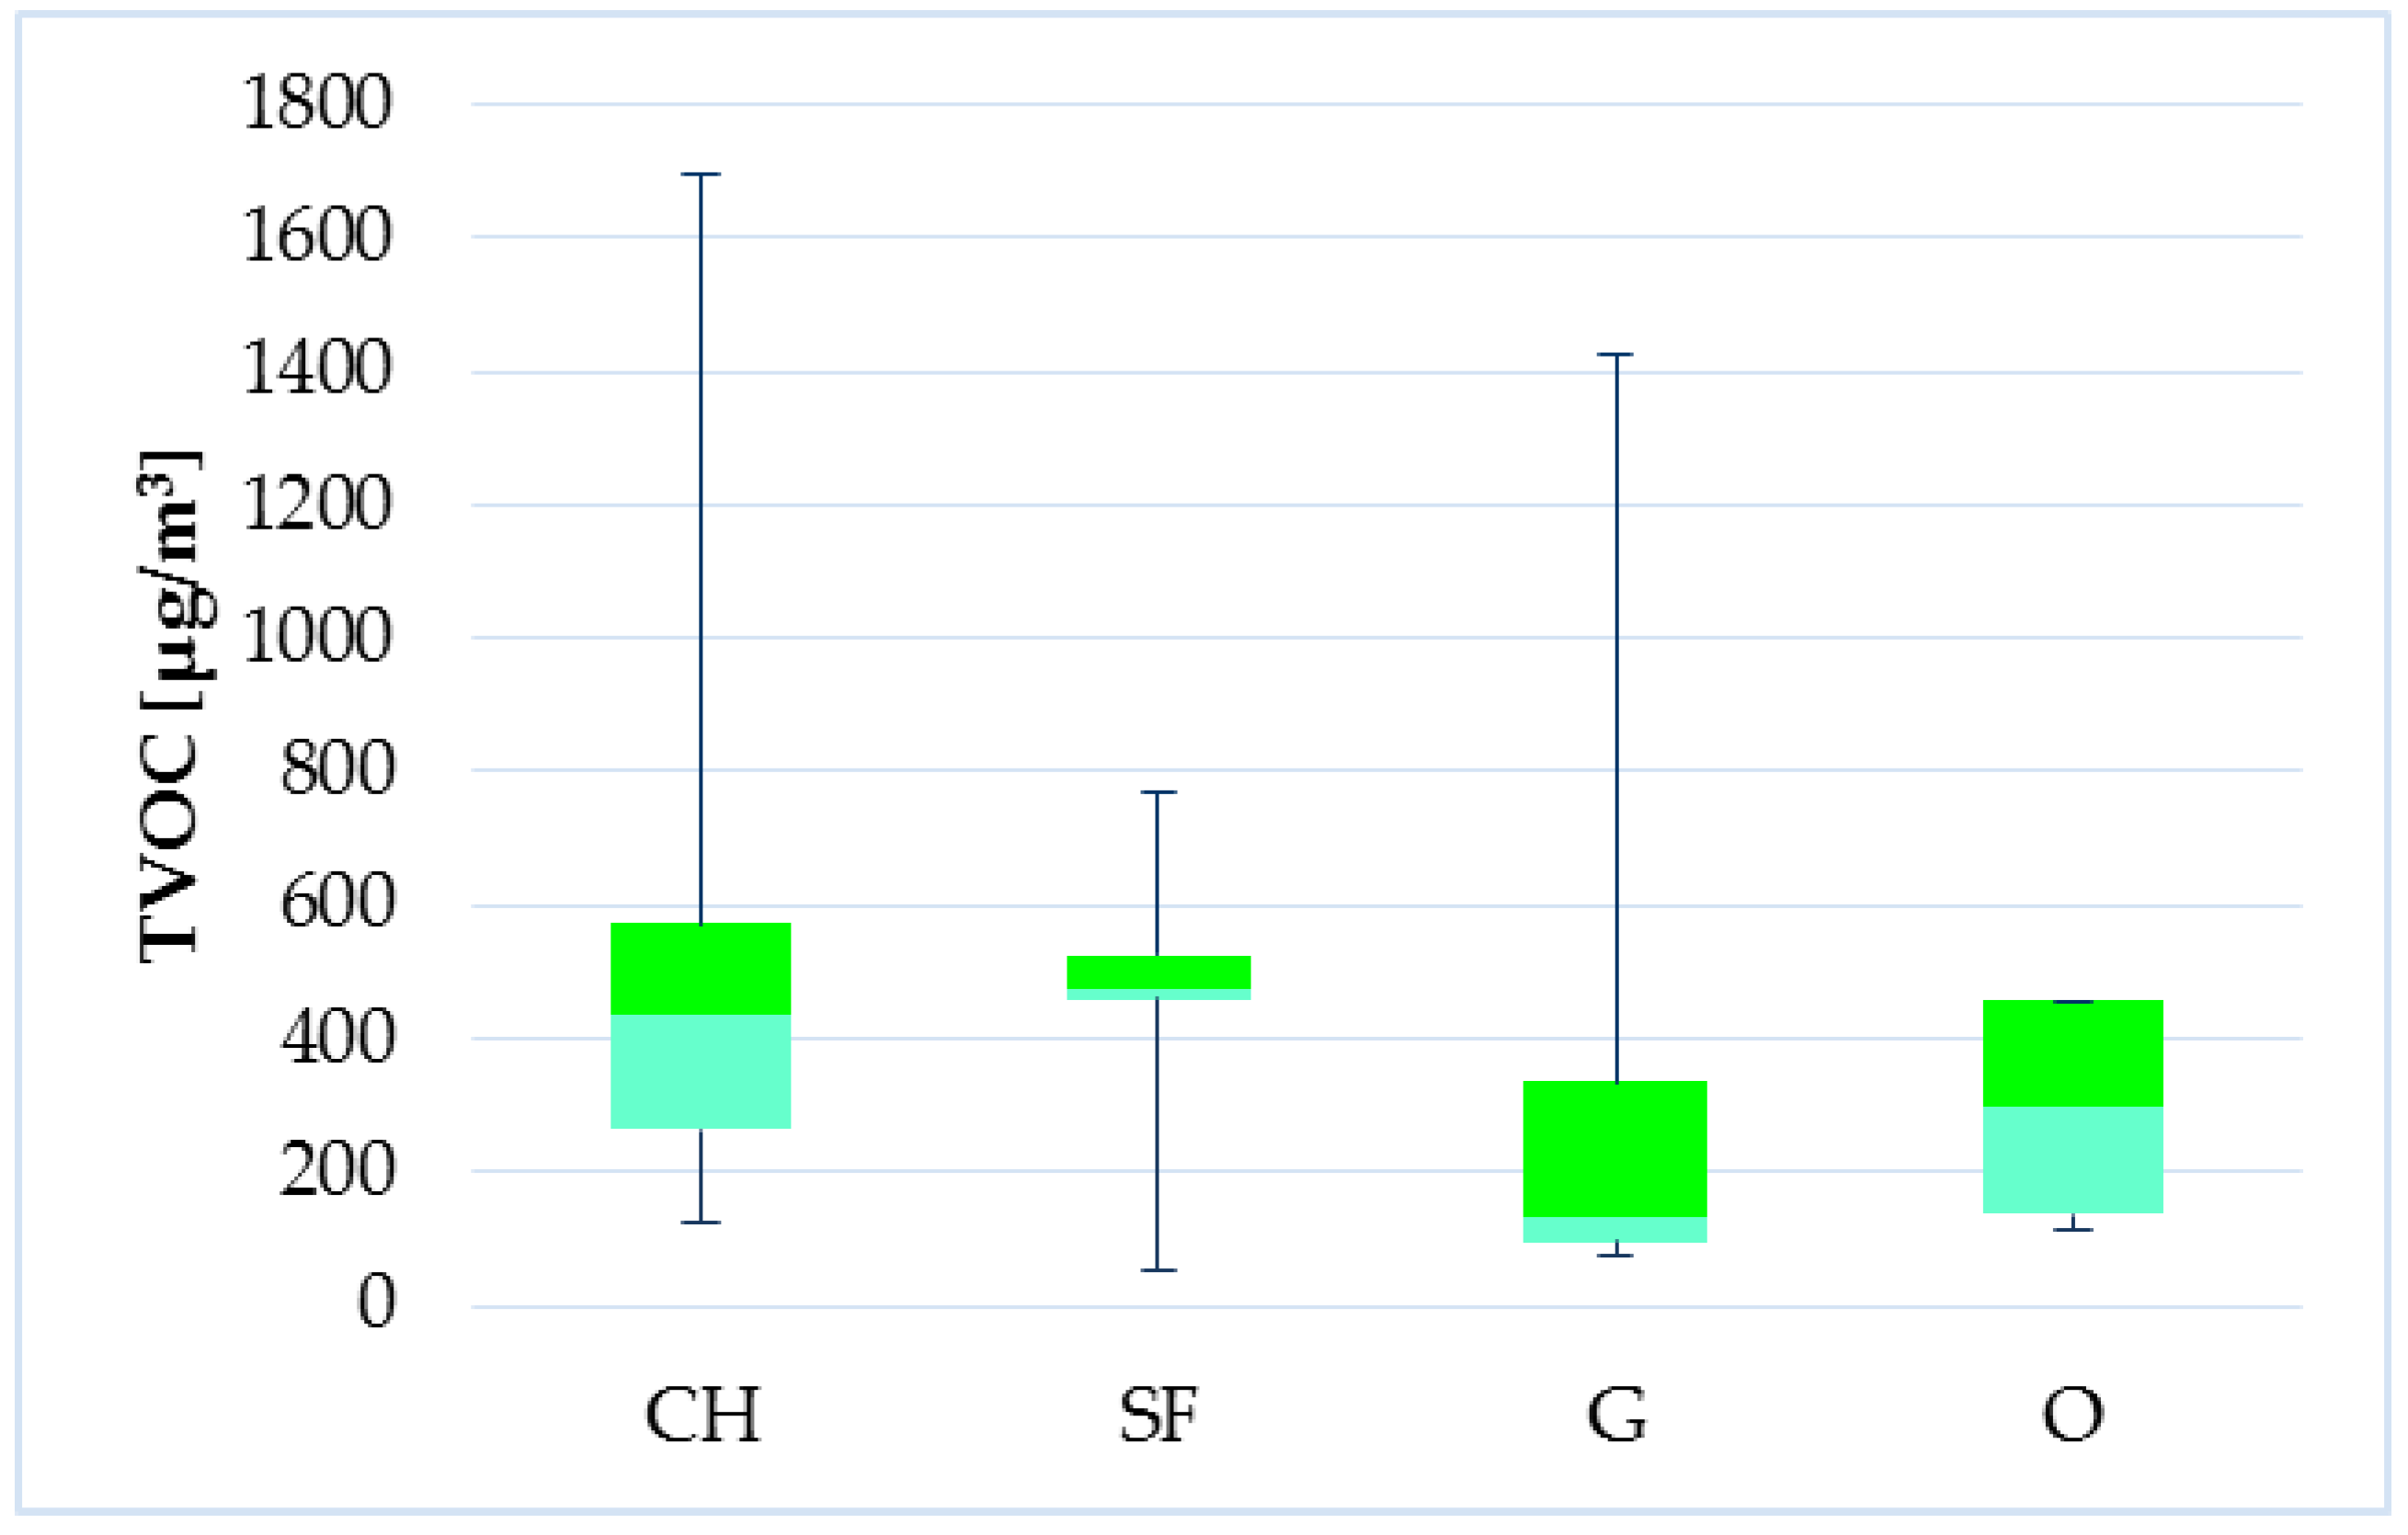
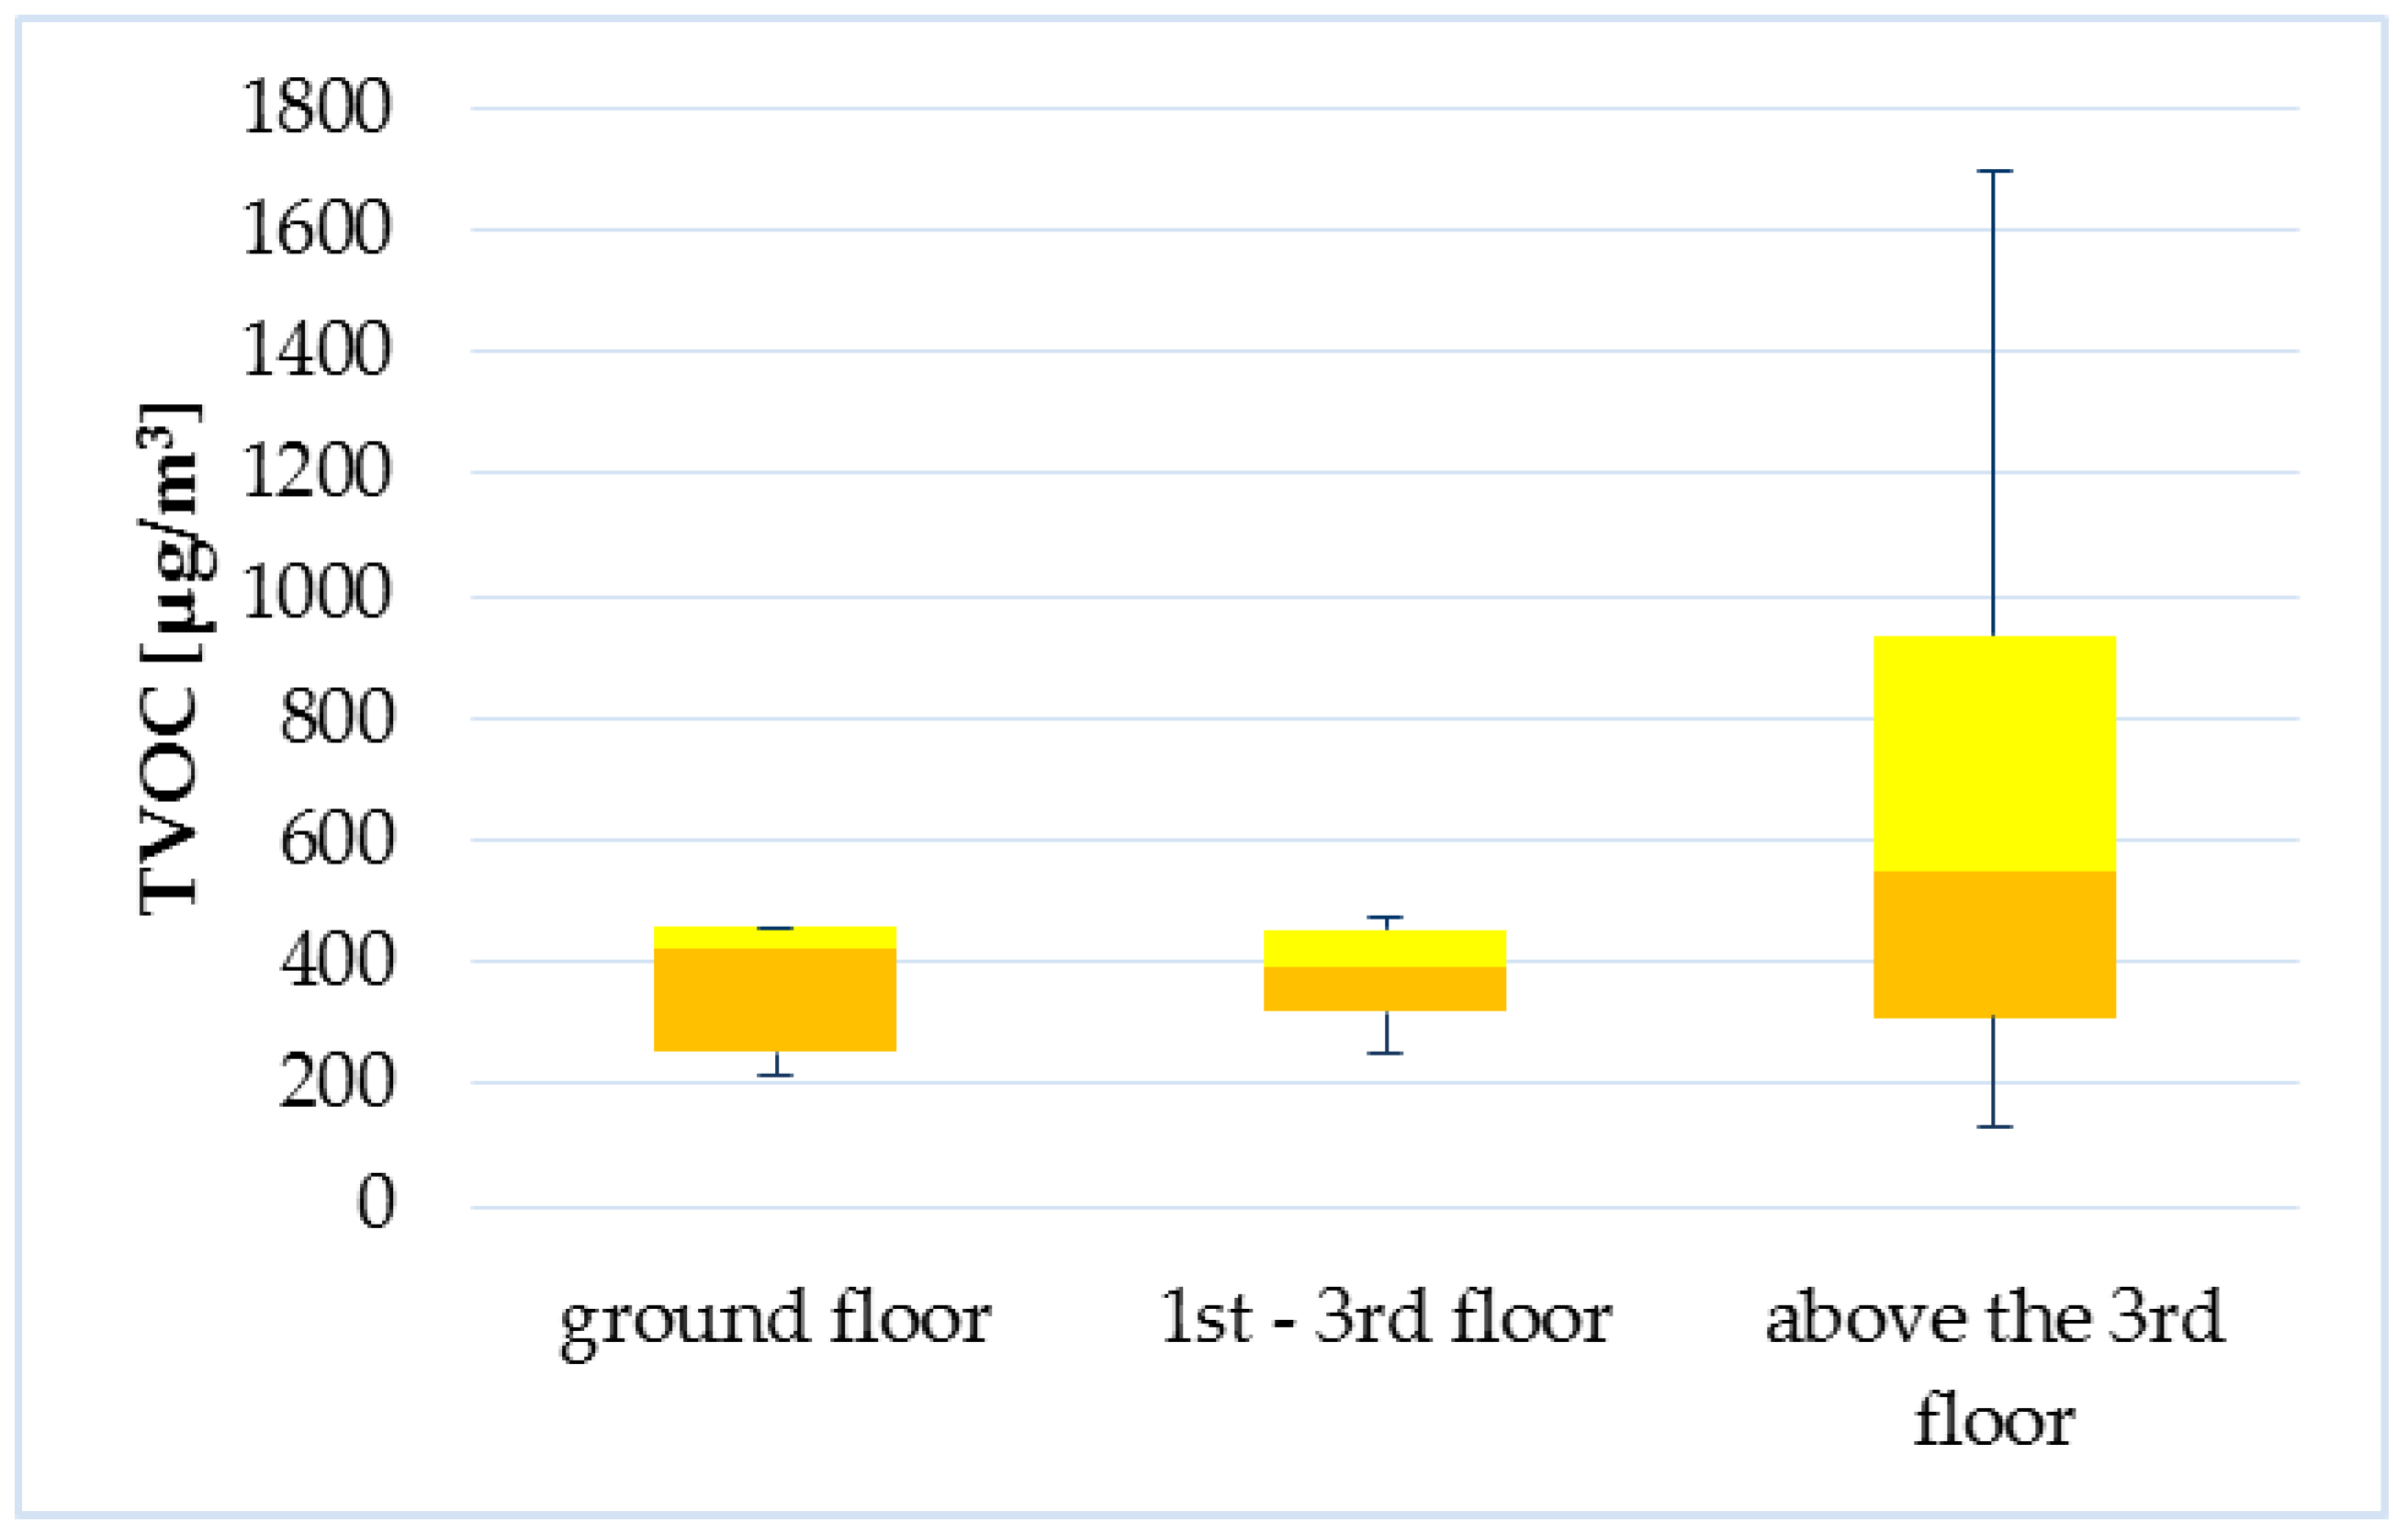
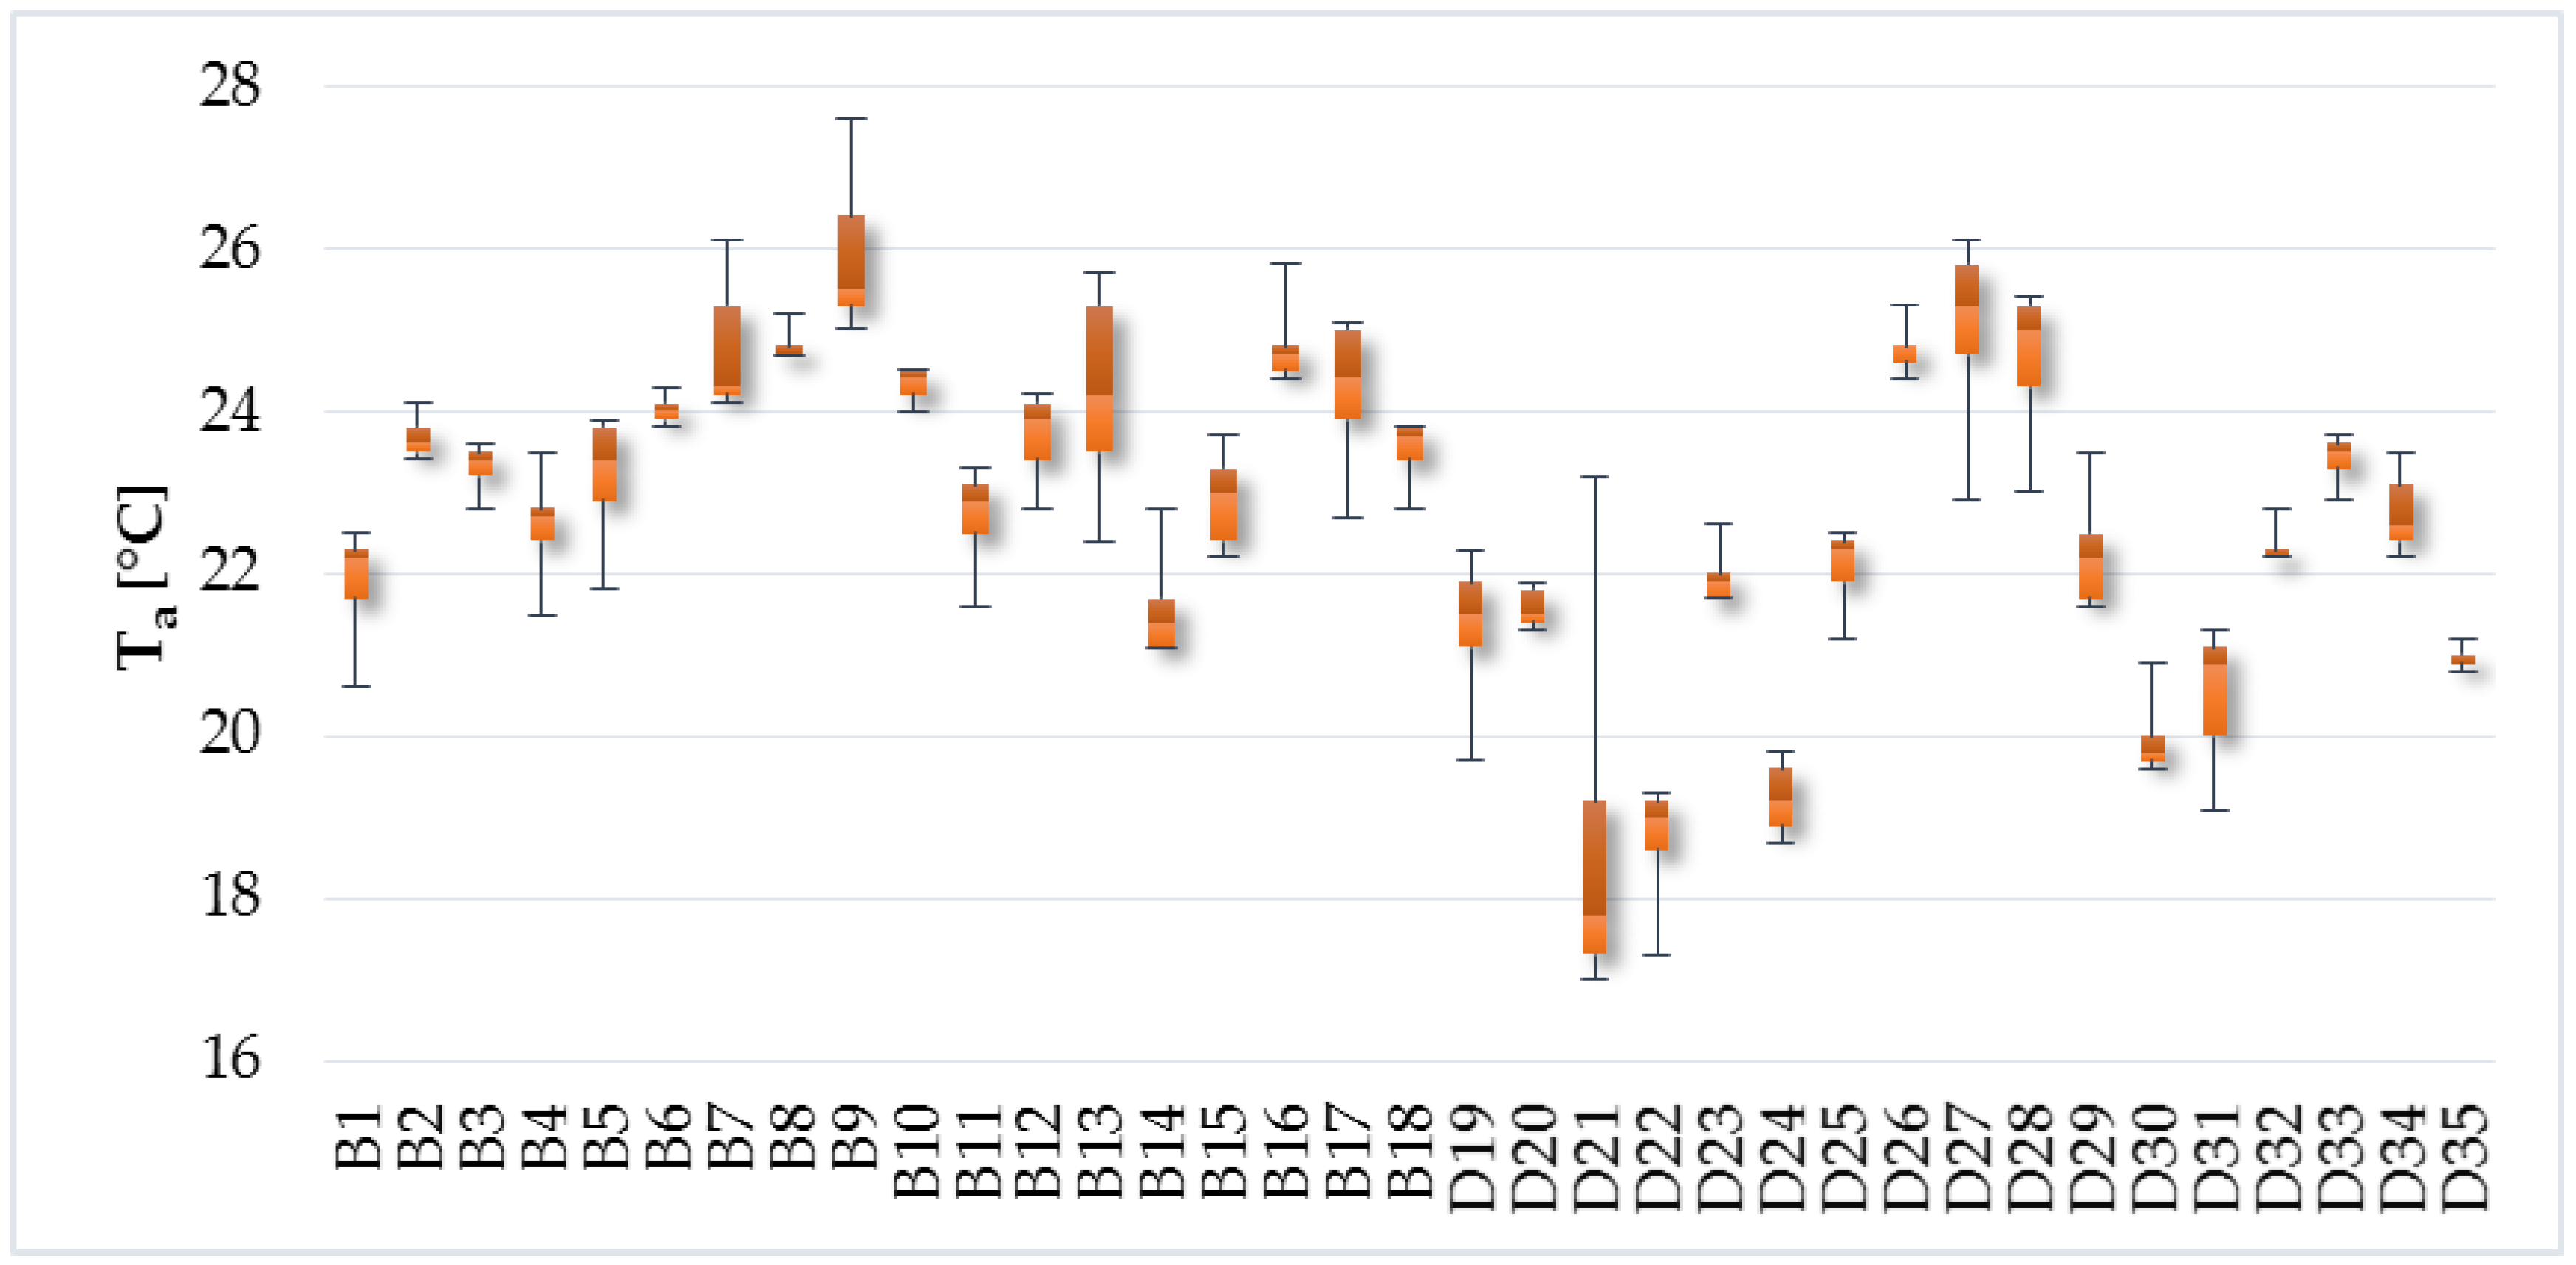
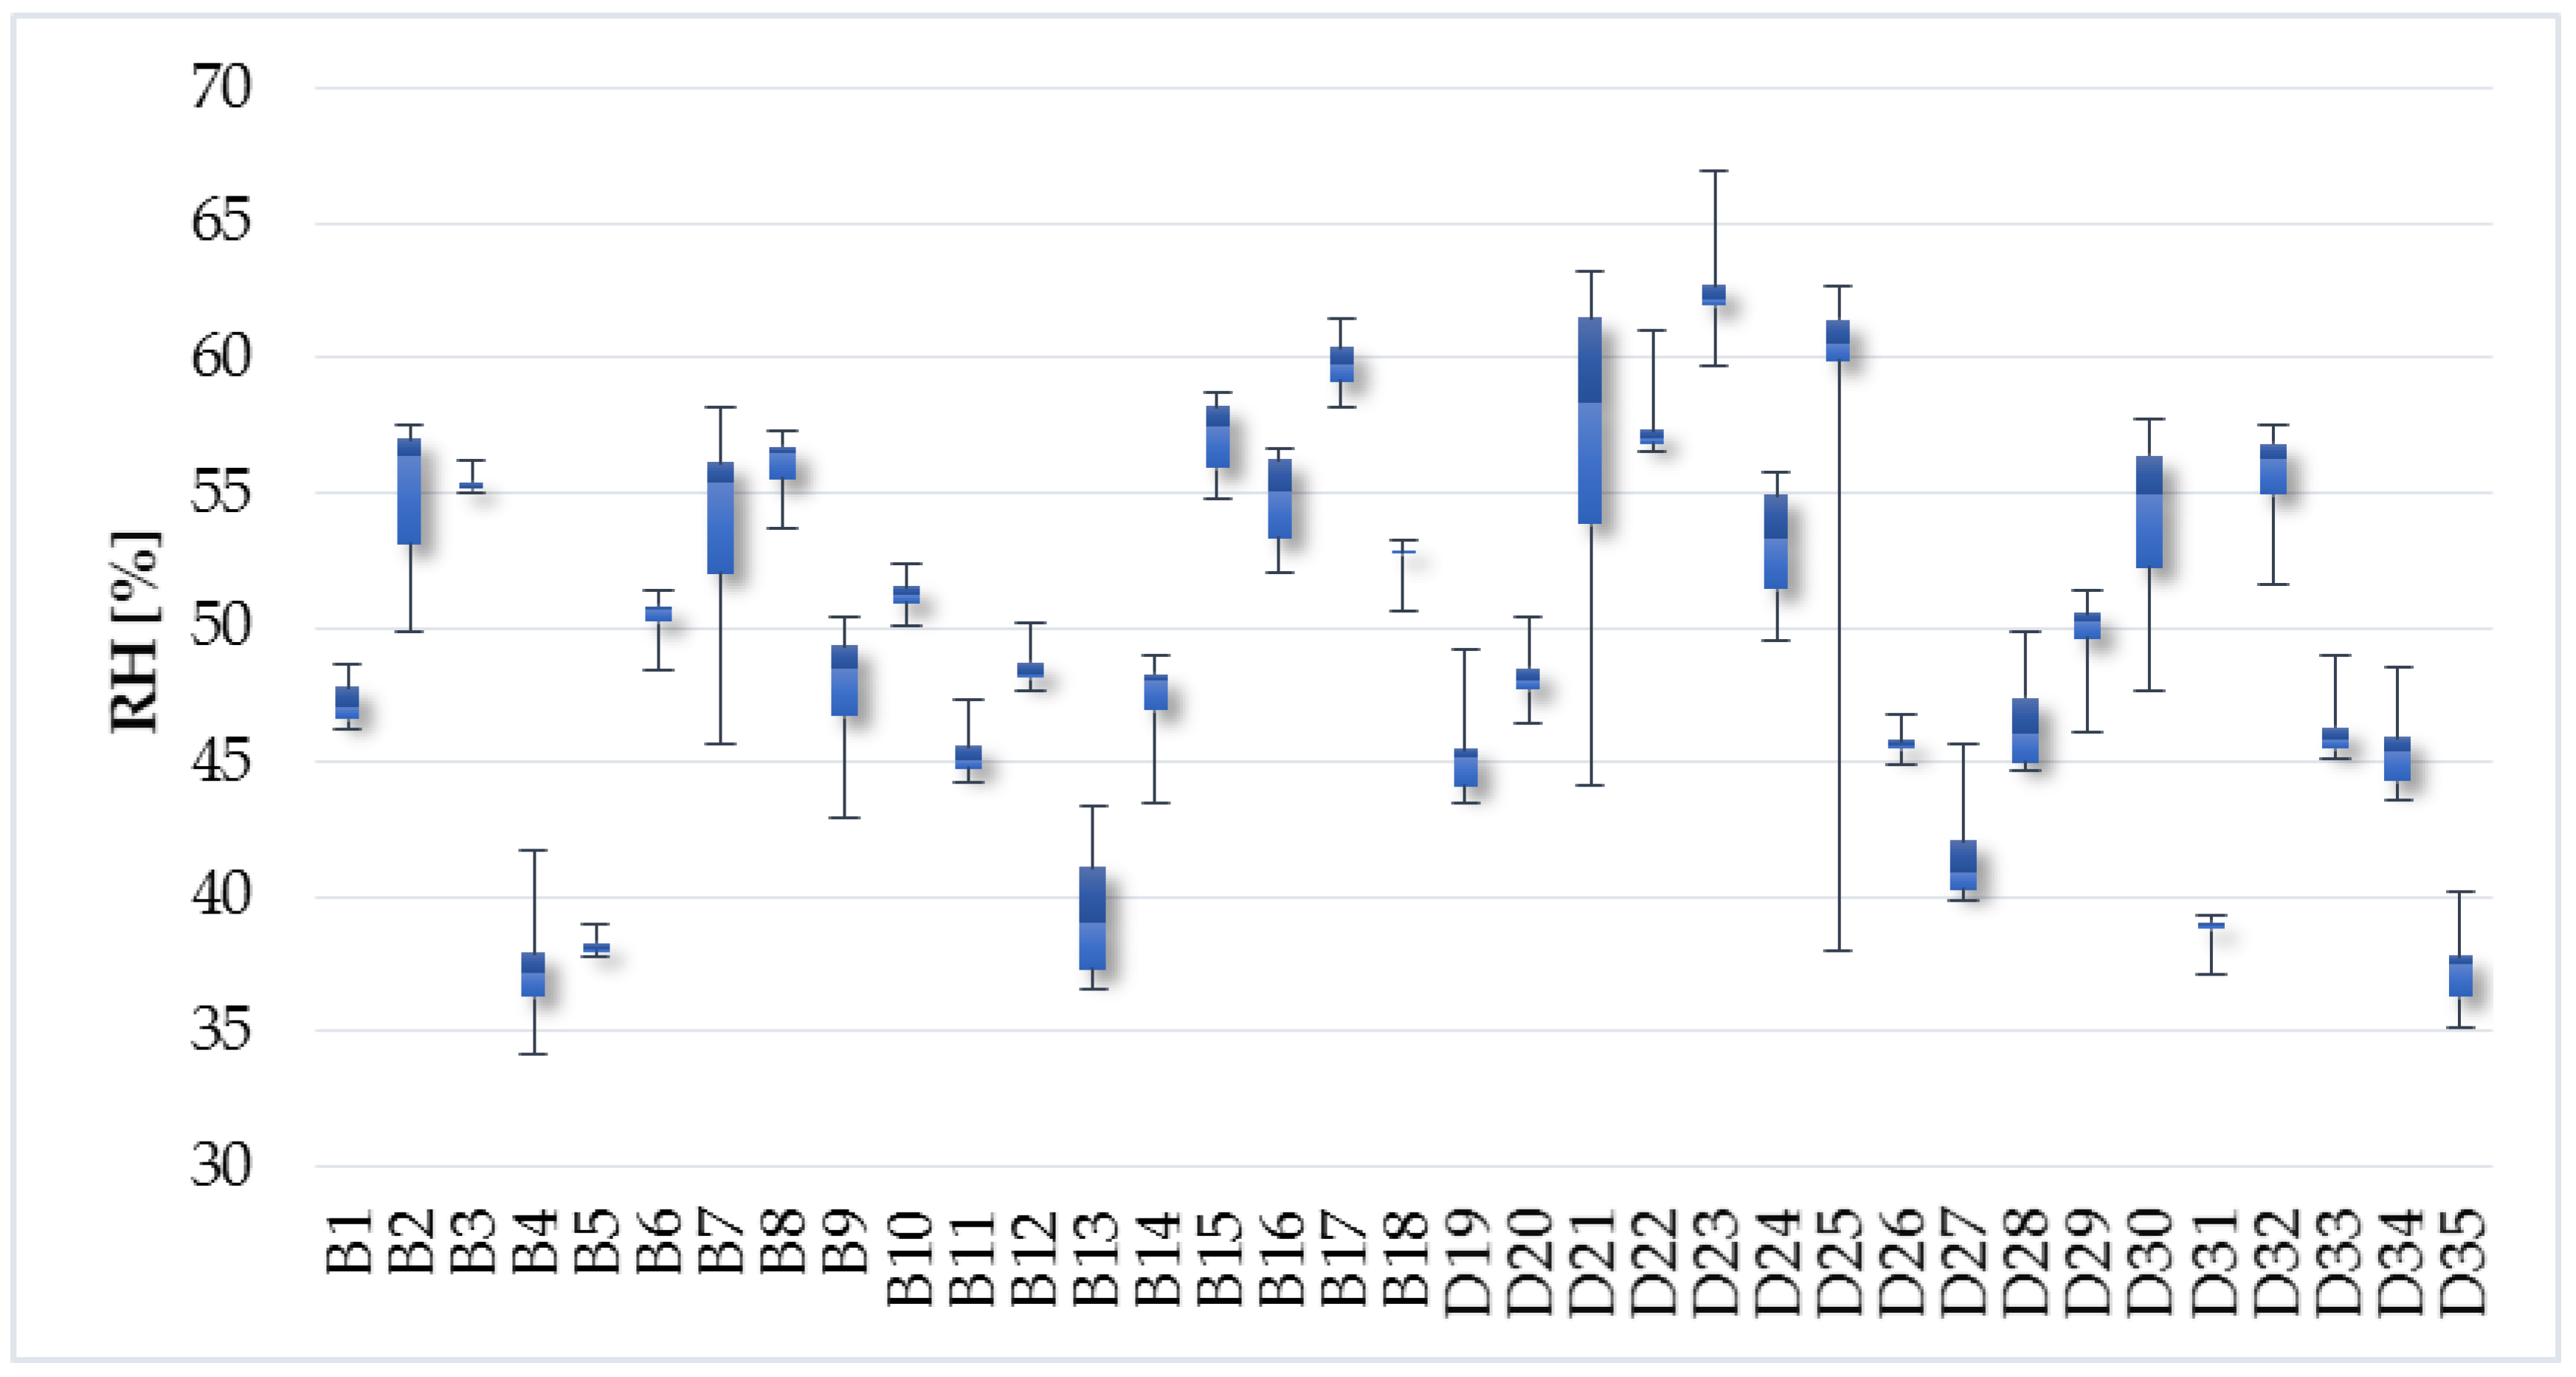
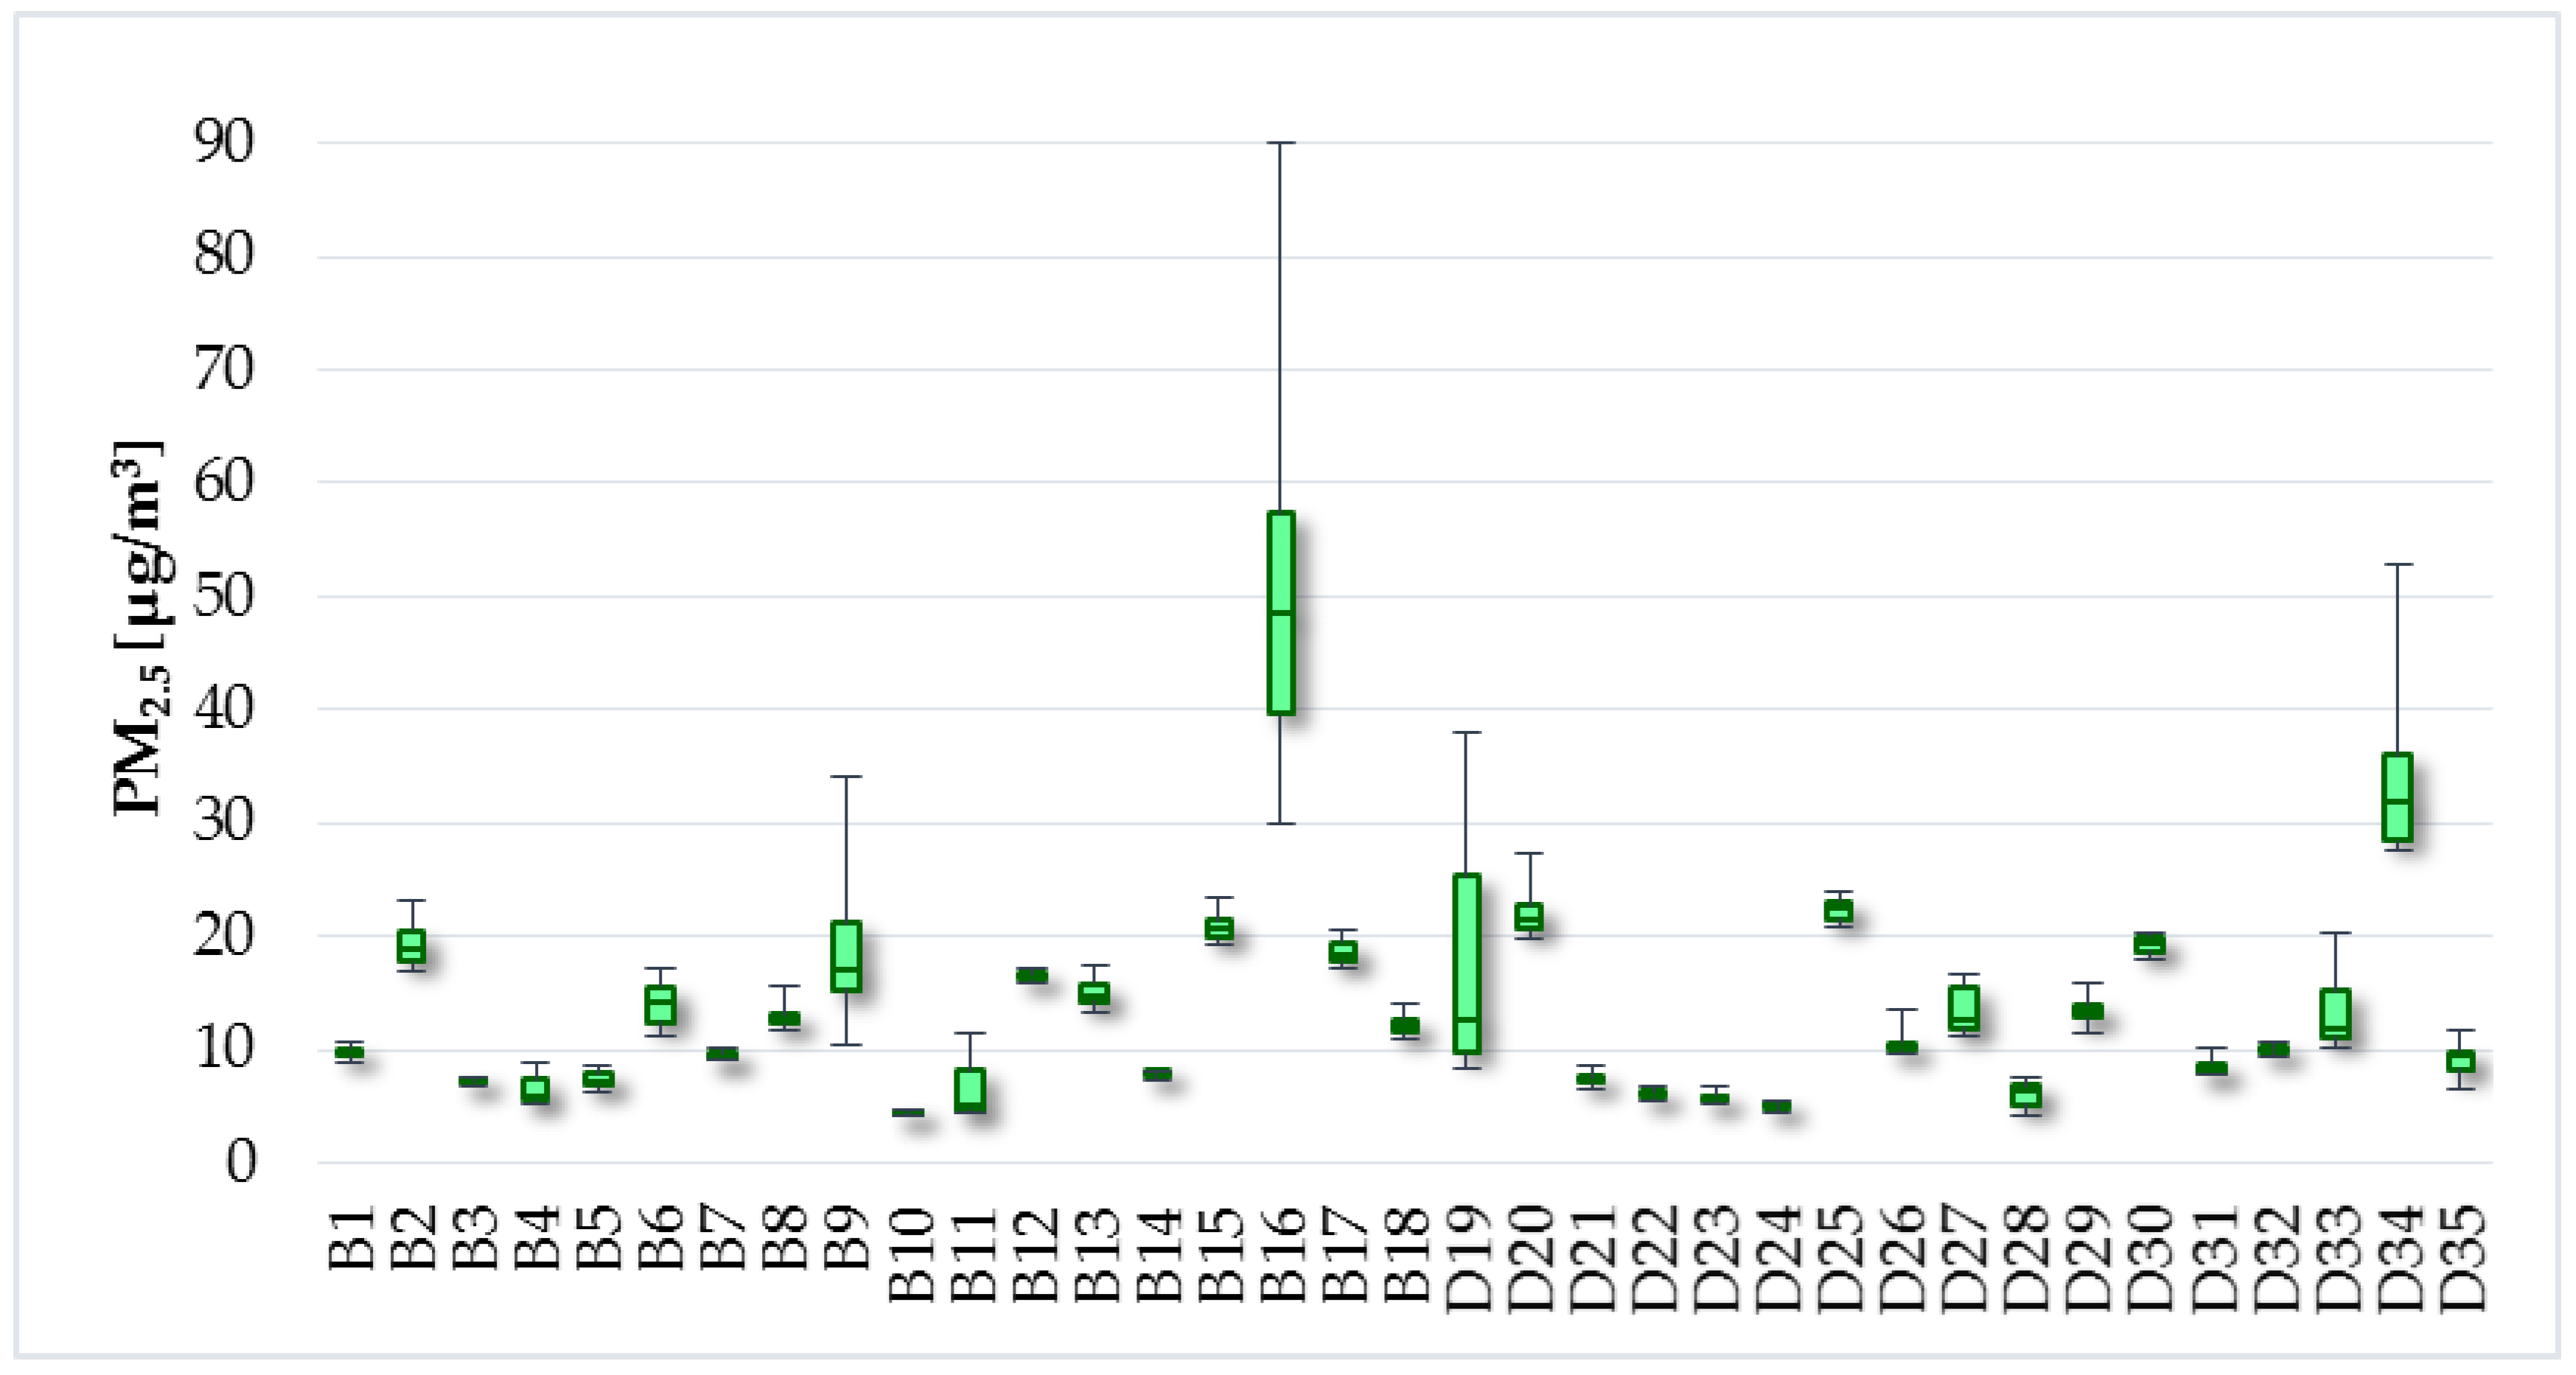
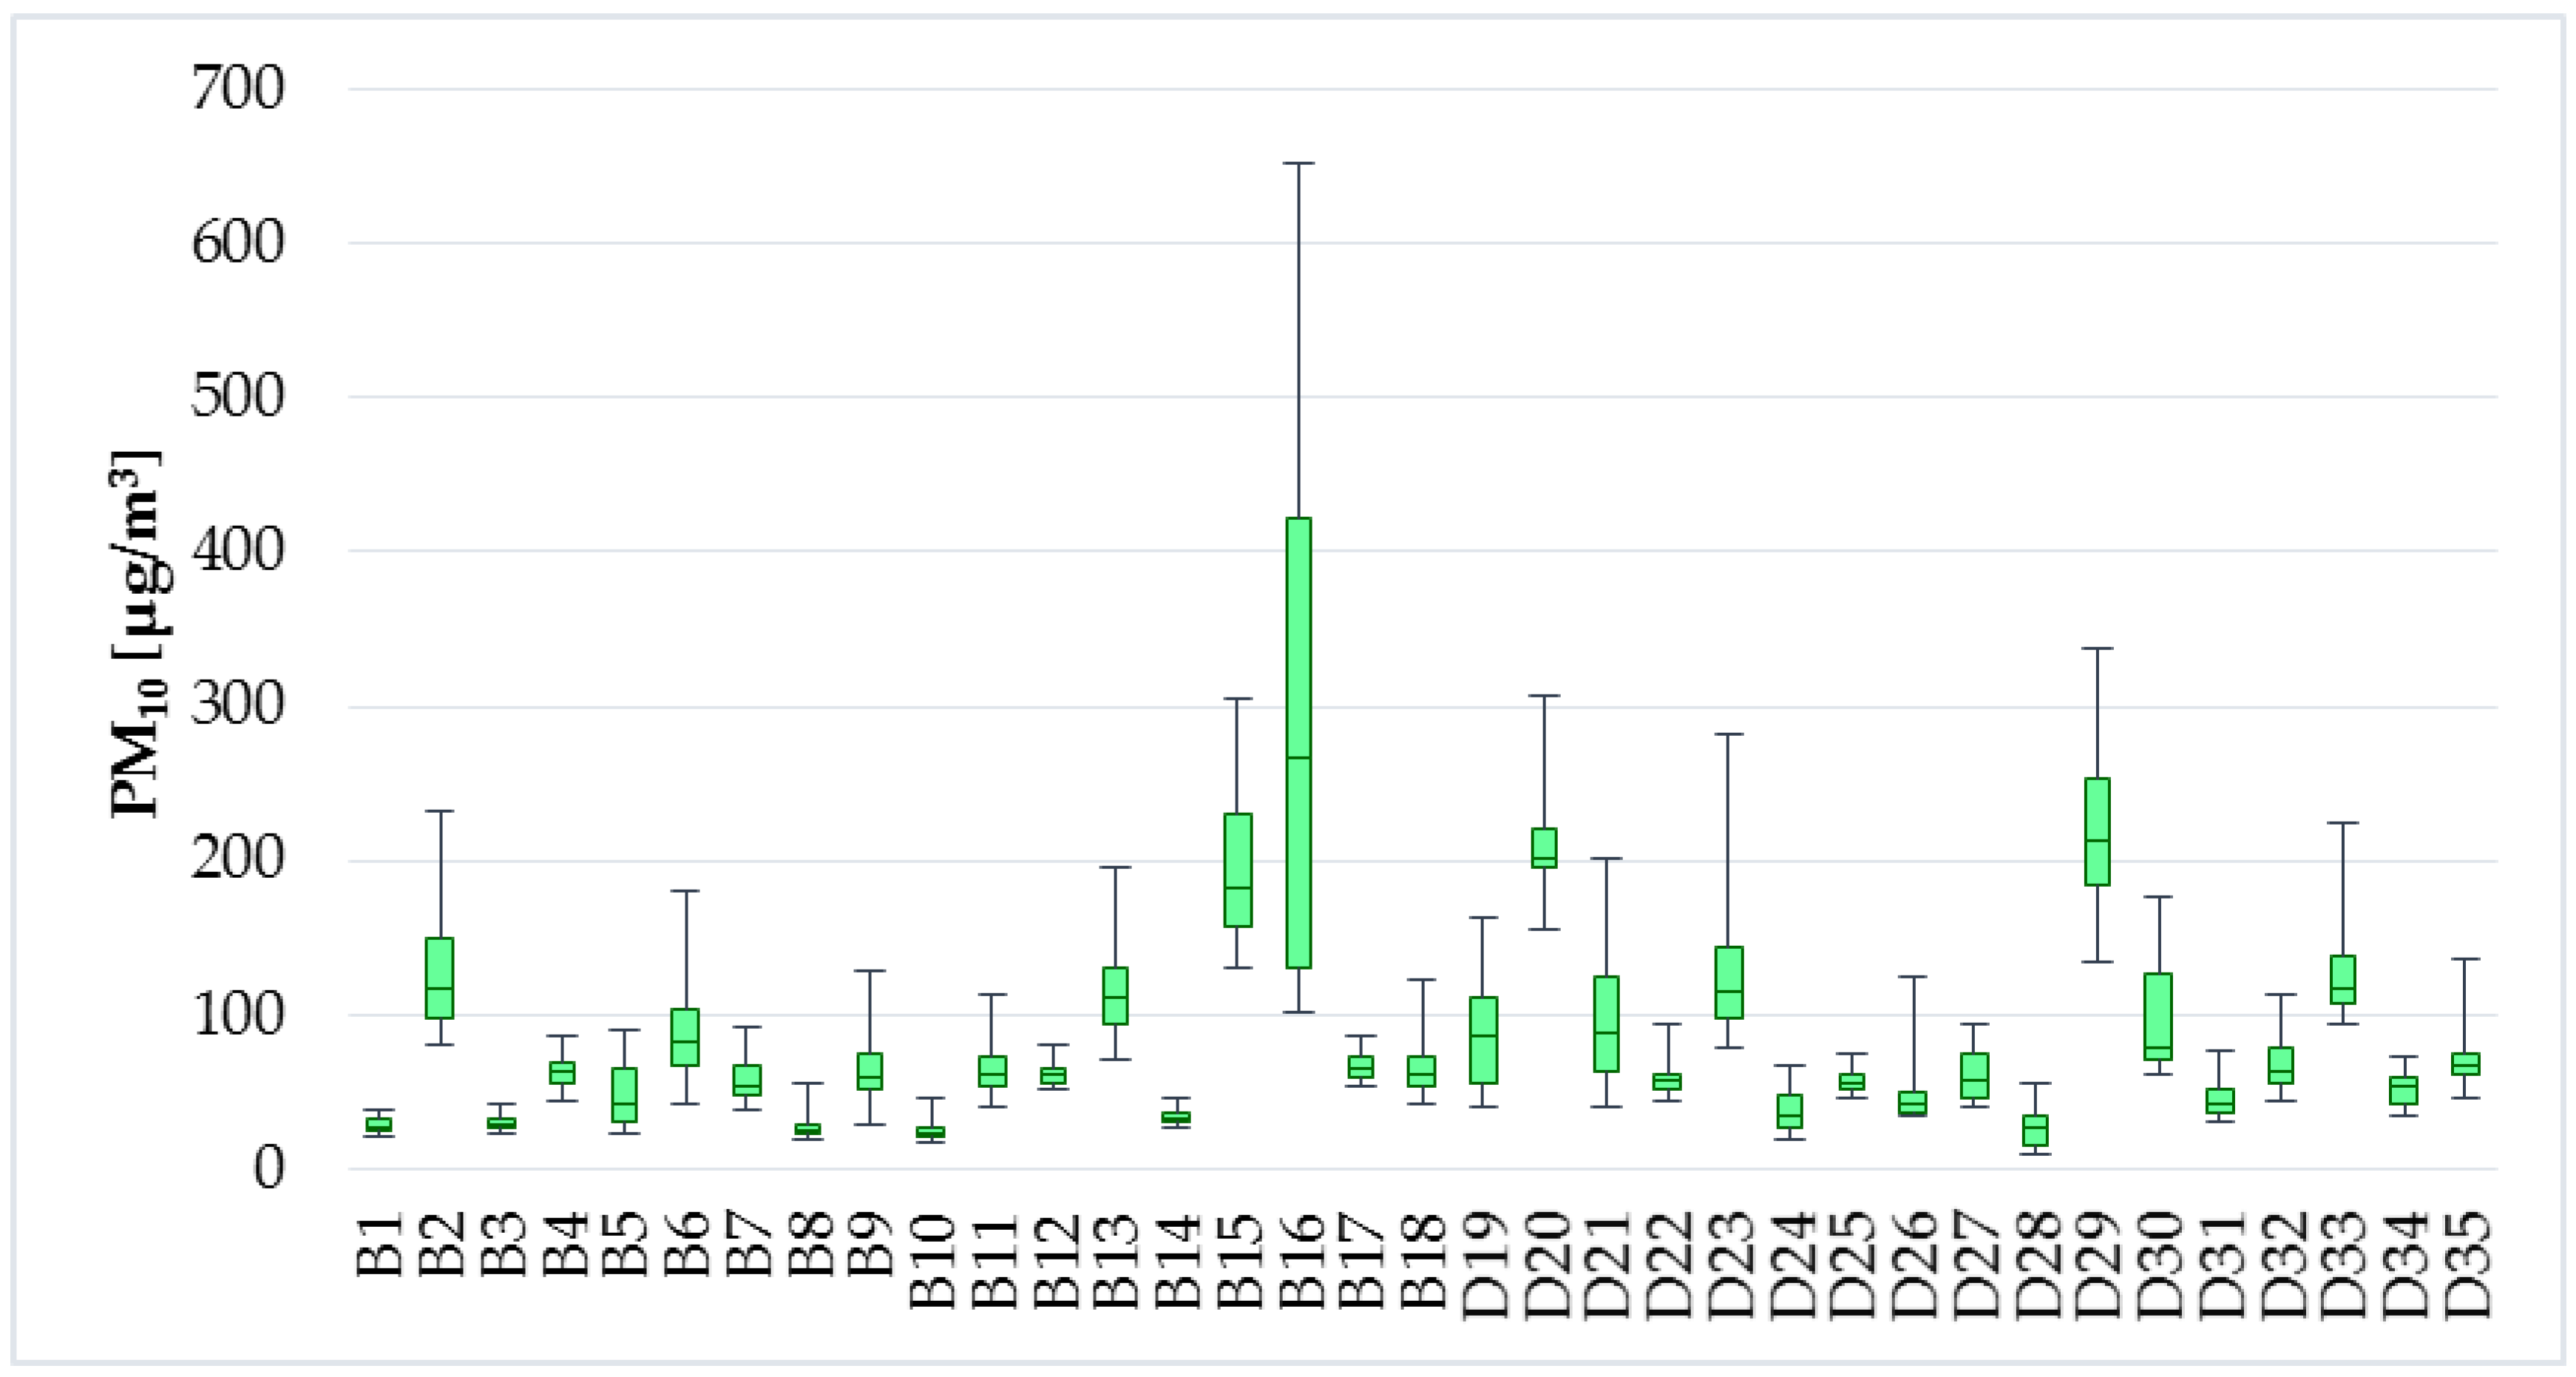
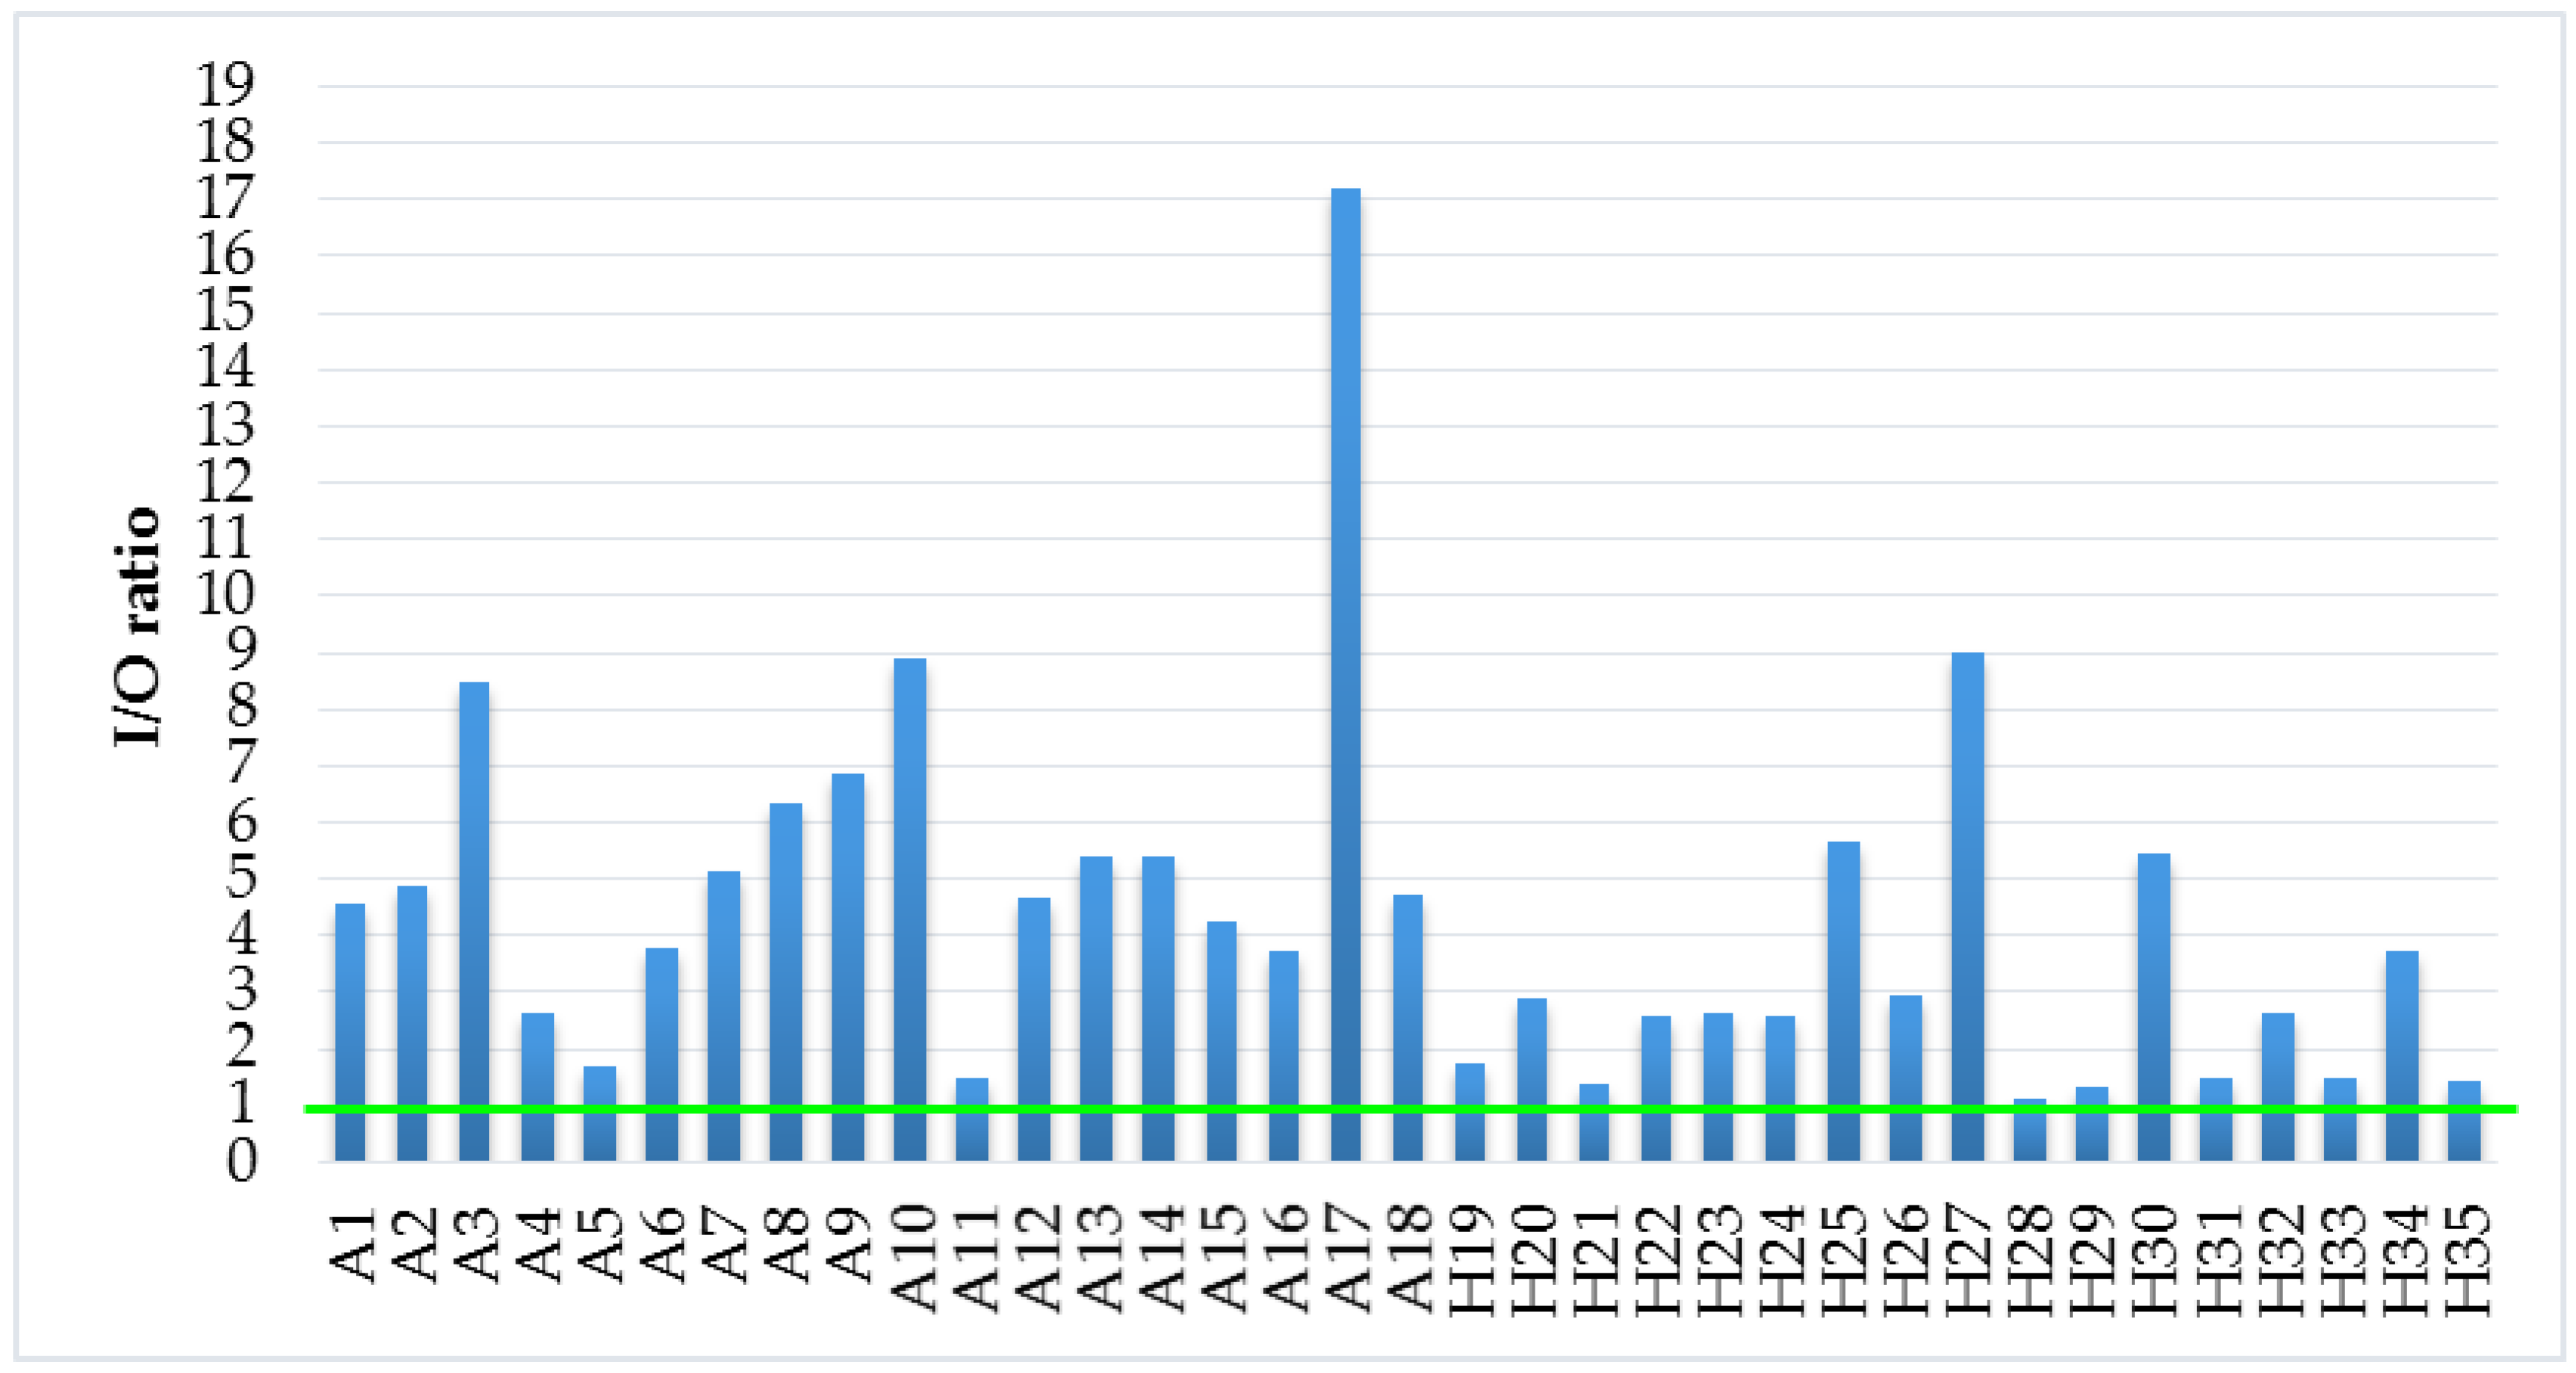
3.2. Objective Measurement

The average, minimum, and maximum air temperature measured in the residential buildings were 23.7 °C, 20.6 °C, and 27.6 °C, respectively (Figure 4). The air temperatures in the family houses were slightly lower. The average, minimum, and maximum air temperature in the family houses were 21.8 °C, 17 °C, and 26.1 °C, respectively. The optimal operative temperature for activity class 0 (peaceful relaxation, relaxed seating (resting, watching the TV)) should be in the range of 22–26 °C and permissible operative temperature should be in the range of 20–27 °C for May according to Decree no. 210/2016 [37]. As can be seen from Figure 5, the range of optimal operative temperature was not reached in 37% of the objects. The range of permissible operative temperature was not reached in 11% of the objects. The average, minimum, and maximum operative temperature in the apartments was 23.6 °C, 21.1 °C, and 24.7 °C, respectively. The average, minimum, and maximum operative temperature in the family houses were 21.5 °C, 17.5 °C, and 24.5 °C, respectively.
The average relative humidity was 49.9%, minimum was 34.2%, and maximum was 61.5% in the apartments. There was no significant difference in the family houses compared to the apartments. The average, minimum, and maximum relative humidity in the family houses was 49.6%, 35.2%, and 66.9%, respectively (Figure 6). Permissible relative humidity in the indoor environment should be in the range of 30–70% [37]. This requirement was fulfilled in all households.
The limit value for PM10 concentrations is determined at 50 µg/m3 for 24 h exposure in the Decree no. 210/2016 [37]. The results from measurement in the selected households cannot be compared with this legislative requirement since the measurement not lasted 24 h. However, the intention for measurement of PM levels was to find out whether there is dependence between the TVOC concentrations and individual PM fractions. The average concentrations of PM0.5-PM1-PM2.5-PM5-PM10 were in the apartments and family houses as follows: 5.4; 5.8–8.1; 8.3–14.3; 13.1–44.1; 44.5–81.0; 87.8 µg/m3. Levels of PM2.5 and PM10 are illustrated in Figure 7 and Figure 8.
The measured values of TVOC concentrations in individual objects are illustrated in Figure 9 and Figure 10. The average, minimum, and maximum TVOC concentrations in the apartments were 519.7 µg/m3, 28 µg/m3, and 2393.5 µg/m3, respectively. TVOC levels were slightly lower in the family houses, with average value of 330.2 µg/m3, minimum value of 13.5 µg/m3, and maximum value of 1712 µg/m3. The recommended value for TVOC concentrations is 200 µg/m3 according to Mølhave [38]. This value was exceeded in 69% of households (94% of apartments and 41% of family houses).
As mentioned above, the I/O ratio was calculated for all selected households. The average, minimum, and maximum outdoor TVOC levels were 108.8 µg/m3, 38.8 µg/m3, and 292 µg/m3, respectively. If I/O ratio is less than 1, it can be concluded that outdoor air is the main source of TVOC in indoor environment. As can be seen in Figure 11, this case did not occurred in selected households and it can be stated that the sources of TVOC pollution originate from the indoor environment.

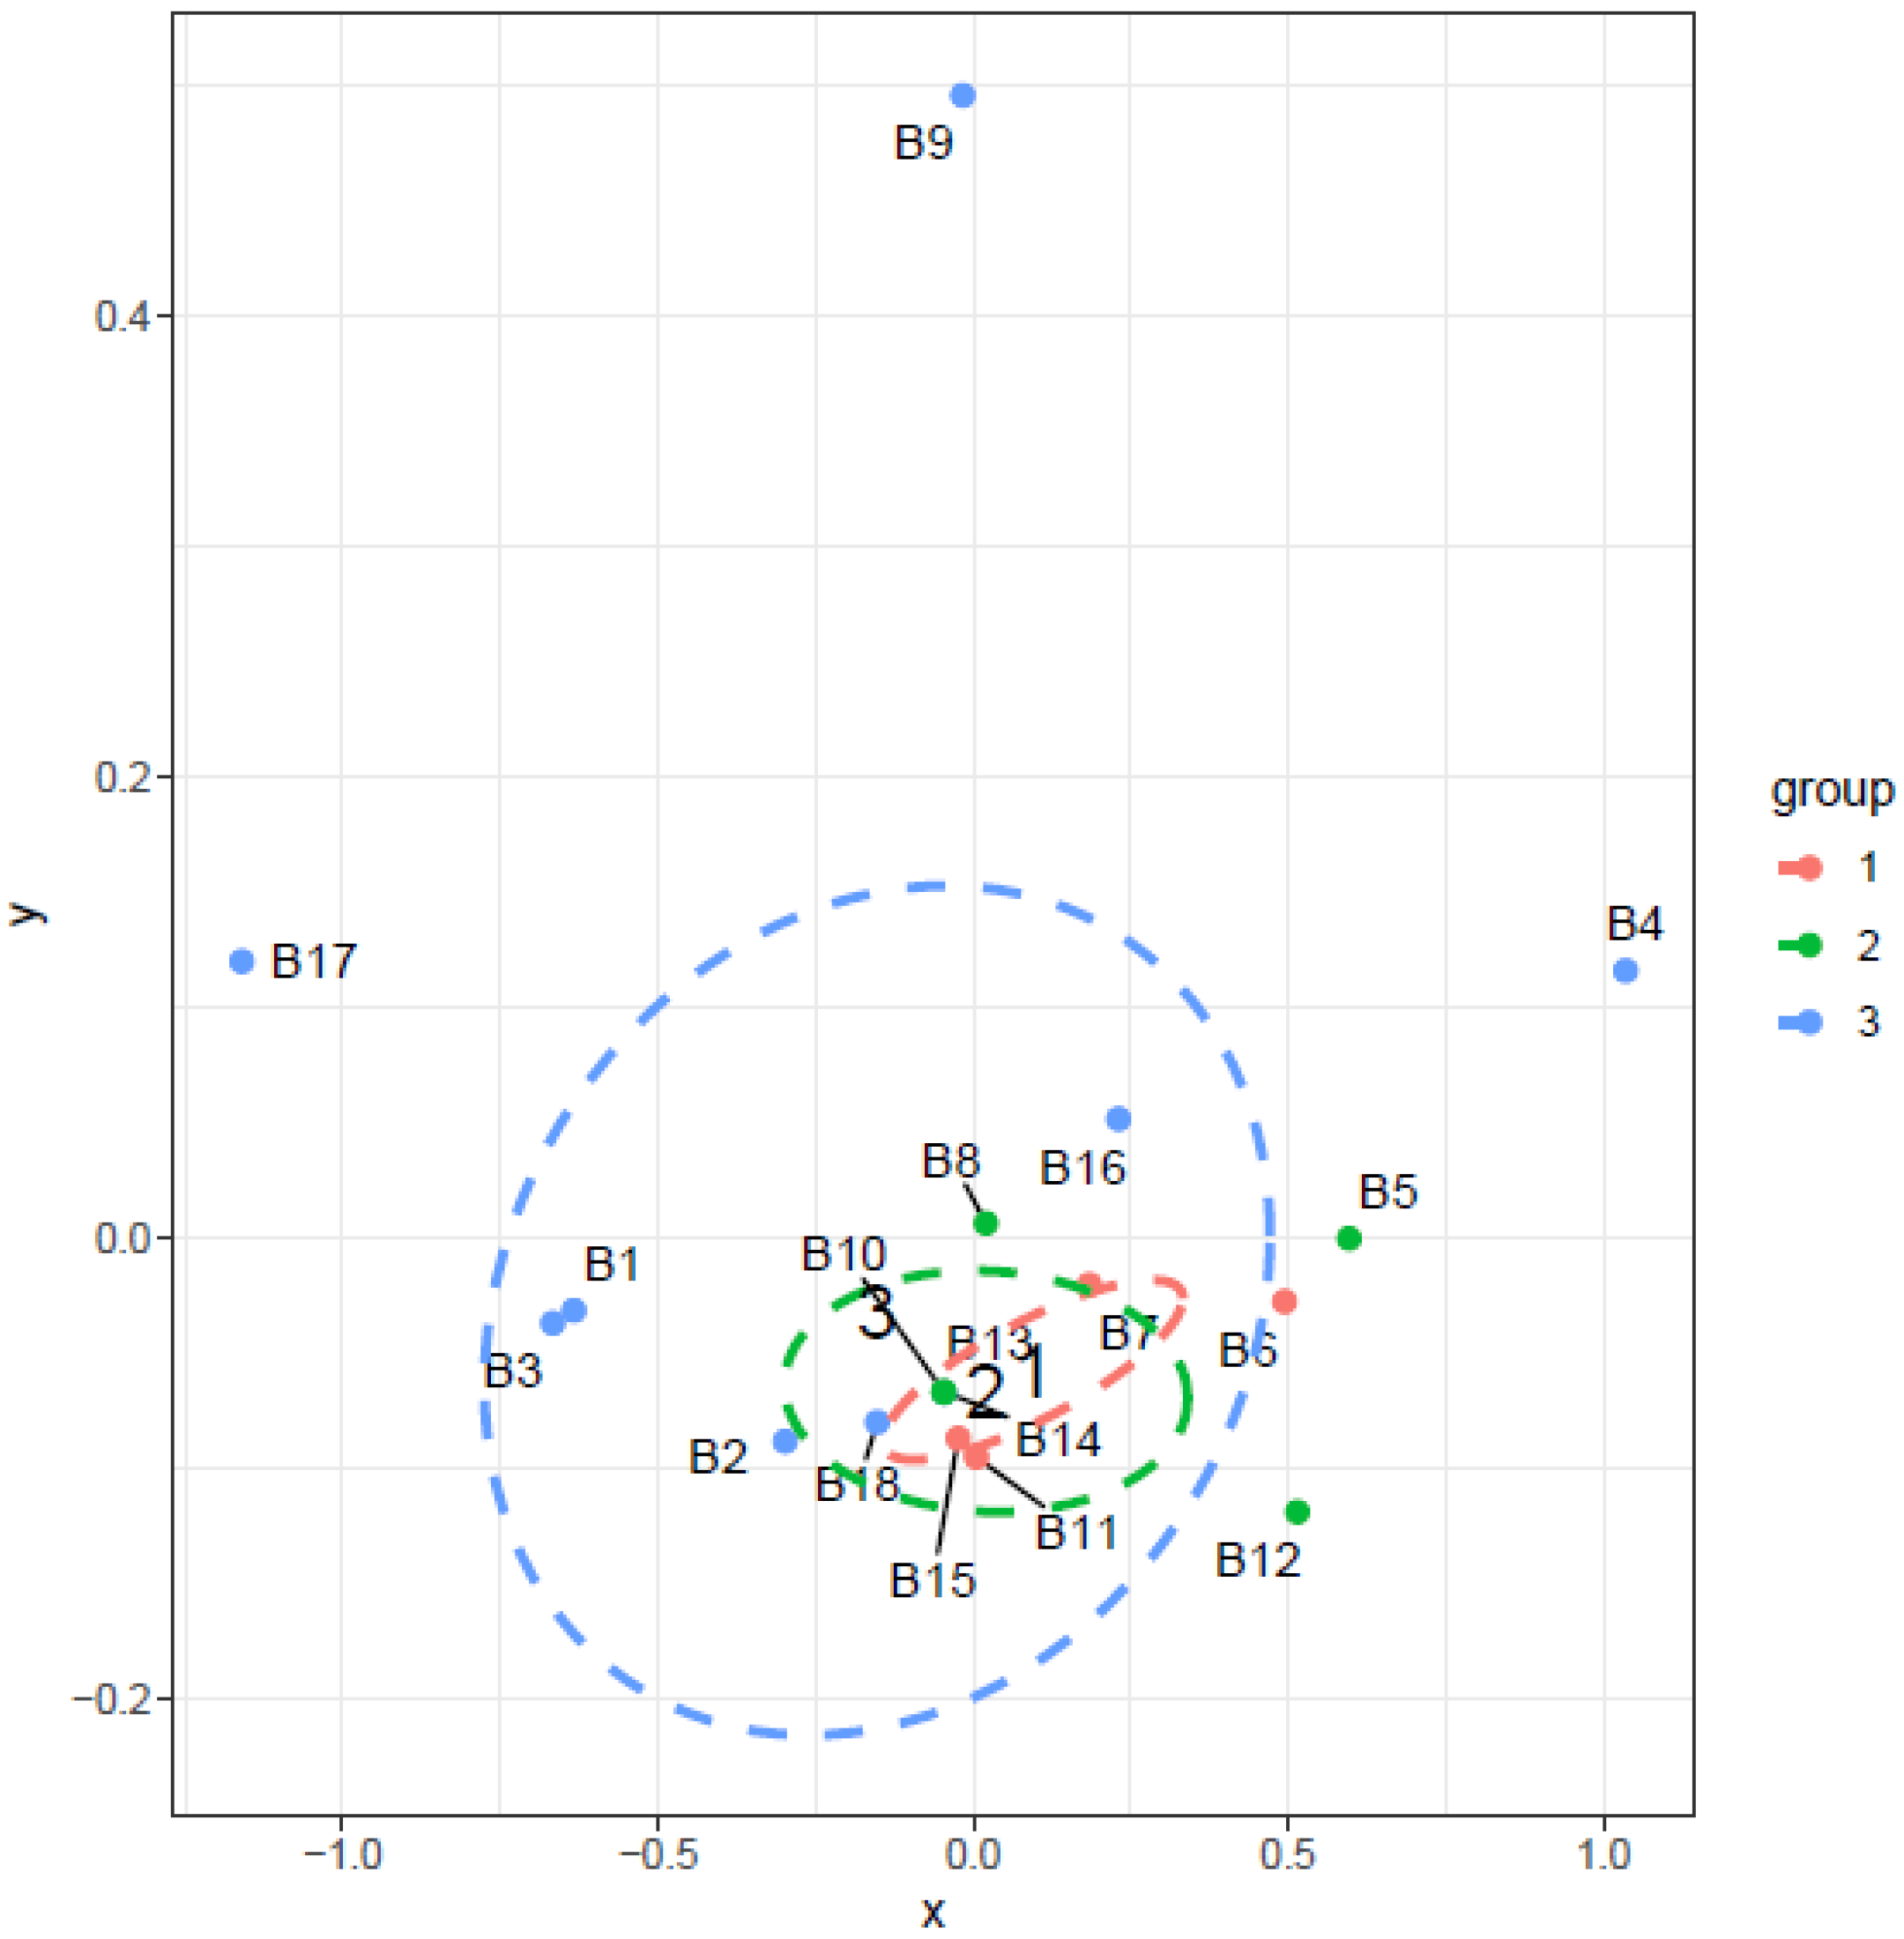
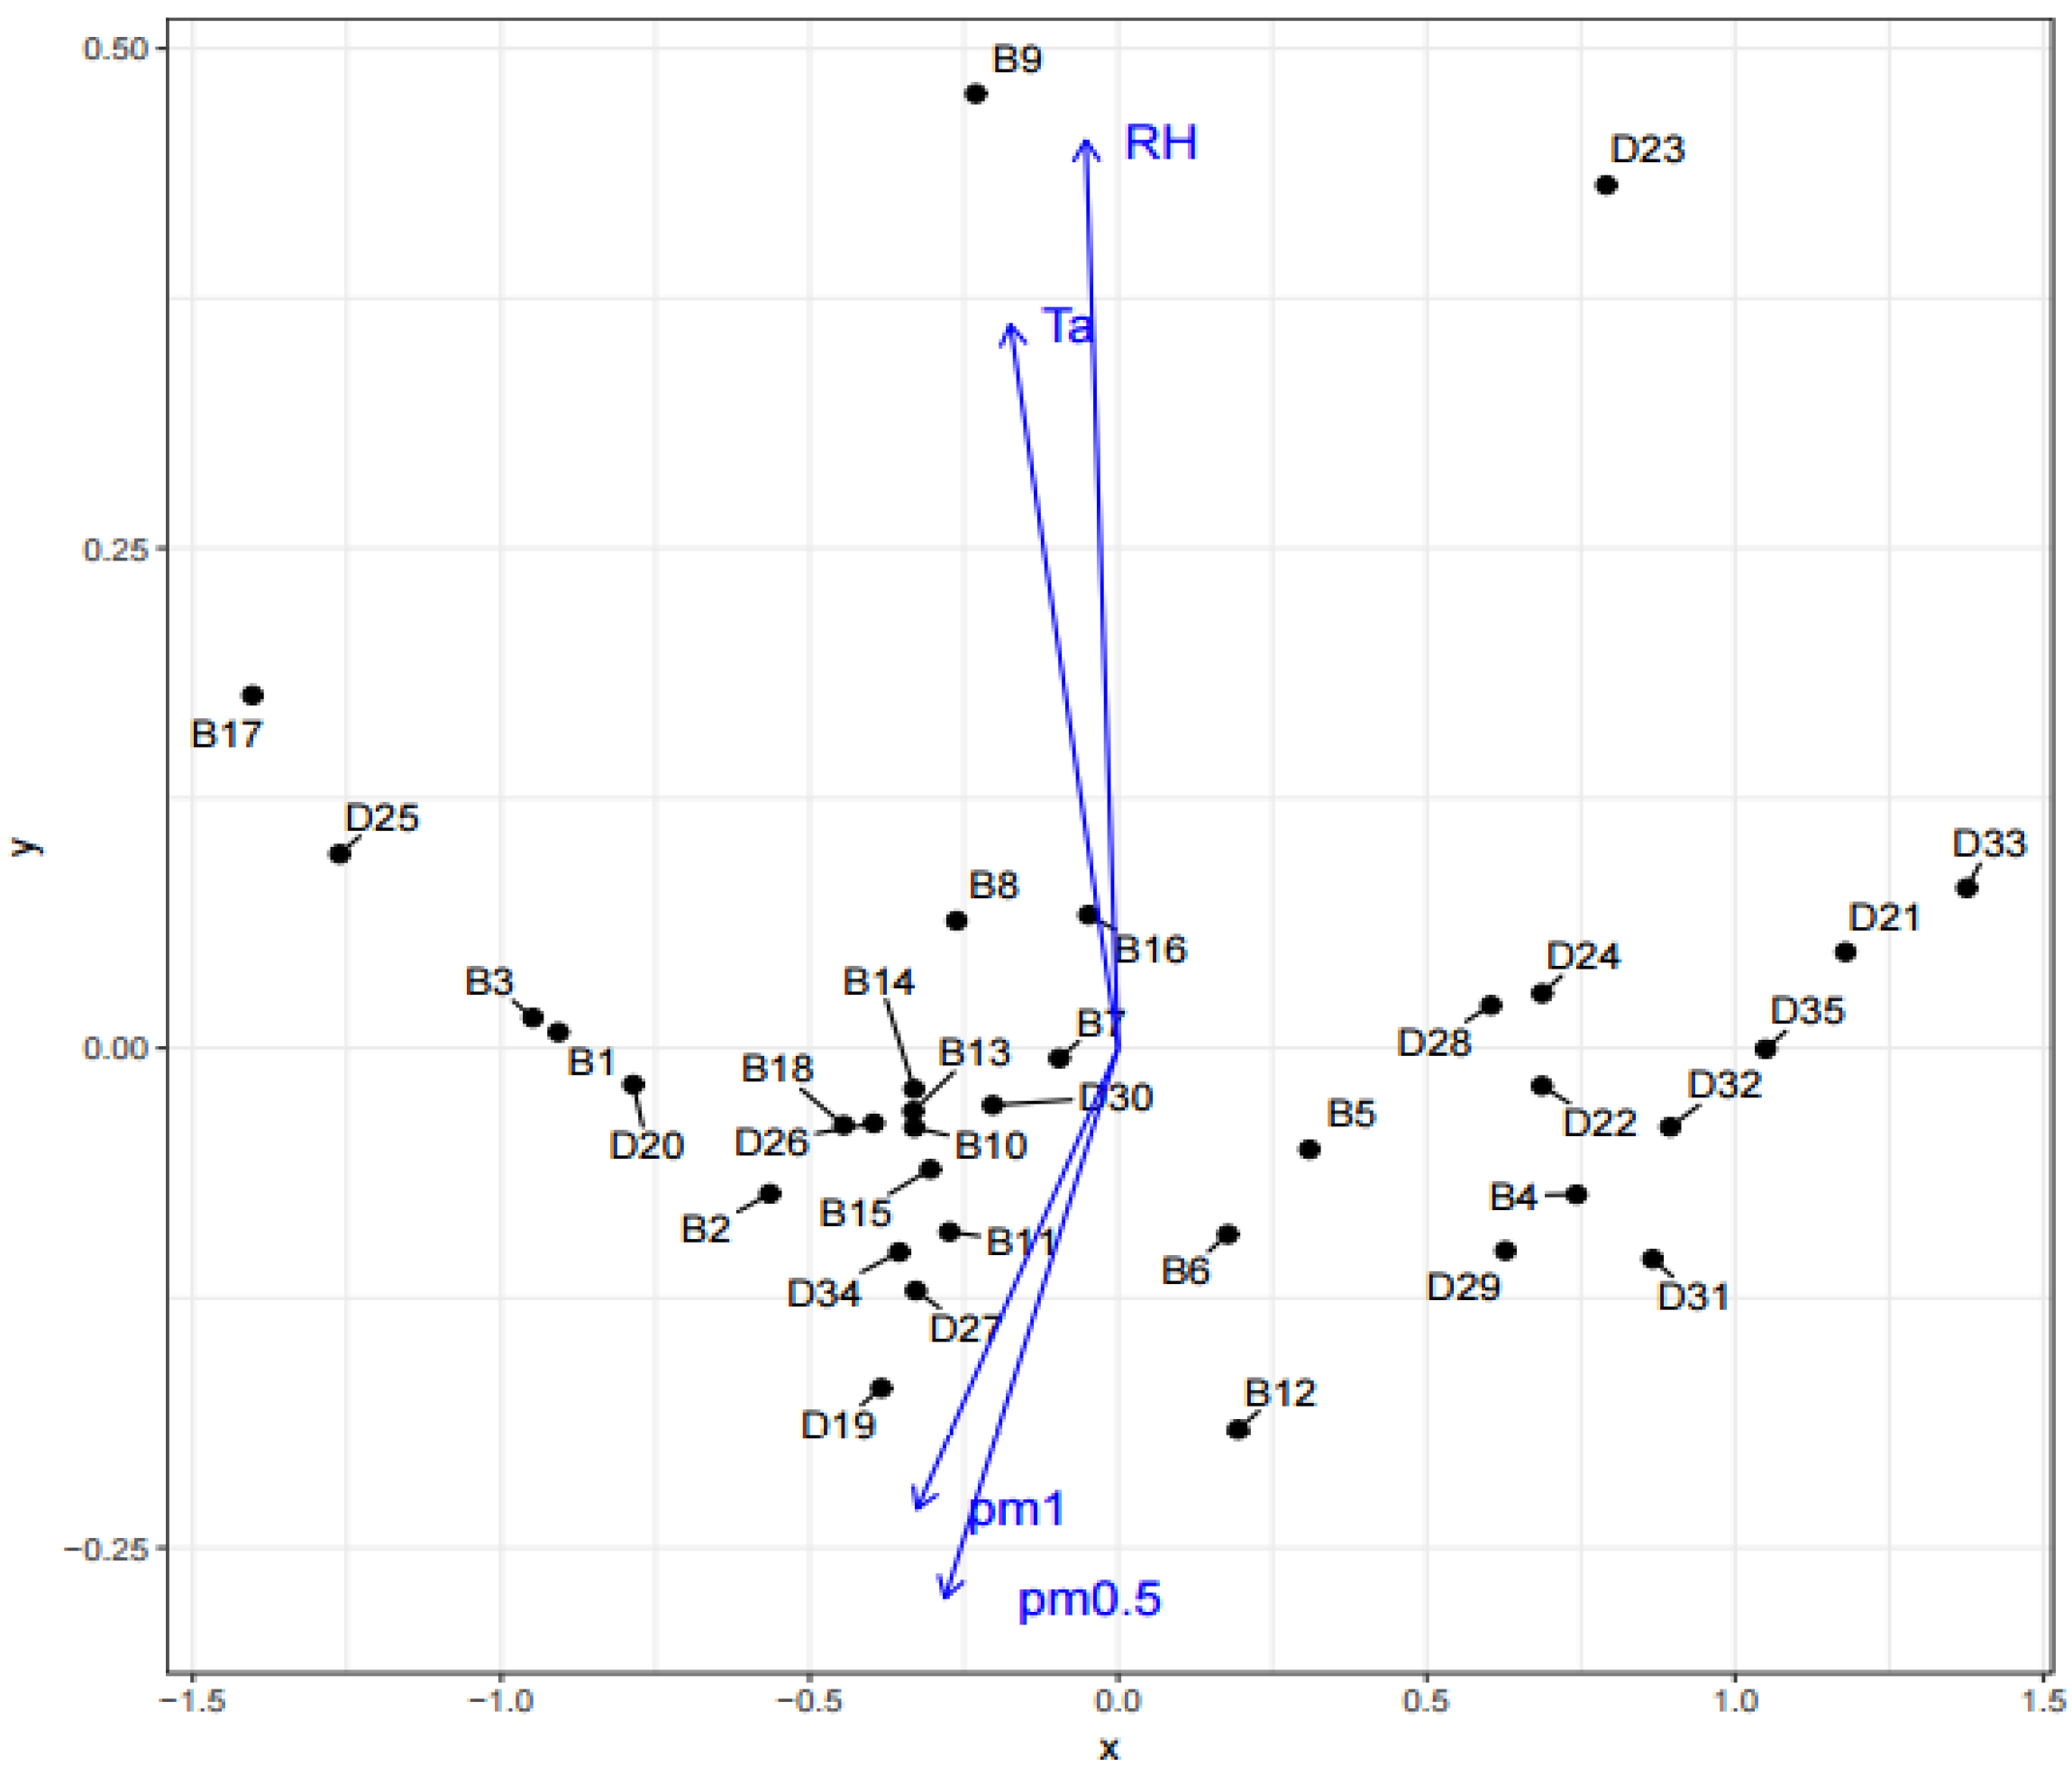
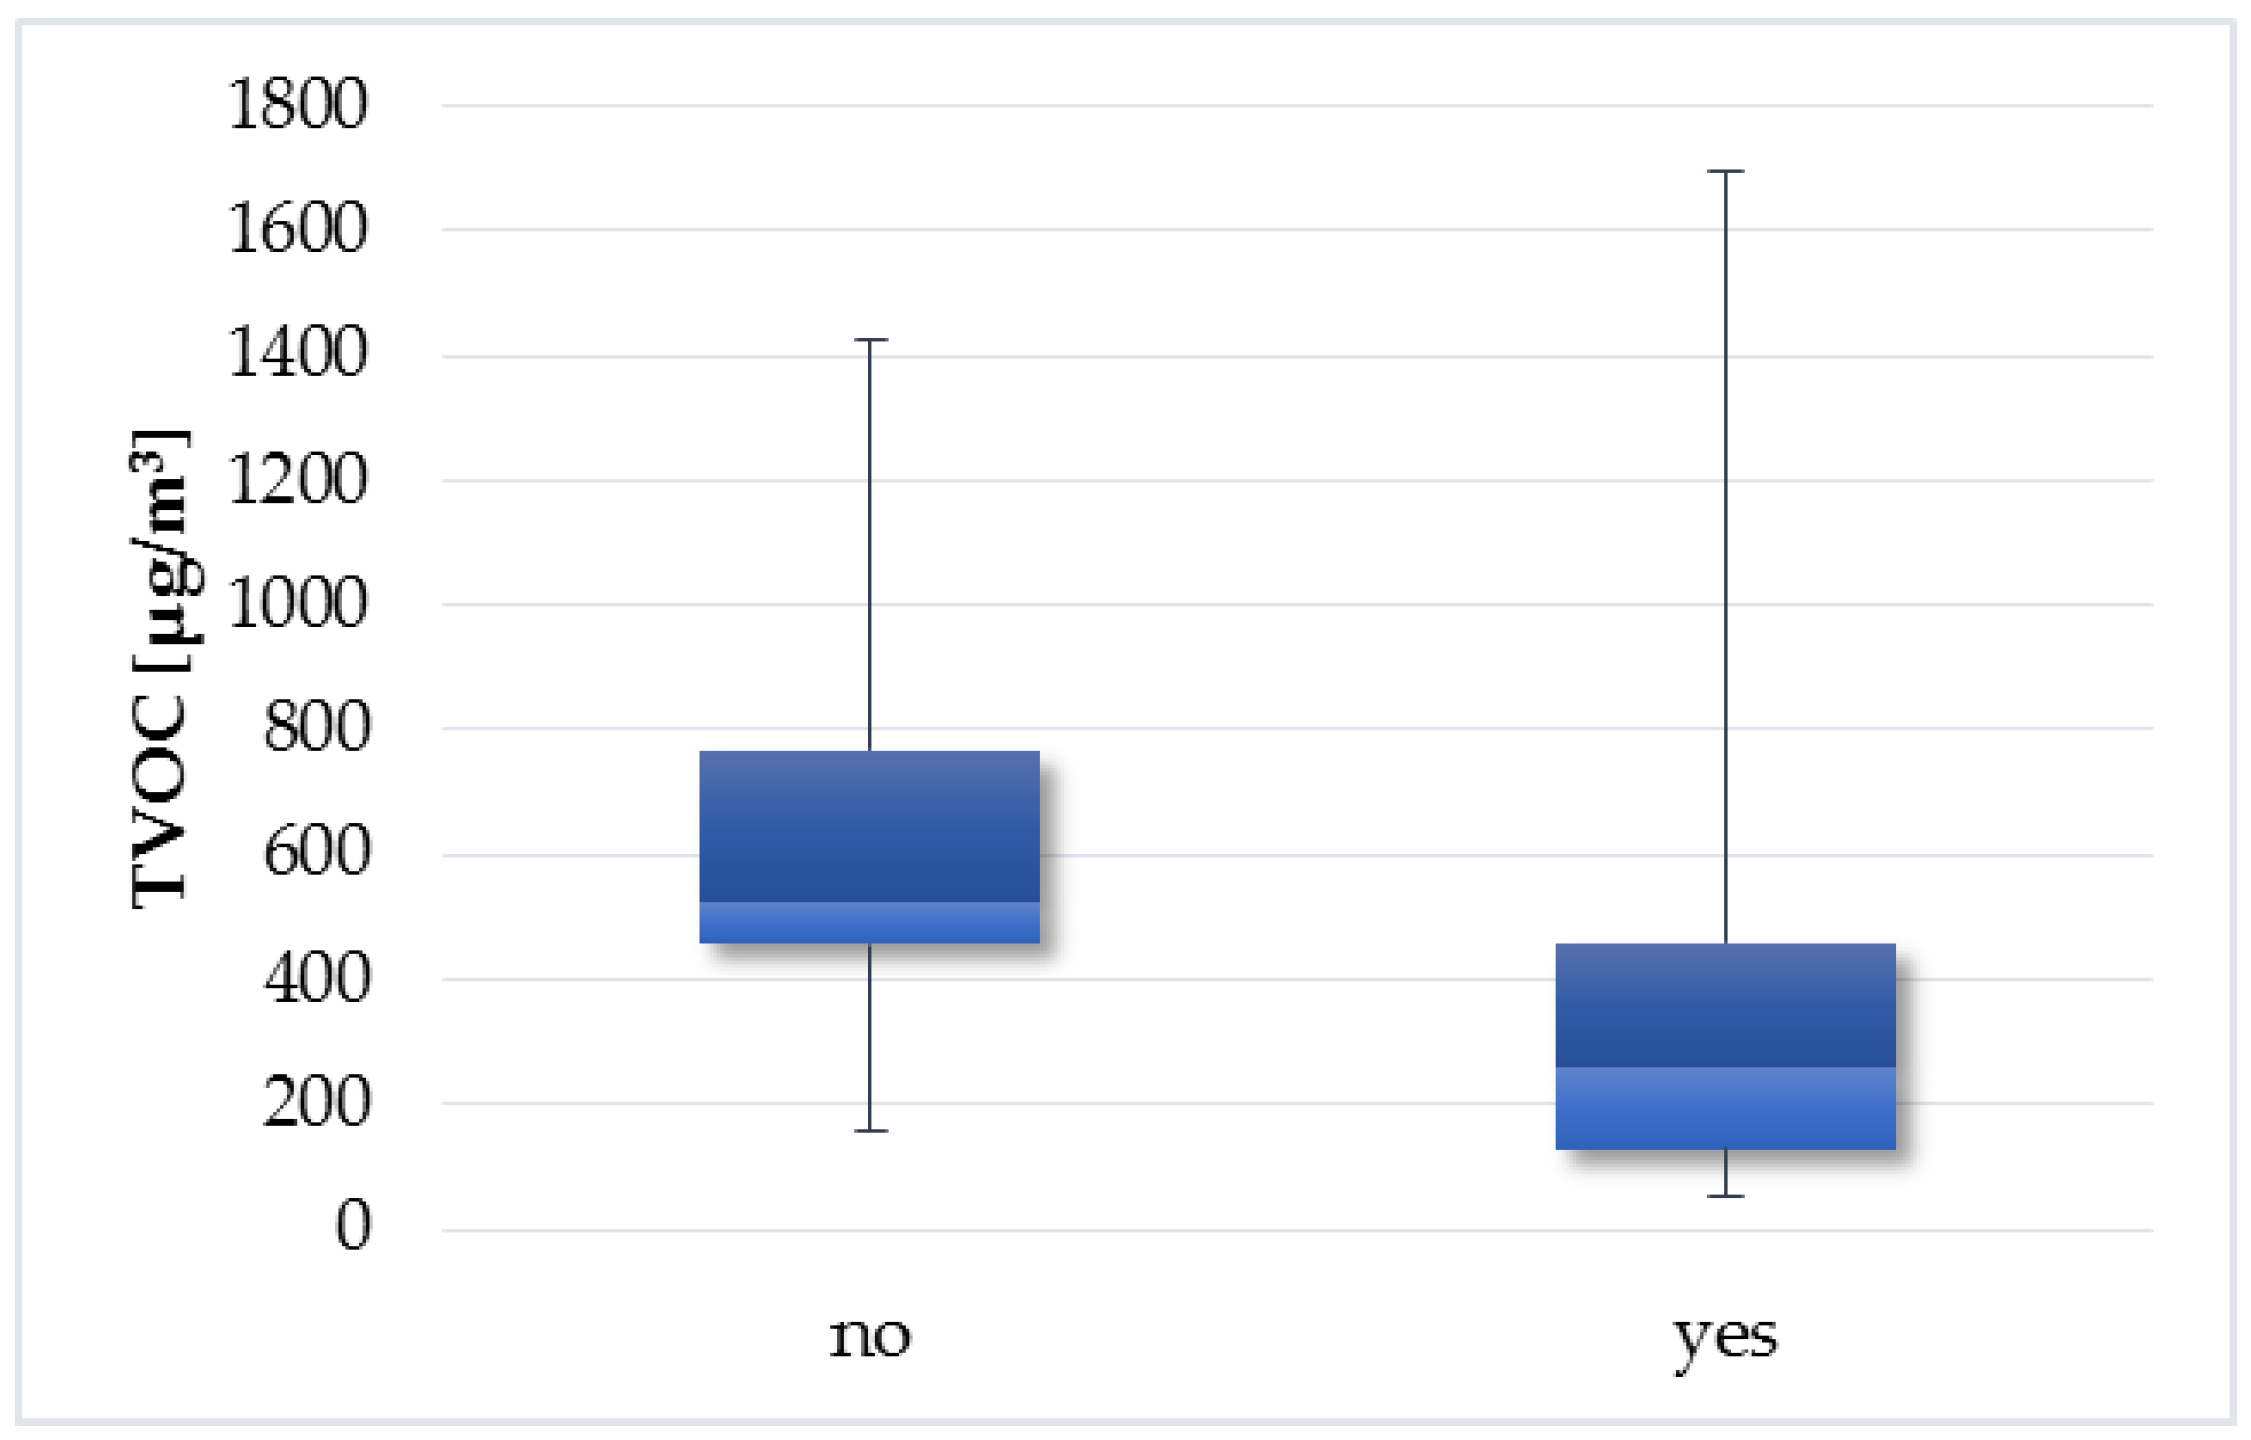
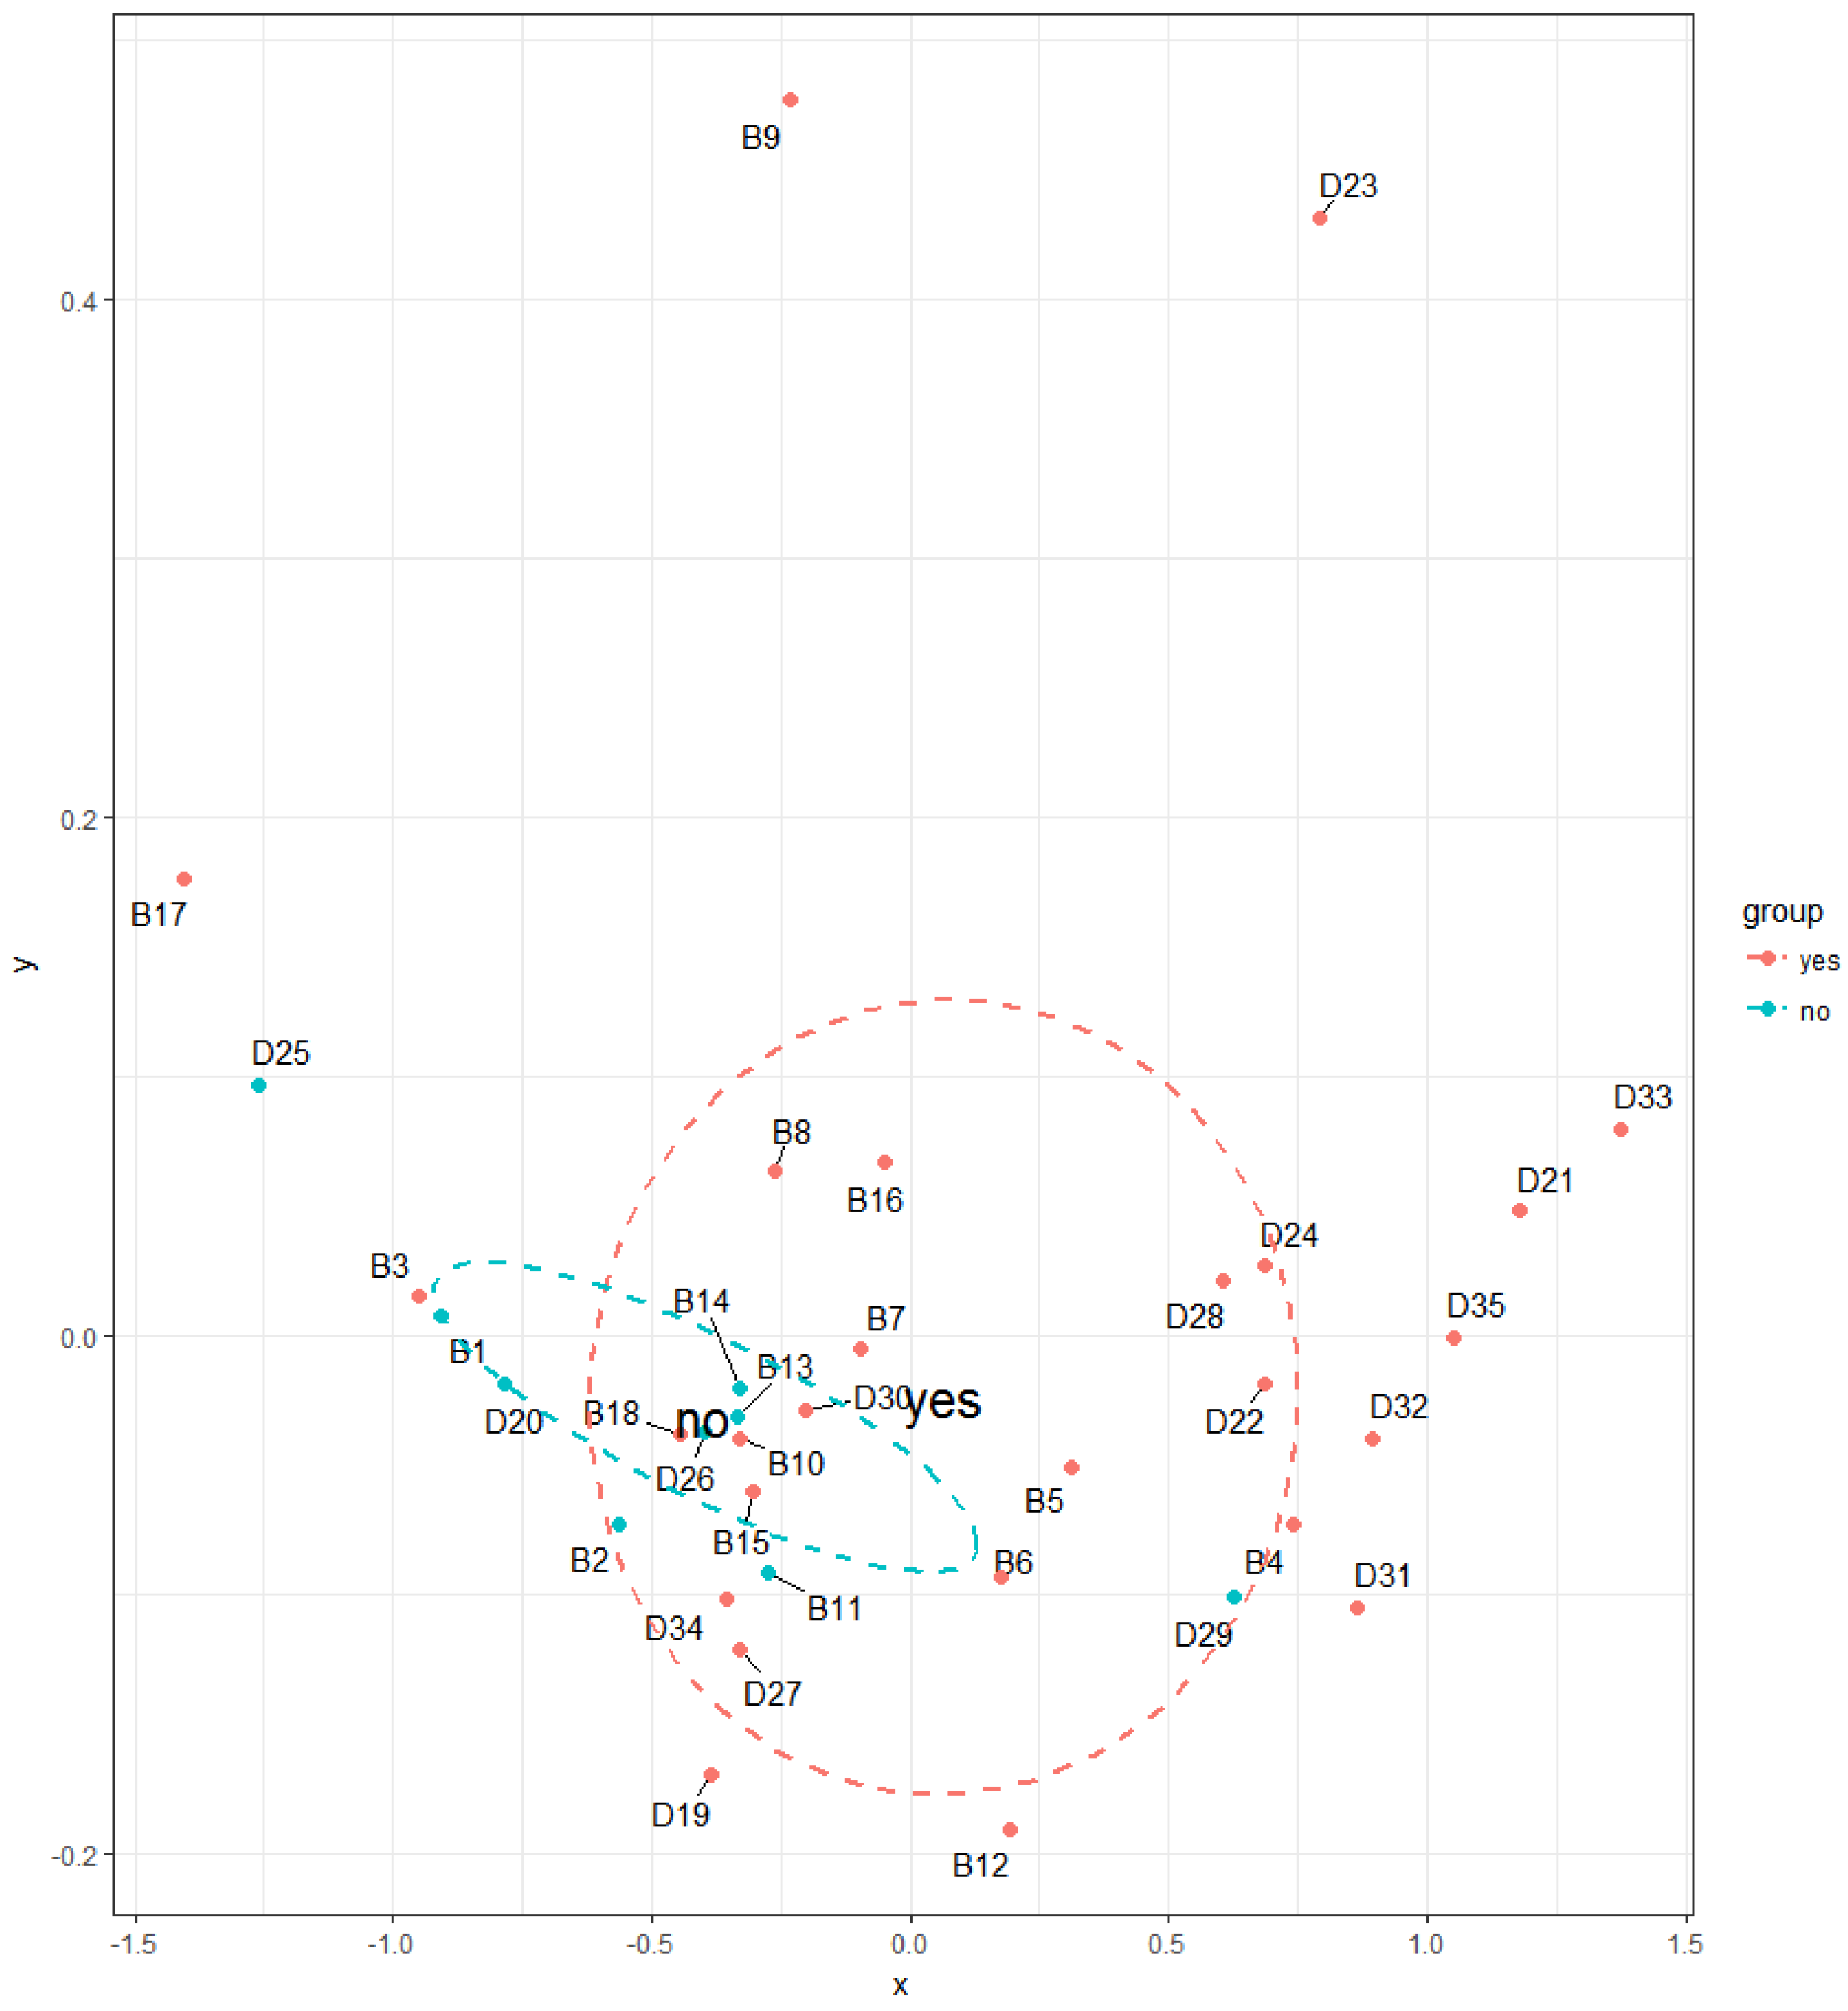
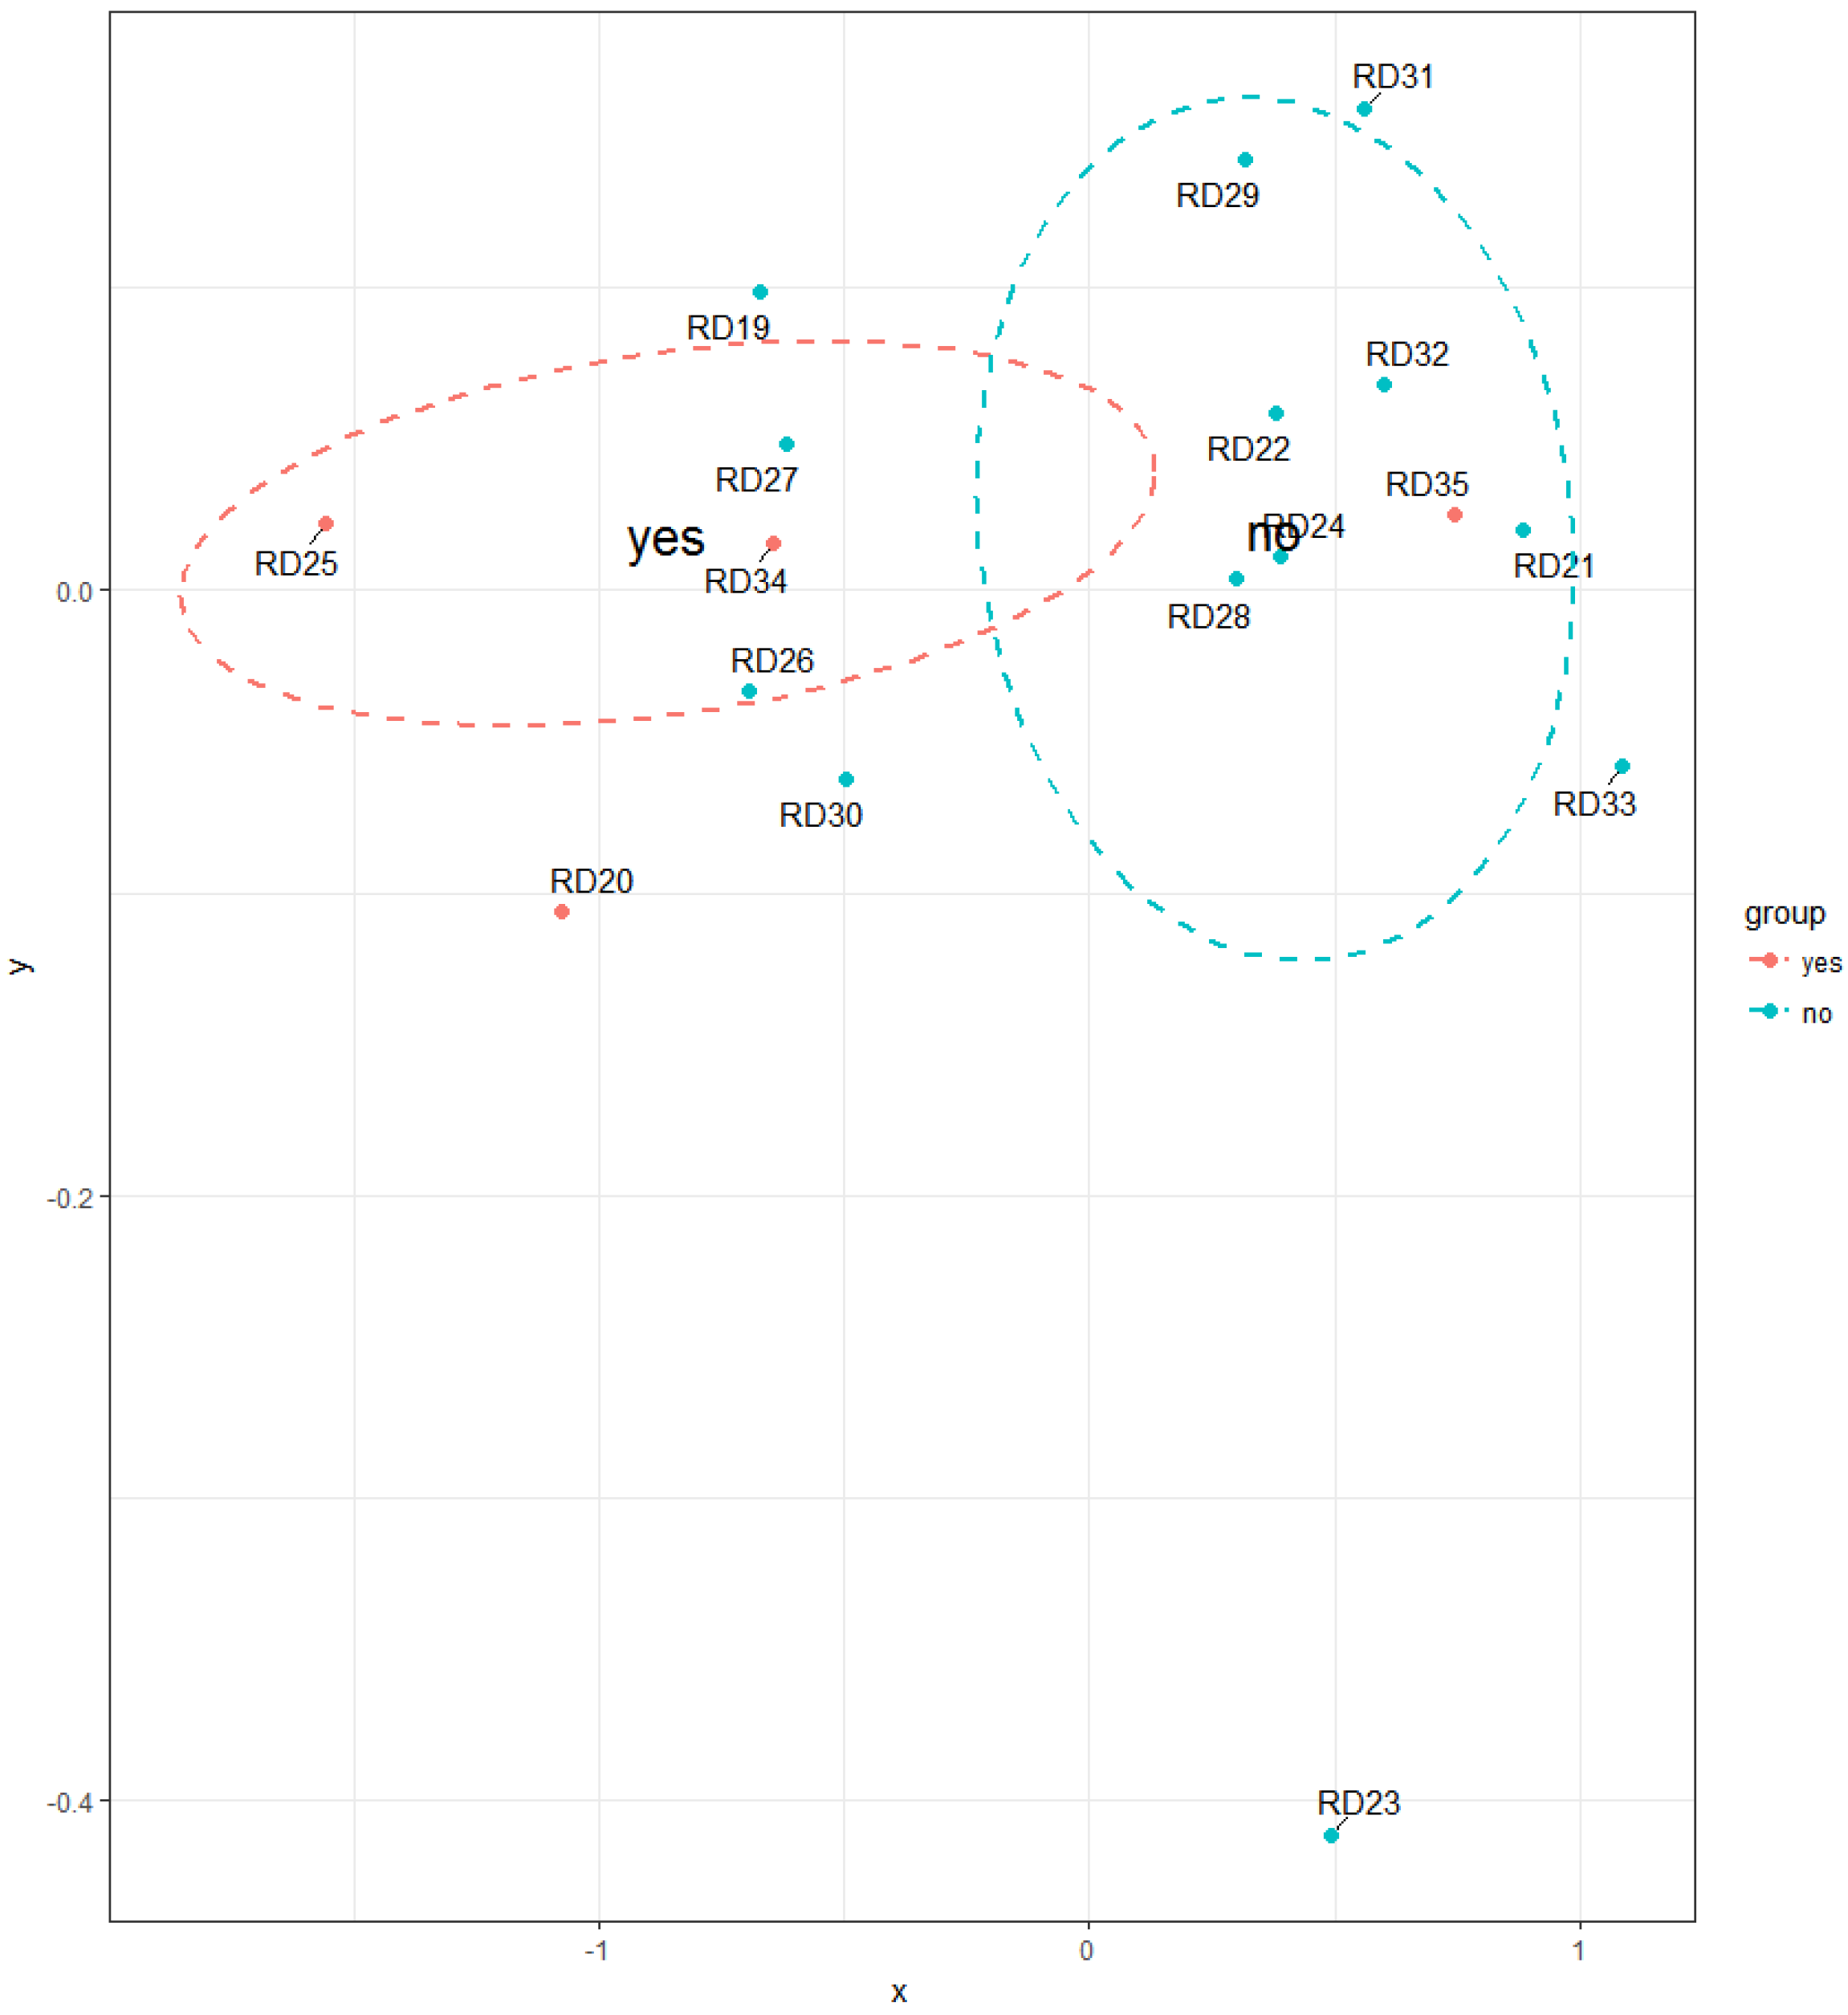
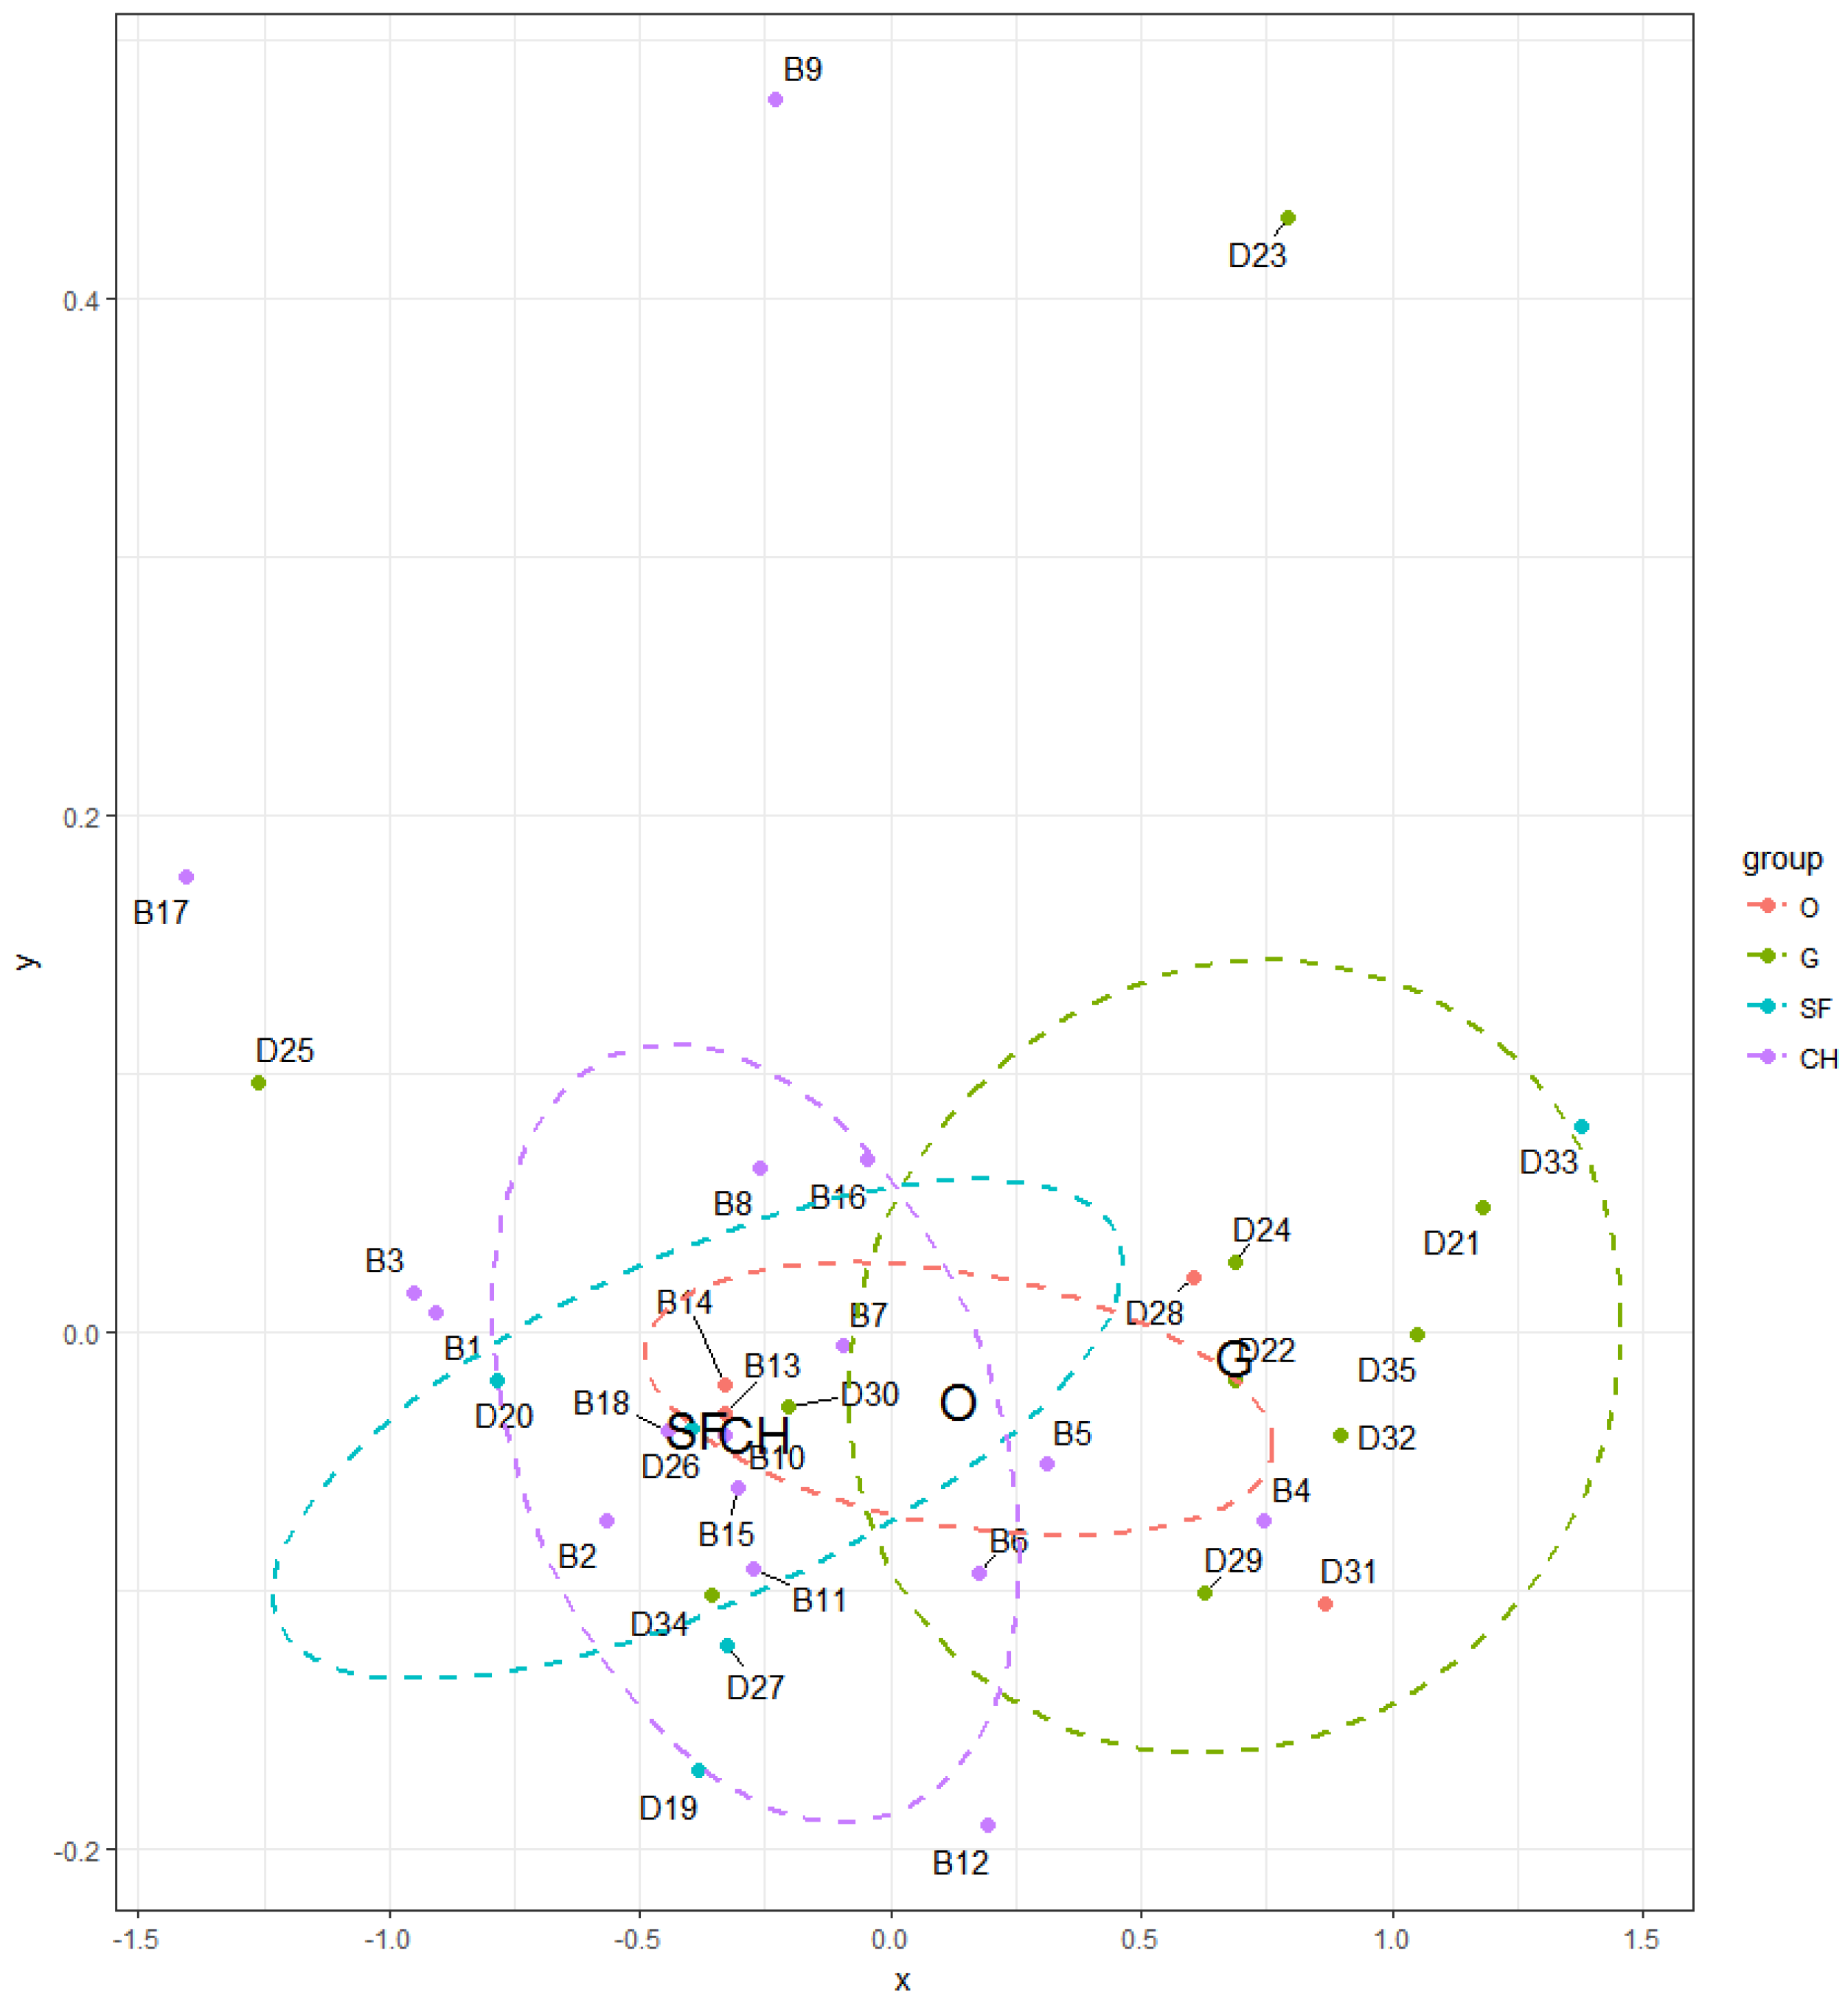
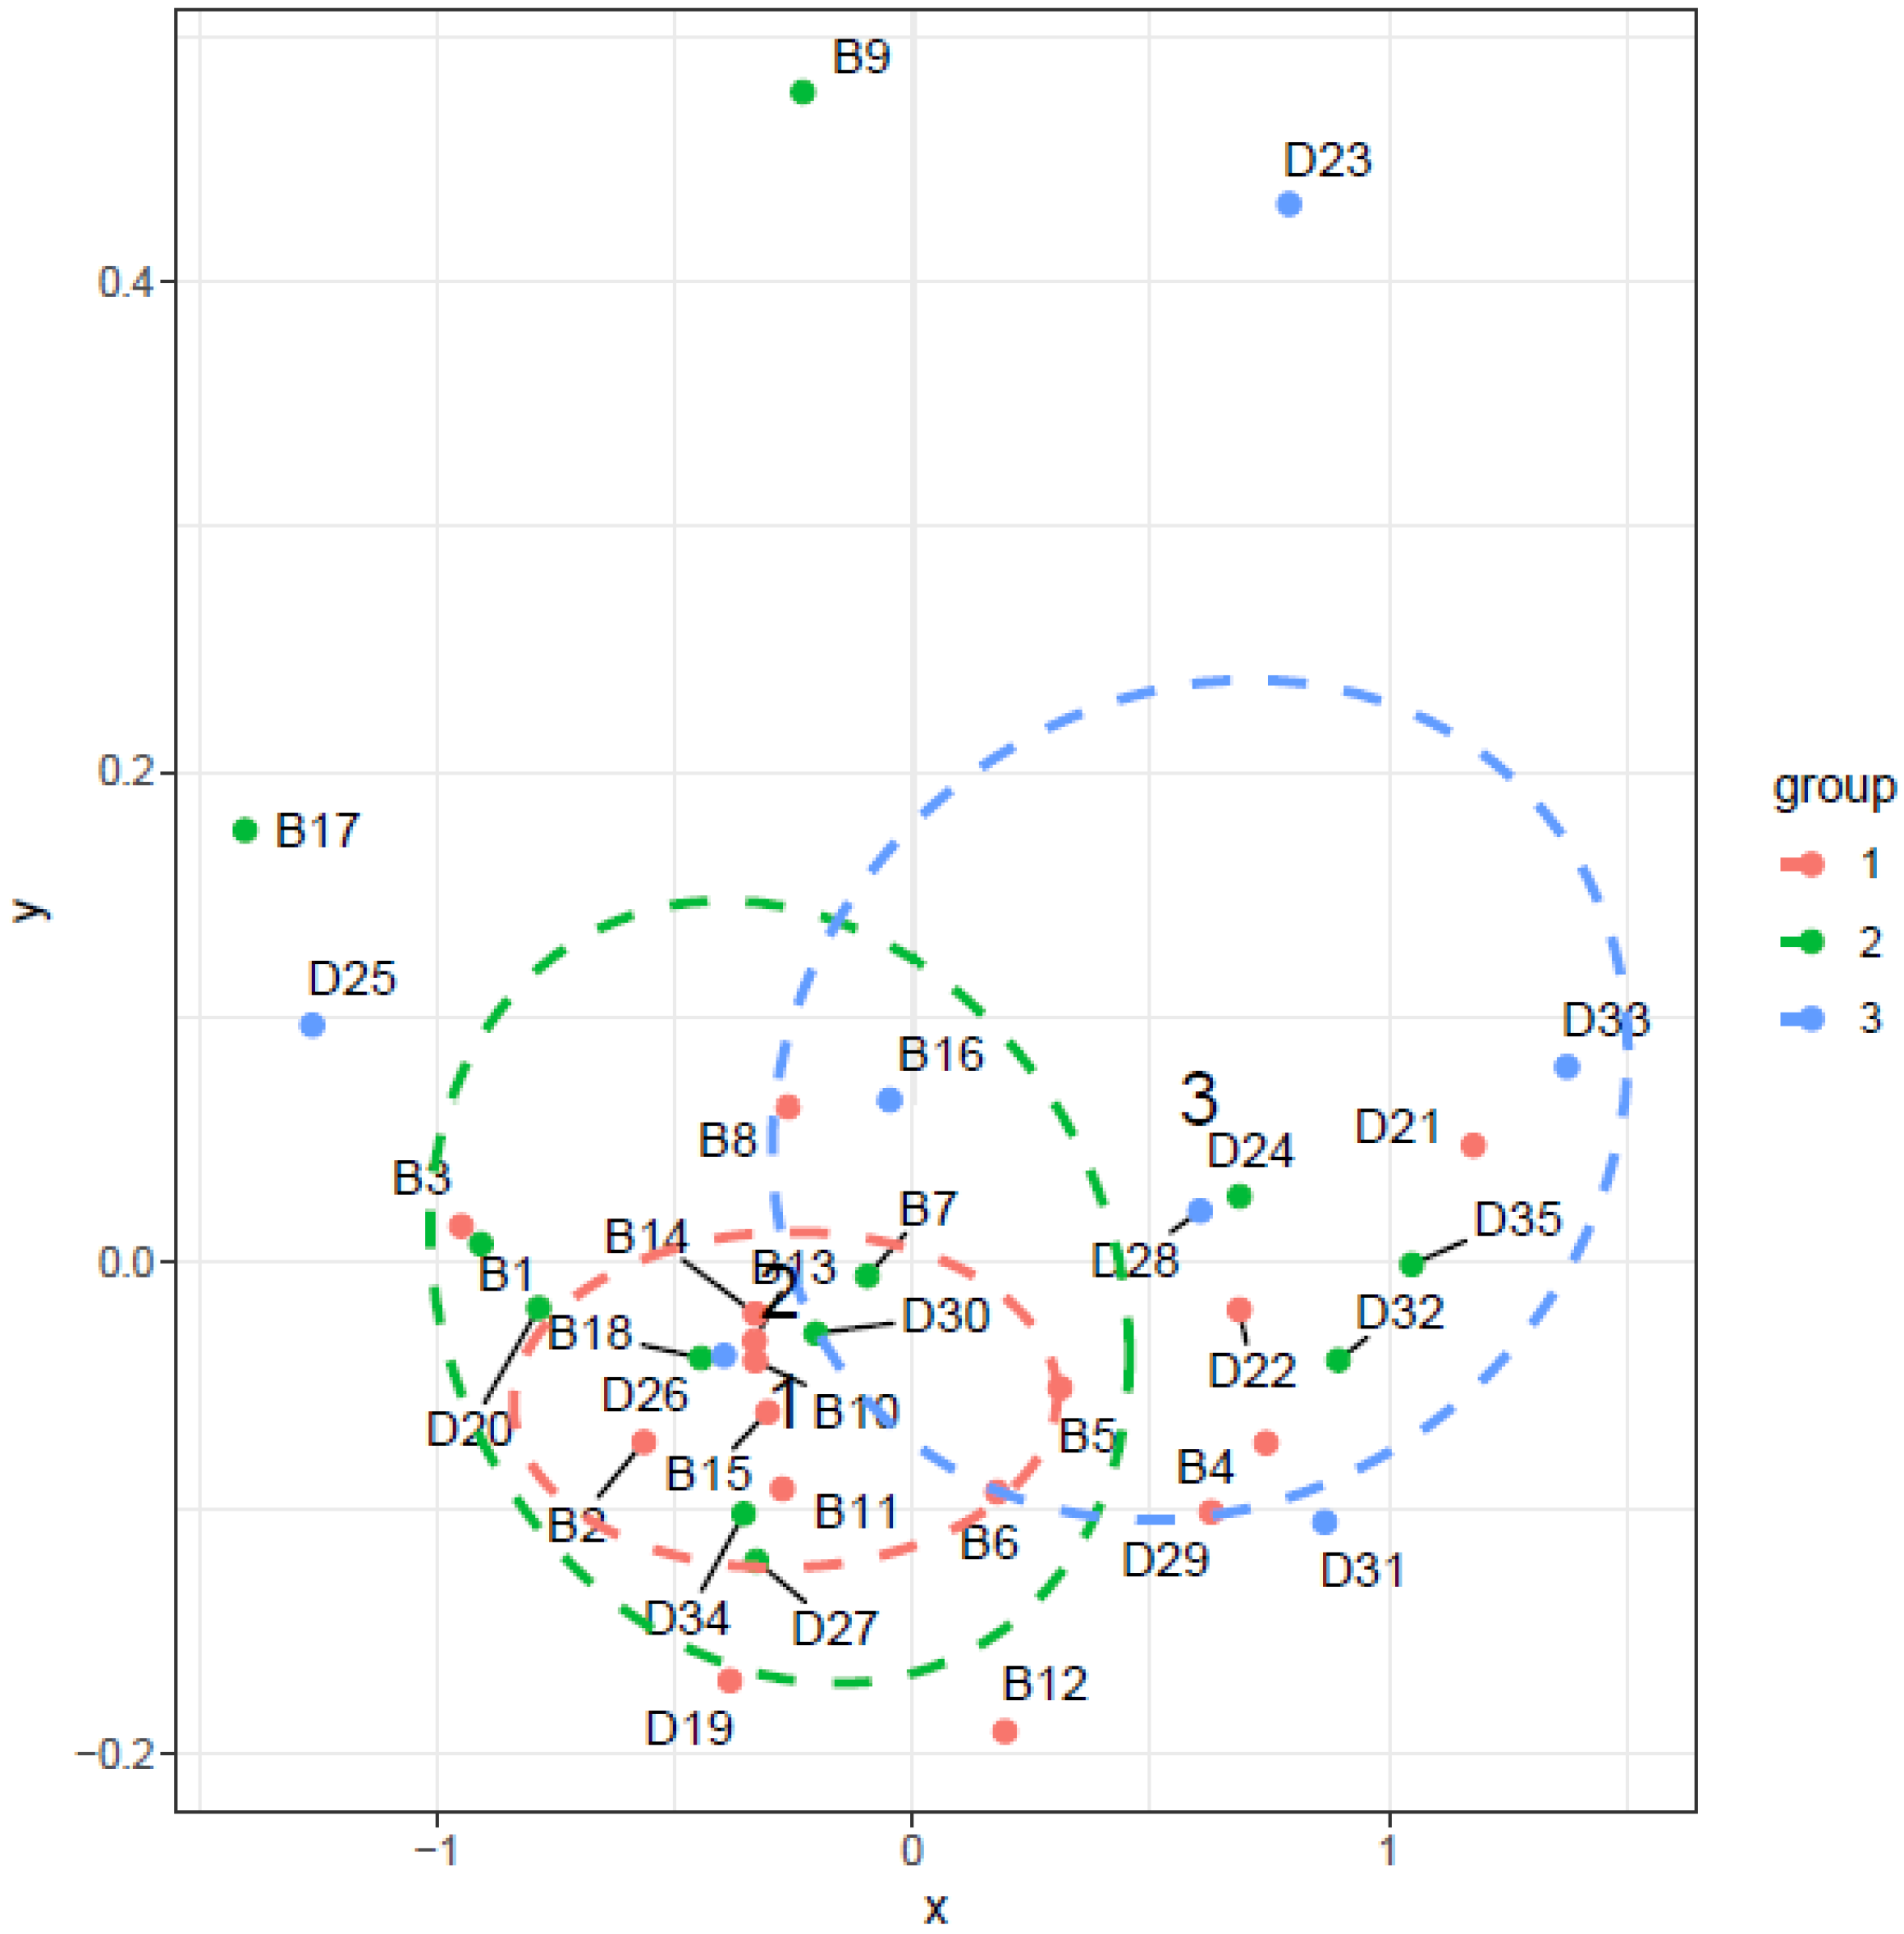
3.3. Statistical Analysis

The relationship between continuous variables (air temperature, relative humidity, and PM0.5–PM10), factor variables (factors summarized in Appendix BTable A1, Table A2, Table A3 and Table A4), and TVOC concentrations measured in the indoor air of individual households was analyzed using statistical methods described in the Section 2.3. The dependence of similarity on the selected metric (Bray Curtis metric) is plotted using the Shepard diagram (Figure 12). In this case, the match is excellent. Table 2 lists only those factors and variables that shown a statistically significant effect on TVOC levels in households and Table 3 lists factors that were additionally tested using the Wilcoxon rank sum test.
The results from analysis of continuous variables are shown in Figure 13. Objects in the direction of variables arrow are objects in which the TVOC levels positively correlated with given variable. Objects in the opposite direction to the variables arrow direction are objects in which the TVOC levels negatively correlated with a given variable. However, it should be emphasized that this is a case of partial correlation and thus several factors could have impact on the TVOC concentrations in the given object. Relationships were confirmed between TVOC and temperature, relative humidity, PM0.5 as well as PM1. Effect of environment conditions such as temperature and relative humidity on TVOC levels in buildings has been the subject of numerous studies [1,15,39,40]. Negative correlation between TVOC and PM0.5 as well as PM1 was also confirmed in the study [40].
As can be seen in Figure 14, the TVOC concentrations were significantly higher in the apartments than in the family houses, which was confirmed by the Wilcoxon rank sum test (p = 0.4865). On the contrary, studies [18,41] show higher TVOC levels in the family houses than in the apartments.
Households, where it is common practice to open windows during cleaning activities, have statistically significants lower TVOC concentrations (p = 0.01019) compared to households where the windows do not open during cleaning (Figure 15). Cleaning products belong to the important source of indoor VOC emissions [42,43,44,45]. Therefore, impact of this factor on TVOC concentrations in Slovak households is reasonable. Figure 16, Figure 17, Figure 18, Figure 19 and Figure 20 visualize the level of similarity for a given factor. Elipses are drawn around the standard deviation of group dispersions in the ordination plots. That is a measure of spred of the data. The groups are created according to a given factor, and if they are without penetrations, there is a clear division into groups. If there is visible crossover between the groups, it means that the factor not only in itself breaks down the observed groups. The TVOC concentrations were significantly higher (p = 0.05084) in the family houses with attached garage (Figure 21). In all cases, direct access to the house was allowed from attached garage, which allowed the migration of organic pollutants into the household environment. The fact that high concentrations of VOC present in garages (mainly due to car emissions) can affect indoor concentrations has been confirmed in several studies [46,47,48,49,50,51,52,53]. The VOCs composition in garages reflects the compounds expected for gasoline vapours as well as compounds associated with paints, solvents, cleaning agents and other materials used and stored in households, garages and vehicles [53].
The influence on TVOC levels in indoor environment of selected households also had a type of heating but in lesser extent (p = 0.09091). However, the difference between central heating (CH) and solid fuel heating (SF) was not significant (p = 0.7798) and also the difference between gas boiler (G) and other types of heating (O—electric heater, heat pump) was not significant (p = 0.4535). During comparing central heating and solid fuel heating versus other types (G + O) were confirmed the effect on TVOC levels (p = 0.01461). It follows that higher concentrations of TVOC were observed in household with central heating as well as with solid fuel heating than in other households (Figure 22). However, this factor needs to be further examined.
The apartments were divided into three categories: ground floor (1), 1–3 floor (2), and above the 3rd floor (3). The initial analysis pointed to the significant influence of the floor on TVOC levels in the apartments. Because the difference in TVOC medians between the first two categories was small, two categories were tested in additional analysis: lower than 3rd floor and above 3rd floor. This test revealed a significant difference between the TVOC levels on the lower floors compared to the higher floors (p = 0.05675), while Figure 23 is shown the higher floor the higher levels. The influence of this factor can be explained by chimney effect. The opposite phenomenon was observed in a study of Jo et al. [54] where higher concentrations of methyl-tertiary butyl ether, benzene, and toluene were observed in lower-floor apartments than on higher floors.
For the number of users, the objects were divided into the following groups: ≥2 users (1), 3–4 users (2), >4 users (3). Figure 24 illustrates the fact that TVOC levels were significantly lower (by 67%) in households with greater number of users. The number of household users have a statistically significant effect on the TVOC concentrations in the indoor air (p = 0.04895) but closer testing only confirmed the less significant effect of the higher number of users to lower TVOC levels (p = 0.09933). On the other hand, Guo et al. [22] observed higher TVOC levels in household with higher number of occupants, which explained by the fact, that households with higher number of users frequently used air fresheners or cleaning products than households with lower number of users. Since human activity is a significant source of VOCs in the indoor environment, it is logical that the number of users will affect the TVOC levels. In our study, this may be a combination of several factors. Households with a larger number of users mostly had a larger floor area and therefore there was probably a better dilution of contaminants, which would explain the observed lower TVOC levels.

4. Conclusions

The recommended value of TVOC for indoor environment (200 µg/m3) was exceeded in 69% of households (94% of the apartments and 41% of the family houses). Based on a comparison of indoor and outdoor TVOC levels it was found that the indoor environment was a significant source of the pollution. The range of optimal operative temperature was not reached in either of the monitored objects. On the other hand, requirement for relative humidity in indoor environment was fulfilled in each household. The statistical evaluation of the data revealed a significant influence of the indoor air temperature, relative humidity and particulate matter concentrations (PM0.5 and PM1) on the TVOC levels. TVOC concentrations were significantly higher in the apartments than in the family houses as well as in the households where it is not a common practice to open windows during cleaning activities. The type of heating belonged to the factors that play an important role in the occurrence of organic compounds in the indoor environment. This study also confirmed that attached garage contribute to the higher levels of TVOC in the home. Higher concentrations were found in the apartments located on higher floors. The prevalence of SBS symptoms was rare and mostly reported symptoms were irritated or stuffy nose. Only 40% of household users knew about volatile organic compounds and about the possible risks that exposure to these substances might cause. However, only 13% of respondents takes into account VOC emissions when choosing building materials, paints, furniture etc. It follows that knowledge of this issue does not guarantee an aware approach. Nevertheless, the results of this study point to the need to inform the public not only in relation to the basic information on these compounds but also on the possibilities of improving indoor air quality, respectively indoor environmental quality as a whole.

Acknowledgments

This study was financially supported by Grant Agency of Slovak Republic to support of projects No. 1/0307/16.

Author Contributions

Silvia Vilčeková and Ľudmila Mečiarová conceived and designed the experiments; Ľudmila Mečiarová performed the experiments; Jozef Kiselák and Eva Krídlová Burdová analyzed the data; Ľudmila Mečiarová wrote the paper.

Conflicts of Interest

The authors declare no conflict of interest.

Abbreviations

The following abbreviations are used in this manuscript:
TVOCTotal volatile organic compounds
VOCsVolatile organic compounds
IAQIndoor air quality
I/OIndoor/outdoor ratio
IEQIndoor environmental quality
LPGLiquefied petroleum gas
CO2Carbon dioxide
TaIndoor air temperature
RHRelative humidity
PMParticulate matters
UVUltraviolet
ToOperative temperature
SBSSick building syndrome
NMDSNon-metric multidimensional scaling
B1–B18Apartments 1–18
D19–D35Family houses 19–35
SFSolid fuel heating
CHCentral heating
GGas boiler
OOther types of heating
COCombination of materials
PCPorous concrete
CSClay + stone
BBBurnt brick
LLaminate flooring
CCarpet

Appendix A

Sample questionnaire (translated from Slovak)
Information about the residential building and the apartment
1.
Year of construction of your residential building?
2.
Was your residential building renovated?
3.
If yes, when and what this renovation included?
4.
Is your residential buildings thermally insulated?
5.
If yes, what kind of thermal insulation?
6.
On which floor is your apartment?
7.
What is the total area of your apartment?
8.
What is the floor area of the room where the measurement is carried out?
9.
What is the ceiling height in the room where the measurement is carried out?
10.
What is the number, size (width × height), window material in the room where the measurement is carried out?
11.
What is the number, size (width × height), door material in the room where the measurement is carried out?
12.
What is the orientation of the windows in this room?
13.
What is the traffic density in the immediate vicinity of your apartment?
14.
Does your apartment any damage due to moisture?
15.
Do you have mould problems in your apartment?
16.
Do you have mould problems in the room where the measurement is carried out?
17.
What type of heating do you have in your apartment?
18.
What type of ventilation do you have in your apartment?
19.
What type of finishing (paint, wallpaper) is on the walls in the room where the measurement is carried out?
20.
What type of floor is in the room where the measurement is carried out?
21.
What type of furniture is in the room where the measurement is carried out?
22.
How many plants there are in the room where the measurement is carried out?
23.
Do you smoke indoors?
24.
Do you use a moth balls in the room where the measurement is carried out?
25.
Do you have newspapers or magazines in the room where the measurement is carried out?
26.
Do you use air fresheners, scented candles, aromatic sticks, aromatic oils, etc.?
27.
Do you use a printer or scanner in the room where the measurement is carried out?
28.
Do you store toys in the room where the measurement is carried out?
29.
Do you use art supplies in the room where the measurement is carried out?
30.
Do you use cleaning agents for cleaning?
31.
Do you use polishes or waxes for floors or furniture?
32.
How often do you clean the room where the measurement is carried out?
33.
Do you have open windows during cleaning?
34.
Was your apartment renovated?
35.
If yes, when was your apartment renovated?
36.
What did this renovation included? (new plasters + paint, new wallpapers, new furniture, new floors...)
37.
Have you ever heard about volatile organic compounds (VOCs)?
38.
When purchasing building materials, paints and furniture, does the information on VOC emissions from the product play a role in your decision?
Information about family house—following questions were added to previous questionnaire
39.
What is the main building material used to build your house?
40.
Do you have a garage?
41.
Is the garage connected to the house?
42.
Is it possible to enter the house from the garage directly through the door?
43.
Do you store paint, solvents, or gasoline in the garage?
Evaluation of IEQ
1.
Gender
2.
Age
3.
Smoking
4.
How many people live in your household?
5.
How much time do you spend at home per day?
6.
Do you have a pet?
7.
Do you have a problem with one of these factors at home? (yes, often/yes, sometimes/no, never)
(a)
Draught
(b)
Temperature too low
(c)
Temperature too high
(d)
Varying temperature
(e)
Stuffy (bad) air
(f)
Dry air
(g)
Unpleasant odour
(h)
Dust
8.
Have you ever been diagnosed by a doctor to have asthma?
9.
Have you ever been diagnosed by a doctor to have allergy?
10.
Do you feel the following symptoms while you stay at home? (yes, often/yes, sometimes/no, never)
(a)
Fatigue
(b)
Heavy-headed
(c)
Headache
(d)
Dizziness
(e)
Difficulties in concentration
(f)
Itching, burning or irritation of eyes
(g)
Irritated, stuffy or runny nose
(h)
Dry or sore throat
(i)
Cough
(j)
Dry or flushed scalp or ears
(k)
Hand dry, itching, red skin
(l)
Memory impairment

Appendix B

Table A1. Basic information about the apartments—Part 1.
No.Year of ConstructionThermal InsulationFloorHeating TypeTotal Floor Area (m2)Floor area in the Living Room (m2)FlooringFurnitureSurface Finishing of Walls/CeilingRenovation in Less Than 30 Weeks
B11984–1993no>3rdCH≥50 < 10018Lparticleboarddispersive paintno
B21955–1970yes>3rdCH≥50 < 10016Lparticleboarddispersive paintno
B31971–1983no>3rdCH≥50 < 10020Lparticleboarddispersive paintno
B41971–1983yes>3rdCH<5016Lwooddispersive paintno
B5after 1993yes1st–3rdCH≥50 < 10030Lwooddispersive paintno
B61955–1970yesground
floor
CH≥50 < 10018Cparticleboarddispersive paintno
B71955–1970yesground
floor
CH≥50 < 10018Cparticleboarddispersive paintno
B81955–1970no1st–3rdCH≥50 < 10035Lparticleboarddispersive paintno
B91971–1983no>3rdCH≥50 < 10025Lparticleboarddispersive paintyes
B101984–1993yes>3rdCH<5015Lparticleboarddispersive paintno
B111955–1970yesground
floor
CH≥50 < 10029Cparticleboarddispersive paintno
B121971–1983yes1st–3rdCH<5026Lparticleboarddispersive paintno
B13before 1955no1st–3rdO≥100 < 15042Owooddispersive paintyes
B14before 1955no1st–3rdO≥100 < 15035Owooddispersive paintno
B151955–1970yesground
floor
CH<5012Cparticleboarddispersive paintno
B161984–1993no>3rdCH≥50 < 10018Lparticleboarddispersive paintno
B171955–1970yes>3rdCH≥50 < 10023Lparticleboarddispersive paintyes
B181984–1993no>3rdCH≥50 < 10018Lparticleboarddispersive paintno
Table A2. Basic information about the apartments—Part 2.
No.Number of UsersPetTraffic DensityMouldSmoking IndoorFragrancesPlantsCleaning AgentsPolishes/WaxesFrequency of CleaningOpening Windows during Cleaning
B13–4nomediumnoyesyes8yesnoonce a weekno
B2≤2yeslownonoyes15yesnoevery 2–3 daysno
B3≤2yeslownonoyes2yesnoevery 2 weeksyes
B4≤2nomediumyesyesyes0nonoevery 2–3 daysyes
B5≤2yeslownoyesyes4yesyesevery 2–3 daysyes
B6≤2nomediumnonono2yesnoevery 2–3 daysyes
B73–4nomediumyesnono8yesnoevery 2–3 daysyes
B8≤2nolownonoyes4yesnoonce a weekyes
B93–4nomediumyesnono1yesyesevery 2–3 daysyes
B10≤2nolownonono0yesnoonce a weekyes
B11≤2nomediumnonono0yesnoonce a weekno
B12≤2nolownonoyes2yesnoevery 2–3 daysyes
B13≤2yesmediumyesnono6yesnoevery dayno
B14≤2nomediumnoyesno5yesnoonce a weekno
B15≤2yeslownonoyes5yesnoonce a weekyes
B16>4yeslownoyesyes0yesnoevery dayyes
B173–4nohighnonono0yesnoonce a weekyes
B183–4nomediumyesnono0yesnoonce a weekyes
Table A3. Basic information about the family houses—Part 1.
No.Year of ConstructionMain Building MaterialThermal InsulationHeating TypeTotal Floor Area (m2)Floor Area in the Living Room (m2)FlooringFurnitureSurface Finishing of Walls/CeilingRenovation in Less Than 30 WeeksGarageAttached Garage
D191955–1970COpolystyreneSF≥100 < 15080Lwooddispersive paintnonono
D20after 1993PC-SF≥15020Lparticleboarddispersive paintnoyesyes
D211955–1970CO-G<5012Lparticleboarddispersive paintyesnono
D22before 1955CSpolystyreneG≥50 < 10020Oparticleboarddispersive paintnoyesno
D23before 1955CS-G≥15025Lparticleboarddispersive paintnoyesno
D24before 1955CSpolystyreneG≥50 < 10015Lparticleboarddispersive paintnoyesno
D251971–1983BB-G≥100 < 15020Lparticleboarddispersive paintnoyesyes
D26after 1993BBpolystyreneSF≥15042Lwooddispersive paintnonono
D271955–1970PCpolystyreneSF≥15023Lparticleboarddispersive paintnoyesno
D28after1993BBmineralO≥15017Lparticleboarddispersive paintnonono
D291955–1970BBwoolG≥100 < 15017Cparticleboardaluminium paintnoyesno
D301955–1970CSpolystyreneG≥15022Lparticleboarddispersive paintnonono
D31after1993PCwood fibreO≥15030Owooddispersive paintnonono
D32after1993BBpolystyreneG≥15040Lparticleboarddispersive paintnoyesno
D33before 1955BB-SF≥100 < 15018Cparticleboarddispersive paintnonono
D34after1993BBpolystyreneG≥15089Lwooddispersive paintnoyesyes
D351971–1983PCpolystyreneG≥15016Lparticleboarddispersive paintnoyesyes
Table A4. Basic information about the family houses—Part 2.
No.Direct Entry from Garage to the HouseStorage of Paints, Solvents, or Gasoline in the GarageNumber of UsersPetTraffic DensityMouldSmoking IndoorFragrancePlantCleaning AgentsPolishes/WaxesFrequency of CleaningOpening Windows during Cleaning
D19nono≤2yeslownoyesno10yesnoevery 2–3 daysyes
D20yesyes3–4nolownoyesno15yesnoevery dayno
D21nono≤2nolownonono0yesnoevery 2–3 daysyes
D22noyes≤2nolownonoyes0yesyesonce a weekyes
D23noyes>4nolownonono0yesyesonce a weekyes
D24noyes3–4nolownonoyes2yesyesonce a weekyes
D25yesyes>4nolowyesnono2yesnoonce a weekno
D26nono>4nolownonono4yesnoevery dayno
D27noyes3–4nolowyesyesyes2yesyesevery 2–3 daysyes
D28nono>4nomediumnonono0nonoonce a weekyes
D29noyes≤2nolowyesnono0yesnoonce a weekno
D30nono3–4yesmediumnonono5yesnoevery dayyes
D31nono>4nolownonono18yesnoonce a weekyes
D32noyes3–4nomediumnonoyes11yesnoevery dayyes
D33nono>4nomediumyesnoyes7yesyesevery dayyes
D34yesyes3–4nohighnoyesno5yesyesevery 2–3 daysyes
D35yesyes3–4yeslownonoyes5yesnoonce a weekyes

References

  1. Uchiyama, S.; Tomizawa, T.; Tokoro, A.; Aoki, M.; Hishiki, M.; Yamada, T.; Tanaka, R.; Sakamoto, H.; Yoshida, T.; Bekki, K.; et al. Gaseous chemical compounds in indoor and outdoor air of 602 houses throughout Japan in winter and summer. Environ. Res. 2015, 137, 364–372. [Google Scholar] [CrossRef] [PubMed]
  2. Harrison, R.M.; Thornton, C.A.; Lawrence, R.G.; Mark, D.; Kinnersley, R.P.; Ayres, J.G. Personal exposure monitoring of particulate matter, nitrogen dioxide, and carbon monoxide, including susceptible groups. Occup. Environ. Med. 2002, 59, 671–679. [Google Scholar] [CrossRef] [PubMed]
  3. Gokhale, S.; Kohajda, T.; Schlink, U. Source apportionment of human personal exposure to volatile organic compounds in homes, offices and outdoors by chemical mass balance and genetic algorithm receptor models. Sci. Total Environ. 2008, 407, 122–138. [Google Scholar] [CrossRef] [PubMed]
  4. Thatcher, T.L.; Layton, D.W. Deposition, resuspension and penetration of particles within a residence. Atmos. Environ. 1995, 29, 1487–1497. [Google Scholar] [CrossRef]
  5. Technical Report No. 6: BTEX Personal Exposure Monitoring in Four Australian Cities. Available online: https://www.environment.gov.au/system/files/resources/dc6c0439-ac47–4c53–981a-876fa8d8e6d4/files/report6.pdf (accessed on 11 October 2017).
  6. McCreddin, A.; Gill, L.; Broderick, B.; McNabola, A. Personal exposure to air pollution in office workers in Ireland: Measurement, analysis and implications. Toxics 2013, 1, 60–76. [Google Scholar] [CrossRef]
  7. Villanueva, F.; Tapia, A.; Amo-Salas, M.; Notario, A.; Cabañas, B.; Martínez, E. Levels and sources of volatile organic compounds including carbonyls in indoor air of homes of Puertollano, the most industrialized city in central Iberian Peninsula. Estimation of health risk. Int. J. Hyg. Environ. Health 2015, 218, 522–534. [Google Scholar] [CrossRef] [PubMed]
  8. Azuma, K.; Uchiyama, I.; Ikeda, K. The risk screening for indoor air pollution chemicals in Japan. Risk Anal. 2007, 27, 1623–1638. [Google Scholar] [CrossRef] [PubMed]
  9. Brown, S.K. Volatile organic pollutants in new and established buildings in Melbourne, Australia. Indoor Air 2002, 12, 55–63. [Google Scholar] [CrossRef] [PubMed]
  10. Tuomainen, M.; Tuomainen, A.; Liesivuori, J.; Pasanen, A.L. The 3-year follow-up study in a block of flats-experiences in the use of the Finish indoor climate classification. Indoor Air 2003, 13, 136–147. [Google Scholar] [CrossRef] [PubMed]
  11. Järnström, H.; Saarela, K.; Kalliokoski, P.E.A.; Pasanen, A.L. Reference values for indoor air pollutant concentrations in new, residential buildings in Finland. Atmos. Environ. 2006, 40, 7178–7191. [Google Scholar] [CrossRef]
  12. Park, J.S.; Ikeda, K. Variations of formaldehyde and VOC levels during 3 years in new and older homes. Indoor Air 2006, 16, 129–135. [Google Scholar] [CrossRef] [PubMed]
  13. Qian, K.; Zhang, Y.; Little, J.C.; Wang, X. Dimensionless correlations to predict VOC emissions from dry building materials. Atmos. Environ. 2007, 41, 352–359. [Google Scholar] [CrossRef]
  14. Shin, S.H.; Jo, W.K. Longitudinal variations in indoor VOC concentrations after moving into new apartments and indoor source characterization. Environ. Sci. Pollut. Res. 2013, 20, 3696–3707. [Google Scholar] [CrossRef] [PubMed]
  15. Liu, J.; Bai, G.; Chen, J.; Zhu, L.; Guo, W.; Shen, X. Total volatile organic compound concentration and its influencing factors in urban indoor air after decoration. Chin. Sci. Bull. 2011, 56, 2683–2689. [Google Scholar] [CrossRef]
  16. Noris, F.; Adamkiewicz, G.; Delp, W.W.; Hotchi, T.; Rusell, M.; Singer, B.C.; Spears, M.; Vermeer, K.; Fisk, W.J. Indoor environmental quality benefits of apartment energy retrofits. Build. Environ. 2013, 68, 170–178. [Google Scholar] [CrossRef]
  17. Langer, S.; Bekö, G.; Bloom, E.; Widheden, A.; Ekberg, L. Indoor air quality in passive and conventional new houses in Sweden. Build. Environ. 2015, 93, 92–100. [Google Scholar] [CrossRef]
  18. Langer, S.; Bekö, G. Indoor air quality in the Swedish housing stock and its dependence on building characteristics. Build. Environ. 2013, 69, 44–54. [Google Scholar] [CrossRef]
  19. Kumar, A.; Singh, B.P.; Punia, M.; Singh, D.; Kumar, K.; Jain, V.K. Determination of volatile organic compounds and associated health risk assessment in residential homes and hostels within an academic institute, New Delhi. Indoor Air 2014, 24, 474–483. [Google Scholar] [CrossRef] [PubMed]
  20. Dodson, R.E.; Levy, J.I.; Spengler, J.D.; Shine, J.P.; Bennett, D.H. Influence of basements, garages, and common hallways on indoor residential volatile organic compound concentrations. Atmos. Environ. 2008, 42, 1569–1581. [Google Scholar] [CrossRef]
  21. Lee, S.C.; Li, W.M.; Ao, C.H. Investigation of indoor air quality at residential homes in Hong Kong-case study. Atmos. Environ. 2002, 36, 225–237. [Google Scholar] [CrossRef]
  22. Guo, H.; Kwok, N.H.; Cheng, H.R.; Lee, S.C.; Hung, W.T.; Li, Y.S. Formaldehyde and volatile organic compounds in Hong Kong homes: Concentrations and impact factors. Indoor Air 2009, 19, 206–217. [Google Scholar] [CrossRef] [PubMed]
  23. Ventilation and Indoor Air Quality in New Homes. PIER Energy-Related Environmental Research Program. Collaborative Report. CEC-500–2009–085. Available online: https://www.arb.ca.gov/research/apr/past/04-310.pdf (accessed on 11 October 2017).
  24. Bari, M.A.; Kindzierski, W.B.; Wheeler, A.J.; Héroux, M.Ѐ.; Wallace, L.A. Source apportionment of indoor and outdoor volatile organic compounds at homes in Edmonton, Canada. Build. Environ. 2015, 90, 114–124. [Google Scholar] [CrossRef]
  25. Guo, H. Source apportionment of volatile organic compounds in Hong Kong homes. Build. Environ. 2011, 46, 2280–2286. [Google Scholar] [CrossRef]
  26. Jia, C.; Batterman, S.; Godwin, C. VOCs in industrial, urban and suburban neighbourhoods-part 2: Factors affecting indoor and outdoor concentrations. Atmos. Environ. 2008, 42, 2101–2116. [Google Scholar] [CrossRef]
  27. Ohura, T.; Amagai, T.; Shen, X.; Li, S.; Zhang, P.; Zhu, L. Comparative study on indoor air quality in Japan and China: Characteristics of residential indoor and outdoor VOCs. Atmos. Environ. 2009, 43, 6352–6359. [Google Scholar] [CrossRef]
  28. Hippelein, M. Background concentrations of individual and total volatile organic compounds in residential indoor air of Schleswig-Holstein, Germany. J. Environ. Monitor. 2004, 6, 745–752. [Google Scholar] [CrossRef] [PubMed]
  29. Mentese, S.; Mirici, N.A.; Otkun, M.T.; Bakar, C.; Palaz, E.; Tasdibi, D.; Cevizci, S.; Cotuker, O. Association between respiratory health and indoor air pollution exposure in Canakkale, Turkey. Build. Environ. 2015, 93, 72–83. [Google Scholar] [CrossRef]
  30. Raw, G.J.; Coward, S.K.; Brown, V.M.; Crump, D.R. Exposure to air pollutants in English homes. J. Expo. Sci. Environ. Epidemiol. 2004, 14, 85–94. [Google Scholar] [CrossRef] [PubMed]
  31. Schlink, U.; Rehwagen, M.; Damm, M.; Richter, M.; Borte, M.; Herbarth, O. Seasonal cycle of indoor-VOCs: Comparison of apartments and cities. Atmos. Environ. 2004, 38, 1181–1190. [Google Scholar] [CrossRef]
  32. Zabiegała, B.; Górecki, T.; Przyk, E.; Namieśnik, J. Permeation passive sampling as a tool for the evaluation of indoor air quality. Atmos. Environ. 2002, 36, 2907–2916. [Google Scholar] [CrossRef]
  33. Neupauerova, A.; Stevulova, N. Volatile Organic Compounds in Indoor Environment of Buildings. Doctoral Thesis, Technical University of Kosice, Kosice, Slovakia, 2002. [Google Scholar]
  34. Ergonomics of the Thermal Environment—Instruments for Measuring Physical Quantities. European Standard En ISO 7726: 1998; International Organization for Standardization: Geneva, Switzerland, 1998. [Google Scholar]
  35. Anderson, M.J.; Gorley, R.N.; Clarke, K.R. Permanova + for Primer: Guide to Software and Statistical Methods; PRIMER-E Ltd.: Plymouth, UK, 2008. [Google Scholar]
  36. Hollander, M.; Wolfe, D.A. Nonparametric Statistical Methods, 2nd ed.; John Wiley & Sons: New York, NY, USA, 1973. [Google Scholar]
  37. Regulation of Ministry of Health Slovak Republic No. 210/2016 Coll. on Detailed Requirements for Indoor Environment of Buildings and Minimum Requirements for Low-Standard Flats and Accommodation Facilities; Regulation of Ministry of Health: Bratislava, Slovak, 2016.
  38. Mølhave, L.; Nielsen, G.D. Interpretation and limitations of the concept “Total volatile organic compounds” (TVOC) as an indicator of human responses to exposures of volatile organic compounds (VOC) in indoor air. Indoor Air 1992, 2, 65–77. [Google Scholar] [CrossRef]
  39. Fechter, J.O.; Englund, F.; Lundin, A. Association between temperature, relative humidity and concentration of volatile organic compounds from wooden furniture in a model room. Wood Mater. Sci. Eng. 2006, 1, 69–75. [Google Scholar] [CrossRef]
  40. Vilcekova, S.; Sedlakova, A.; Turcsanyi, P.; Meciarova, L.; Kridlova Burdova, E.; Varga, J.; Roskova, P. Ultra-low-energy house and indoor environmental quality: A case study. Int. J. Energy Environ. 2016, 10, 171–180. [Google Scholar]
  41. Bornehag, C.-G.; Stridh, G. Volatile Organic Compounds (VOC) in the Swedish Housing Stock. In Proceedings of the Healthy Buildings 2000, Espoo, Finland, 6–10 August 2000. [Google Scholar]
  42. Nazaroff, W.W.; Weschler, C.J. Cleaning products and air fresheners: Exposure to primary and secondary air pollutants. Atmos. Environ. 2004, 38, 2841–2865. [Google Scholar] [CrossRef]
  43. Singer, B.C.; Destaillats, H.; Hodgson, A.T.; Nazaroff, W.W. Cleaning products and air fresheners: Emissions and resulting concentrations of glycol ethers and terpenoids. Indoor Air 2006, 16, 179–191. [Google Scholar] [CrossRef] [PubMed]
  44. Nørgaard, A.W.; Kudal, J.D.; Kofoed-Sørensen, V.; Koponen, I.K.; Wolkoff, P. Ozone-initiated VOC and particle emissions from a cleaning agent and an air freshener: Risk assessment of acute airway effects. Environ. Int. 2014, 68, 209–218. [Google Scholar] [CrossRef] [PubMed]
  45. Bartzis, J.; Wolkoff, P.; Stranger, M.; Efthimiou, G.; Tolis, E.I.; Maes, F.; Nørgaard, A.W.; Ventura, G.; Kalimeri, K.K.; Goelen, E.; et al. On organic emissions testing from indoor consumer products’ use. J. Hazard. Mater. 2015, 285, 37–45. [Google Scholar] [CrossRef] [PubMed]
  46. Thomas, K.W.; Pelizzari, E.D.; Clayton, C.A.; Perritt, R.L.; Dietz, R.N.; Goodrich, R.W.; Nelson, W.C.; Wallace, L.A. Temporal variability of benzene exposures for residents in several New Jersey homes with attached garages or tobacco smoke. J. Expos. Anal. Environ. Epidemiol. 1993, 3, 49–73. [Google Scholar]
  47. Lansari, A.; Strecher, J.J.; Huber, A.H.; Crescenti, G.H.; Zweidinger, R.B.; Duncan, J.W.; Weisel, C.P.; Burton, R.M. Dispersion of automotive alternative fuel vapors within a residence and its attached garage. Indoor Air 1996, 6, 118–126. [Google Scholar] [CrossRef]
  48. Murphy, J.D., Jr.; Beebe, J.; Kennedy, D. Building Code Amendment Justification Research: Poor Indoor Air Quality Mitigation Relative to Attached Garages. In Proceedings of the 33rd American Security Council (ACS) Annual Conference; University of Washington: Seattle, DC, USA, 1997. [Google Scholar]
  49. Graham, L.A.; Noseworthy, L.; Fugler, D.; O’Leary, K.; Karman, D.; Grande, C. Contribution of vehicle emissions from an attached garage to residential indoor air pollution levels. J. Air Waste Manag. Assoc. 2004, 54, 563–584. [Google Scholar] [CrossRef] [PubMed]
  50. Tsai, P.Y.; Weisel, C.P. Penetration of evaporative emissions into a home from an M85-fueled vehicle parked in an attached garage. J. Air Waste Manag. Assoc. 2000, 50, 371–377. [Google Scholar] [CrossRef] [PubMed]
  51. Emmerich, S.J.; Gorfain, J.E.; Howard-Reed, C. Air and pollutant transport from attached garages to residential living spaces-literature review and field tests. Int. J. Vent. 2003, 2, 265–276. [Google Scholar] [CrossRef]
  52. Batterman, S.; Jia, C.; Hatzivasilis, G.; Godwin, C. Simultaneous measurement of ventilation using tracer gas techniques and VOC concentrations in homes, garages and vehicles. J. Environ. Monitor. 2006, 8, 249–256. [Google Scholar] [CrossRef] [PubMed]
  53. Batterman, S.; Jia, C.; Hatzivasilis, G. Migration of volatile organic compounds from attached garages to residences: A major exposure source. Environ. Res. 2007, 104, 224–240. [Google Scholar] [CrossRef] [PubMed]
  54. Jo, W.K.; Kim, K.Y.; Park, K.H.; Kim, Y.K.; Lee, H.W.; Park, J.K. Comparison of outdoor and indoor mobile source-related volatile organic compounds between low-and high-floor apartments. Environ. Res. 2003, 92, 166–171. [Google Scholar] [CrossRef]
Figure 1. Overview of TVOC levels in homes across the different studies [28,29,30,31,32].
Ijerph 14 01443 g001
Figure 2. Problems with factors affecting the IEQ.
Ijerph 14 01443 g002
Figure 3. Prevalence of SBS symptoms.
Ijerph 14 01443 g003
Figure 4. Indoor air temperature.
Ijerph 14 01443 g004
Figure 5. Operative temperature.
Ijerph 14 01443 g005
Figure 6. Relative humidity.
Ijerph 14 01443 g006
Figure 7. PM2.5 concentrations.
Ijerph 14 01443 g007
Figure 8. PM10 concentrations.
Ijerph 14 01443 g008
Figure 9. TVOC concentrations—the apartments.
Ijerph 14 01443 g009
Figure 10. TVOC concentrations—the family houses.
Ijerph 14 01443 g010
Figure 11. I/O ratio of TVOC levels.
Ijerph 14 01443 g011
Figure 12. Shepard plot.
Ijerph 14 01443 g012
Figure 13. Dependence of continuous variables.
Ijerph 14 01443 g013
Figure 14. Boxplot of total medians—the apartments and family houses.
Ijerph 14 01443 g014
Figure 15. Boxplot of total medians—windows opening during cleaning activities.
Ijerph 14 01443 g015
Figure 16. NMDS visualizing the level of similarity for the factor—windows opening during cleaning activities.
Ijerph 14 01443 g016
Figure 17. NMDS visualizing the level of similarity for the factor—attached garage.
Ijerph 14 01443 g017
Figure 18. NMDS visualizing the level of similarity for the factor—type of heating.
Ijerph 14 01443 g018
Figure 19. NMDS visualizing the level of similarity for the factor—floor of the apartments.
Ijerph 14 01443 g019
Figure 20. NMDS visualizing the level of similarity for the factor—windows opening during cleaning activities.
Ijerph 14 01443 g020
Figure 21. Boxplot of total medians—attached garage.
Ijerph 14 01443 g021
Figure 22. Boxplot of total medians—type of heating.
Ijerph 14 01443 g022
Figure 23. Boxplot of total medians—floor of the apartments.
Ijerph 14 01443 g023
Figure 24. Boxplot of total medians—number of users.
Ijerph 14 01443 g024
Table 1. Basic information about measuring instruments.
NameUnitRangeAccuracy
TESTO 175-H2—Ta, Te°C−20~+70±0.5
TESTO 175-H2—RH%0~100±3
HANDHELD 3016 IAQµm0.3~1050% @ 0.3 μm; 100% for particles >0.45 μm (per ISO 21501-4)
Vernon-Jokl globe thermometer°C0~50-
ppbRAE 3000ppm1~10,000±3% in calibration point
Table 2. Results from envfit.
Variables r2p
Number of users0.16890.04895 *
Heating type0.18140.09091
Windows opening during cleaning activities0.15550.01798 *
Floor of the apartments0.27410.06397
Attached garage0.21480.05195 .
Temperature0.16140.04496 *
Relative humidity 0.20880.01698 *
PM0.50.15440.07493
PM10.15950.06893
Significance level: “*” 0.05; “.” 0.1.
Table 3. Results from Wilcoxon rank sum test.
VariablesWp
The apartments vs. family houses2130.04865 *
Number of users smaller than 41300.09933 .
Heating—SF and CH2190.01461 *
Windows opening during cleaning activities500.01019 **
Higher than 3rd floor in the residential building220.05675 *
Attached garage410.05084 *
Significance level: “**” 0.01; “*” 0.05; “.” 0.1.

