1. Introduction
Ambient air quality in many Chinese cities exceeds both national standards and international guidelines [
1,
2]. Sulfur dioxide (SO
2) emission is one of the most serious air pollution problems in China, causing a series of environmental problems and health issues [
3,
4,
5,
6,
7,
8]. As the largest SO
2 emitter globally (According to statistics, national energy-related SO
2 emissions in China were several times than those in other countries from 2011 to 2013. (Source: National Bureau of Statistics of the People’s Republic of China, World Bank and The Statistics Portal)), China has also actively undertaken this duty of its mitigation, and implemented many policies and programs, such as 10th Five-Year (2001–2005) and 11th Five-Year (2006–2010) Plans, which are a series of social and economic development initiatives, and contain detailed economic development guidelines for all its regions. The SO
2 reduction goal was to reduce SO
2 emissions 10% below the levels of the year 2000 according to the 10th Five-Year Plan. In the 11th Five-Year Plan, the goal of abating SO
2 was to reduce the emissions 10% below the levels of the year 2005. The 12th Five-Year (2011–2015) and 13th Five-Year (2016–2020) Plans (For the details please visit the website
http://www.gov.cn), are also ambitious to reduce SO
2 emissions and improve air quality. However, China is encountering great pressure to implement emission reduction because it is undergoing a rapid industrialization process with massive energy consumption and thriving industrial production [
9,
10]. The coal-type consumption share is the largest due to China’s energy endowment [
11]. Such a coal-dominated energy structure in China’s industrial sectors has caused a large amount of SO
2 emissions, and thus the environmental deterioration for a long time. Thus, how to solve environmental problems cost-effectively in China’s industrial sectors attracts many attentions from the policy makers and the academia as well.
Air pollution is a typical example of “Negative Externalities” in economics. The key to solving the environmental problem in production is how to make firms take into account the cost of the negative externality. Generally speaking, there are two approaches to reduce emissions in economic theories. One is the Pigouvian tax, designed to correct negative externalities, that imposes costs (e.g., pollution taxes) on emitters. A pollution tax is a policy measure by government as it has relatively low transaction costs associated with implementation. But, it’s impossible for the government to know all information affecting individuals to set the optimal tax rate. Thus, the government starts to pay more attention to the other approach [
12,
13,
14,
15,
16]: the market approach (for example, the emission trading systems, based on Coase [
17]), which is characterized by cost-effectiveness, flexibility, certainty about quantity, and minimizing risk. Later, many countries established active trading programs in air pollutants to resolve environmental problems, such as the SO
2 trading market in America, and the carbon trading system in the Europe.
Since 2007, the State Council of the People’s Republic of China (SCPRC) has started some pilot emission trading programs in several provinces of China. Then the SCPRC released “Guiding opinions on further promoting the pilot work of paid use and trading of emission rights” in 2014 [
18], which means that a national-level pollution emission trading system (ETS) will be established in China. The implementation of total emission amount control is the premise of these pilot projects. According to the SCPRC, these projects in China should adopt quota selling or auction to assign pollution rights. The price of quota selling can be determined by the local pollution control costs, environmental resource scarcity, economic development level, etc. The reserve price in an auction can refer to the standard of quota selling. The polluters shall obtain the pollution rights by trading pollution emission allowances. However, Wang and Zhang [
19] point out that these pilot projects in China are controlled by the government and lack of price formation mechanism. Pollution pricing is one of the important functions of the pollution ETS. In an effective pollution pricing mechanism, tradable allowances can create an incentive for polluters to determine the most cost-effective approach to reducing pollution [
20]. In this context, it is crucial for the academia and policy makers to understand the operation of the emerging pollution ETS in China.
Our paper aims to explore a key issue relevant to China’s pollution ETS: the marginal abatement costs (MACs) of SO
2 emissions. Estimating the marginal abatement costs (MACs) can provide valuable information for the policy makers to improve the operating rules of ETS, especially pollution pricing. The pollution ETS transforms SO
2 emission allowances into a new type of tradable financial product. Firms can make decisions by comparing market prices of allowances with MACs. The sectors with low MACs (compared with the market price) may offer unused allowances for sale and owners with high MACs may shop for sale if they hold insufficient allowances to cover their planned emissions. Only when a rational pricing mechanism is established, the government can truly achieve the abatement goals by transferring the pollution abatement tasks from the production units with higher MACs to the ones with lower MACs. More importantly, if this SO
2 trading market works as planned, one should see the cost of reducing additional amounts of SO
2, which is equal to MACs [
21,
22]. Therefore, the MACs should be used as a reference for pollution pricing through emission allowance allocation.
In summary, the following key issues should be addressed: At the first phase of the trading market, which sector(s) should be mandatory for participation? What are the MACs of SO2 emission allowances? At first it is essential to quantify the emission contribution of different industrial sectors in the Chinese economy. By doing so, major emitters can be identified; and policy makers may know what industrial sectors should be covered in the Chinese pollution ETS. Then this paper estimates marginal abatement costs of China’s industrial sectors at the national, provincial, and sectoral levels. Once the MACs of pollution emission allowances at these three perspectives are estimated, our empirical study could provide key information for the policy makers to formulate more appropriate pollution abatement policies in the operation of pollution ETS.
To estimate the emission contribution of SO
2, this paper applies the input-output (I-O) method to distinguish the sectoral emissions and identify the shares of individual industries [
8,
23]. Multiple methods have been used to estimate the MACs of harmful emissions, such as Cost-Benefit Analysis, Dynamic Optimization Model, Input-Output Analysis, Computational General Equilibrium Model, Integrated Assessment Model and Shadow Price Approach [
22,
24,
25,
26]. The concept of shadow price is used widely to estimate marginal abatement costs [
21,
27,
28,
29,
30]. The shadow prices of SO
2 emissions may be interpreted as the opportunity cost of an incremental SO
2 reduction in terms of giving up good outputs in a production process. Many scholars have begun to study the shadow prices. For example, Swinton [
21] provides an estimation of shadow prices of SO
2 abatement using the output distance function approach for coal-burning electric plants. Mekaroonreung and Johnson [
29] formulate a convex non-parametric least square quadratic optimization problem to estimate a frontier production function and apply the method to estimate shadow prices of SO
2 and NO
x generated by the U.S. coal power plants. He and Chen [
31] introduce a dynamic optimization method to estimate shadow prices of water right. These methods only calculate the shadow price in a specific industry or national level and may not be useful in calculating shadow prices in provincial level. This paper calculates the shadow prices of SO
2 emission allowances by a pricing model based on the shadow price theory, which is very flexible in the level of application and can be applied to the cases of sectors, regions, or even the whole country. As discussed earlier, to realize the overall goal, the firm can sell excess SO
2 emission allowances with a higher price (e.g., its shadow price) than the market price under the premise that the firm will have sufficient SO
2 emission allowances. With the sale of superfluous SO
2 emission allowances in the market, the market will reach an equilibrium until the shadow price is equal to the market price. Thus, this paper calculates the shadow price of SO
2 emission allowances based on the principles of operational research, reflecting the intrinsic value and marginal cost of allowances. Using this model combined with the I-O method, the paper can estimate shadow prices of industrial sectors from the national, provincial and sectoral levels; therefore, it offers an efficient way to track the complex relationship between sectors and provinces and can compare the shadow prices of different provinces and sectors in a consistent statistical caliber.
This paper is organized as follows.
Section 2 introduces the structure of an integrated assessment framework of shadow price model and the SO
2 emission calculation model on energy consumption.
Section 3 shows the data source in this paper.
Section 4 presents the results and discussions. Finally,
Section 5 summarizes our results and provides some policy implications.
3. Data
In the shadow price model, the profit of unit output value is used to replace the income generated by the unit output, using as a representative. In this paper, the profit of unit output value is the ratio of the total profit and the total output value in a particular period. Besides, in this paper, the formula for the proportion coefficient of SO2 emissions on the unit production scale, using as a representative, is the amount of emissions divided by the output value.
Data sources are “China Statistical Yearbook” (2012) and “Statistical Yearbook” of different provinces (2012), from which we select the total industrial output value and the total profits of various industries; “Input-Output Tables of China” (2012) and “China Energy Statistical Yearbook” (2012), from which we select the main energy consumption amount of the various industries.
The calculation of the SO
2 emissions from various industries is based on the Equation (
3) and the SO
2 emission allowances’ shadow prices of different industries in China and 28 provinces for 2012 are calculated based on Equation (
9). Due to lack of data it does not include Hong Kong, Macao and Taiwan, Gansu, Inner Mongolia and Tibet.
4. Results and Discussions
In this section, the main findings of the research are presented. The section begins with
Table 2 that shows Chinese industrial sectors in the I-O tables. National Development and Reform Commission (NDRC) issues the notice of building the national carbon emissions trading market in 2017. There are already some regulations for the national carbon emission trading market in 2017, which may guide the pollution emission trading market. According to NDRC, national carbon emissions trading will cover the industries including petrochemical industry, building materials industry, building materials industry, iron and steel industry, non-ferrous industry, paper and pulp industry, electric industry, and aviation industry. The industrial sectors contained in our calculation cover these above industries.
This paper focuses on the shadow prices of SO2 emission allowances at the national level, provincial level, and sectoral level to explore the pollution emission trading mechanism. The Chinese pollution ETS should follow three fundamental principles, i.e., reducing pollution abatement costs through a government-guided market system, aiming at controlling pollution emissions, and focusing on industries with high emissions. The intention in this paper is to determine the price of pollution and let firms to bear the cost. Our paper pays more attention to the heavy-polluting industries which produce relatively more SO2 emissions and have lower shadow prices. If an industry doesn’t pollute the environment seriously, we shouldn’t consider it into the first phase of the market. Based on this consideration, this paper only selects the polluting industries whose SO2 emissions are over 1% of the total emissions in a given area. Thus, the paper only shows the shadow prices of polluting industries in the following text.
4.1. The Shadow Prices of Sulfur Dioxide Emission Allowances in China
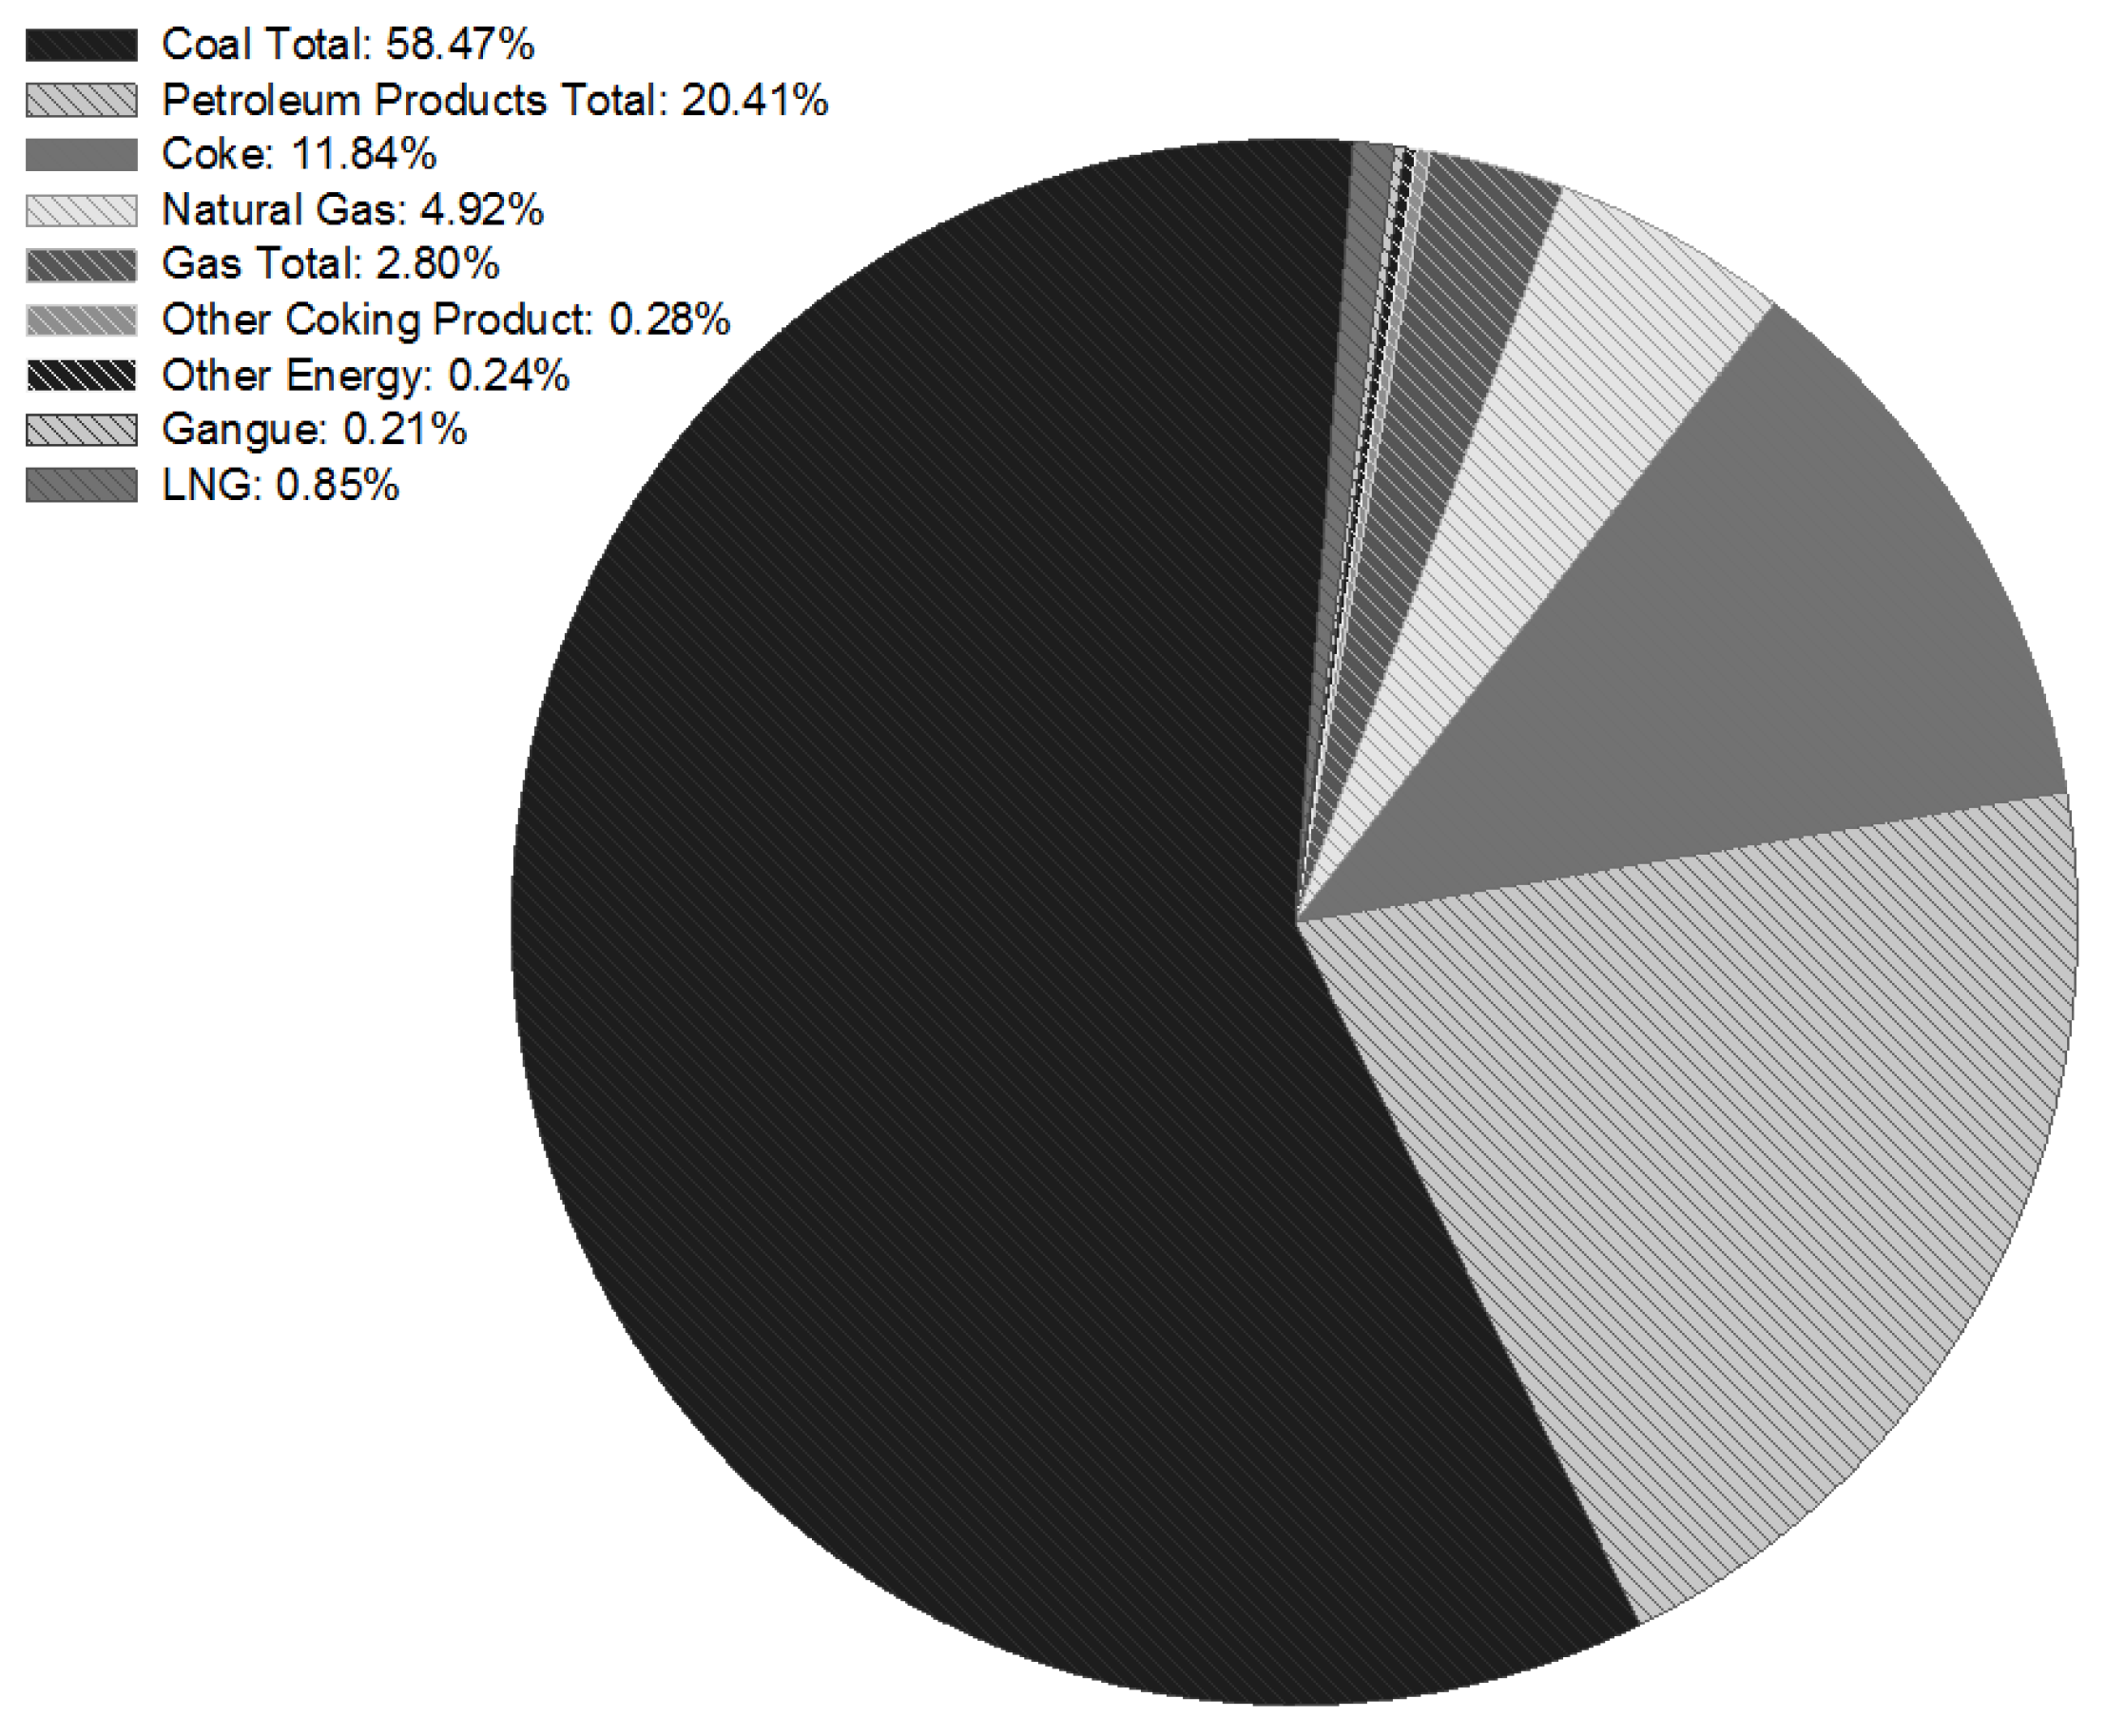
According to the national energy balance sheet, Chinese energy consumption ratio in 2012 is shown in
Figure 1. It can be seen that Coal Total is the primary energy source, accounting for 58.47% of total energy consumption. Petroleum Products Total accounts for 20.41%, Coke accounts for 11.84%, Natural gas accounts for 4.92%, and other energies account for a relatively small proportion. Fossil fuels have been playing the dominant role and the coal-type consumption share is the largest due to China’s energy endowment. China’s coal-dominated energy mix poses special difficulties to emission reduction. Given consideration to both China’s economic development and SO
2 reduction targets, estimating MACs of SO
2 emissions is the key aspect for the emission mitigation in China’s industrial sector or even the whole China.
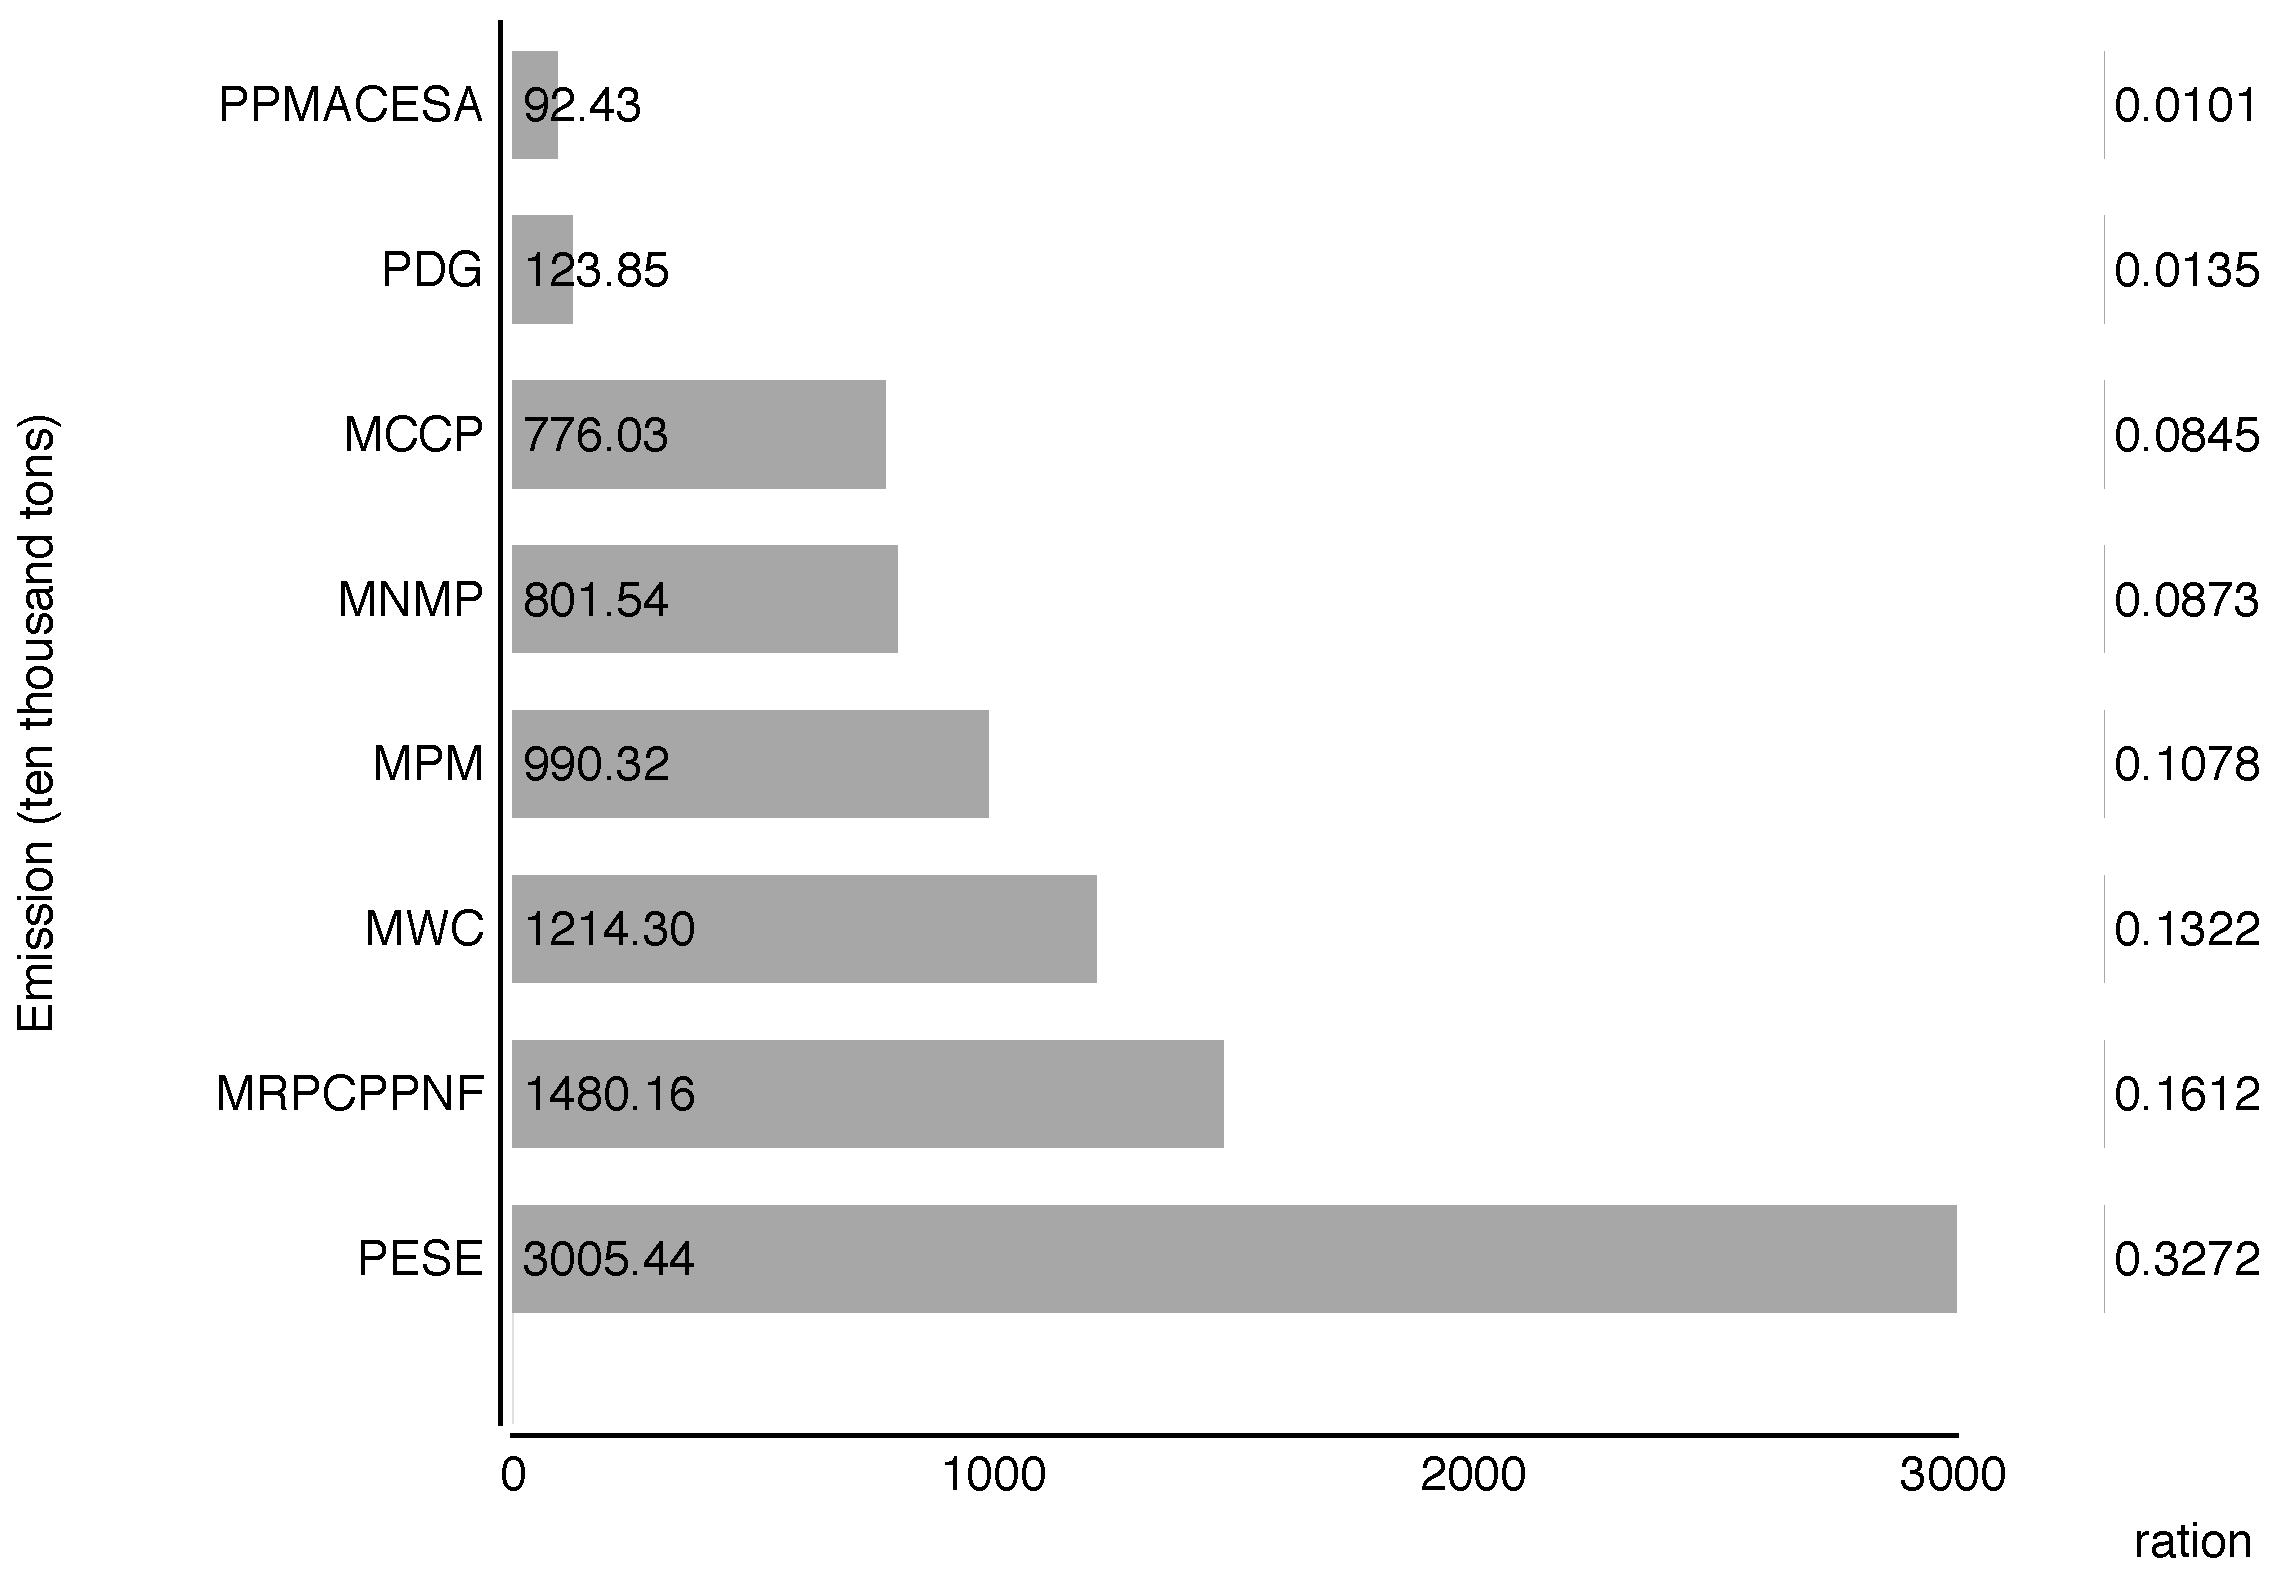
The polluting industries are shown in
Figure 2, which in total cover over 70% of the national SO
2 emissions. PESE, MRPCPPNF, MWC, MPM, MNMP, MCCP, PDG, and PPMACESA are the main emitters of China, which contain the industries covered by national carbon emission trading market. To abate national SO
2 emissions, the policy makers may need to concentrate heavily on the key industries, especially those major emitters.
There are large differences in the shadow prices of polluting industries. As
Table 3 indicates, the lowest shadow price is 0.20 ten thousand Yuan/ton (ttY/t) in MRPCPPNF; the highest shadow price is 19.09 ttY/t in PPMACESA. The profit of unit output value of MRPCPPNF is small, but relatively more SO
2 emissions, therefore the marginal cost of further reduction is very small. The profit of PPMACESA is big, but relatively less emissions, so its shadow price is very high. Although PSES is the biggest emitter of sulfur dioxide emissions at the national level, the marginal cost of further reduction is lower than other industries, except for MRPCPPNF. Thus, PESE and MRPCPPNF have the bigger potential in reducing pollution. MCCP and PPMACESA may be buyers in the pollution trading market because of their higher gains of using an additional unit of allowance outweigh the cost.
4.2. The Shadow Prices of Sulfur Dioxide Emission Allowances of Different Provinces
China has a vast territory; the economic development level and pattern of industrialization and urbanization significantly differ across provinces. It is necessary to calculate the shadow prices of SO
2 at the provincial level. Since 2007, the Ministry of finance, Ministry of environmental protection, and Development and Reform Commission have approved 11 local pilot pollution emission trading programs [
34]. In this section, the paper only shows the shadow prices of pilot provinces, including Jiangsu, Zhejiang, Hunan, Hubei, Henan, Hebei, Shanxi, and Shaanxi (see
Table 4).
At provincial level, the variation in different shadow price estimates could help our country identify a least-cost strategy for SO2 emission abatement. The overall weighted average of shadow prices (OWASPs), which is weighted by the SO2 emissions’ shares of individual industries at provincial level, of Jiangsu, Zhejiang, Hunan, Hubei, Henan, Hebei, Shanxi and Shaanxi are 3.70, 2.37, 1.99, 5.93, 2.32, 0.88, 1.19 and 2.44 ttY/t, respectively. The highest OWASPs is 3.44 ttY/t in Shaanxi, showing that the potential for reducing emissions in Shaanxi is relatively small. The lowest OWASPs is 0.88 ttY/t in Hebei, showing that Hebei has a greater potential in emission reduction.
Jiangsu: The information of shadow prices in Jiangsu is shown in
Table 4. The lowest shadow price is 0.68 ttY/t in PSES because the profit of PSES in Jiangsu province is relatively small compared with its emission. Thus, it’s necessary for PSES to take measures to control its emission. The highest shadow price is 28.22 ttY/t in CN because of the relatively big profit. From the Input-Output table of Jiangsu province, the total output value ratio of CN is 6.64%, which is higher than most industries. Thus, CN in Jiangsu could be a buyer in the market. The shadow prices of MCCP and CN are higher than PESE, MRPCPPNF, MWC, MPM, PPMACESA, and MNMP.
Zhejiang: As you can see in
Table 5, this paper shows the industries whose SO
2 emissions are over 1% of the whole province. In these industries, the lowest shadow price is 0.90 ttY/t in PESE, and the highest price is 17.97 ttY/t in MCCP. Although the shadow price in MWC is only 0.37 ttY/t, the SO
2 emissions of MWC are below 1% of the total emission. Thus, the paper doesn’t show it in the
Table 4. Besides, the profit of MWC in Zhejiang province is relatively small. The same is MRPCPPNF.
Hunan: As the chart shows, the lowest shadow price is −0.41 ttY/t in MRPCPPNF. The profit of MRPCPPNF in Hunan is negative. But MRPCPPNF discharges more SO2 emissions, the government should pay more attention to MRPCPPNF. The highest shadow price is 11.78 ttY/t in MCCP. The industries of low SO2 shadow prices are PSES, MWC, and MNMP respectively.
Hubei: MRPCPPNF has a negative profit in 2012, so the shadow price is negative. The emission in MRPCPPNF is big. The government should pay more attention to MRPCPPNF. The shadow price in CN is very high, up to 25.91 ttY/t, with relatively higher profit and less emission. The shadow price of PSES is 1.02 ttY/t. The shadow price of MWC is the lowest. MNMP, MCCP and MPM also should be highlighted.
Henan: As shown in
Table 4, the lowest shadow price is 0.10 ttY/t in PSES. Besides, the SO
2 emission of PSES is the lowest. The second-lowest shadow price is 0.57 ttY/t in MRPCPPNF because of the big emission amount and low profit. The highest shadow price of MNMP is 29.33 ttY/t in Henan. Therefore, the government should pay more attention to PSES, MRPCPPNF, MWC, MNMP, MPM, and MCCP.
Hebei: The most prominent five industries are PESE, MRPCPPNF, MWC, MPM, and MNMP. The shadow prices of PESE, MRPCPPNF, MWC, MPM, and MNMP are 0.64, 0.06, 5.51, 1.80, and 2.83 ttY/t, respectively.
Shanxi: As
Table 4 describes, the amount of sulfur dioxide emission from the industrial sectors is not large, because our calculation of sulfur dioxide emission is based on the I-O table. Shanxi is rich in mineral resources and holds the very great proportion reserves in the national coal mine. Most of Shanxi cities are the mining cities. The productions of MWC are sent out to other provinces. Thus, the industries’ energy using releases a small number of emissions. MRPCPPNF has negative profits, so its shadow price is negative. There is little difference between SO
2 emission of MWC and PSES, but the profit of MWC is higher than PESE. According to the emissions and shadow prices, the government should take more heavy environmental regulations on MRPCPPNF, MWC, PESE, and MPM.
Shaanxi: The shadow prices of Shaanxi are not very small. The lowest shadow price is 2.44 ttY/t in PESE. The shadow price of CN is the highest. PESE, MRPCPPNF, and MNMP have a greater potential in emission reduction.
4.3. The Shadow Price of Sulfur Dioxide Emission Allowances in Key Industries
According to the results from the above pilot provinces, this paper regards MWC, MRPCPPNF, MCCP, MNMP, MPM and PESE as key industries. The shadow prices of these industries are shown in
Table 5.
The variation in the estimation of shadow prices across different industrial sectors shows the necessity of utilizing market power to achieve a cost-effective pollution reduction. According to the shadow price model, there is a negative correlation between the shadow price of SO2 emission allowances for the compliance sectors and its proportion coefficient of SO2 emissions on the unit production scale. For example, a firm in MCCP has a highest OAWSP of 8.40 ttY/t. The higher shadow prices mean that these sectors’ utility rates for energy are high, and the cost of further energy-saving is relatively high. For instance, some energy-intensive sectors discharge pollutants because of Chinese energy mix. Other energy-intensive sectors release emissions because of inefficiency; hence it may reduce SO2 emissions through its own managerial and technological efforts by comparing its shadow price with the market price. In addition, compared national shadow prices with OAWSPs, it’s obvious that the abatement potential of key industries is underestimated considering the provincial differences except for MRPCPPNF. Specifically, the shadow prices of 28 provinces in MWC are from 0.19 to 25.24 ttY/t. Guangxi, Shanxi, and Shaanxi have a higher price in MWC than other provinces. Many provinces have a negative profit on MRPCPPNF in 2012, such as Tianjin, Ningxia, Liaoning, Guangxi, and so on. The shadow prices of MCCP are relatively high at whatever provinces. The MACs of MNMP are from 0.43 to 29.34 ttY/t. The MAC of MPM at the national level is 3.49 ttY/t. The marginal abatement costs in PESE are lower than others sectors in most provinces. PESE and MRPCPPNF should be the focus of the whole China because them have a relatively greater abatement potential.
By comparison, the paper presents the shadow prices (see details in
Table 6) from the existing literature and those from this study. Whatever the sulfur dioxide emission trading market in the USA or the carbon emission trading market in EU, electric industry is the first included industry. The existing literatures discuss the shadow prices of coal power plants or coal-burning. In this paper, we regard PESE as the main electric industry. From
Table 6, the shadow price of PESE in China is 9136 Yuan/ton, which is lower than estimates from the previous studies in the case of SO
x. This discrepancy can be explained as follows: different countries and regions have different economic development levels and pollution emissions; our paper estimates shadow prices of industrial sectors from the national, provincial and sectoral levels by the shadow price model combined with the I-O method. Besides, there has been some pilot sulfur dioxide trading programs in China. Jiangsu is the first pilot province and relatively mature. The price of SO
2 allowances in Jiangsu is 4480 Yuan/ton [
35], which is lower than our study. It might indicate that the value of SO
2 allowances in Jiangsu at the present stage was underestimated.
5. Conclusions
China has launched its pilot pollution ETS in order to achieve its target for decreasing national SO2 emissions in a cost-effective way. Identifying major SO2 emitters and estimating MACs of SO2 emissions provides a scientific foundation for the operating rules. This paper quantifies the emission contribution of different industrial sectors in the Chinese economy by an I-O method, and estimates SO2 emission allowances’ shadow prices of industrial sectors at the national level, provincial level, and sectoral level by the shadow pricing model. The shadow prices may be interpreted as the MACs of SO2 emission allowances for the participating sectors. Conclusions and some important policy implications are summarized as follows.
Firstly, it is suggested that these sectors (MWC, MRPCPPNF, MCCP, MNMP, MPM, and PESE) should be covered in the first stage of pollution ETS. According to the estimation of SO
2 emissions in different industries at the national level and provincial level, MWC, MRPCPPNF, MCCP, MNMP, MPM and PESE are major emitters. In addition, the PESE sector has the highest share of the whole emissions of SO
2 at the national level and most provinces (e.g., Jiangsu, Zhejiang, and Henan). Similar to our findings, the SO
2 ETS in U.S. began in 1995 and covered coal-burning electric utility plants at Phase I [
40].
Secondly, the shadow prices of SO2 emissions differ at sectoral level. The variation in the estimation of shadow prices shows the necessity of utilizing market power to achieve a cost-effective SO2 emission abatement. If an industry has a high shadow price, it will become a buyer in the emission trading market for the gains outweigh the costs of the use of an additional allowance. By contrast, it will reduce its emissions to become a seller in this market with low shadow prices. Through emission trading, both suppliers and buyers would obtain potential benefits or cost savings from the ETS. Thus, the participant industries in the pollution ETS may design appropriate strategies based on our empirical analysis. For example, the heavy industry (e.g., PESE and MRPCPPNF in our calculation) tends to have lower MACs but sufficient SO2 emission allowances, and could be better to reserve the remaining allowances because of the underestimation of market prices in pilot markets, like Jiangsu.
Thirdly, the shadow prices of the same sector from different provinces differs a lot. The economic development level and pattern of industrialization and urbanization significantly differ across provinces. For example, the share of heavy industry in the total industry in 2012 was 75.69% in the central region, which is greater than that in the western region (73.30%) and eastern region (70.60%) [
10]. Consequently, there are large differences in the SO
2 shadow prices of the same industrial sector from different provinces. For instance, the shadow prices in MWC are from 0.19 to 25.24 ttY/t. It’s necessary to calculate the shadow prices from different provinces. Thus, it is suggested that at the initial stage of the Chinese pollution ETS, the government should take the provincial differences into consideration to price pollution emission allowances, e.g., there could be some regional trading systems in the first stage of pollution ETS.
In addition, the government may take various measures to keep a perfect ETS (e.g., a fair market). In general, the allowances are freely allocated on “grandfathering” at the first stage of pollution ETS. According to the allocation plan, the light industries that emit less SO
2 emissions would obtain fewer allowances than the heavy industries. But, our result shows that compared to the firms in light industries, the firms in heavy industries tend to bear lower MACs, e.g., the PESE and MRPCPPNF have the strong incentive to abate pollution to be sellers in the market. According to Zhou et al. [
30], it implies that the participating firms in the heavy industries would have an opportunity to invest but the firms in the light industries may have to purchase sufficient allowances, which deviates from the principle of fairness in the market Provincial differences can also lead to similar phenomenon. In this regard, we suggest that the MACs of the participating sectors should be used as a supplementary criterion in the initial allocation of allowances in order to establish a fair pollution trading market.
Policy Implications
Our empirical results have several important policy and managerial implications which could be considered by the government. Firstly, it is suggested that MWC, MRPCPPNF, MCCP, MNMP, MPM, and PESE should be covered in the first stage of pollution ETS. Secondly, there could be some regional trading systems in the first stage of pollution ETS considering provincial differences. Then, the MACs of participating sectors (or firms) could be used as an important criterion in the initial allocation of SO2 allowances. Last but not least, the MACs should be used as a pricing benchmark in the pollution ETS. Our empirical study is remarkably supportive for pollution pricing mechanism of the Chinese pollution ETS. Only when a rational pricing mechanism is established can the pollution ETS create an incentive for polluters to determine the most cost-effective approach to reducing pollution. In addition to the above contributions, this paper calculates the MACs of industrial sectors from three perspectives (national level, provincial level, and sectoral level), which is very flexible in the level of application and can be applied to the cases of sectors, regions, or even the whole country. Thus, it offers an efficient way to track the complex relationship between sectors and provinces and compares the shadow prices of different provinces and sectors in a consistent statistical caliber. Given data availability, this work could be easily extended to other pollution emissions within the same industrial sectors.


