
Lunch Salad Bars in New Orleans’ Middle and High Schools: Student Intake of Fruit and Vegetables

 , ,
, ,
Abstract
:1. Introduction
2. Materials and Methods
2.1. Study Design
2.2. Participants
2.3. Data Collection
2.4. Data Analysis
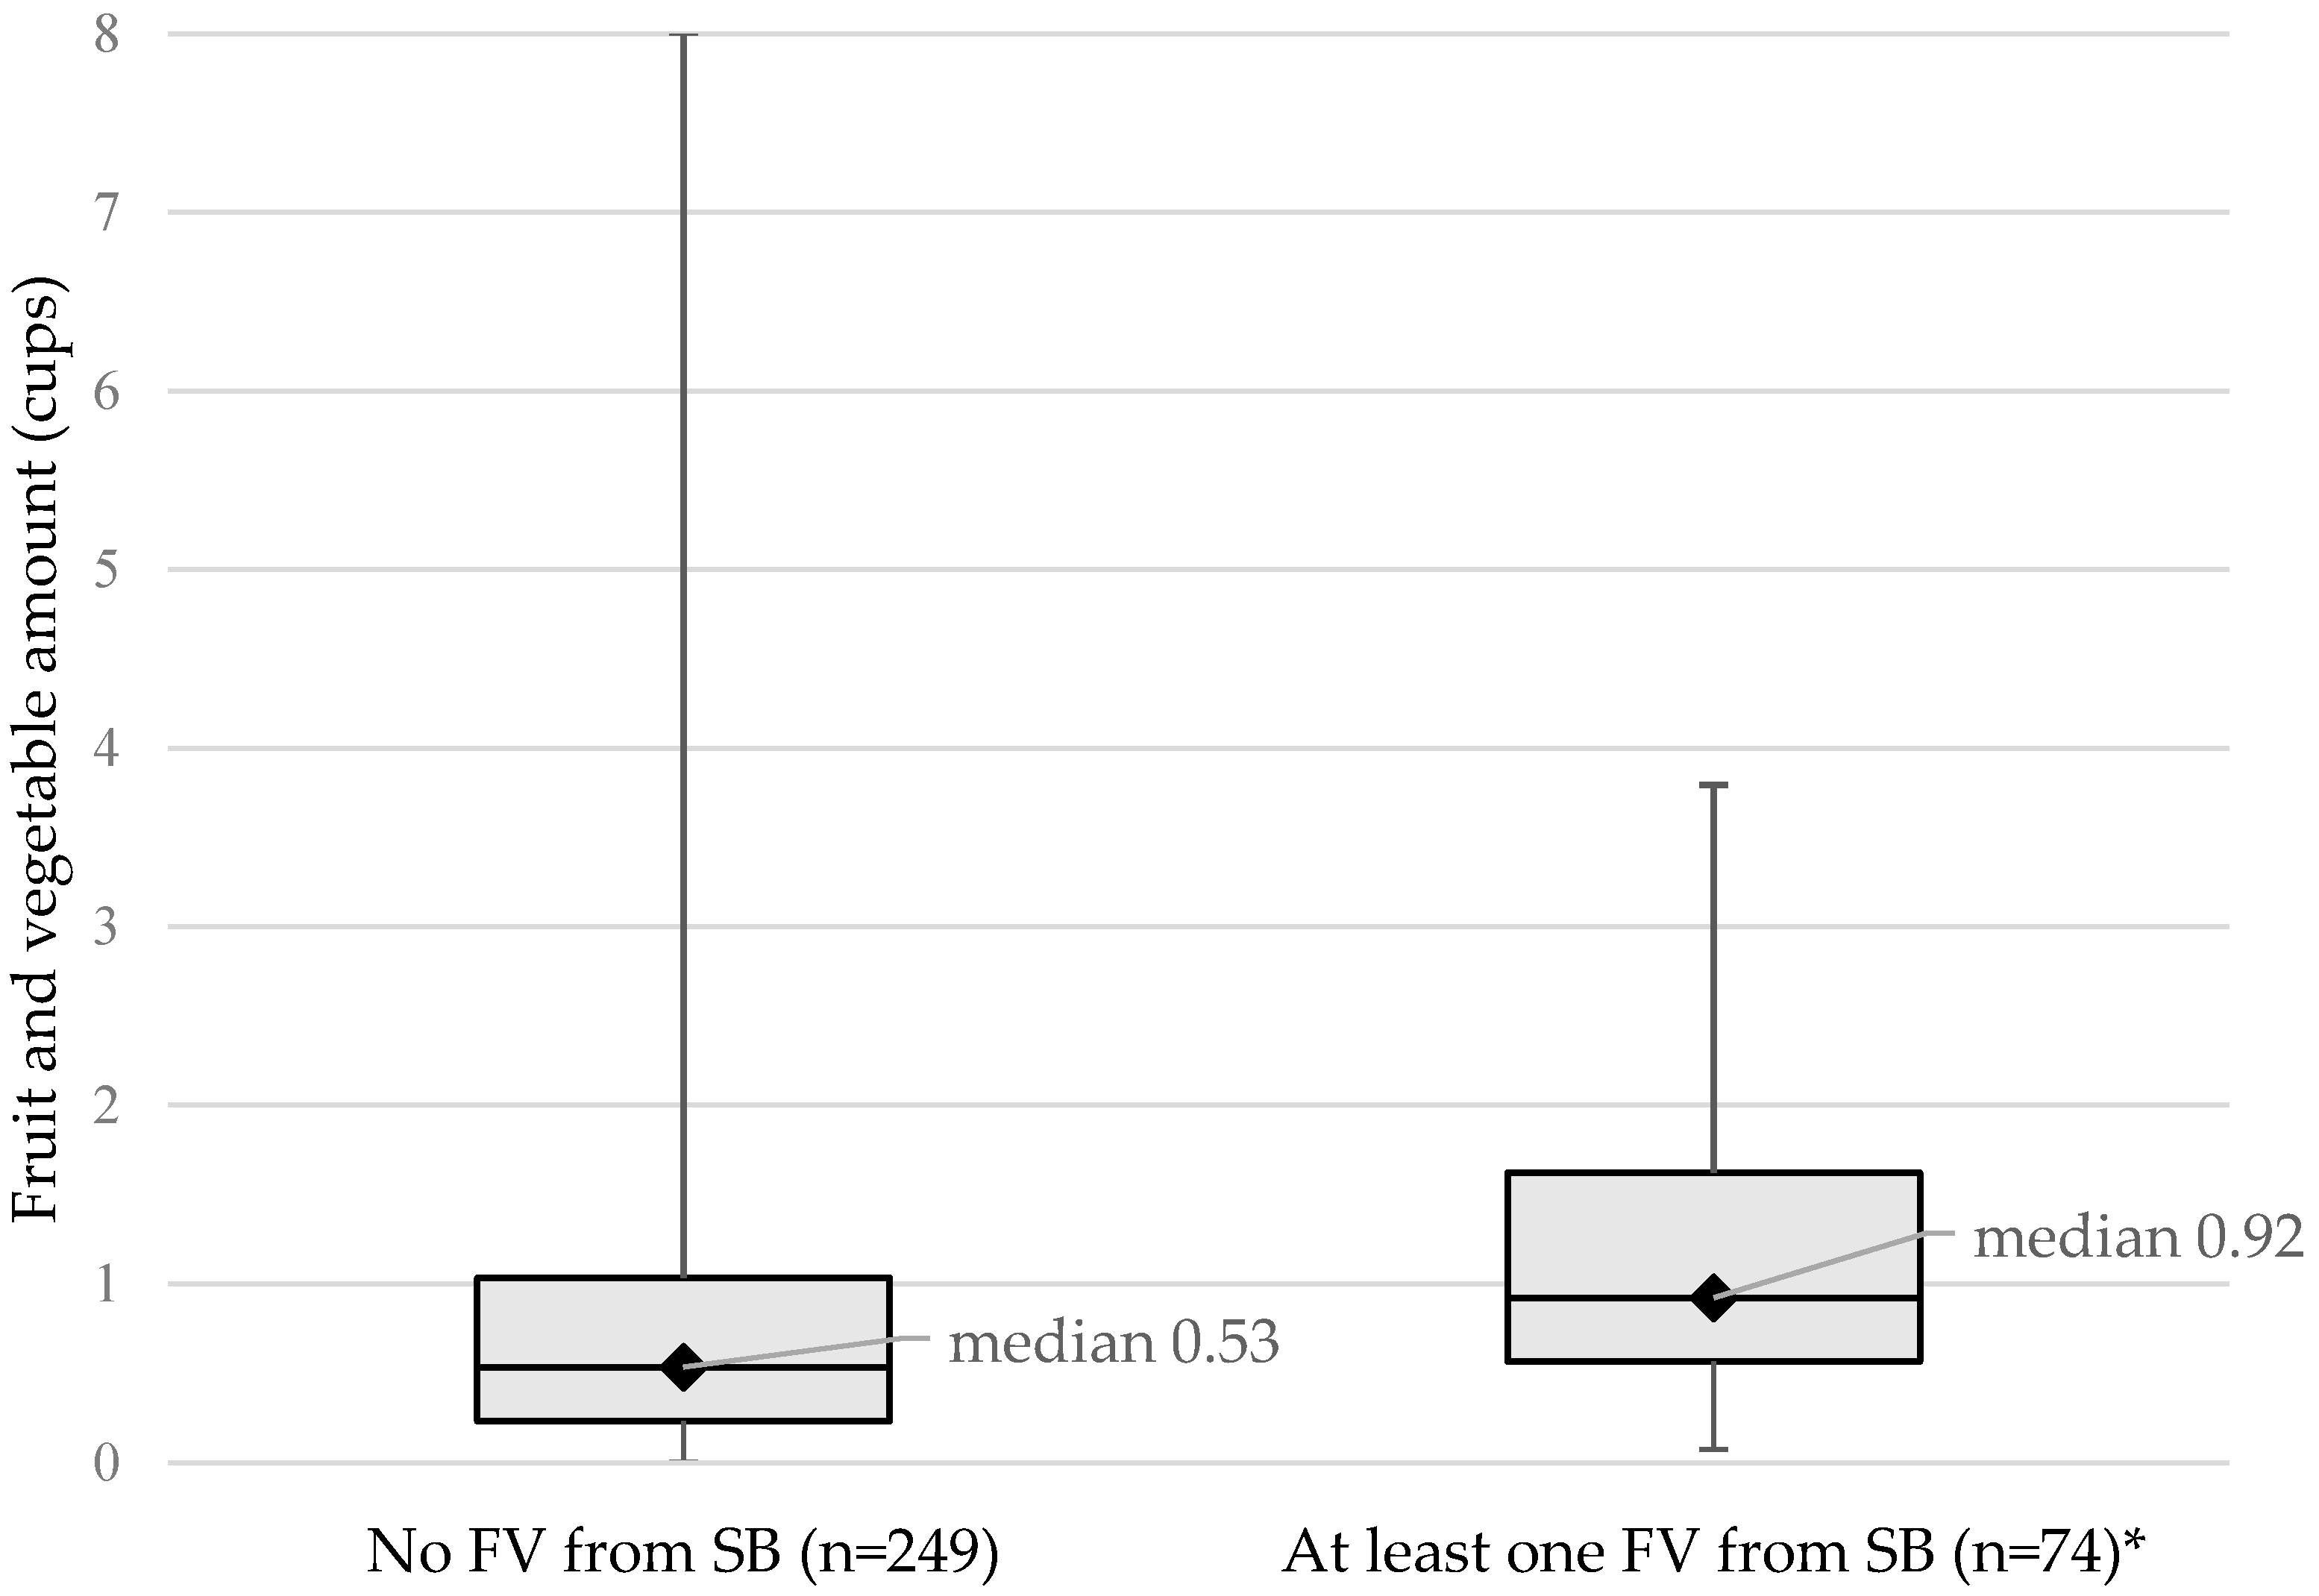
3. Results
4. Discussion
5. Conclusions
Acknowledgments
Author Contributions
Conflicts of Interest
References
- Ogden, C.L.; Carroll, M.D.; Kit, B.K.; Flegal, K.M. Prevalence of childhood and adult obesity in the United States, 2011–2012. JAMA 2014, 311, 806–814. [Google Scholar] [CrossRef] [PubMed]
- May, A.L.; Kuklina, E.V.; Yoon, P.W. Prevalence of cardiovascular disease risk factors among US adolescents, 1999–2008. Pediatrics 2012, 129, 1035–1041. [Google Scholar] [CrossRef] [PubMed]
- Sinha, R.; Fisch, G.; Teague, B.; Tamborlane, W.V.; Banyas, B.; Allen, K.; Savoye, M.; Rieger, V.; Taksali, S.; Barbetta, G.; et al. Prevalence of impaired glucose tolerance among children and adolescents with marked obesity. N. Engl. J. Med. 2002, 346, 802–810. [Google Scholar] [CrossRef] [PubMed]
- Sorof, J.M.; Lai, D.; Turner, J.; Poffenbarger, T.; Portman, R.J. Overweight, ethnicity, and the prevalence of hypertension in school-aged children. Pediatrics 2004, 113, 475–482. [Google Scholar] [CrossRef] [PubMed]
- Freedman, D.S.; Khan, L.K.; Serdula, M.K.; Dietz, W.H.; Srinivasan, S.R.; Berenson, G.S. The relation of childhood BMI to adult adiposity: The Bogalusa heart study. Pediatrics 2005, 115, 22–27. [Google Scholar] [CrossRef] [PubMed]
- Freedman, D.S.; Mei, Z.; Srinivasan, S.R.; Berenson, G.S.; Dietz, W.H. Cardiovascular risk factors and excess adiposity among overweight children and adolescents: the Bogalusa Heart Study. J. Pediatr. 2007, 150, 12–17. [Google Scholar] [CrossRef] [PubMed]
- Kelsey, M.M.; Zaepfel, A.; Bjornstad, P.; Nadeau, K.J. Age-related consequences of childhood obesity. Gerontology 2014, 60, 222–228. [Google Scholar] [CrossRef] [PubMed]
- Perez-Escamilla, R.; Obbagy, J.E.; Altman, J.M.; Essery, E.V.; McGrane, M.M.; Wong, Y.P.; Spahn, J.M.; Williams, C.L. Dietary energy density and body weight in adults and children: A systematic review. J. Acad. Nutr. Diet. 2012, 112, 671–684. [Google Scholar] [CrossRef] [PubMed]
- Centers for Disease Control and Prevention. The Health Effects of Overweight and Obesity. Available online: https://www.cdc.gov/healthyweight/effects/ (accessed on 6 April 2017).
- United States Department of Agriculture. Scientific Report of the 2015 Dietary Guidelines Advisory Committee: Advisory Report to the Secretary of Health and Human Services and the Secretary of Agriculture. Available online: https://health.gov/dietaryguidelines/2015-scientific-report/pdfs/scientific-report-of-the-2015-dietary-guidelines-advisory-committee.pdf (accessed on 6 September 2016).
- Kim, S.A.; Moore, L.V.; Galuska, D.; Wright, A.P.; Harris, D.; Grummer-Strawn, L.M.; Merlo, C.L.; Nihiser, A.J.; Rhodes, D.G. Vital signs: Fruit and vegetable intake among children—United States, 2003–2010. Morb. Mortal. Wkly. Rep. 2014, 63, 671–676. [Google Scholar]
- Briefel, R.R.; Wilson, A.; Gleason, P.M. Consumption of low-nutrient, energy-dense foods and beverages at school, home, and other locations among school lunch participants and nonparticipants. J. Am. Diet. Assoc. 2009, 109, S79–S90. [Google Scholar] [CrossRef] [PubMed]
- Cohen, J.F.; Richardson, S.; Parker, E.; Catalano, P.J.; Rimm, E.B. Impact of the new US Department of agriculture school meal standards on food selection, consumption, and waste. Am. J. Prev. Med. 2014, 46, 388–394. [Google Scholar] [CrossRef] [PubMed]
- Institute of Medicine. Local Government Actions to Prevent Childhood Obesity; National Academies Press: Washington, DC, USA, 2009.
- United States Department of Agriculture Food and Nutrition Service. Salad Bars in the National School Lunch Program. Available online: http://www.fns.usda.gov/sites/default/files/SP31-2013os.pdf (accessed on 5 September 2016).
- Model, B.F.L. Solving the Problem of Childhood Obesity within a Generation; White House Task Force on Childhood Obesity: Washington, DC, USA, 2010.
- Government Publishing Office (US). Nutrition Standards in the National School Lunch and School Breakfast Programs. Final Rule. Available online: https://www.gpo.gov/fdsys/pkg/FR-2012-01-26/pdf/2012-1010.pdf (accessed on 26 January 2012).
- Harris, D.M.; Seymour, J.; Grummer-Strawn, L.; Cooper, A.; Collins, B.; DiSogra, L.; Marshall, A.; Evans, N. Let’s move salad bars to schools: A public-private partnership to increase student fruit and vegetable consumption. Child. Obes. 2014, 8, 294–297. [Google Scholar] [CrossRef] [PubMed]
- Slusser, W.M.; Cumberland, W.G.; Browdy, B.L.; Lange, L.; Neumann, C. A school salad bar increases frequency of fruit and vegetable consumption among children living in low-income households. Public Health Nutr. 2007, 10, 1490–1496. [Google Scholar] [CrossRef] [PubMed]
- Adams, M.A.; Pelletier, R.L.; Zive, M.M.; Sallis, J.F. Salad bars and fruit and vegetable consumption in elementary schools: A plate waste study. J. Am. Diet. Assoc. 2005, 105, 1789–1792. [Google Scholar] [CrossRef] [PubMed]
- Terry-McElrath, Y.M.; O’Malley, P.M.; Johnston, L.D. Students Eat More Fruits and Green Vegetables When Schools Have Higher Fruit, Vegetable, and Salad Accessibility. Available online: http://www.bridgingthegapresearch.org/_asset/7qsnlx/BTG_salad_fruit_veg_brief_Jun_14.pdf (accessed on 6 September 2016).
- Andersen, L.; Myers, L.; O’Malley, K.; Mundorf, A.R.; Harris, D.M.; Johnson, C.C. Adolescent student use of school-based salad bars. J. Sch. Health 2015, 85, 722–727. [Google Scholar] [CrossRef] [PubMed]
- Kipnis, V.; Subar, A.F.; Midthune, D.; Freedman, L.S.; Ballard-Barbash, R.; Troiano, R.P.; Bingham, S.; Schoeller, D.A.; Schatzkin, A.; Carroll, R.J. Structure of dietary measurement error: Results of the OPEN biomarker study. Am. J. Epidemiol. 2003, 158, 14–21. [Google Scholar] [CrossRef] [PubMed]
- Kirkpatrick, S.I.; Subar, A.F.; Douglass, D.; Zimmerman, T.P.; Thompson, F.E.; Kahle, L.L.; George, S.M.; Dodd, K.W.; Potischman, N. Performance of the automated self-administered 24-hour recall relative to a measure of true intakes and to an interviewer-administered 24-h recall. Am. J. Clin. Nutr. 2014, 100, 233–240. [Google Scholar] [CrossRef] [PubMed]
- Moshfegh, A.J.; Rhodes, D.G.; Baer, D.J.; Murayi, T.; Clemens, J.C.; Rumpler, W.V.; Sebastian, R.S.; Kuczynski, K.J.; Ingwersen, L.A.; Staples, R.C.; et al. The US department of agriculture automated multiple-pass method reduces bias in the collection of energy intakes. Am. J. Clin. Nutr. 2008, 88, 324–332. [Google Scholar] [PubMed]
- United States Department of Agriculture. Food and Nutrient Database for Dietary Studies; Agricultural Research Service: Beltsville, MD, USA, 2010.
- Bowman, S.A.; Friday, J.E.; Moshfeg, A.J. MyPyramid Equivalents Database, 2.0 for USDA Survey Foods, 2003–2004; Beltsville Human Nutrition Research Center, Agricultural Research Service, US Department of Agriculture: Beltsville, MD, USA, 2008. [Google Scholar]
- SAS Insitute. SAS® 9.3; SAS Institute Inc.: Cary, NC, USA, 2011; Available online: http://support.sas.com/documentation/cdl/en/lestmtsref/63323/PDF/default/lestmtsref.pdf (accessed on 5 September 2016).
- Centers for Disease Control and Prevention. Promoting and Supporting School Salad Bars: An Action Guide for State Health Practitioners; US Department of Health and Human Services: Atlanta, GA, USA, 2015.
- Gosliner, W. School-level factors associated with increased fruit and vegetable consumption among students in California middle and high schools. J. Sch. Health 2014, 84, 559–568. [Google Scholar] [CrossRef] [PubMed]
- Adams, M.A.; Bruening, M.; Ohri-Vachaspati, P. Use of salad bars in schools to increase fruit and vegetable consumption: Where’s the evidence? J. Acad. Nutr. Diet. 2015, 115, 1233–1236. [Google Scholar] [CrossRef] [PubMed]
- Hanks, A.S.; Just, D.R.; Brumberg, A. Marketing vegetables in elementary school cafeterias to increase uptake. Pediatrics 2016, 138, e20151420. [Google Scholar] [CrossRef] [PubMed]
- Huynh, L.M.; Pirie, P.; Klein, E.G.; Kaye, G.; Moore, R. Identifying associations between format and placement of school salad bars and fruit and vegetable selection. J. Child Nutr. Manag. 2015, 39, 1–11. [Google Scholar]
- Thompson, F.E.; Subar, A.F. Dietary Assessment Methodology Nutrition in the Prevention and Treatment of Disease; Academic Press: London, UK, 2013; pp. 5–46. [Google Scholar]
- Jonnalagadda, S.S.; Mitchell, D.C.; Smiciklas-Wright, H.; Meaker, K.B.; Van Heel, N.; Karmally, W.; Ershow, A.G.; Kris-Etherton, P.M. Accuracy of energy intake data estimated by a multiple-pass, 24-hour dietary recall technique. J. Am. Diet. Assoc. 2000, 100, 303–311. [Google Scholar] [CrossRef]
- Kubena, K.S. Accuracy in dietary assessment: On the road to good science. J. Am. Diet. Assoc. 2000, 100, 775–776. [Google Scholar] [CrossRef]
- Schoeller, D.A. Limitations in the assessment of dietary energy intake by self-report. Metabolism 1995, 44, 18–22. [Google Scholar] [CrossRef]
- Diep, C.S.; Hingle, M.; Chen, T.A.; Dadabhoy, H.R.; Beltran, A.; Baranowski, J.; Subar, A.F.; Baranowski, T. The automated self-administered 24-hour dietary recall for children, 2012 version, for youth aged 9 to 11 years: A validation study. J. Acad. Nutr. Diet. 2015, 115, 1591–1598. [Google Scholar] [CrossRef] [PubMed]


| Variable | SB Schools | No SB Schools | All Schools |
|---|---|---|---|
| n (%) | n (%) | n (%) | |
| 447 (67.3) 1 | 271 (50.1) | 718 (100) | |
| Gender | |||
| Female | 287 (64.2) | 174 (64.4) | 461 (64.1) |
| Male | 160 (35.8) | 96 (35.6) | 256 (35.7) |
| Race/ethnicity | |||
| Black | 383 (86.7) | 244 (91.0) | 627 (88.3) |
| Other races | 59 (13.3) | 24 (9.0) | 83 (11.7) |
| Grade level 1 | |||
| 7 | 123 (27.5) | 106 (39.1) | 229 (31.9) |
| 8 | 157 (35.1) | 116 (42.8) | 273 (38.0) |
| High School | 167 (37.4) | 49 (18.1) | 216 (30.1) |
| 9 | 33 (7.4) | 19 (7.0) | 52 (7.2) |
| 10 | 34 (7.6) | 7 (2.6) | 41 (5.7) |
| 11 | 36 (8.1) | 11 (4.1) | 47 (6.6) |
| 12 | 64 (14.3) | 12 (4.4) | 76 (10.6) |
| Mean (standard deviation) | |||
| Age (years) | 14.70 2 (1.93) | 14.00 (1.55) | 14.42 (1.83) |
| Food Groups | Students in All Schools n = 611 | Students in Schools with Salad Bars n = 379 | Students in Schools without Salad Bars n = 232 | p 1 |
|---|---|---|---|---|
| Median (IQR) | Median (IQR) | Median (IQR) | ||
| Total fruit (n) | 524 | 308 | 216 | |
| cup | 0.17 (0.64) | 0.06 (0.48) | 0.25 (0.80) | 0.0061 |
| % from lunch | 17.6 (63.7) | 7.0 (62.2) | 30.5 (67.7) | 0.0357 |
| Total vegetable (n) | 589 | 362 | 227 | |
| cup | 0.25 (0.68) | 0.32 (0.73) | 0.23 (0.55) | 0.6690 |
| % from lunch | 25.0 (56.8) | 26.8 (65.1) | 22.1 (49.5) | 0.4686 |
| Total grain (n) | 610 | 378 | 232 | |
| oz | 1.24 (1.50) | 1.38 (1.75) | 0.98 (1.51) | 0.1267 |
| % from lunch | 22.6 (29.5) | 24.4 (32.6) | 18.5 (25.3) | 0.1037 |
| Total dairy (n) | 582 | 361 | 221 | |
| cup | 0.45 (0.99) | 0.50 (0.97) | 0.30 (1.00) | 0.0737 |
| % from lunch | 31.7 (58.1) | 36.1 (59.7) | 26.6 (51.7) | 0.0628 |
| Total protein (n) | 578 | 357 | 221 | |
| oz | 0.95 (1.92) | 0.99 (1.98) | 0.81 (1.49) | 0.8805 |
| % from lunch | 24.2 (53.1) | 22.9 (52.4) | 26.4 (47.7) | 0.9576 |
| Energy consumed (n) | 611 | 379 | 232 | |
| kcal | 432 (340) | 452 (319) | 395 (358) | 0.0136 |
| % from lunch | 23.9 (18.8) | 25.7 (19.5) | 20.8 (17.3) | 0.0510 |
| % Students not eating lunch | 15.9 | 15.7 | 16.2 | 0.8572 |
| Food Source | Schools with Salad Bars | Schools without Salad Bars | ||
|---|---|---|---|---|
| n = 323 | n = 213 | |||
| n (%) | Median 1 (IQR) | n (%) | Median 1 (IQR) | |
| Cafeteria main line | 145 (45) | 0.50 (0.74) | 155 (73) | 0.76 (0.90) |
| Cafeteria a la carte line | 4 (1) | 1.10 (0.40) | 5 (2) | 0.64 (0.21) |
| Cafeteria salad bar | 19 (6) | 0.56 (0.64) | - | - |
| School, not in cafeteria | 15 (5) | 0.23 (0.38) | 1 (<1) | 0.15 (0) |
| Home, friends or family | 31 (10) | 0.42 (0.68) | 13 (6) | 0.44 (0.96) |
| Food stores and restaurants | 29 (9) | 0.60 (0.59) | 19 (9) | 0.75 (0.91) |
| Multiple sources | 80 (24) | 0.99 (1.08) | 20 (9) | 1.10 (0.90) |
© 2017 by the authors. Licensee MDPI, Basel, Switzerland. This article is an open access article distributed under the terms and conditions of the Creative Commons Attribution (CC BY) license (http://creativecommons.org/licenses/by/4.0/).
Share and Cite
Johnson, C.C.; Myers, L.; Mundorf, A.R.; O’Malley, K.; Spruance, L.A.; Harris, D.M. Lunch Salad Bars in New Orleans’ Middle and High Schools: Student Intake of Fruit and Vegetables. Int. J. Environ. Res. Public Health 2017, 14, 415. https://doi.org/10.3390/ijerph14040415
Johnson CC, Myers L, Mundorf AR, O’Malley K, Spruance LA, Harris DM. Lunch Salad Bars in New Orleans’ Middle and High Schools: Student Intake of Fruit and Vegetables. International Journal of Environmental Research and Public Health. 2017; 14(4):415. https://doi.org/10.3390/ijerph14040415
Chicago/Turabian StyleJohnson, Carolyn C., Leann Myers, Adrienne R. Mundorf, Keelia O’Malley, Lori Andersen Spruance, and Diane M. Harris. 2017. "Lunch Salad Bars in New Orleans’ Middle and High Schools: Student Intake of Fruit and Vegetables" International Journal of Environmental Research and Public Health 14, no. 4: 415. https://doi.org/10.3390/ijerph14040415