
An Integrated Approach for the Environmental Characterization of a Wide Potentially Contaminated Area in Southern Italy


 ,
, 
 ,
, 
 ,
, 
 ,
, 

Abstract
:1. Introduction
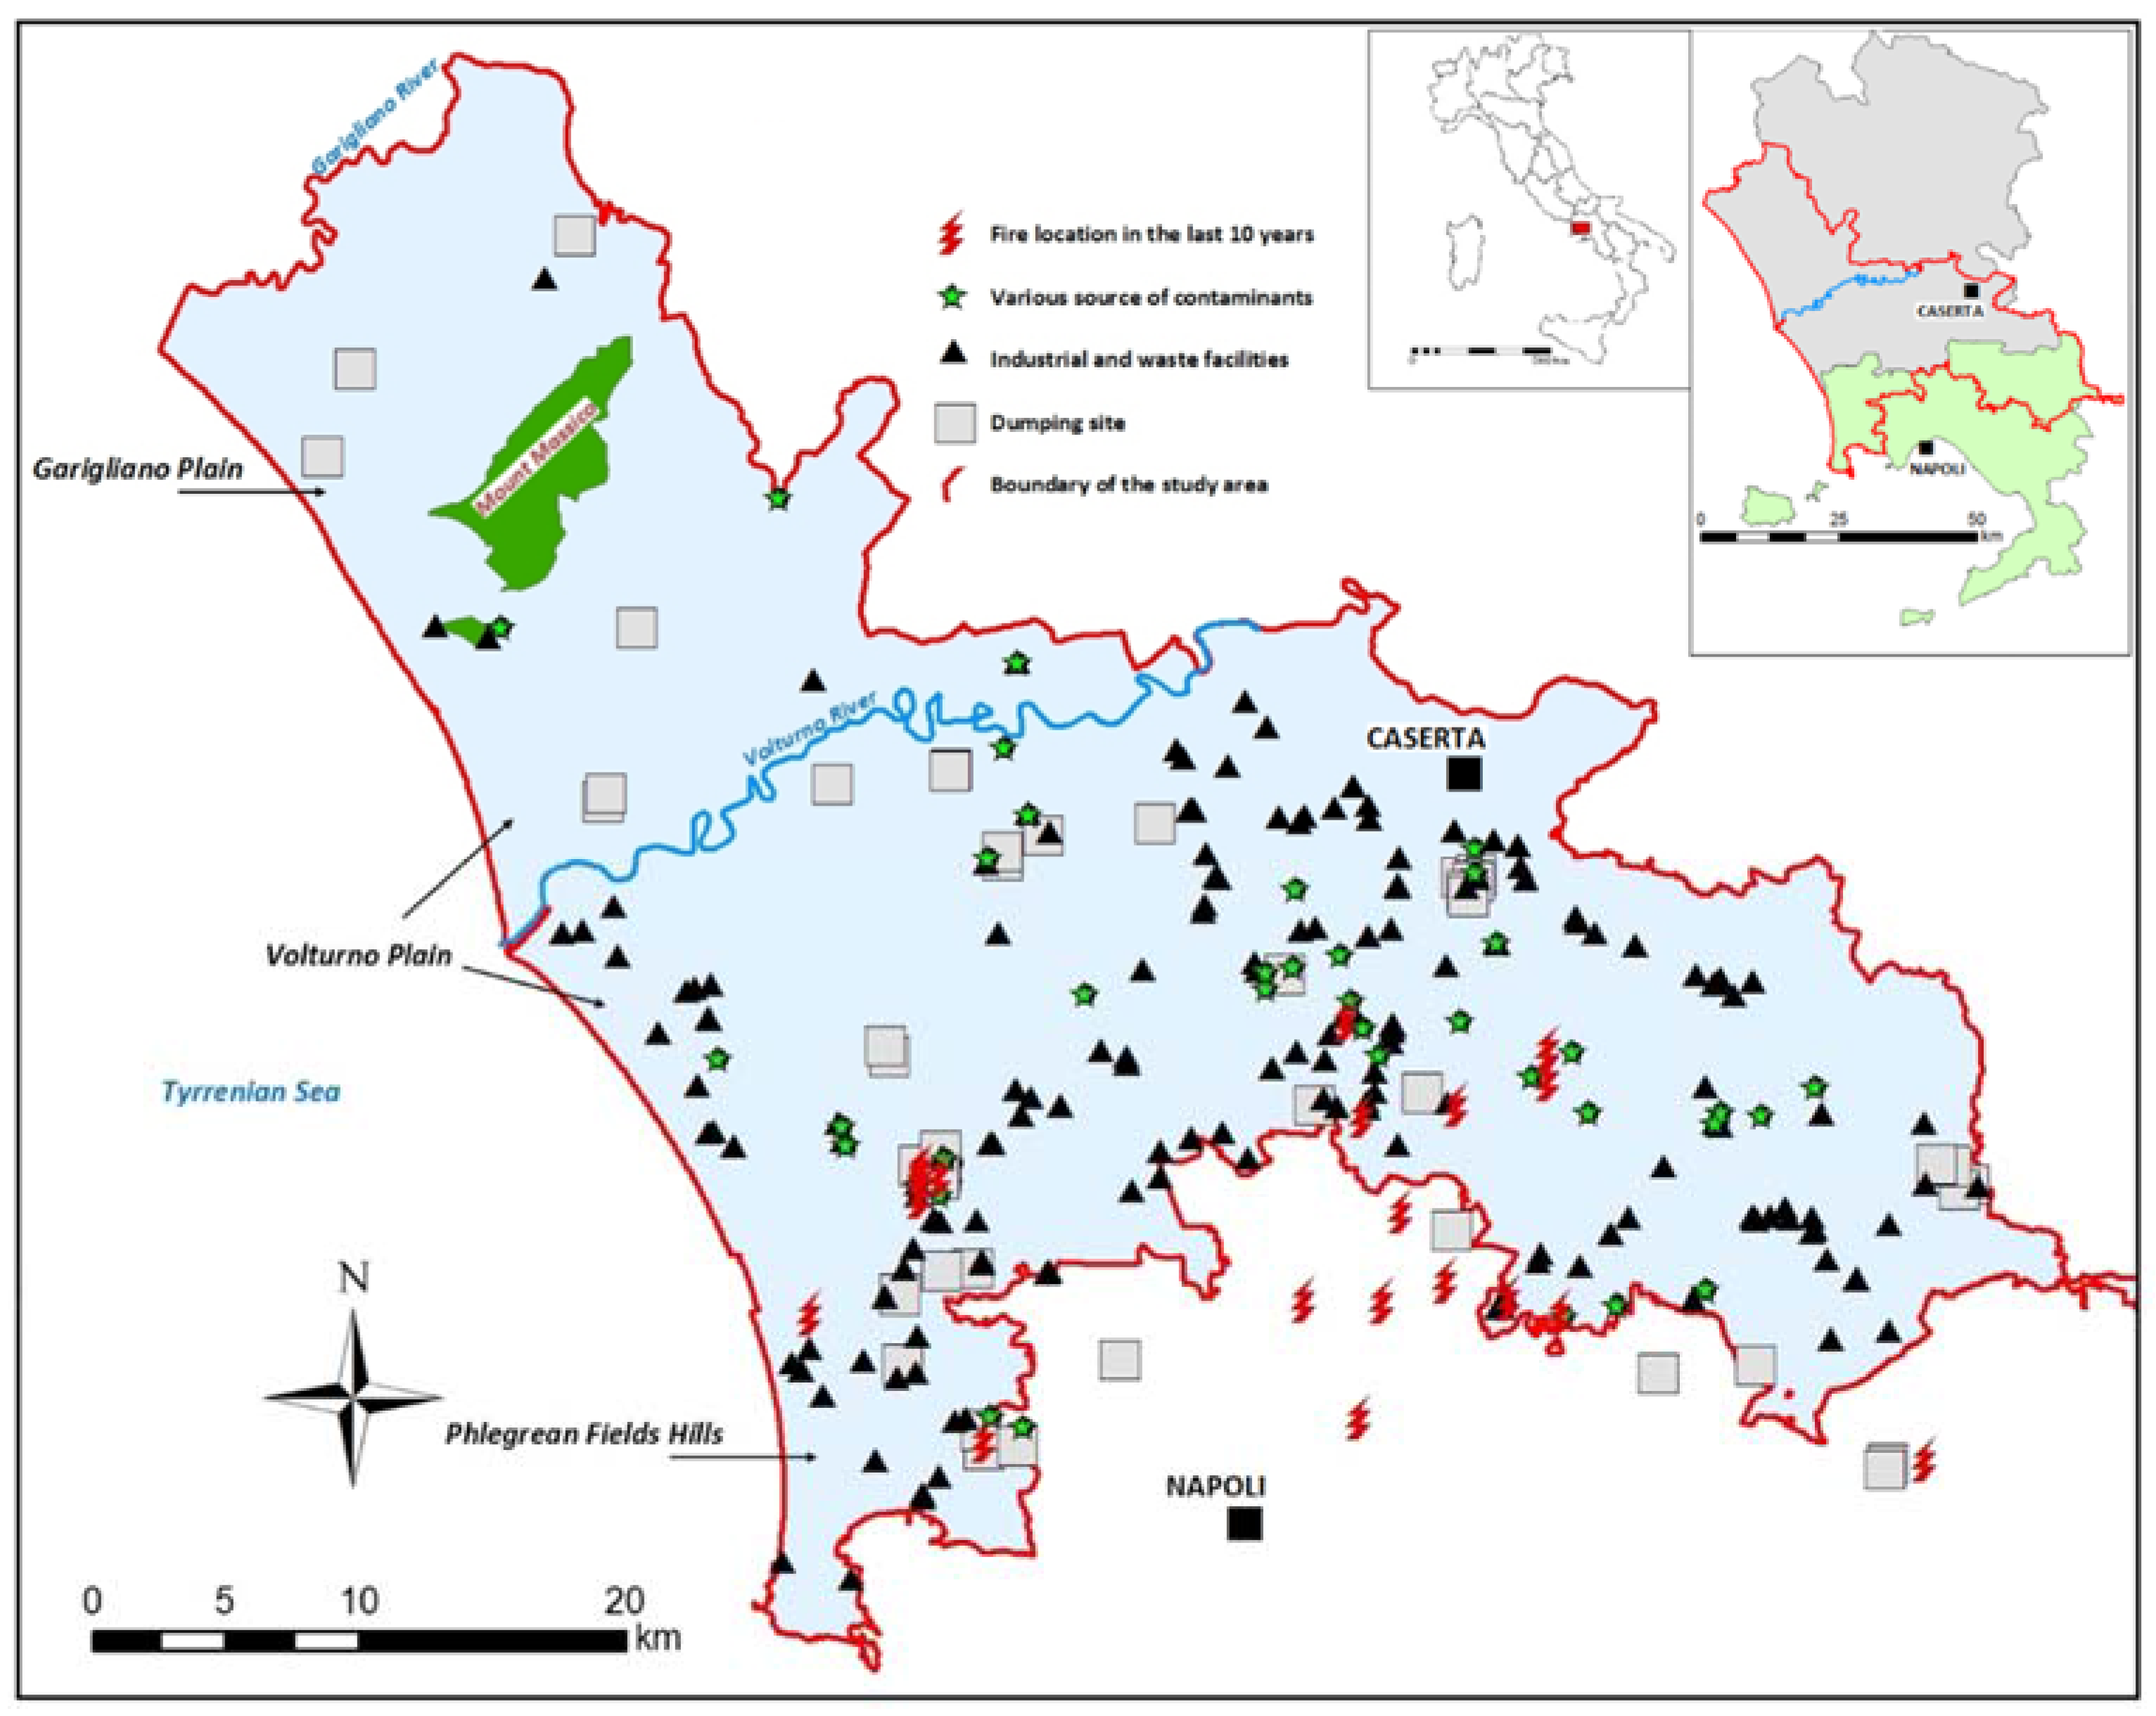
Study Area
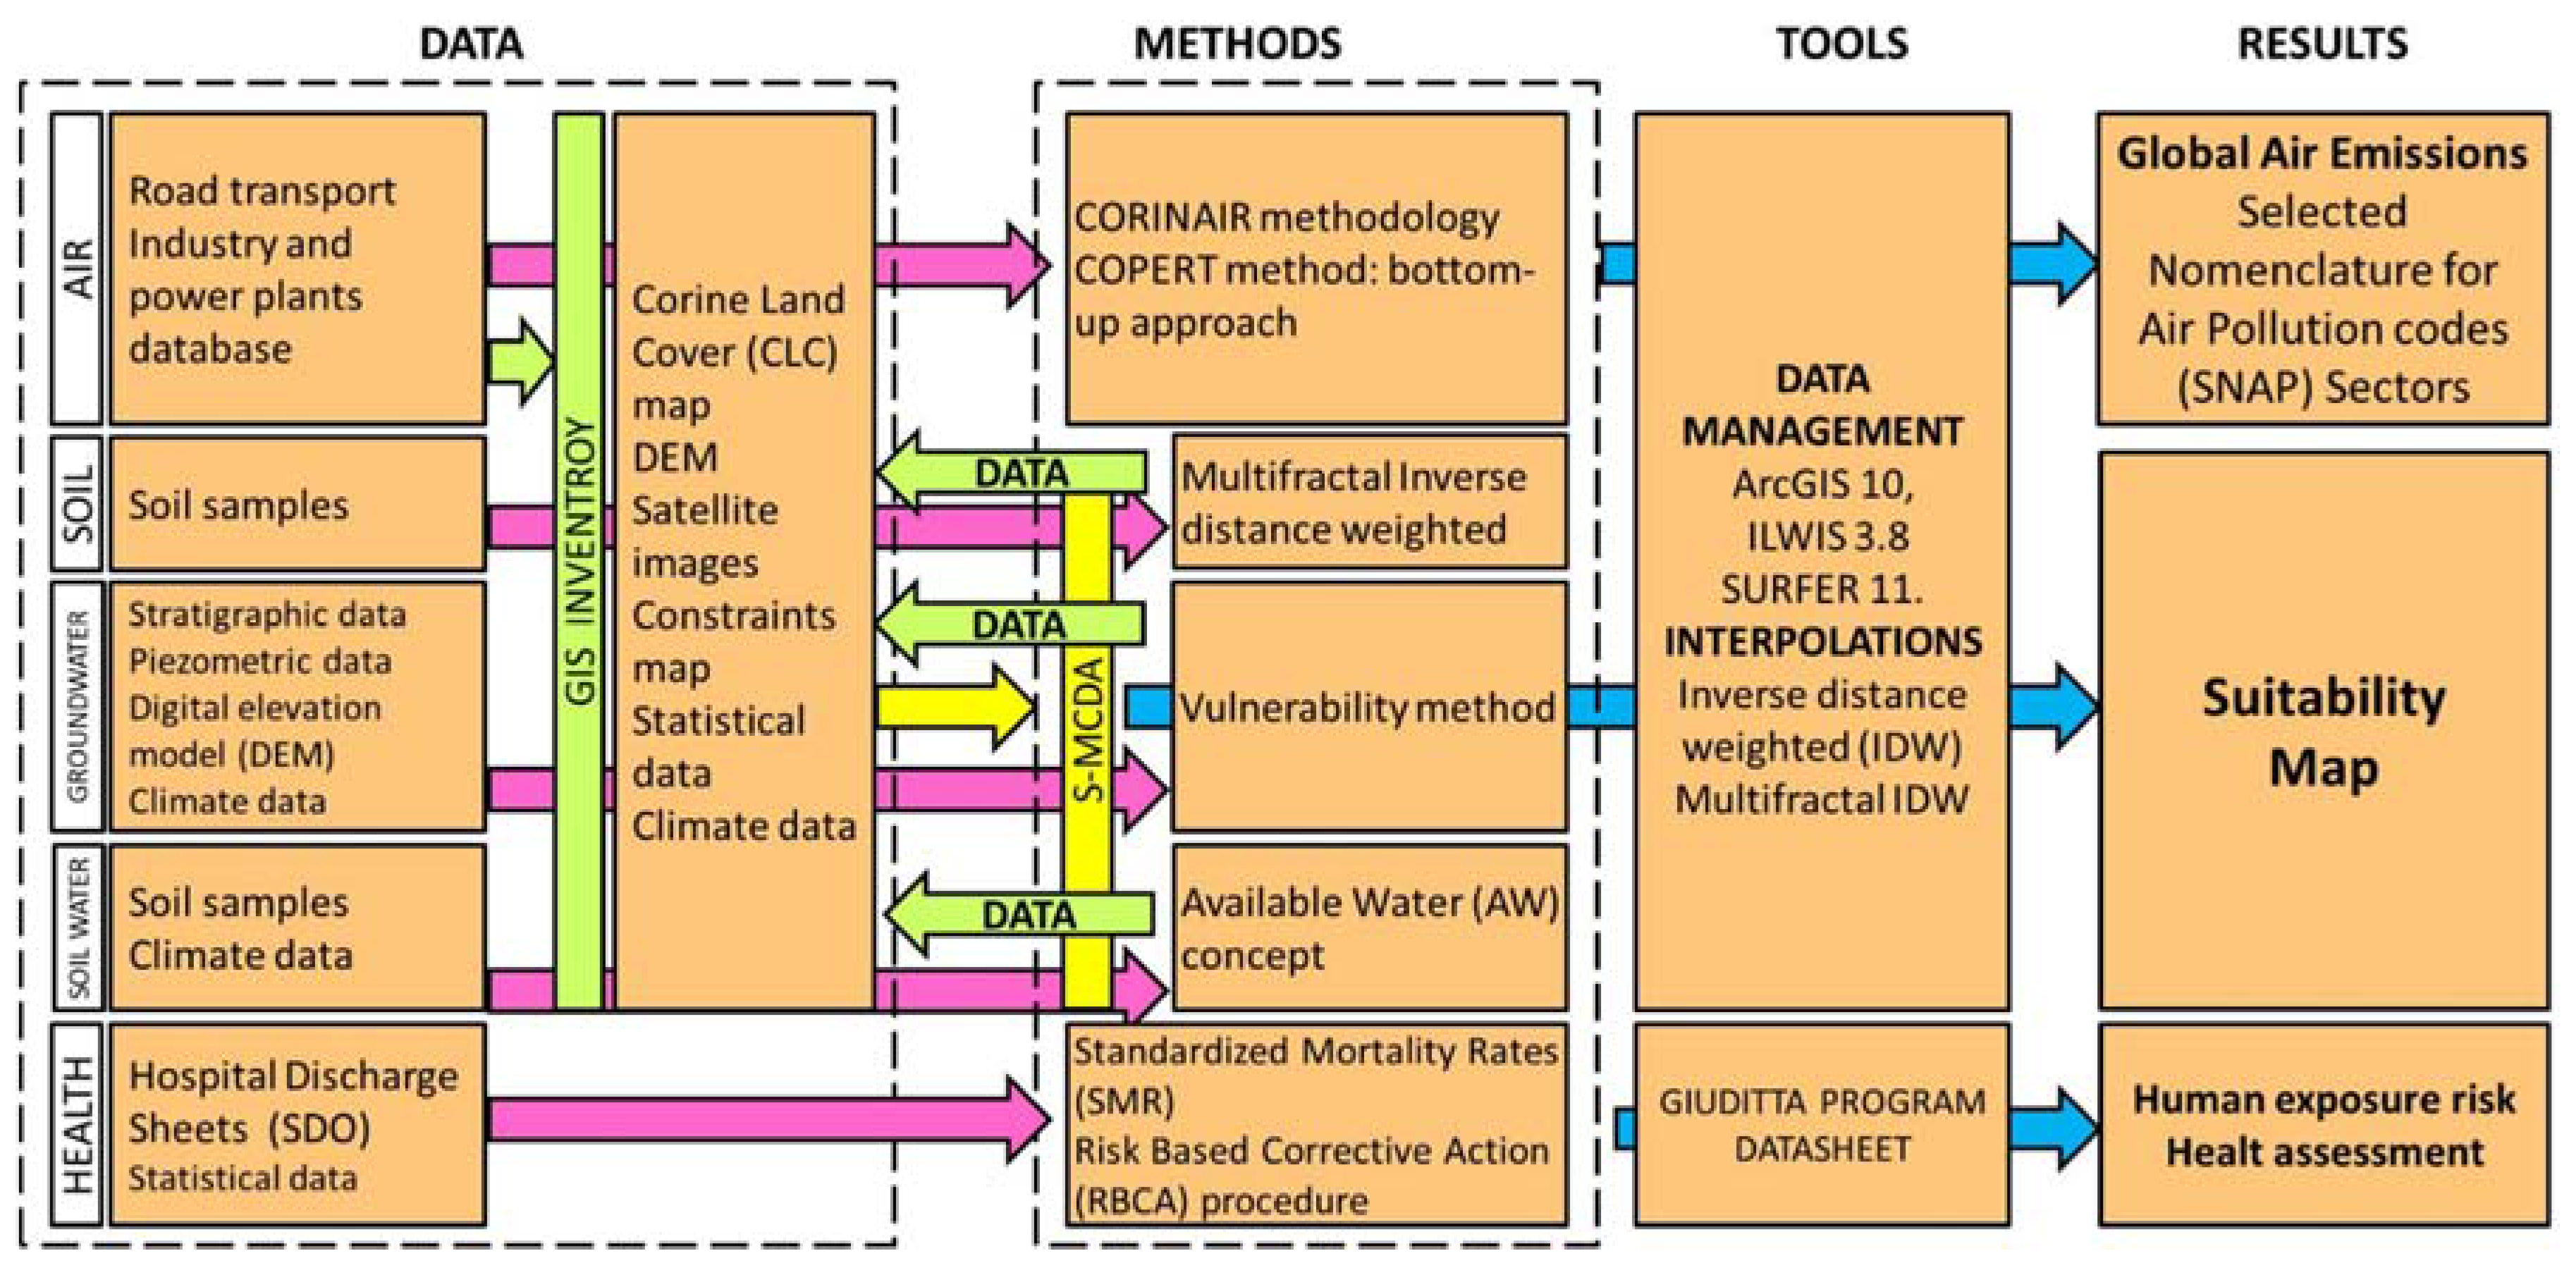
2. Materials and Methods
2.1. Total Emissions of Air Pollutants
2.2. Geochemical Characterization of Agricultural Soils
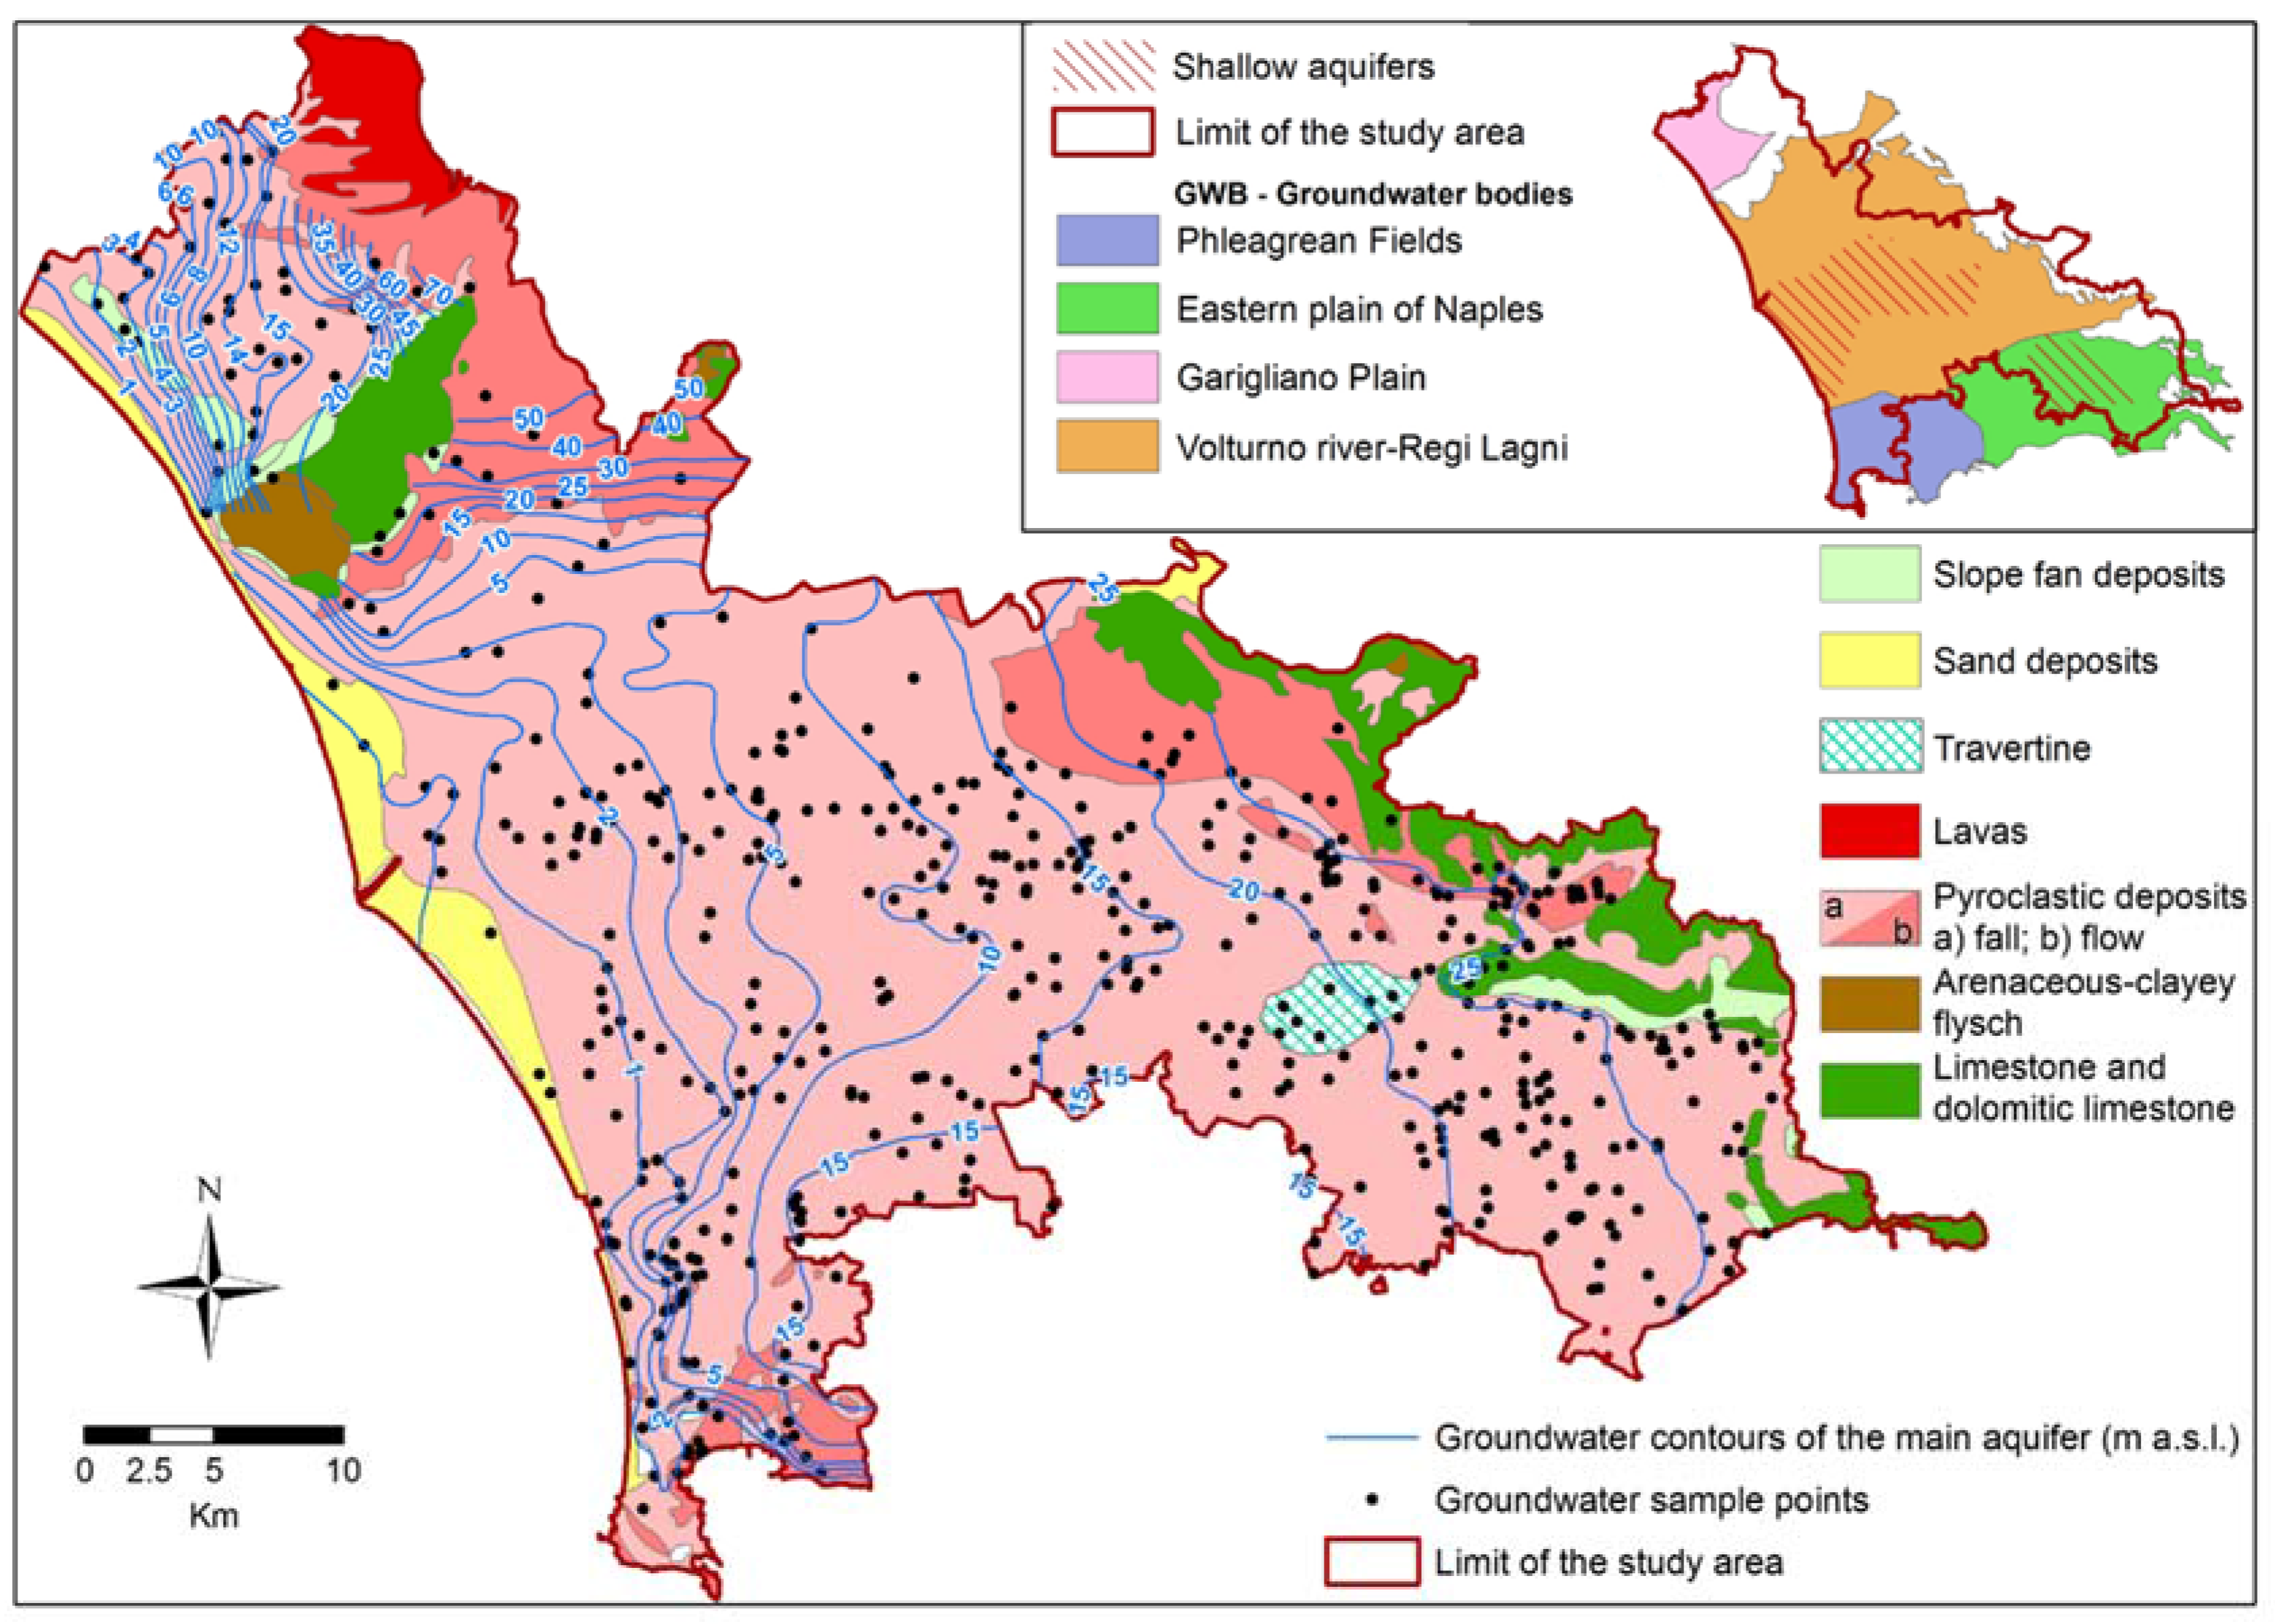
2.3. Aquifer Vulnerability to Contamination
2.4. Soil Hydraulic Characterization of the Study Area
2.5. Spatial MultiCriteria Decision Analysis
2.6. Human Exposure and Health Assessment
3. Results and Discussion
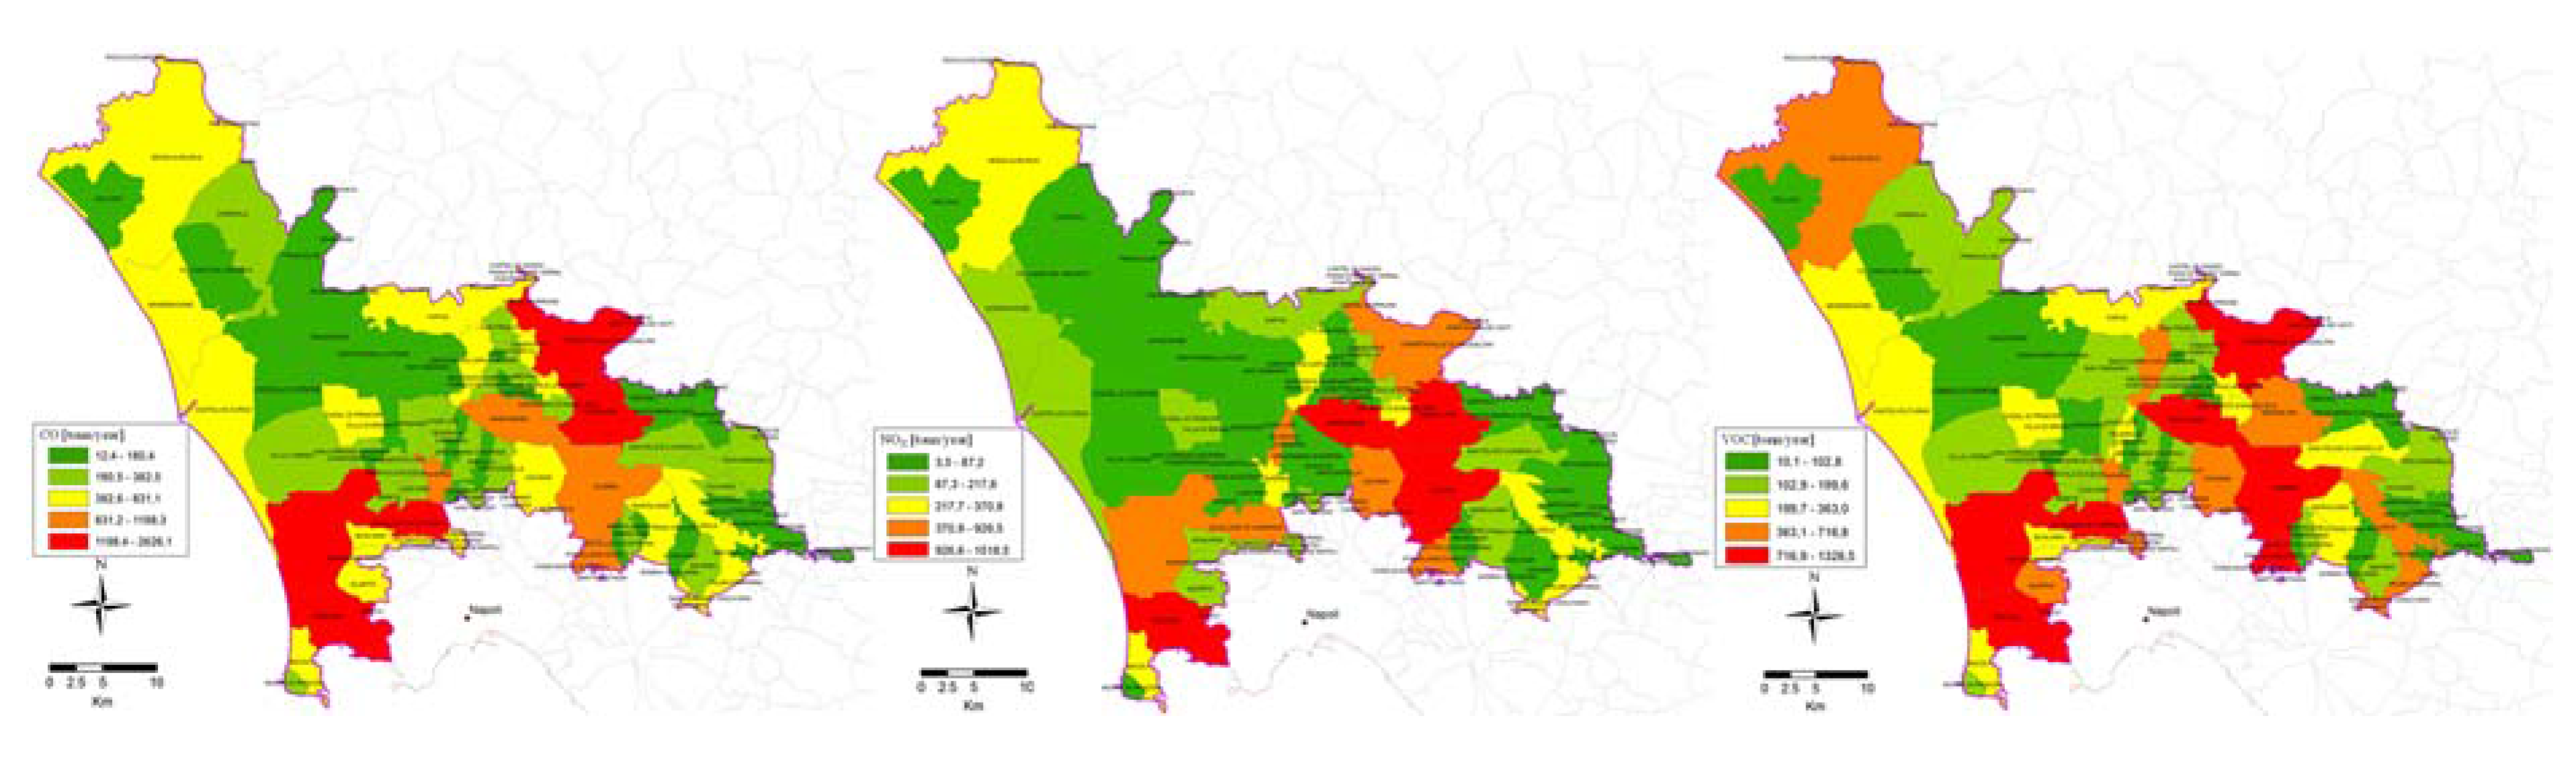
3.1. Air Pollutants and Emissions
- The road traffic sector, given the dense networks of roads and motorways in the area.
- Industrial facilities burning oil, coal and natural gas. These plants are largely in the industrial area of Caserta and mostly emit CO, NOx and PM10.
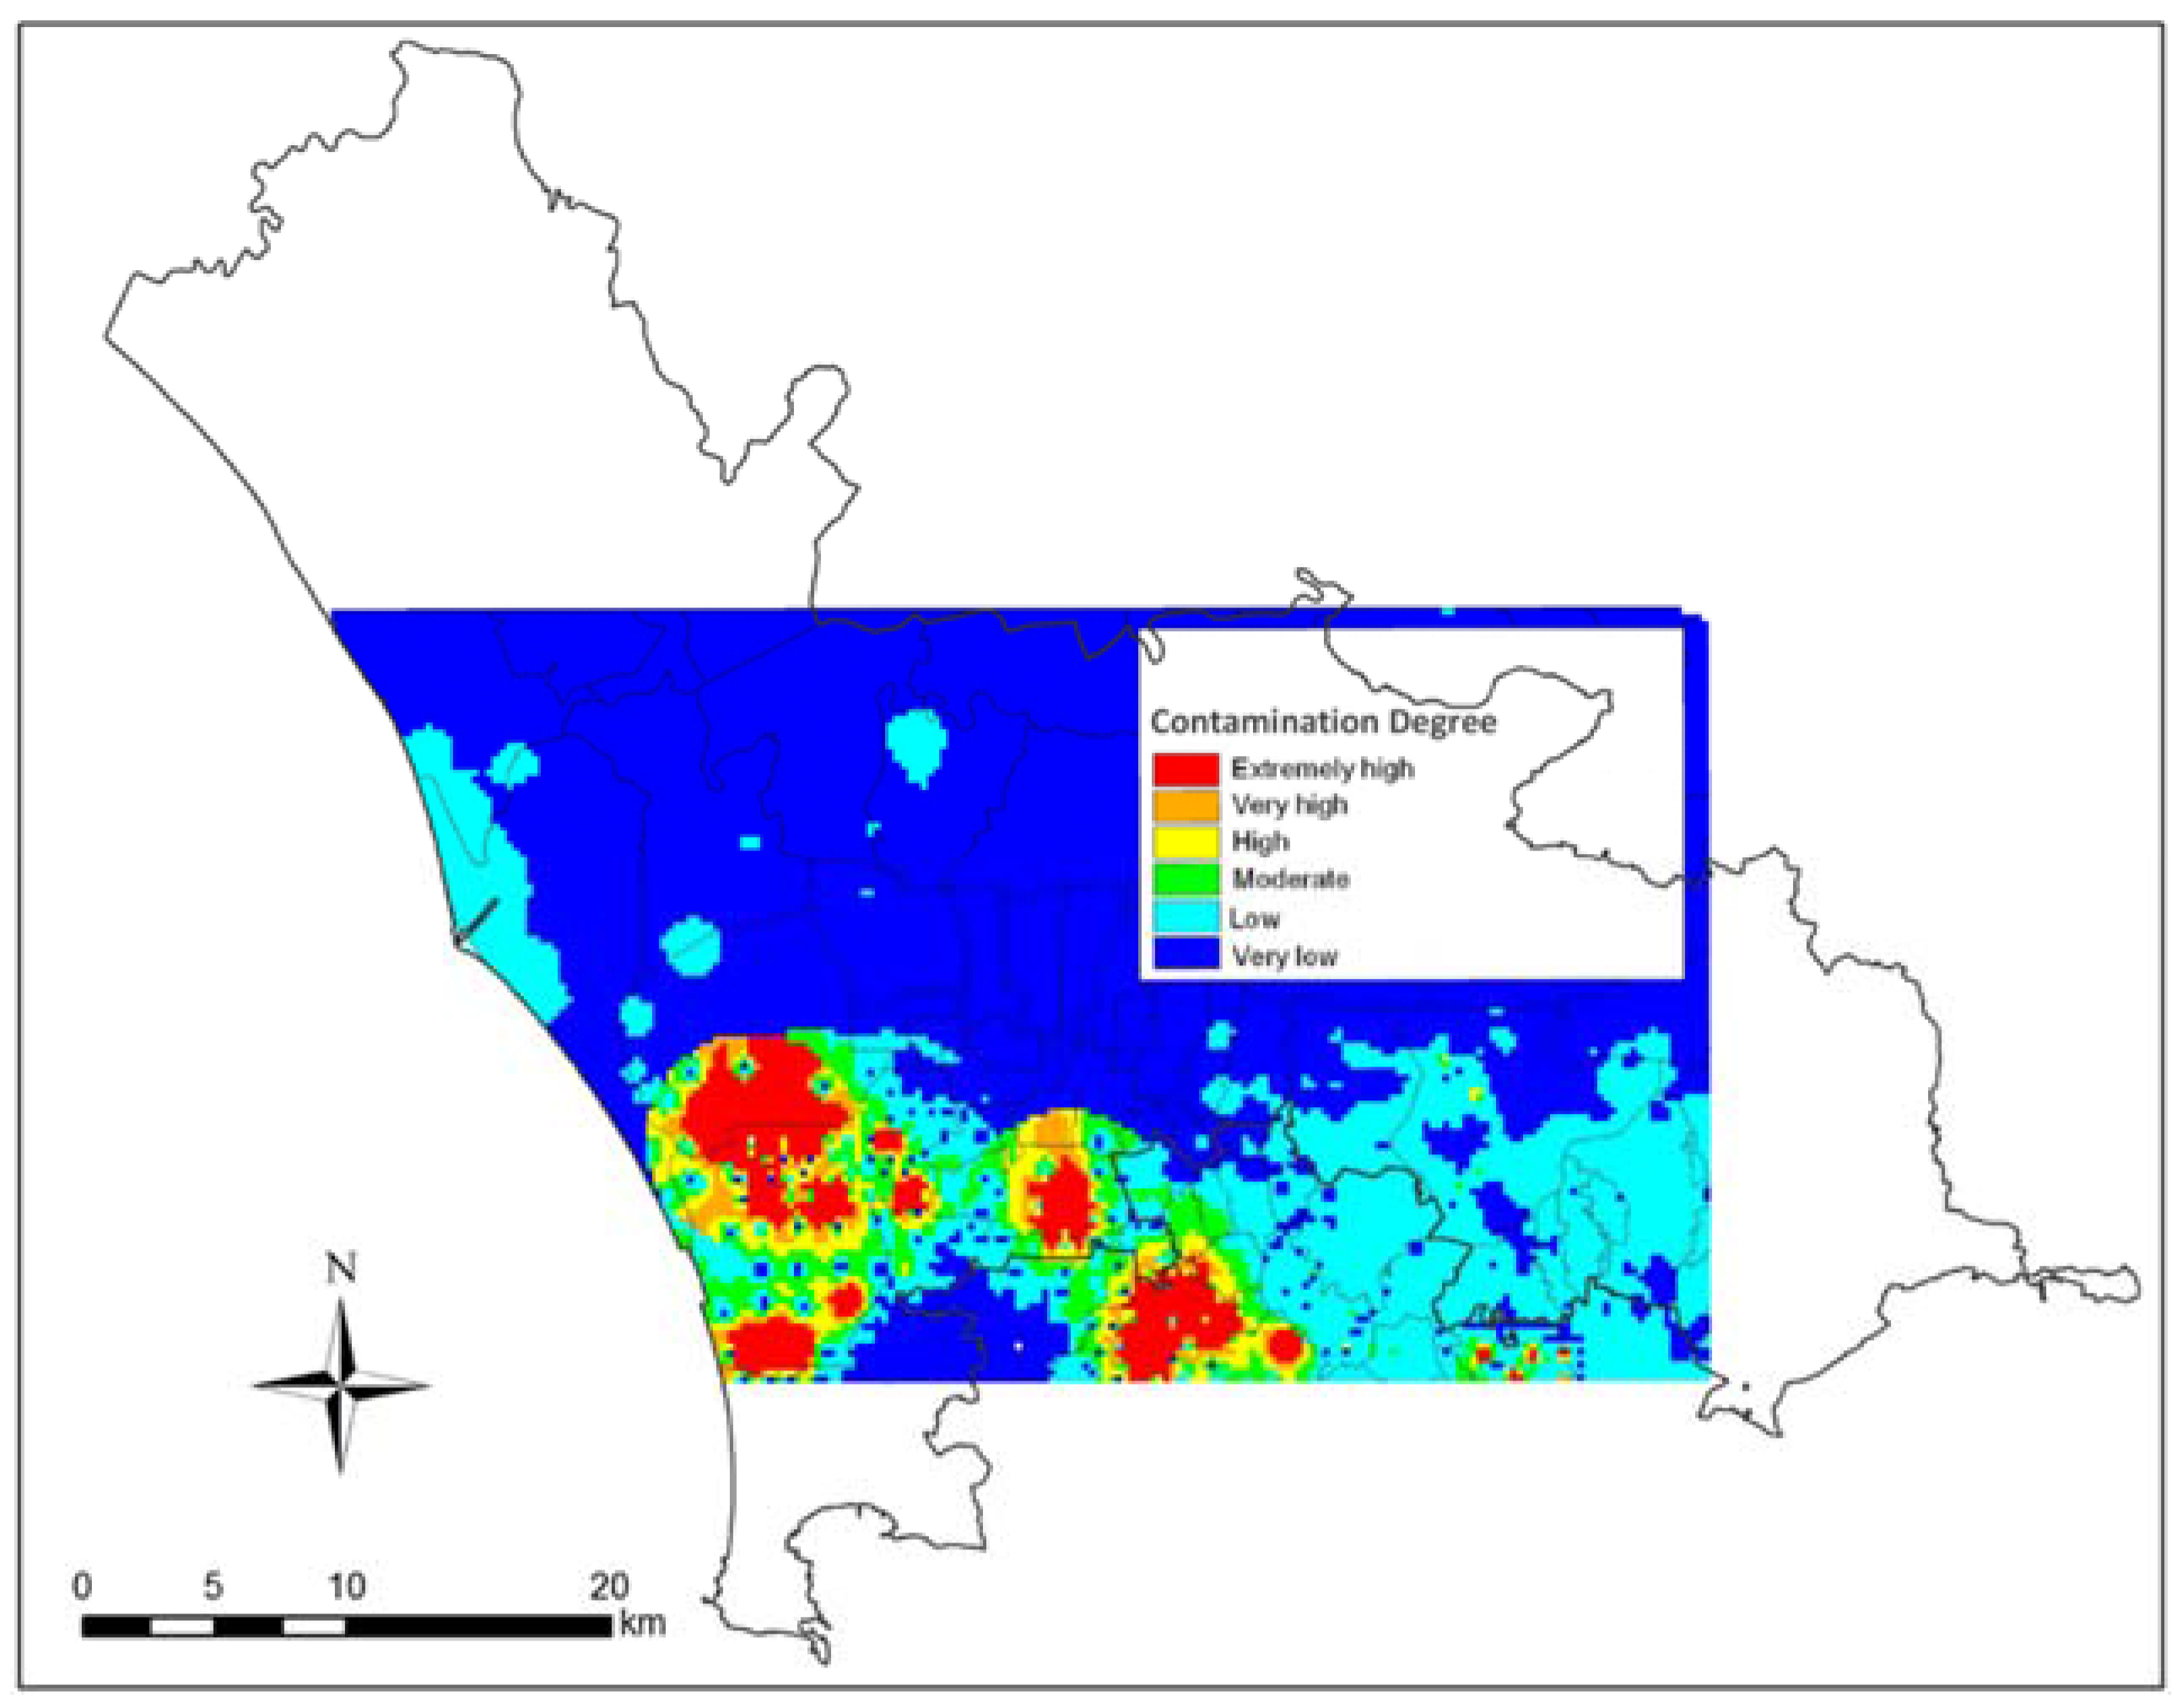
3.2. Agricultural Soils and Groundwater Characterization
- Al, As, Ba, Be, Fe, La, Th, Ti, Tl, and U, generally highly concentrated in the volcanic soils of the Phlegrean Fields, Mt. Roccamonfina volcano area (northern part of the study area) and Nola-Pomigliano area (north of Mt. Somma-Vesuvius volcano), are mostly of geogenic origin.
- Co, Cd, Cr, Fe, Mg, Mn, Ni, Sc and V, concentrated in the interior of the study area, across the Volturno River plain (in certain strongly anomalous areas), and along the coastline south and north of the river mouth, are likely related to the co-precipitation effect induced by Fe and Mn hydroxides in soil of alluvial origin.
- Sb, Pb, Sn, Zn, Cd, Hg and Cu, generally located at the Volturno River mouth and certain urban centres across the study area, may be historically linked to both heavy motor vehicle traffic and industrial settlements.
- Sr, K, Na, Ba and P enriched in volcanic soils north of Mt. Somma-Vesuvius are probably dependent on the natural composition of volcanic sediments and their extensive agricultural use.
- Se, B and S found in considerable concentrations in the Nola area, across the Phleagrean Fields, and in a large area south of the Volturno River mouth, may be related to hydrothermal phenomena.
- Around 10% of analysed samples of soils exceeded the thresholds for As in the case of residential/recreational land use (20 mg/kg), including two sites where As even exceeded thresholds for commercial/industrial land use (50 mg/kg).
- Around 20% of analysed soils had Cu concentrations greater than thresholds (120 mg/kg for residential/recreational and 600 mg/kg for industrial/commercial land uses), especially in the Nola-Pomigliano area where values reached 677 mg/kg and the use of Cu-rich compounds in agriculture cannot be excluded as a potential contamination source.
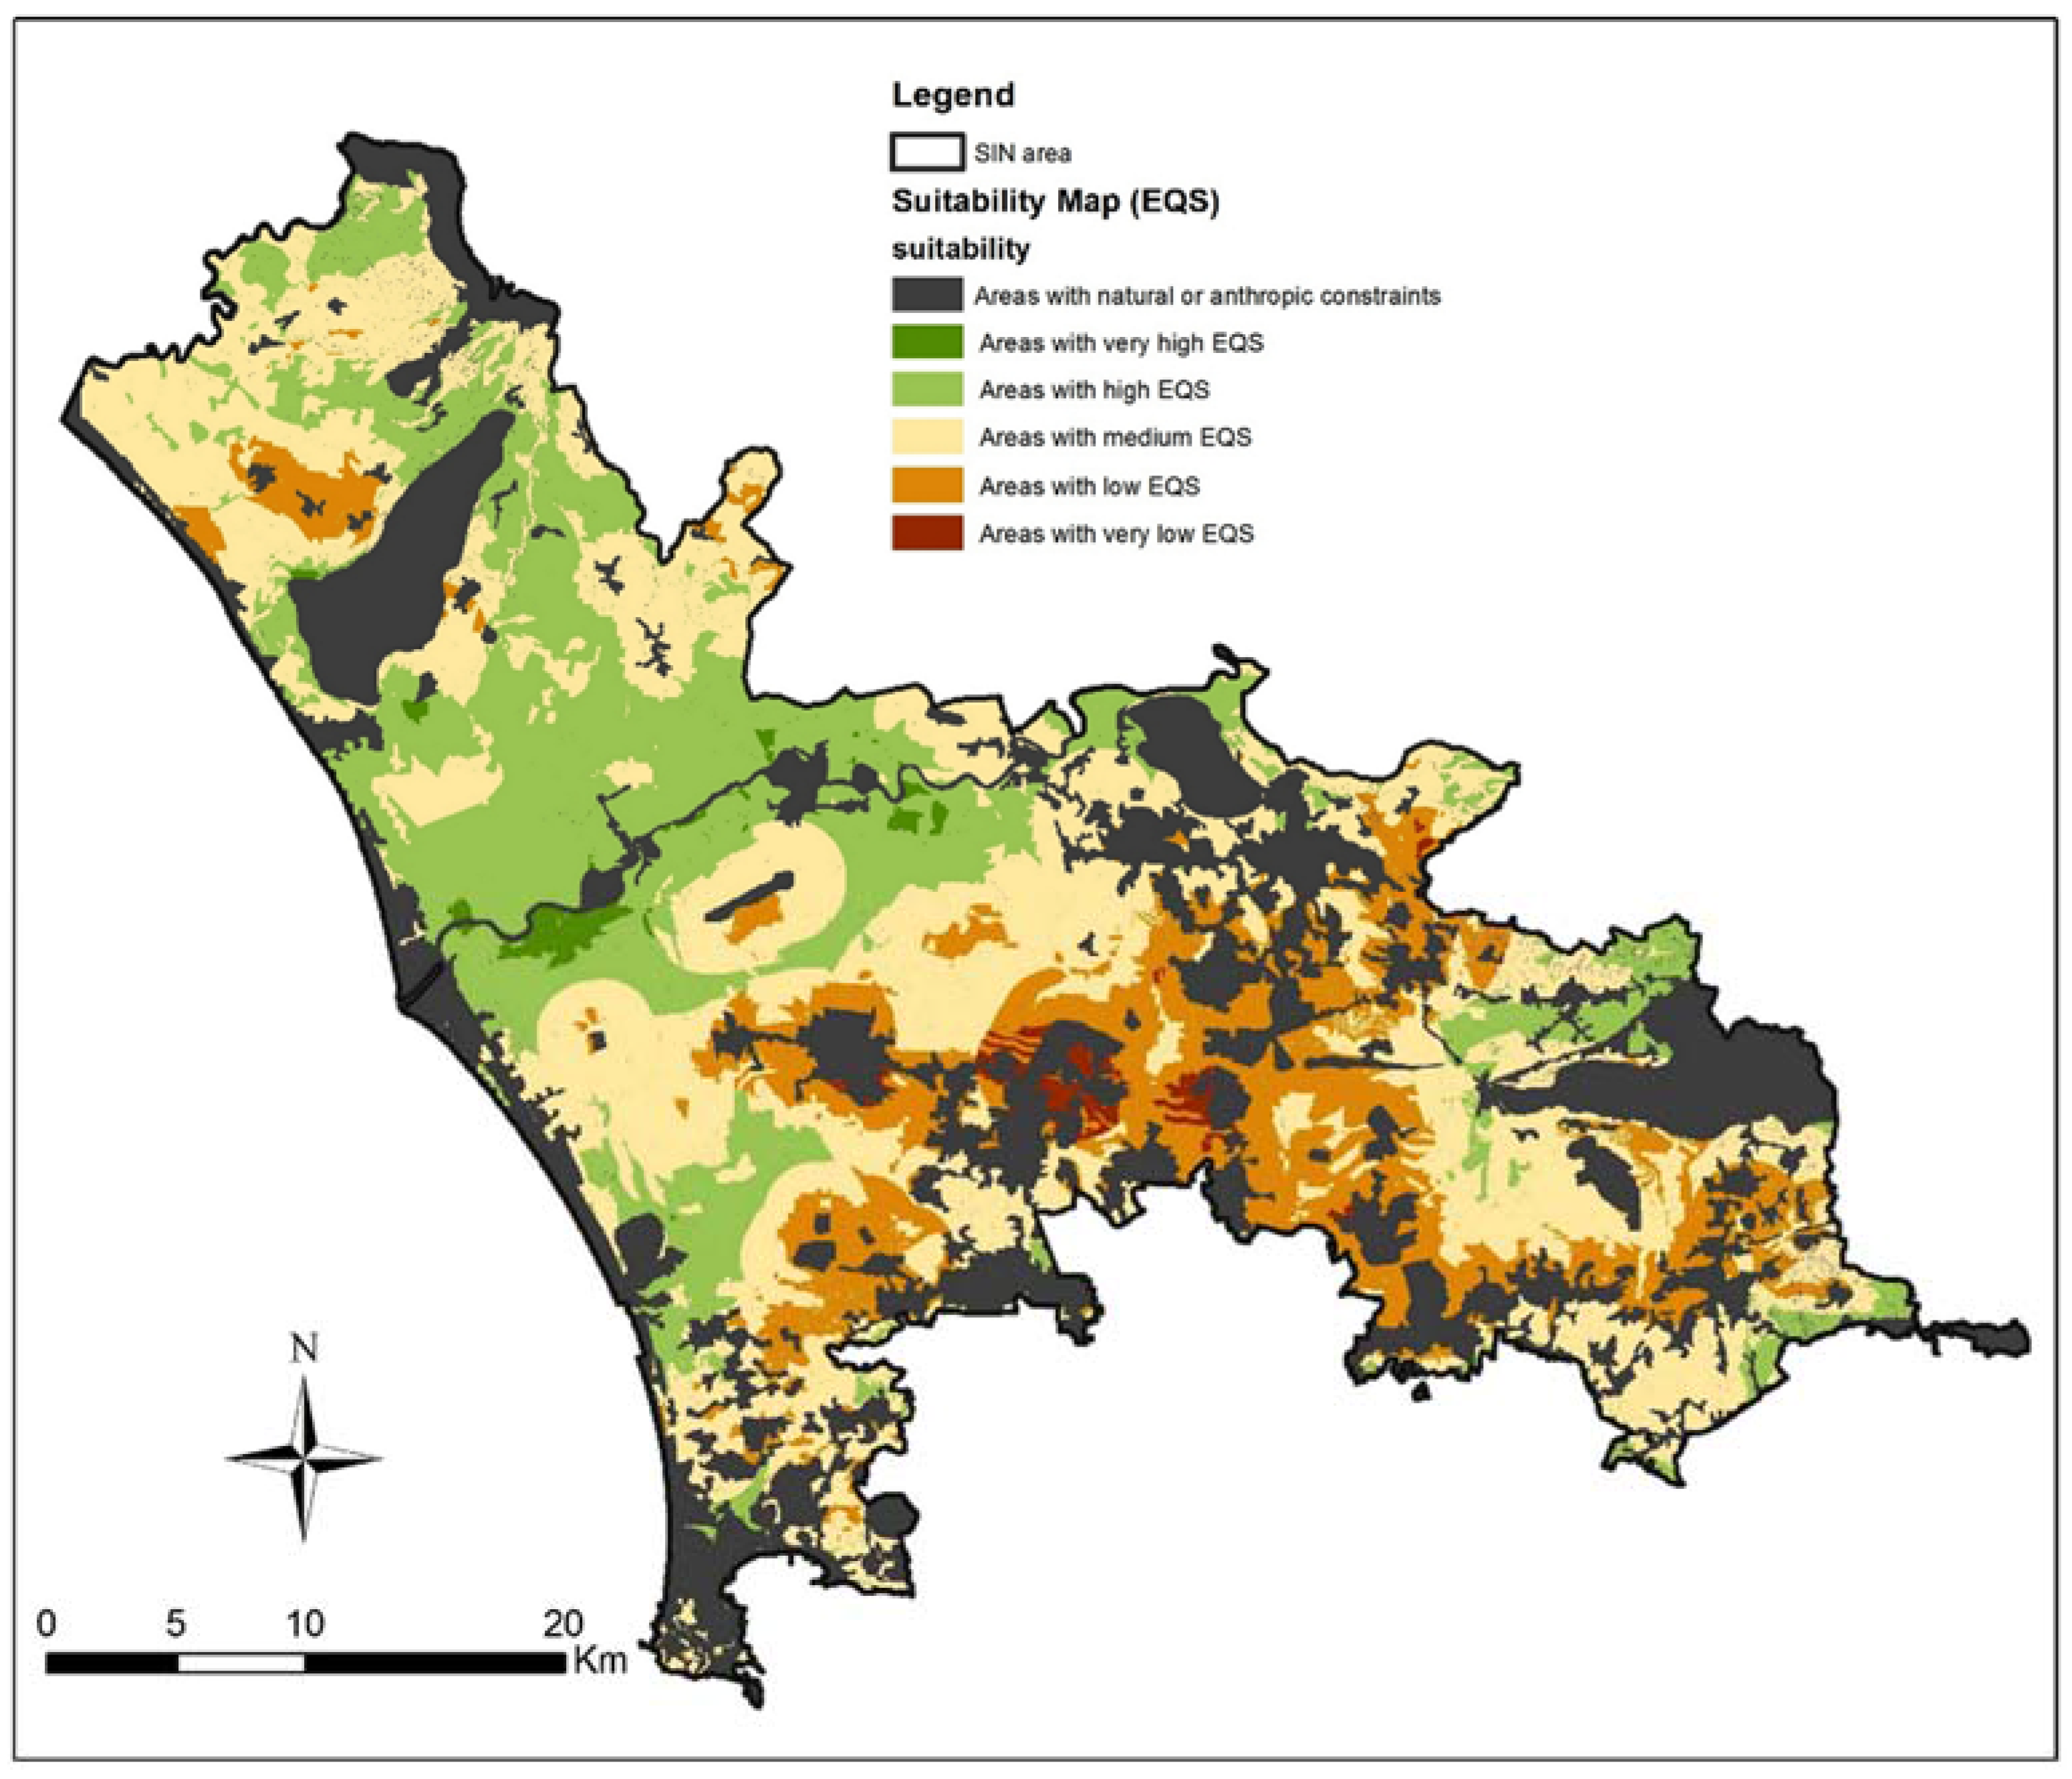
3.3. Suitability Map of the Bio-Remediation Reclamation Techniques
3.4. Human Exposure and Health Assessment
3.4.1. Human Exposure
3.4.2. Health Assessment
4. Conclusions
- The atmospheric data indicated that a significant part of total emissions was from road traffic. The spatial distribution of emission levels depicts maximum emission densities around the city of Caserta.
- In many agricultural soils, Potentially Toxic Metals (PTMs) were found in concentrations exceeding the legal limits for soil established by Italian and European environmental laws. Some elements (As, Be and Tl, and possibly Sn) are of geogenic origin, Cd is related to the effect of co-precipitation induced by the presence of Fe and Mn in soils of alluvial origin, and others (Cu, Pb and Zn) are related to both heavy motor vehicle traffic, industrial settlements (Pb, Zn) and agricultural practises (Cu to vineyards).
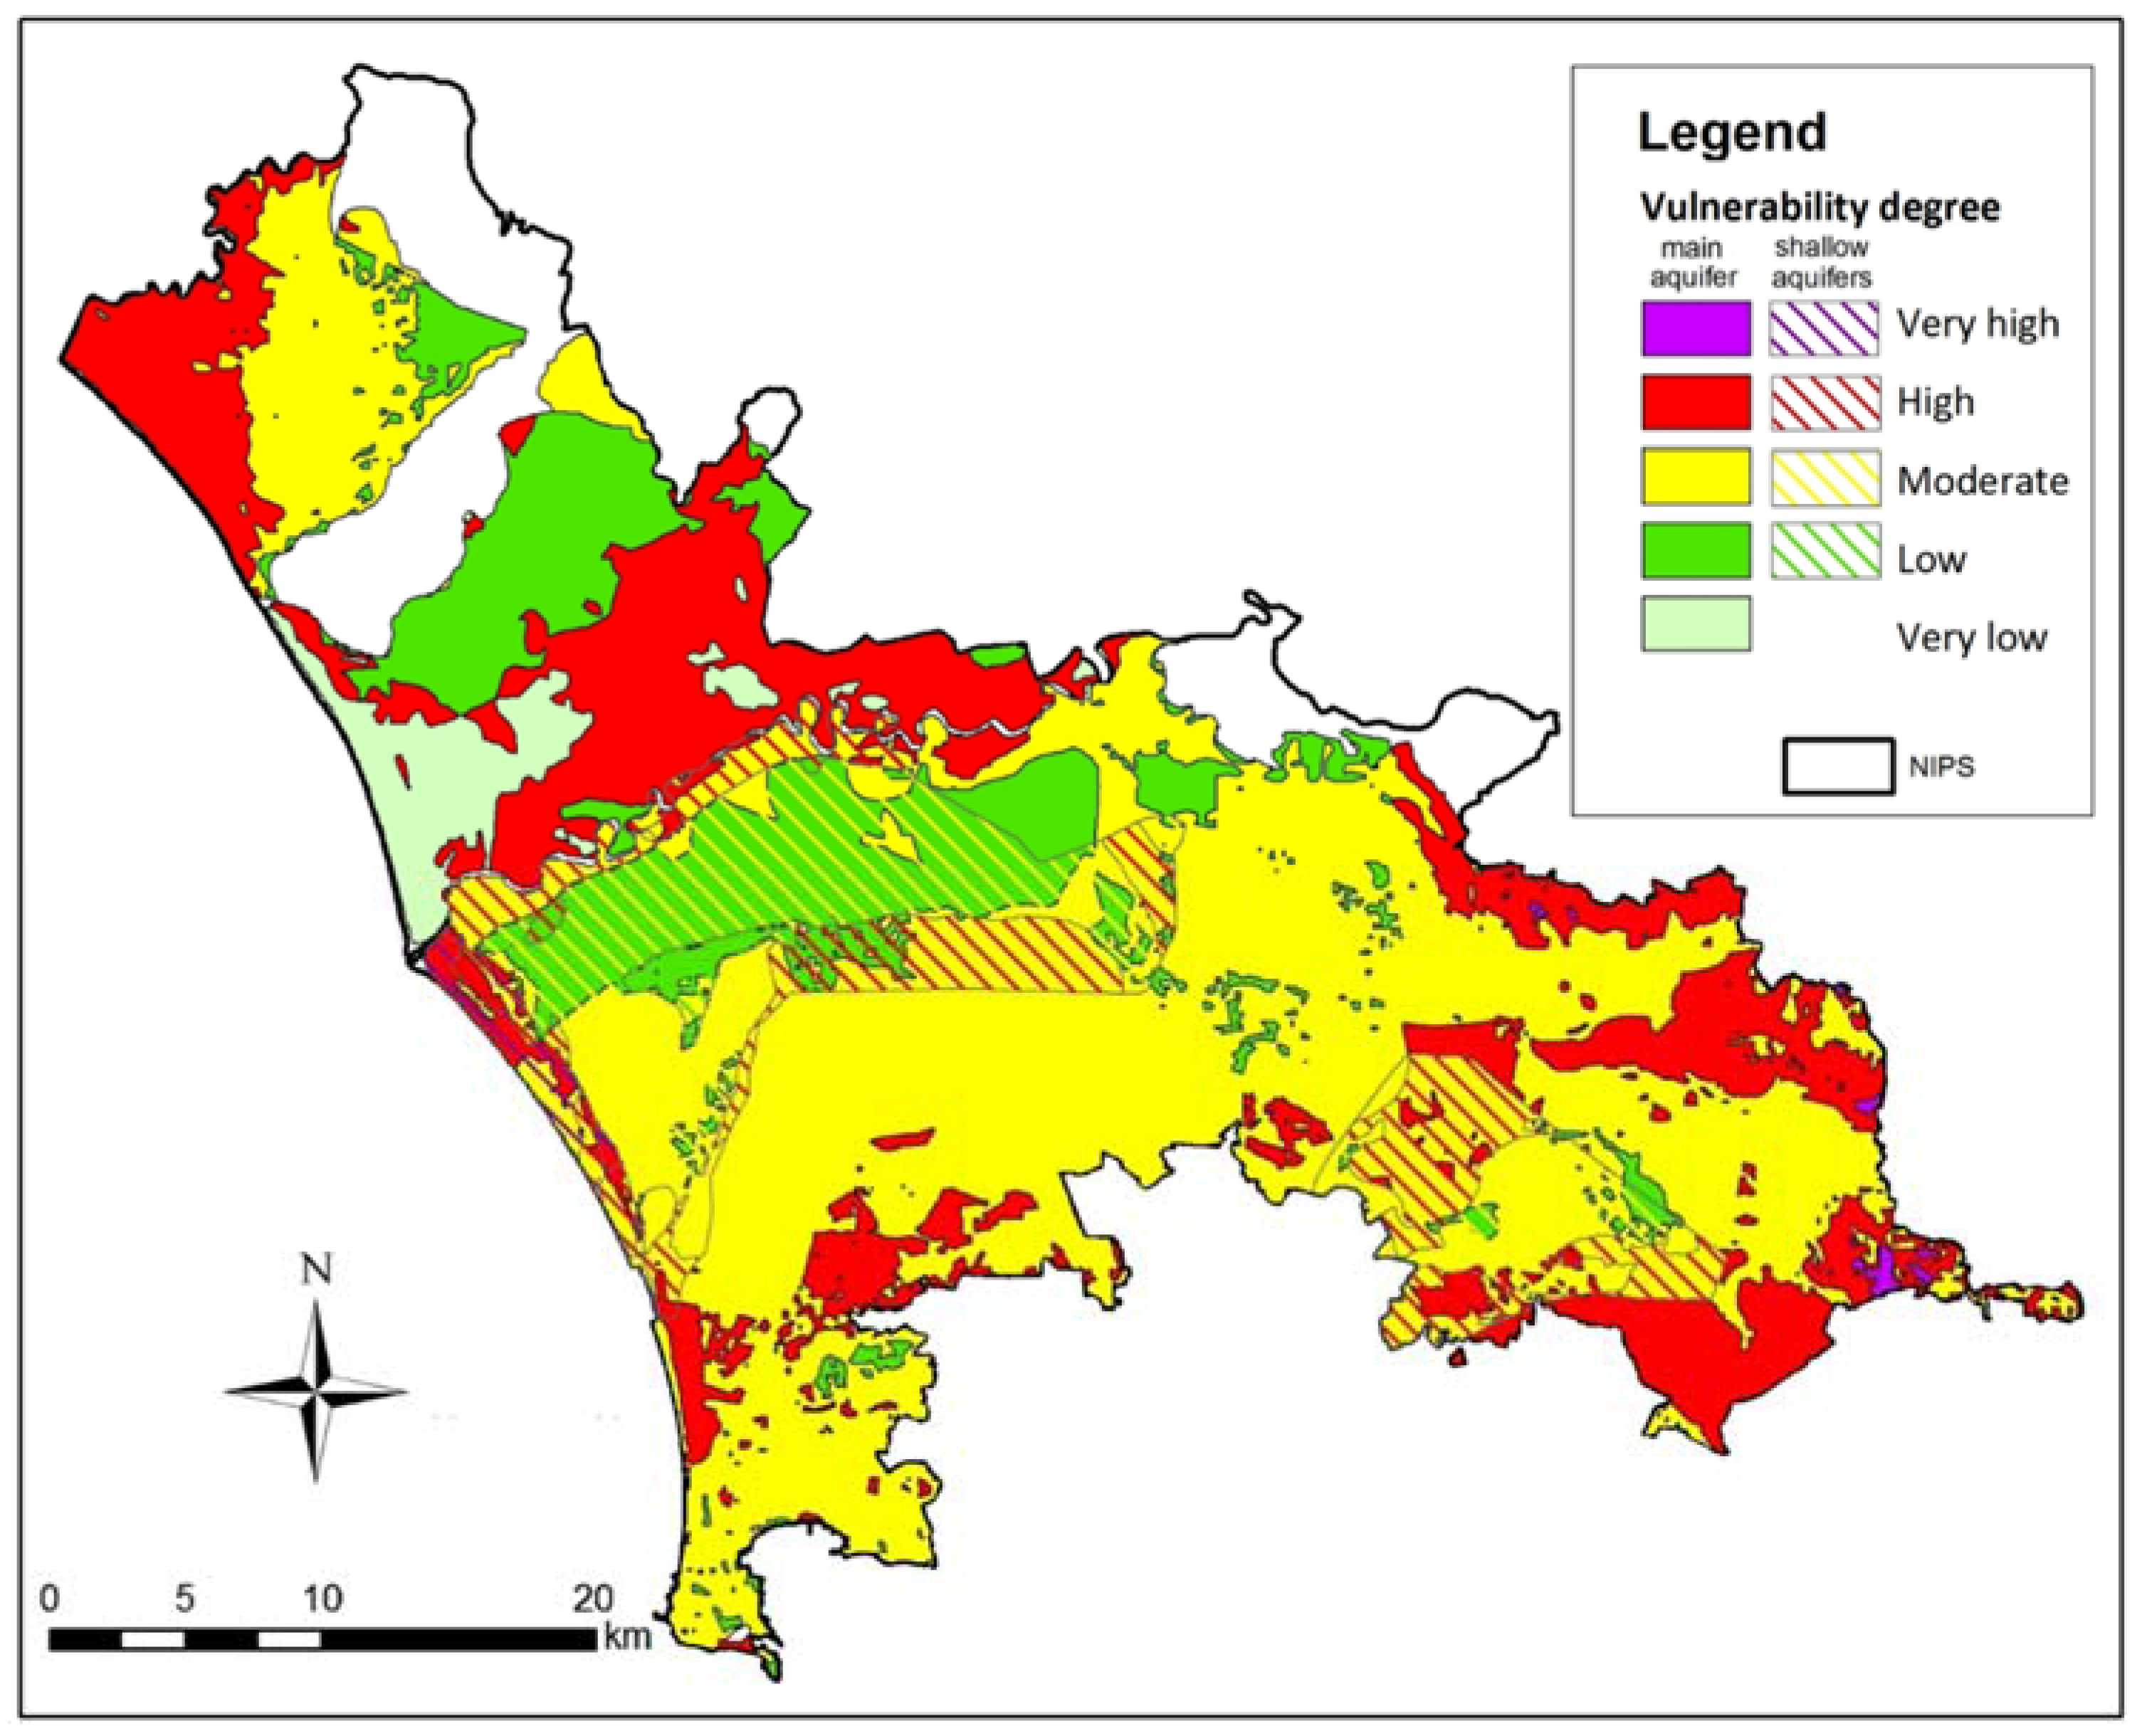
- The hydrogeological study, concerned an assessment of groundwater quality and the susceptibility of aquifers to contamination, shows that in many cases the presence of high values of F, As, Fe and Mn is of geogenic origin and the depth to water is the most significant parameter influencing the groundwater contamination (mainly by nitrates of agricultural origin).
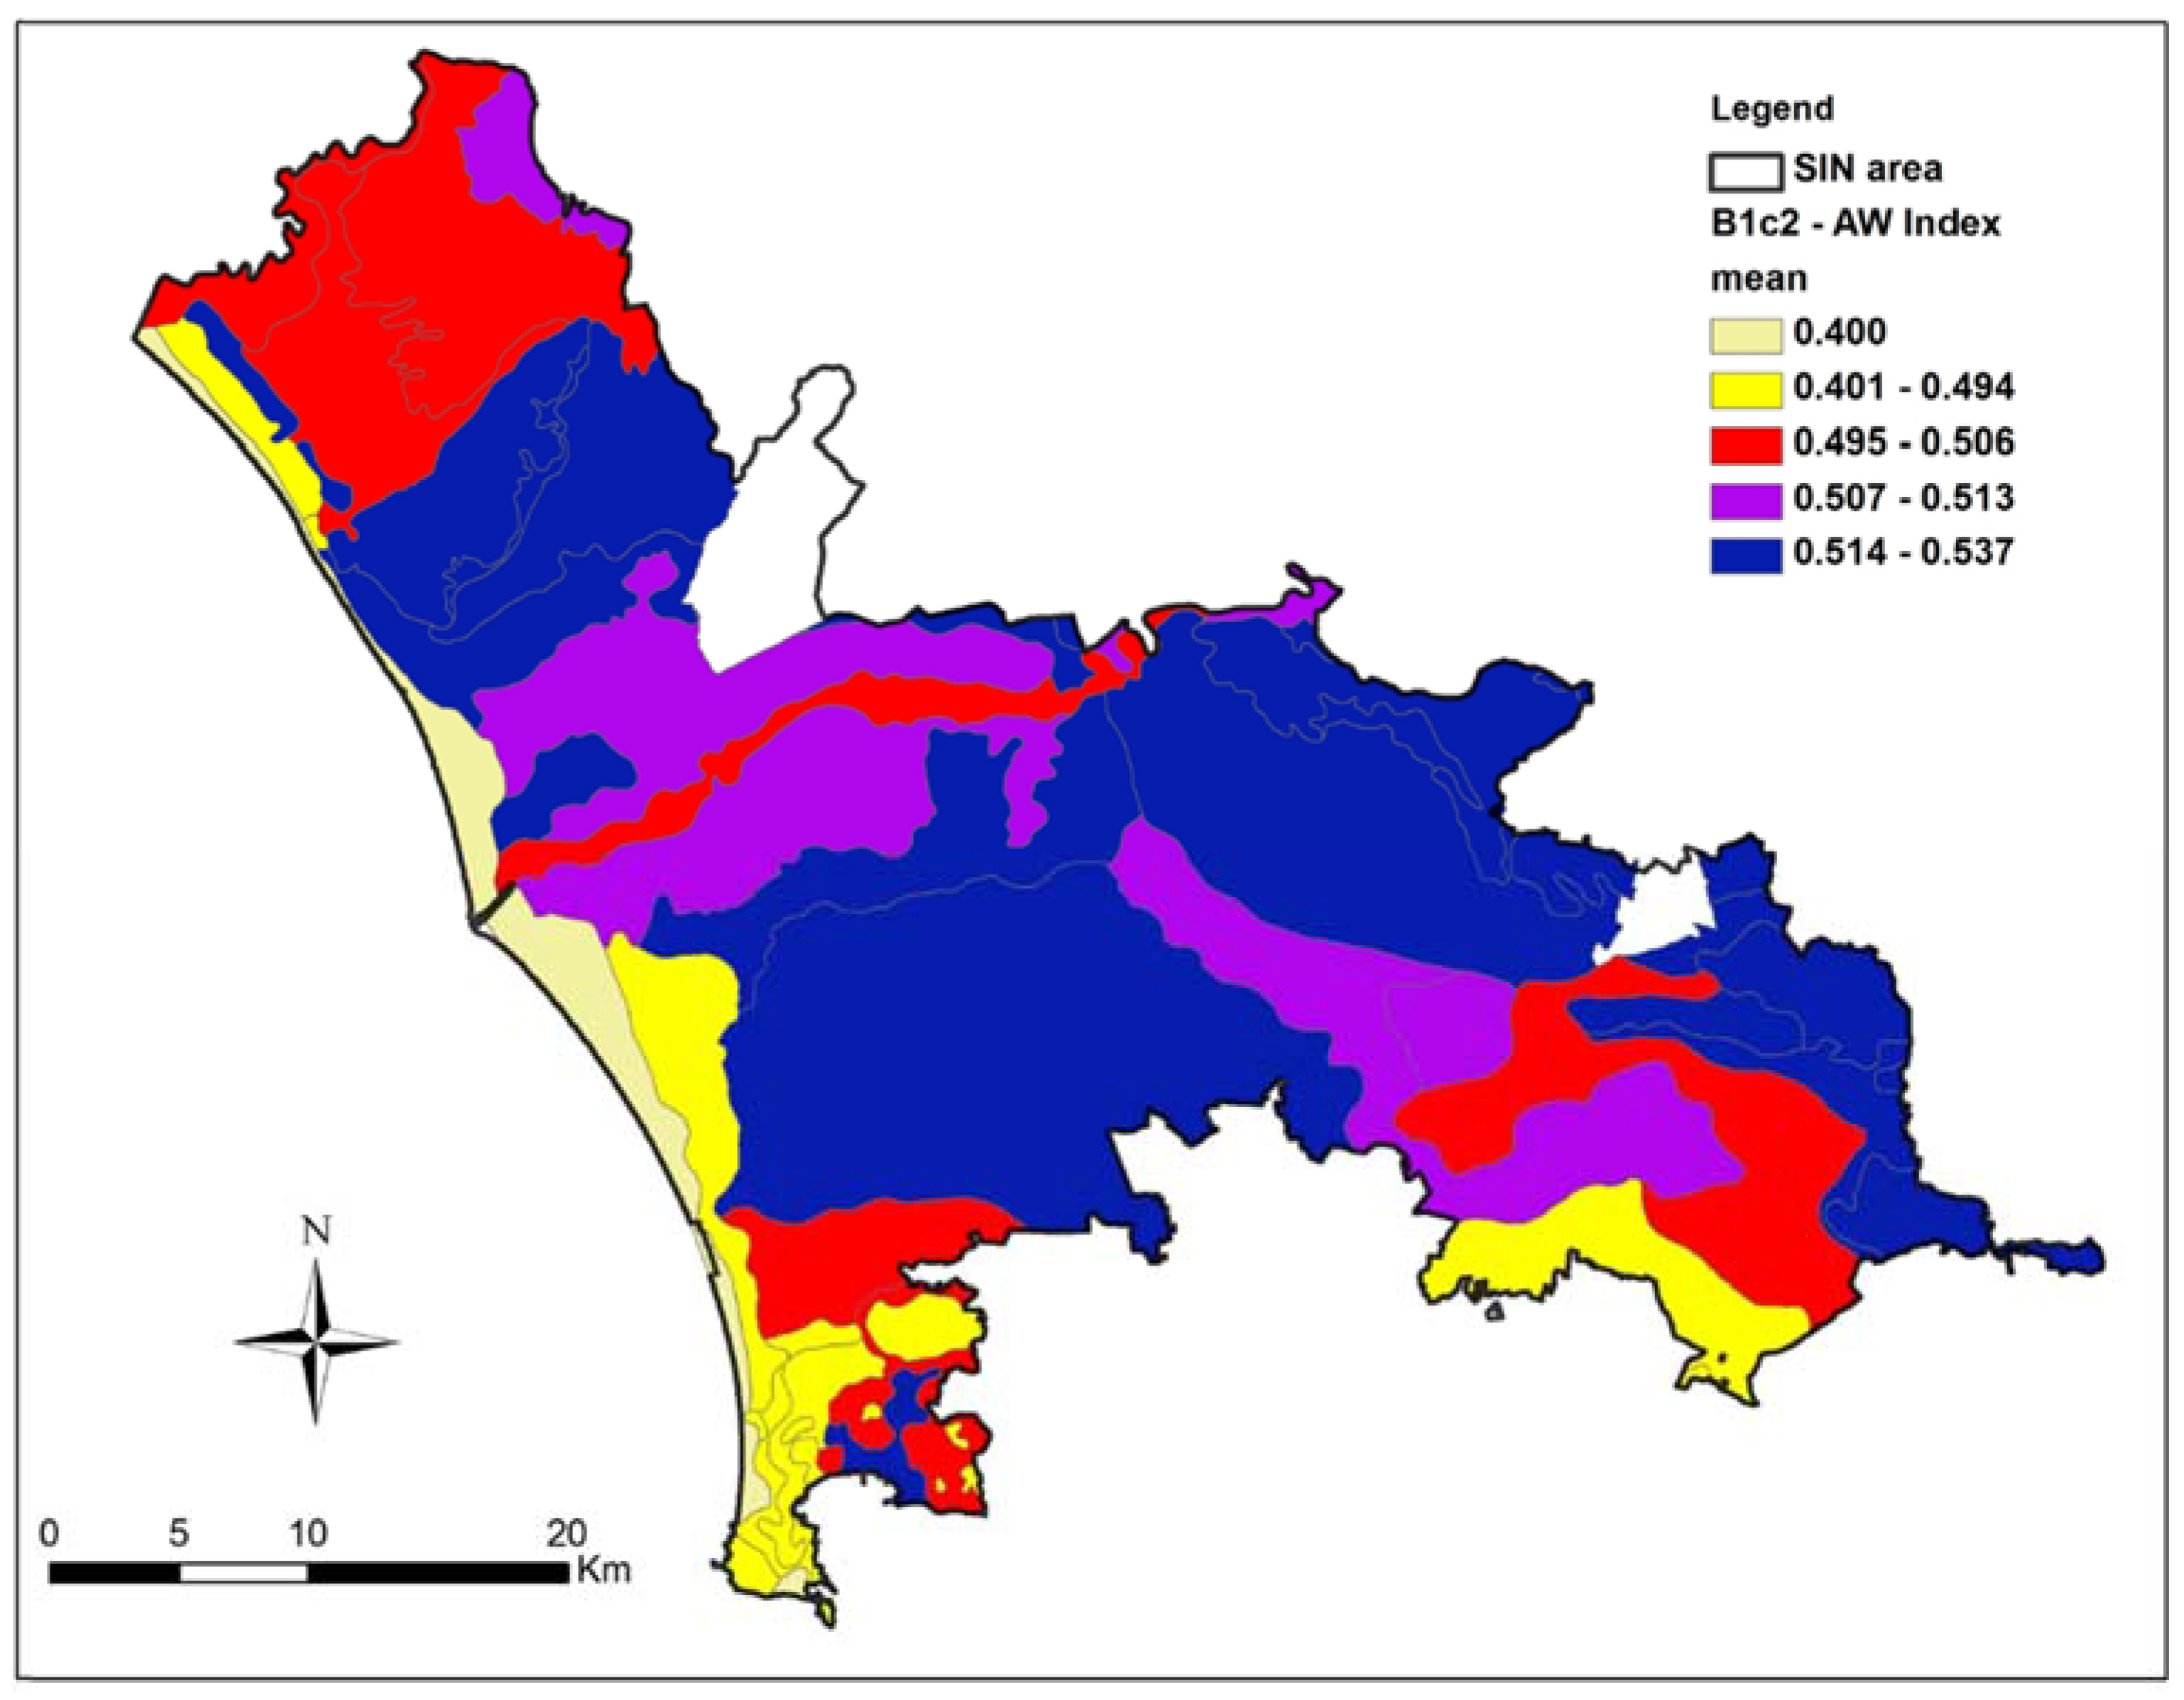
- The soil hydraulic characterization allowed the drawn up of the Available Water (AW) index map, which represents water stored in the soil profile and available for plant growth, which was an useful layer for the “suitability map”.
- The human exposure and health assessment parts of the study gave two sets of results, both of which may be of potential relevance to public health. The epidemiological study provided new evidence confirming higher rates of certain diseases in the population of the study area relative to those of the entire Campania region. In an epidemiological observational study such as this, any exclusion of specific chronic degenerative diseases, including cancer, may lead to selection bias, resulting in a likely over- or underestimation of risk, and this is why all types of disease or cancer should always be assessed. As to the potential confounding factors may indeed play a significant role, nevertheless this information is simply not available in the existing databases. Despite this limitation the data reported in the study are original and important to focus future research.
Supplementary Materials
Acknowledgments
Author Contributions
Conflicts of Interest
References
- Navy and Marine Corps Public Health Center. Naples Public Health Evaluation—A Risk Communication Case Study. May 2013. Available online: http://www.med.navy.mil/sites/nmcphc/Documents/environmental-programs/risk-communication/Naples-Public-Health-Evaluation-Case-Study-May-2013.pdf (accessed on 26 June 2017).
- Ferretti, V. A multicriteria spatial decision support system development for siting a landfill in the province of Torino (Italy). J. Multi-Criteria Decis. Anal. 2011, 18, 231–252. [Google Scholar] [CrossRef]
- Geneletti, D. An approach based on spatial multicriteria analysis to map the nature conservation value of agricultural land. J. Environ. Manag. 2007, 83, 228–235. [Google Scholar] [CrossRef] [PubMed]
- Malczewski, J. GIS-based multicriteria decision analysis: A survey of the literature. Int. J. Geogr. Inf. Sci. 2006, 20, 703–726. [Google Scholar] [CrossRef]
- Rosén, L.; Back, P.E.; Söderqvist, T.; Norrman, J.; Brinkhoff, P.; Norberg, T.; Volchkoa, Y.; Norind, M.; Bergknutf, M.; Döberl, G. SCORE: A novel multi-criteria decision analysis approach to assessing the sustainability of contaminated land remediation. Sci. Total Environ. 2015, 511, 621–638. [Google Scholar] [CrossRef] [PubMed]
- Beames, A.; Broekx, S.; Lookman, R.; Touchant, K.; Seuntjens, P. Sustainability appraisal tools for soil and groundwater remediation: How is the choice of remediation alternative influenced by different sets of sustainability indicators and tool structures? Sci. Total Environ. 2014, 470, 954–966. [Google Scholar] [CrossRef] [PubMed]
- Agostini, P.; Critto, A.; Semenzin, E.; Marcomini, A. Decision support systems for contaminated land management: A review. In Decision Support Systems for Risk-Based Management of Contaminated Sites; Springer: New York, NY, USA, 2009; pp. 1–20. ISBN 978-0-387-09722-0. [Google Scholar]
- Carlon, C.; Critto, A.; Ramieri, E.; Marcomini, A. DESYRE: Decision support system for the rehabilitation of contaminated megasites. Integr. Environ. Assess. Manag. 2007, 3, 211–222. [Google Scholar] [CrossRef] [PubMed]
- Carlon, C.; Pizzol, L.; Critto, A.; Marcomini, A. A spatial risk assessment methodology to support the remediation of contaminated land. Environ. Int. 2008, 34, 397–411. [Google Scholar] [CrossRef] [PubMed]
- Corniello, A.; Ducci, D. Hydrogeochemical characterization of the main aquifer of the “Litorale Domizio-Agro Aversano NIPS” (Campania—Southern Italy). J. Geochem. Explor. 2014, 137, 1–10. [Google Scholar] [CrossRef]
- Bove, M.A.; Ayuso, R.A.; De Vivo, B.; Lima, A.; Albanese, S. Geochemical and isotopic study of soils and waters from an Italian contaminated site: Agro Aversano (Campania). J. Geochem. Explor. 2011, 109, 38–50. [Google Scholar] [CrossRef]
- Grezzi, G.; Ayuso, R.A.; De Vivo, B.; Lima, A.; Albanese, S. Lead isotopes in soils and groundwaters as tracers of the impact of human activities on the surface environment: The Domizio-Flegreo Littoral (Italy) case study. J. Geochem. Explor. 2011, 109, 51–58. [Google Scholar] [CrossRef]
- Ducci, D.; Corniello, A.; Sellerino, M. Hydrostratigraphical setting and groundwater quality status in alluvial aquifers: The low Garigliano River Basin (Southern Italy), case study. In Proceedings of the IAH Conference on Groundwater Quality Sustainability, Krakow, Poland, 12–17 September 2010; pp. 197–203. [Google Scholar]
- EEA, European Environment Agency. EEA Air Pollutant Emission Inventory Guidebook—2009; European Environment Agency: Copenhagen, Denmark, 2009. [Google Scholar]
- US EPA, United States Environmental Protection Agency. Compilation of Air Pollutant Emission Factors (AP-42) Volume 1: Point and Area Sources. Available online: https://www.epa.gov/air-emissions-factors-and-quantification/ap-42-compilation-air-emission-factors (accessed on 29 May 2017).
- Houghton, J.T.; Meira Filho, L.G.; Lim, B.; Treanton, K.; Mamaty, I. Revised 1996 IPCC Guidelines for National Greenhouse Gas Inventories. Volume 1: Greenhouse Gas Inventory Reporting Instructions. Volume 2: Greenhouse Gas Inventory Workbook. Volume 3: Greenhouse Gas Inventory Reference Manual; UK Meteorological Office: Bracknell, UK, 1997. [Google Scholar]
- EEA, European Environment Agency. MEP/EEA Air Pollutant Emission Inventory Guidebook 2013: Technical Guidance to Prepare National Emission Inventories; European Environment Agency: Copenhagen, Denmark, 2013. [Google Scholar]
- Ntziachristos, L.; Mamakos, A.; Samaras, Z.; Xanthopoulos, A.; Iakovou, E. Emission control options for power two wheelers in Europe. Atmos. Environ. 2006, 40, 4547–4561. [Google Scholar] [CrossRef]
- CORINAIR. European Inventory of Emissions of Pollutants into the Atmosphere; Commission of the EC–CORINAIR Project DG XI: Brussels, Belgium, 1988. [Google Scholar]
- Gkatzoflias, D.; Kouridis, C.; Ntziachristos, L.; Samaras, Z. COPERT 4: Computer Programme to Calculate Emissions from Road Transport. ETC/AEM, User Manual; EMISIA: Thessaloniki, Greece, 2007; Available online: http://emisia.com/sites/default/files/COPERT4v9_manual.pdf (accessed on 26 June 2017).
- Bellasio, R.; Bianconi, R.; Corda, G.; Cucca, P. Emission inventory for the road transport sector in Sardinia (Italy). Atmos. Environ. 2007, 41, 677–691. [Google Scholar] [CrossRef]
- ACI—Automobile Club d’Italia, 2011. In Annuario Statistico—Automobilismo e Trasporti; ACI: Roma, Italy, 2011; Available online: http://www.aci.it/laci/studi-e-ricerche/dati-e-statistiche/annuario-statistico/annuario-statistico-2011.html (accessed on 15 December 2016).
- Italian National Institute for Environmental Protection and Research ISPRA. Trasporto su Strada—Inventario nazionale delle Emissioni e Disaggregazione Provinciale; Rapporti: Roma, Italy, 2010; ISBN 978-88-448-0466-4.
- Albanese, S.; Fontaine, B.; Chen, W.; Lima, A.; Cannatelli, C.; Piccolo, A.; Qi, S.; Wang, M.; De Vivo, B. Polycyclic aromatic hydrocarbons in the soils of a densely populated region and associated human health risks: The Campania Plain (Southern Italy) case study. Environ. Geochem. Health 2015, 37, 1–20. [Google Scholar] [CrossRef] [PubMed]
- Lima, A.; Giaccio, L.; Cicchella, D.; Albanese, C.S.; Bove, M.; Grezzi, G.; De Vivo, B. Atlante Geochimico-Ambientale del SIN (Sito di Intreresse Nazionale) Litorale Domizio-Flegreo e Agro Aversano; Aracne: Roma, Italy, 2012. [Google Scholar]
- Albanese, S.; De Vivo, B.; Lima, A.; Cicchella, D. Geochemical background and baseline values of toxic elements in stream sediments of Campania region (Italy). J. Geochem. Explor. 2007, 93, 21–34. [Google Scholar] [CrossRef]
- De Vivo, B.; Cicchella, D.; Lima, A.; Albanese, S. Atlante Geochimico Ambientale dei Suoli Dell'area Urbana e Della Provincia di Napoli; Aracne: Roma, Italy, 2006; ISBN 978-88-548-0563-7. [Google Scholar]
- De Vivo, B.; Lima, A.; Albanese, S.; Cicchella, D. Atlante Geochimico-Ambientale Della Regione Campania; Aracne: Roma, Italy, 2006; ISBN 978-88-548-0819-5. [Google Scholar]
- Cheng, Q. GeoData Analysis System (GeoDAS) for Mineral Exploration and Environmental Assessment, User’s Guide (GeoDAS Phase III); York University: Toronto, SD, Canada, 2003. [Google Scholar]
- Agterberg, F.P. Multifractals and geostatistics. J. Geochem. Explor. 2012, 122, 113–122. [Google Scholar] [CrossRef]
- Lima, A. Evaluation of geochemical background at regional and local scales by fractal filtering technique: Case studies in selected Italian areas. In Site Characterization, Data Analysis and Case Stories; de Vivo, B., Belkin, H.E., Lima, A., Eds.; Elsevier: Amsterdam, The Netherlands, 2008; pp. 135–153. [Google Scholar]
- Cicchella, D.; De Vivo, B.; Lima, A. Background and baseline concentration values of elements harmful to human health in the volcanic soils of the metropolitan and provincial areas of Napoli (Italy). Geochem. Explor. Environ. Anal. 2005, 5, 29–40. [Google Scholar] [CrossRef]
- Lima, A.; De Vivo, B.; Cicchella, D.; Cortini, M.; Albanese, S. Multifractal IDW interpolation and fractal filtering method in environmental studies: An application on regional stream sediments of (Italy), Campania region. Appl. Geochem. 2003, 18, 1853–1865. [Google Scholar] [CrossRef]
- Cheng, Q. Multifractality and spatial statistics. Comput. Geosci. 1999, 25, 949–961. [Google Scholar] [CrossRef]
- Ayuso, R.A.; Foley, N.; Robinson, G.; Wandless, G.; Dillingham, J. Lead Isotopic Compositions of Common Arsenical Pesticides Used in New England. USGS Open File Report; USGS: Reston, VA, USA, 2004; Volume 1342.
- Aiuppa, A.; Avino, R.; Brusca, L.; Caliro, S.; Chiodini, G.; D’Alessandro, W.; Longo, M. Mineral control of arsenic content in thermal waters from volcano-hosted hydrothermal systems: Insights from island of Ischia and Phlegrean Fields (Campanian Volcanic Province, Italy). Chem. Geol. 2006, 229, 313–330. [Google Scholar] [CrossRef]
- Ducci, D.; de Melo, M.T.C.; Preziosi, E.; Sellerino, M.; Parrone, D.; Ribeiro, L. Combining natural background levels (NBLs) assessment with indicator kriging analysis to improve groundwater quality data interpretation and management. Sci. Total Environ. 2016, 569, 569–584. [Google Scholar] [CrossRef] [PubMed]
- Ducci, D.; Sellerino, M. Natural background levels for some ions in groundwater of the Campania region (southern Italy). Environ. Earth Sci. 2012, 67, 683–693. [Google Scholar] [CrossRef]
- Civita, M.; De Maio, M. Valutazione e Cartografia Automatica Della Vulnerabilità Degli Acquiferi All’inquinamento con il Sistema Parametrico-SINTACS R5-A New Parametric System for the Assessment and Automatic Mapping of Ground Water Vulnerability to Contamination; Pitagora: Bologna, Italy, 2000; Volume 72, p. 226. [Google Scholar]
- Romano, N.; Palladino, M.; Chirico, G.B. Parameterization of a bucket model for soil-vegetation-atmosphere modeling under seasonal climatic regimes. Hydrol. Earth Syst. Sci. 2011, 15, 3877–3893. [Google Scholar] [CrossRef]
- Nasta, P.; Romano, N. Use of a flux-based field capacity criterion to identify effective hydraulic parameters of layered soil profiles subjected to synthetic drainage experiments. Water Resour. Res. 2016, 52, 566–584. [Google Scholar] [CrossRef]
- Weynants, M.; Vereecken, H.; Javaux, M. Revisiting Vereecken pedotransfer functions: Introducing a closed-form hydraulic model. Vad. Zone J. 2009, 8, 86–95. [Google Scholar] [CrossRef]
- Di Gennaro, A. I sistemi di terre della Campania. In Regione Campania, Risorsa srl, Assessorato Alla Ricerca Scientifica; SELCA: Firenze, Italy, 2002. [Google Scholar]
- Di Gennaro, A.; Terribile, F. I Suoli Della Provincia di Napoli: Carta 1:75.000 e Legenda; SELCA: Firenze, Italy, 1999. [Google Scholar]
- Romano, N.; Santini, A. Methods of Soil Analysis. Part 4, Physical Methods; Dane, J.H., Topp, G.C., Eds.; Soil Science Society of America: Madison, WI, USA, 2002; Volume 5, pp. 721–738. [Google Scholar]
- Cervelli, E.; Pindozzi, S.; Sacchi, M.; Capolupo, A.; Cialdea, D.; Rigillo, M.; Boccia, L. Supporting land use change assessment through Ecosystem Services and Wildlife Indexes. Land Use Policy 2017, 65, 249–265. [Google Scholar] [CrossRef]
- Sharifi, M.A. Site selection for waste disposal through spatial multiple criteria decision analysis. J. Telecommun. Inf. Technol. 2004, 3, 28–38. [Google Scholar]
- Cervelli, E.; Pindozzi, S.; Capolupo, A.; Okello, C.; Rigillo, M.; Boccia, L. Ecosystem services and bioremediation of polluted areas. Ecol. Eng. 2016, 87, 139–149. [Google Scholar] [CrossRef]
- Saaty, T.L. The analytic hierarchy and analytic network processes for the measurement of intangible criteria and for decision-making. In Multiple Criteria Decision Analysis: State of the Art Surveys; Figueira, J., Greco, S., Ehrgott, M., Eds.; Springer: Boston, MA, USA, 2005; pp. 345–405. ISBN 978-0-387-23067-2. [Google Scholar]
- Baz, I.; Geymen, A.; Er, S.N. Development and application of GIS-based analysis/synthesis modeling techniques for urban planning of Istanbul Metropolitan Area. Adv. Eng. Softw. 2009, 40, 128–140. [Google Scholar] [CrossRef]
- Comba, P.; Ricci, P.; Iavarone, I.; Conti, S.; Bianchi, F.; Biggeri, A.; Fazzo, L.; Forastiere, F.; Martuzzi, M.; Musmeci, L.; et al. SENTIERI—Mortality, cancer incidence and hospital disharges in National Priority Contaminated Sites: Rationale and objectives. Epidemiol. Prev. 2014, 38 (Suppl. 1), 1–170. [Google Scholar]
- Crispo, A.; Barba, M.; Malvezzi, M.; Arpino, G.; Grimaldi, M.; Rosso, T.; Esposito, E.; Sergi, D.; Ciliberto, G.; Giordano, A. Cancer mortality trends between 1988 and 2009 in the metropolitan area of Naples and Caserta, Southern Italy: Results from a joinpoint regression analysis. Cancer Biol. Ther. 2013, 14, 1113–1122. [Google Scholar] [CrossRef] [PubMed]
- Barba, M.; Mazza, A.; Guerriero, C.; Di Maio, M.; Romeo, F.; Maranta, P.; Marino, I.R.; Paggi, M.G.; Giordano, A. Wasting lives: The effects of toxic waste exposure on health. The case of Campania, Southern Italy. Cancer Biol. Ther. 2011, 12, 106–111. [Google Scholar] [CrossRef] [PubMed]
- De Felip, E.; Di Domenico, A. Studio Epidemiologico sullo Stato di Salute e sui Livelli D’accumulo di Contaminanti Organici Persistenti nel Sangue e nel Latte Materno in Gruppi di Popolazione a Differente Rischio D’esposizione nella Regione Campania. SEBIOREC Rapporto Finale—Dicembre 2010. Available online: http://www.iss.it/binary/sebi/cont/SEBIOREC_Final_report_Dec_2010__human__rev_1.pdf (accessed on 29 May 2016).
- Musmeci, L.; Bellino, M.; Cicero, M.R.; Falleni, F.; Piccardi, A.; Trinca, S. The impact measure of solid waste management on health: The hazard index. Ann. Ist Super. Sanità 2010, 46, 293–298. [Google Scholar] [CrossRef] [PubMed]
- Martuzzi, M.; Mitis, F.; Bianchi, F.; Minichilli, F.; Comba, P.; Fazzo, L. Cancer mortality and congenital anomalies in a region of Italy with intense environmental pressure due to waste. Occup. Environ. Med. 2009, 66, 725–732. [Google Scholar] [CrossRef] [PubMed]
- Fazzo, L.; Belli, S.; Minichilli, F.; Mitis, F.; Santoro, M.; Martina, L.; Pizzuti, R.; Comba, P.; Martuzzi, M.; Bianchi, F. Cluster analysis of mortality and malformations in the Provinces of Naples and Caserta (Campania Region). Ann. Ist Super. Sanità 2007, 44, 99–111. [Google Scholar]
- Menegozzo, M.; Scala, F.; Filazzola, M.T.; Siciliano, A. Rischio Diossine in Campania, Dati e Prospettive; ARPAC Campania Ambientale: Avellino, Italy, 2008; Volume 4, pp. 23–30. Available online: http://www.arpacampania.it/documents/30626/56429/Dossier+Diossine.pdf (accessed on 29 May 2017).
- WHO, CNR, ISS, Regione Campania. Trattamento dei Rifiuti in Campania: Impatto Sulla Salute Umana. 2008. Available online: http://www.protezionecivile.gov.it/jcms/it/view_dossier.wp?contentId=DOS14955 (accessed on 29 May 2017).
- Comba, P.; Bianchi, F.; Fazzo, L.; Martina, L.; Menegozzo, M.; Minichilli, F.; Mitis, F.; Musmeci, L.; Pizzuti, R.; Santoro, M. Cancer mortality in an area of Campania (Italy) characterized by multiple toxic dumping sites. Ann. N. Y. Acad. Sci. 2006, 1076, 449–461. [Google Scholar] [CrossRef] [PubMed]
- Gimelli, A.; Luongo, A.; Amoresano, A. Experimental data and thermodynamic analysis of biomass steam power plant with two different configurations plant. Int. Rev. Mech. Eng. 2012, 6, 1109–1116. [Google Scholar]
- Gbanie, S.P.; Tengbe, P.B.; Momoh, J.S.; Medo, J.; Kabba, V.T.S. Modelling landfill location using geographic information systems (GIS) and multi-criteria decision analysis (MCDA): Case study Bo, Southern Sierra Leone. Appl. Geogr. 2013, 36, 3–12. [Google Scholar] [CrossRef]
- Mackenbach, J.P.; Bos, V.; Andersen, O.; Cardano, M.; Costa, G.; Harding, S.; Reid, A.; Hemström, Ö.; Valkonen, T.; Kunst, A.E. Widening socioeconomic inequalities in mortality in six Western European countries. INT. J. Epidemiol. 2003, 32, 830–837. [Google Scholar] [CrossRef] [PubMed]
- Caranci, N.; Biggeri, A.; Grisotto, L.; Pacelli, B.; Spadea, T.; Costa, G. The Italian deprivation index at census block level: Definition, description and association with general mortality. Epidemiol. Prev. 2009, 34, 167–176. [Google Scholar]
- Cadum, E.; Costa, G.; Biggeri, A.; Martuzzi, M. Deprivation and mortality: A deprivation index suitable for geographical analysis of inequalities. Epidemiol. Prev. 1998, 23, 175–187. [Google Scholar]
- Townsend, P.; Phillimore, P.; Beattie, A. Health and deprivation: Inequality and the north. Health Policy 1998, 10, 207. [Google Scholar] [CrossRef]


| SNAP Sector | CO | COV | NOx | PM10 | ||||
|---|---|---|---|---|---|---|---|---|
| (t) | % | (t) | % | (t) | % | (t) | % | |
| Combustion in energy and transformation industries | 2.3 | 0.01% | 3 | 0.02% | 250.9 | 1.72% | 4.1 | 0.16% |
| Nonindustrial combustion plants | 1092.5 | 3.54% | 104.3 | 0.54% | 482.8 | 3.31% | 280.3 | 10.89% |
| Combustion in manufacturing industries | 1260.4 | 4.09% | 164.2 | 0.86% | 2984.2 | 20.47% | 202.7 | 7.88% |
| Roduction processes | 478.5 | 1.55% | 818.5 | 4.26% | 508.2 | 3.49% | 383 | 14.88% |
| Extraction and distribution of fossil fuels/geothermal energy | 0 | 0.00% | 275.1 | 1.43% | 0 | 0.00% | 0 | 0.00% |
| Solvent and other product use | 0 | 0.00% | 7780 | 40.53% | 0.6 | 0.00% | 0.7 | 0.03% |
| Road transport | 25,714.1 | 83.41% | 7846.5 | 40.87% | 4054.5 | 27.81% | 1006.3 | 39.10% |
| Other mobile sources and machinery | 2109 | 6.84% | 975.9 | 5.08% | 6292.6 | 43.16% | 677.2 | 26.31% |
| Waste treatment and disposal | 47.9 | 0.16% | 432.2 | 2.25% | 5.7 | 0.04% | 9.9 | 0.38% |
| Agriculture | 45.1 | 0.15% | 698.7 | 3.64% | 0.8 | 0.01% | 4.7 | 0.18% |
| Other sources | 78 | 0.25% | 98.5 | 0.51% | 0 | 0.00% | 4.6 | 0.18% |
| Total | 30,827.8 | 100% | 19,196.8 | 100% | 14,580.4 | 100% | 2573.5 | 100% |
| SNAP Sector | As | Cd | Cr | Cu | Hg | Ni | Pb | |||||||
|---|---|---|---|---|---|---|---|---|---|---|---|---|---|---|
| (kg) | % | (kg) | % | (kg) | % | (kg) | % | (kg) | % | (kg) | % | (kg) | % | |
| Combustion in energy and transformation industries | 0.1 | 0.05% | 0.1 | 0.09% | 0 | 0.00% | 0.1 | 0.01% | 0 | 0.00% | 0.1 | 0.01% | 0.5 | 0.02% |
| Nonindustrial combustion plants | 5.6 | 2.52% | 7.2 | 6.28% | 14.1 | 4.01% | 7.2 | 0.68% | 2.3 | 2.06% | 197 | 20.30% | 8.2 | 0.36% |
| Combustion in manufacturing industries | 215 | 97.07% | 101 | 87.78% | 201 | 57.15% | 45.9 | 4.34% | 109 | 97.40% | 572 | 58.99% | 1882 | 81.71% |
| Production processes | 0 | 0.00% | 0 | 0.00% | 107 | 30.32% | 2 | 0.19% | 0 | 0.00% | 158 | 16.31% | 7 | 0.30% |
| Extract. and distrib. of fossil fuels/geothermal energy | 0 | 0.00% | 0 | 0.00% | 0 | 0.00% | 0 | 0.00% | 0 | 0.00% | 0 | 0.00% | 0 | 0.00% |
| Solvent and other product use | 0 | 0.00% | 0 | 0.00% | 0 | 0.00% | 0 | 0.00% | 0 | 0.00% | 0 | 0.00% | 0 | 0.00% |
| Road transport | 0 | 0.00% | 4.7 | 4.10% | 23.7 | 6.73% | 806 | 76.24% | 0 | 0.00% | 33.1 | 3.41% | 380.2 | 16.51% |
| Other mobile sources and machinery | 0.6 | 0.27% | 1.8 | 1.57% | 6 | 1.71% | 195 | 18.47% | 0 | 0.00% | 8.6 | 0.89% | 19.6 | 0.85% |
| Waste treatment and disposal | 0.1 | 0.05% | 0.2 | 0.17% | 0.3 | 0.09% | 0.8 | 0.08% | 0.6 | 0.54% | 0.8 | 0.08% | 5.7 | 0.25% |
| Agriculture | 0 | 0.00% | 0 | 0.00% | 0 | 0.00% | 0 | 0.00% | 0 | 0.00% | 0 | 0.00% | 0 | 0.00% |
| Other sources | 0 | 0.00% | 0 | 0.00% | 0 | 0.00% | 0 | 0.00% | 0 | 0.00% | 0 | 0.00% | 0 | 0.00% |
| Total | 222 | 100% | 115 | 100% | 352 | 100% | 1057 | 100% | 112 | 100% | 969 | 100% | 2303 | 100% |
| Smin | AWindex | NW | |
|---|---|---|---|
| Smin | 1 | 0.5 | |
| AWindex | 1 | 1 | 0.5 |
| SnB | BeB | TlB | VB | NW | |
|---|---|---|---|---|---|
| SnB | 1 | 0.10 | |||
| BeB | 3 | 1 | 030 | ||
| TlB | 3 | 1 | 1 | 0.30 | |
| VB | 3 | 1 | 1 | 1 | 0.30 |
| Er | LC | Rad | PAd | Rd | Ad | NW | |
|---|---|---|---|---|---|---|---|
| Er | 1 | 0.062 | |||||
| LC | 3 | 1 | 0.187 | ||||
| Rad | 3 | 1 | 1 | 0.187 | |||
| PAD | 3 | 1 | 1 | 1 | 0.187 | ||
| RD | 3 | 1 | 1 | 1 | 1 | 0.187 | |
| AD | 3 | 1 | 1 | 1 | 1 | 1 | 0.187 |
| ECW | ECS | ECT | NW | |
|---|---|---|---|---|
| ECW | 1 | 0.33 | ||
| ECS | 1 | 1 | 0.33 | |
| ECT | 1 | 1 | 1 | 0.33 |
| Environmental Quality Standards (EQS) | Suitability Value (0–1) | |
|---|---|---|
| 1 | Areas with natural or anthropic constraints | 0.00–0.01 |
| 2 | Areas with very low EQS | 0.01–0.58 |
| 3 | Areas with low EQS | 0.58–0.64 |
| 4 | Areas with medium EQS | 0.64–0.69 |
| 5 | Areas with high EQS | 0.69–0.74 |
| 6 | Areas with very high EQS | 0.74–0.76 |
© 2017 by the authors. Licensee MDPI, Basel, Switzerland. This article is an open access article distributed under the terms and conditions of the Creative Commons Attribution (CC BY) license (http://creativecommons.org/licenses/by/4.0/).
Share and Cite
Ducci, D.; Albanese, S.; Boccia, L.; Celentano, E.; Cervelli, E.; Corniello, A.; Crispo, A.; De Vivo, B.; Iodice, P.; Langella, C.; et al. An Integrated Approach for the Environmental Characterization of a Wide Potentially Contaminated Area in Southern Italy. Int. J. Environ. Res. Public Health 2017, 14, 693. https://doi.org/10.3390/ijerph14070693
Ducci D, Albanese S, Boccia L, Celentano E, Cervelli E, Corniello A, Crispo A, De Vivo B, Iodice P, Langella C, et al. An Integrated Approach for the Environmental Characterization of a Wide Potentially Contaminated Area in Southern Italy. International Journal of Environmental Research and Public Health. 2017; 14(7):693. https://doi.org/10.3390/ijerph14070693
Chicago/Turabian StyleDucci, Daniela, Stefano Albanese, Lorenzo Boccia, Egidio Celentano, Elena Cervelli, Alfonso Corniello, Anna Crispo, Benedetto De Vivo, Paolo Iodice, Carmela Langella, and et al. 2017. "An Integrated Approach for the Environmental Characterization of a Wide Potentially Contaminated Area in Southern Italy" International Journal of Environmental Research and Public Health 14, no. 7: 693. https://doi.org/10.3390/ijerph14070693
APA StyleDucci, D., Albanese, S., Boccia, L., Celentano, E., Cervelli, E., Corniello, A., Crispo, A., De Vivo, B., Iodice, P., Langella, C., Lima, A., Manno, M., Palladino, M., Pindozzi, S., Rigillo, M., Romano, N., Sellerino, M., Senatore, A., Speranza, G., ... Fagnano, M. (2017). An Integrated Approach for the Environmental Characterization of a Wide Potentially Contaminated Area in Southern Italy. International Journal of Environmental Research and Public Health, 14(7), 693. https://doi.org/10.3390/ijerph14070693