Sustainable Use of Pesticide Applications in Citrus: A Support Tool for Volume Rate Adjustment


Abstract
:1. Introduction
2. CitrusVol
2.1. Fundamentals
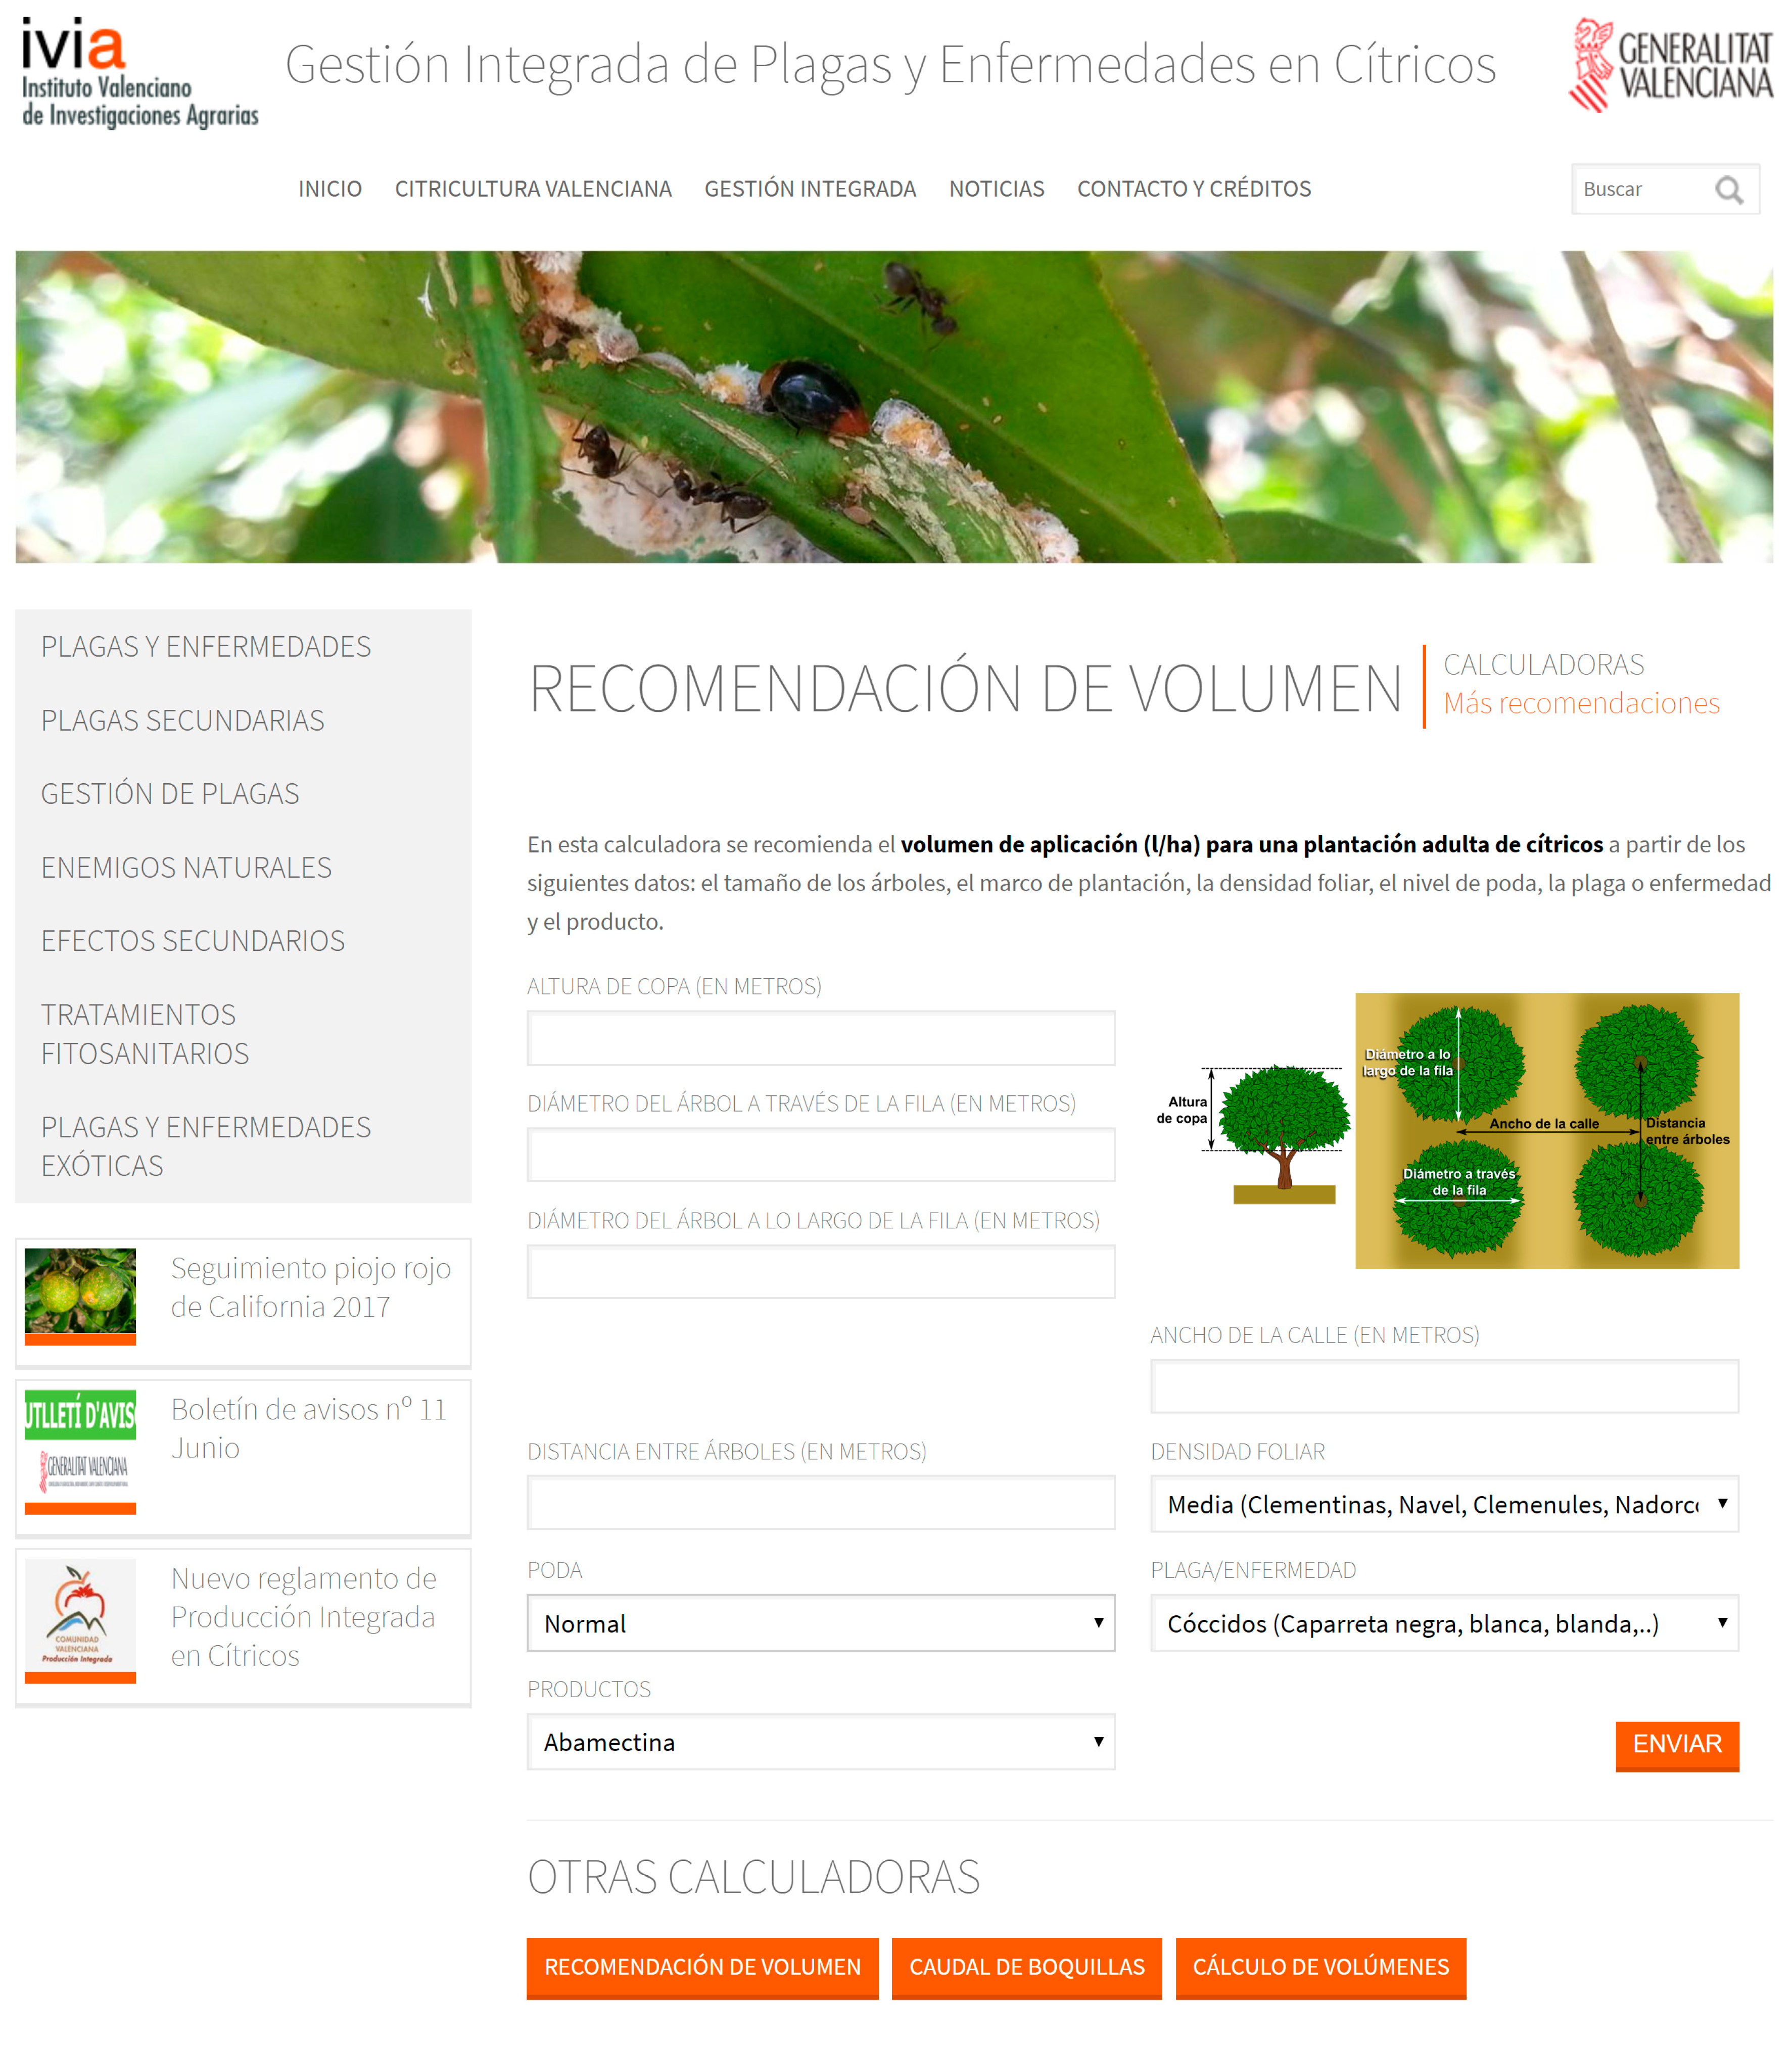
2.2. User Interface
- -
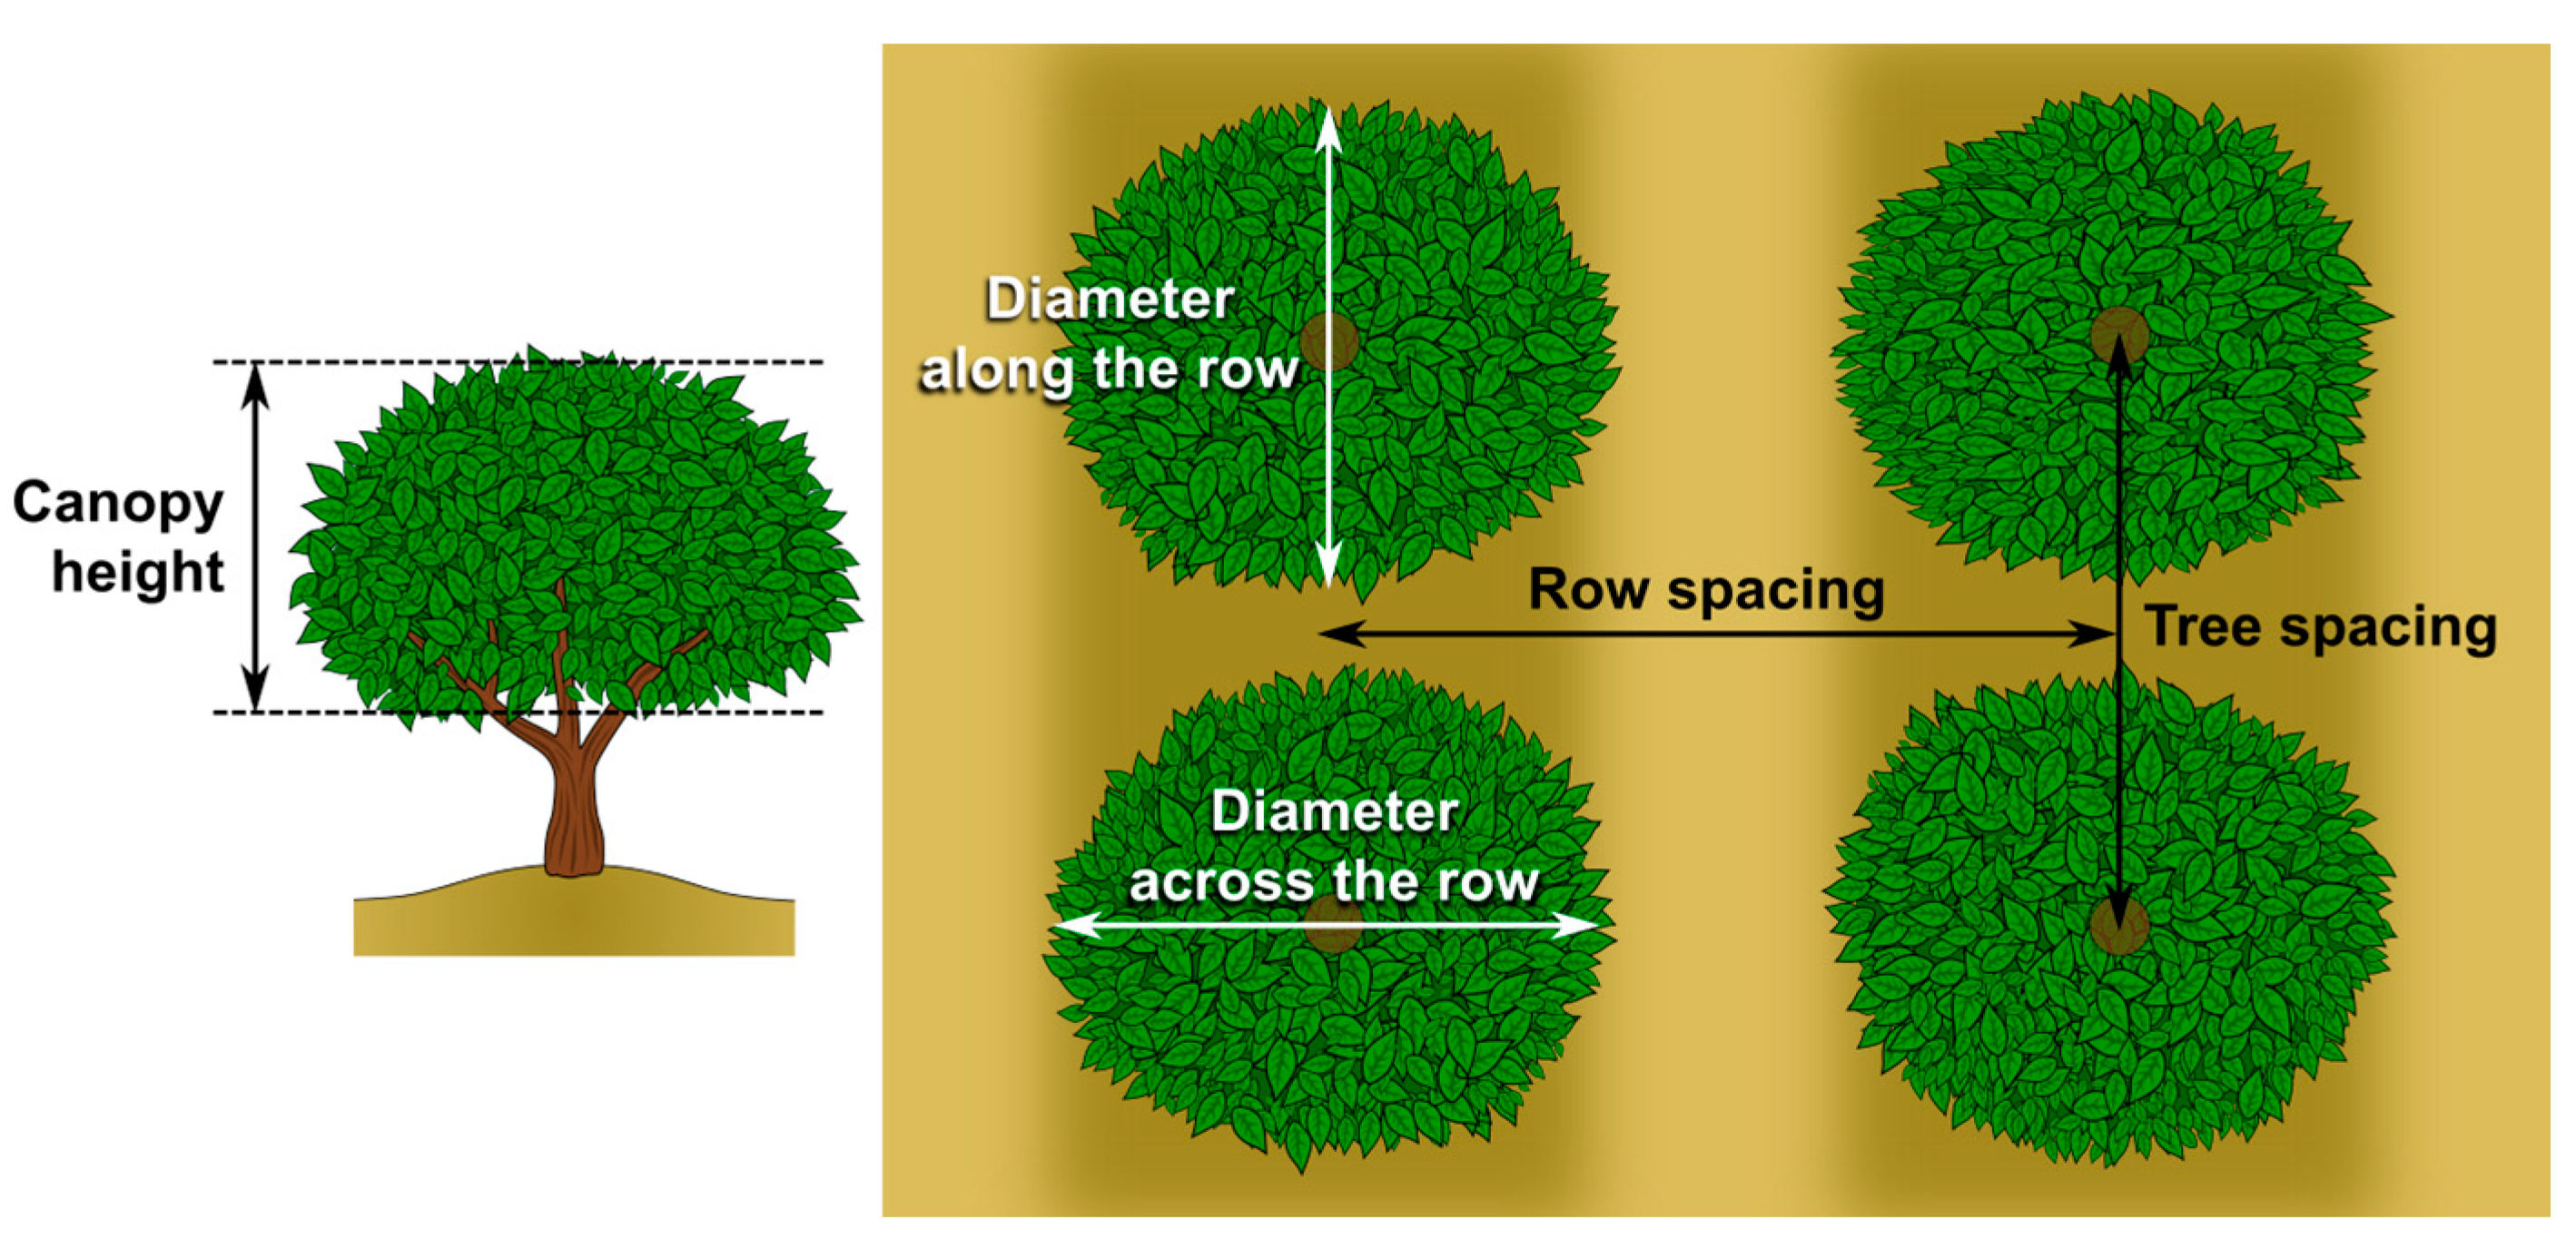
- Canopy characteristics:
- h (m) is the average canopy height
- Øacross the row (m) is the average diameter of the trees measured perpendicularly to the row
- Øalong the row (m) is the average diameter of the trees measured in parallel to the row
- Cultivar, selection from a drop-down menu based on Table 2
- Pruning level, selection from a drop-down menu based on Table 2
- -
- Orchard characteristics (framework)
- sptree (m) is the distance between tree trunks in a row (tree spacing)
- sprow (m) is the distance between tree trunks across a row (row spacing)
- -
- Application specifications
- Target, selection from a drop-down menu based on Table 1
- Product, selection from a drop-down menu with all the registered products for citrus
3. Field Evaluation of the Tool to Determine the Volume Rate for Spraying Citrus
4. Conclusions
Acknowledgments
Author Contributions
Conflicts of Interest
References
- European Union. Regulation (EC) No 1107/2009 of the European Parliament and of the Council of 21 October 2009, Concerning the Placing of Plant Protection Products on the Market and Repealing Council Directives 79/117/EEC and 91/414/EEC; Official Journal European Union: Luxembourg City, Luxembourg, 2009; pp. 1–50. [Google Scholar]
- Mironet, V. Compilation Questionnaires “Dose expression” Southern zone: France, Spain, Portugal, Greece, Italy and Croatia. Available online: http://archives.eppo.int/MEETINGS/2016_conferences/dose_expression/06_Mironet.pdf (accessed on 26 May 2017).
- Byers, R.E.; Hogmire, H.W.; Ferree, D.C.; Hall, F.R.; Donahue, S.J. Spray chemical deposits in high-density and trellis apple orchards. HortScience 1989, 24, 918–920. [Google Scholar]
- Hall, F.R. Influence of canopy geometry in spray deposition and IPM. HortScience 1991, 26, 1012–1017. [Google Scholar]
- Garcerá, C. Racionalización de las Aplicaciones de Productos Fitosanitarios Para el Control de Aonidiella. aurantii Maskell (Hemiptera: Diaspididae) en Cítricos. Ph.D. Thesis, Universitat Politècnica de València, València, Spain, July 2013. [Google Scholar]
- Garcerá, C.; Moltó, E.; Chueca, P. Factors influencing the efficacy of two organophosphate insecticides in controlling California red scale, Aonidiella. aurantii (Maskell). A basis for reducing spray application volume in Mediterranean conditions. Pest Manag. Sci. 2014, 70, 28–38. [Google Scholar] [CrossRef] [PubMed]
- Byers, R.E.; Hickey, K.D.; Hill, C.H. Base gallonage per acre. Virginia. Fruit 1971, 60, 19–23. [Google Scholar]
- Herrera-Aguirre, E.; Unrath, C.R. Chemical thinning response of “Delicious” apples to volume of applied water. HortScience 1980, 15, 43–44. [Google Scholar]
- Sutton, T.B.; Unrath, C.R. Evaluation of the tree-row-volume concept with density adjustments in relation to spray deposits in Apple orchards. Plant Dis. 1984, 68, 480–484. [Google Scholar] [CrossRef]
- Sutton, T.B.; Unrath, C.R. Evaluation of the tree-row-volume model for full-season pesticide application on apples. Plant. Disease 1988, 72, 629–632. [Google Scholar] [CrossRef]
- Byers, R.E. Tree-row-volume spraying rate calculator for apples. HortScience 1987, 22, 506–507. [Google Scholar]
- Unrath, C.R. Spray volume, canopy density, and other factors involved in thinner efficacy. HortScience 2002, 37, 481–483. [Google Scholar]
- Miller, P.; Mayer, R. Applying “vine row volume” (plant row volume or PRV) principles to rate selection and spray machinery operations. In Proceedings of the Australian Society of Viticulture and Oenology Seminar: Canopy Management; Mildura Arts Centre: Victoria, Australia, 1994; pp. 30–32. [Google Scholar]
- Manktelow, D.W.L.; Praat, J.P. The tree-row-volume spraying system and its potential use in New Zealand. In Proceedings of the 50th New Zealand Plant Protection Conference, Lincoln University, Lincoln, New Zealand, 18–21 August 1997; pp. 119–124. [Google Scholar]
- Gil, E.; Escolà, A.; Rosell, J.R.; Planas, S.; Val, L. Variable rate application of plant protection products in vineyard using ultrasonic sensors. Crop Prot. 2007, 26, 1287–1297. [Google Scholar] [CrossRef]
- Llorens, J.; Gil, E.; Llop, J.; Escolà, A. Variable rate dosing in precise viticulture: Use of electronic devices to improve application efficiency. Crop Prot. 2010, 29, 239–248. [Google Scholar] [CrossRef]
- Furness, G.; Magarey, P.A.; Miller, P.H.; Drew, H.J. Fruit tree and vine sprayer calibration based on canopy size and length of row: Unit canopy row method. Crop Prot. 1998, 17, 639–644. [Google Scholar] [CrossRef]
- Barani, A.; Franchi, A.; Bugiani, R.; Montermini, A. Efficacy of Unit Canopy Row Spraying System for Control of European Vine Moth (Lobesia botrana) in Vineyards. Available online: http://www.cigrjournal.org/index.php/Ejounral/article/viewFile/1244/1102 (accessed on 26 May 2017).
- Furness, G.; Thompson, A. Using Point of First Run-Off and Spray Volume in Litres per 100 Metres per Metre of Canopy Height for Setting Pesticide Dose. Available online: http://www.cigrjournal.org/index.php/Ejounral/article/viewFile/1247/1105 (accessed on 26 May 2017).
- Grout, T.G. Spray volumes and coverage requirements for citrus in southern Africa. Citrus J. 1997, 6, 19–20. [Google Scholar]
- Martin, J.; Siebers, J.; Laermann, H.T.; Heinrich-Siebers, E. Studies on the distribution of spray deposits in the crown of apple trees of different crown volume as a contribution to the harmonisation of dosage of plant protection products. Nachrichtenbl. Deut. Z. Obst Weinbau 1998, 135, 1–12. (In German) [Google Scholar]
- Frießleben, R.; Roßlenbroich, H.J.; Elbert, A. Dose expression in plant protection product field testing in high crops: Needs for harmonization. Pflanzenschutz Nachr. Bayer 2007, 60, 75–86. [Google Scholar]
- Pergher, G.; Petris, R. Pesticide Dose Adjustment in Vineyard Spraying and Potential for Dose Reduction. Available online: http://www.cigrjournal.org/index.php/Ejounral/article/download/1254/1111 (accessed on 26 May 2017).
- Hucorne, P. The Implementation of the Dose Expression per Hectare Leaf Wall Area in Vertical Crops in Belgium. Available online: http://archives.eppo.int/MEETINGS/2016_conferences/dose_expression/10_Hucorne.pdf (accessed on 26 May 2017).
- Koch, H. Application rate and spray deposit on targets in plant protection. In Proceedings of the Second International Symposium on Pesticides Application, British Crop Protection Council, Strasbourg, France; 22–24 September 1993; pp. 175–182. [Google Scholar]
- Koch, H. How to achieve conformity with the dose expression and sprayer function in high crops. Pflanzenschutz Nachr. Bayer 2007, 60, 71–84. [Google Scholar]
- Weisser, P.; Koch, H. Expression of dose rate with respect to orchard sprayer function. Aspects Appl. Biol. 2002, 66, 353–358. [Google Scholar]
- Wohlhauser, R. Dose rate expression in tree fruits—The need for harmonization approach from a chemical producer industry perspective. In Proceedings of the Tree Fruit Dose Adjustment Discussion Group Meeting, Wageningen, The Netherlands, 29 September 2009. [Google Scholar]
- Wohlhauser, R. Dose Rate Expression in Tree Fruits—The need for a harmonized approach from an industry perspective. An Industry Proposal of BASF, Bayer CS, Dow AS, DuPont AS, Makhteshim Agan and Syngenta. In Proceedings of the Meeting of Agricultural Field Trials working group of The German Region of the International Biometric Society (IBS-DR), Dummerstorf, Germany, 28 June 2012. [Google Scholar]
- Drew, H.J. Pesticide rates in Queensland Orchards: Changing spray practices and the implications. Challenges for Horticulture in the Tropics. In Proceedings of the third Australian Society of Horticultural Science and the First Australian Macadamia Society Research Conference, Broadbeach, Australia, 18–22 August 1996. [Google Scholar]
- Walklate, P.J.; Cross, J.V.; Richardson, G.M.; Baker, D.E. Optimising the adjustment of label-recommended dose rate for orchard spraying. Crop Prot. 2006, 25, 1080–1086. [Google Scholar] [CrossRef]
- Planas, S.; Camp, F.; Escolà, A.; Solanelles, F.; Sanz, R.; Rosell-Polo, J.R. Advances in pesticide dose adjustment in tree crops. In Proceedings of the 9th European conference on Precision Agriculture, Lleida, Caralonia, Spain, 7–11 July 2013. [Google Scholar]
- SARDI/PIRSA (South Australian Research and Development Institute/Primary Industries and Resources S.A.). Distance Based Calibration Using the Spray Volume Calculator. Available online: http://research.wineaustralia.com/wp-content/uploads/2012/09/FS-Spray-Volume-Calculator1.pdf (accessed on 26 May 2017).
- Walklate, P.J.; Cross, J.V. Orchard Spraying: Opportunities to Reduce Rates. Available online: http://www.hse.gov.uk/pesticides/resources/H/HDC_Factsheet_20-05_Tree_Fruit.pdf (accessed on 26 May 2017).
- Walklate, P.J.; Cross, J.V.; Pergher, G. Support system for efficient dosage of orchard and vineyard spraying products. Comput. Electron. Agric. 2011, 75, 355–362. [Google Scholar] [CrossRef]
- Gil, E.; Escolà, A. Design of a decision support method to determine volume rate for vineyard spraying. Appl. Eng. Agric. 2009, 25, 145–155. [Google Scholar] [CrossRef]
- Dosacitric es una Aplicación Para la Determinación del Volumen de Aplicación Necesario en los Tratamientos Fitosanitarios Realizados en Cítricos. Available online: http://dosacitric.webs.upv.es/index.htm (accessed on 26 May 2017).
- Sánchez-Hermosilla, J.; Páez, F.; Rincón, V.J.; Pérez-Alonso, J. Volume application rate adapted to the canopy size in greenhouse tomato crops. Scientia. Agricola. 2013, 70, 390–396. [Google Scholar] [CrossRef]
- Garcerá, C.; Moltó, E.; Chueca, P. Effect of spray volume of two organophosphate pesticides on coverage and mortality of Aonidiella. aurantii Maskell. Crop. Prot. 2011, 30, 693–697. [Google Scholar] [CrossRef]
- Garcerá, C.; Moltó, E.; Zarzo, M.; Chueca, P. Modelling the spray deposition and efficacy of two mineral oil-based products for the control of California red scale, Aonidiella. aurantii (Maskell). Crop. Prot. 2012, 31, 78–84. [Google Scholar] [CrossRef]
- Tena, A.; Garcia-Marí, F. Current situation of citrus pests and diseases in the Mediterranean basin. IOBC Bull. 2011, 62, 365–368. [Google Scholar]
- Yang, X.B.; Zhang, Y.M.; Hua, L.; Liu, T.X. Life history and life tables of Bactericera. cockerelli (Hemiptera: Psyllidae) on potato under laboratory and field conditions in the lower Rio Grande Valley of Texas. J. Econ. Entomol. 2010, 103, 1729–1734. [Google Scholar] [CrossRef] [PubMed]
- Yang, X.B.; Zhang, Y.M.; Henne, D.C.; Liu, T.X. Life tables of Bactericera. cockerelli (Hemiptera: Triozidae) on tomato under laboratory and field conditions in Southern Texas. Fla Entomol. 2013, 96, 904–913. [Google Scholar] [CrossRef]
- Hosseini-Tabesh, B.; Sahragard, A.; Karimi-Malati, A. A laboratory and field condition comparison of life table parameters of Aphis gossypii Glover (Hemiptera: Aphididae). J. Plant. Prot. Res. 2015, 55, 1–7. [Google Scholar] [CrossRef]
- Garcerá, C.; Moltó, E.; Chueca, P. Spray pesticide applications in Mediterranean citrus orchards: Canopy deposition and off-target losses. Sci. Total Environ. 2017, 599–600, 1344–1362. [Google Scholar] [CrossRef] [PubMed]
- Holloway, P.J.; Butler Ellis, M.C.; Webb, D.A.; Western, N.M.; Tuck, C.R.; Hayes, A.L.; Miller, P.C.H. Effects of some agricultural tank-mix adjuvants on the deposition efficiency of aqueous sprays on foliage. Crop. Prot. 2000, 19, 27–37. [Google Scholar] [CrossRef]
- Van Zyl, S.; Brink, J.C.; Calitz, F.J.; Coertze, S.; Fourie, P.H. The use of adjuvants to improve spray deposition and Botrytis cinerea control on Chardonnay grapevine leaves. Crop. Prot. 2010, 29, 58–67. [Google Scholar] [CrossRef]
- Rosell, J.R.; Sanz, R. A review of methods and applications of the geometric characterization of tree crops in agricultural activities. Comput. Electron. Agric. 2012, 81, 124–141. [Google Scholar] [CrossRef]
- Moltó, E.; Chueca, P.; Garcerá, C. Tratamientos fitosanitarios. Gestión Integrada de Plagas de Cítricos. Urbaneja, A., Catalán, J., Tena, A., Jacas, J.A., Eds.; 2017. Available online: http://gipcitricos.ivia.es/recomendacion-de-volumen (accessed on 26 May 2017).
- Moltó, E.; Chueca, P.; Garcerá, C. Tratamientos fitosanitarios. Recomendaciones. Calcular volumen de aplicación y ajustar equipo. Recomendación de volumen. IVIA Instituto Valenciano Investigaciones Agrarias App (Version 1.3), Urbaneja, A., Catalán, J., Tena, A., Jacas, J.A., Eds.; IVIA: Valencia, Spain, 2017; retrieved from App Store for iOS devices, and Gipcitricos IVIA App (Version 1.3) 2017, retrieved from Play Store for Android devices. [Google Scholar]
- Da Silva Scapin, M.; Behlau, F.; Mariano Scandelai, L.H.; Saraiva Fernandes, R.; Silva, G.J., Jr.; Ramos, H.H. Tree-row-volume-based sprays of copper bactericide for control of citrus canker. Crop. Prot. 2015, 77, 119–126. [Google Scholar] [CrossRef]


| Application | Target | ftarget | |
|---|---|---|---|
| Internal | Pests |
| 1 |
| Diseases |
| ||
| Intermediate | Pests |
| 0.75 |
| Diseases |
| ||
| External | Pest |
| 0.49 |
| Cultivar | Examples Included in the Tool | Pruning Level | ||
|---|---|---|---|---|
| Severe | Normal | Without Pruning | ||
| Low density | Satsuma group (Owari, Okitsu) Lemon spp. (lemon cv. ‘Fino’) | 2.5 | 2.9 | 3.3 |
| Medium density | Clementine group (Clemenules, Marisol, Oronules, Nadorcott), Hybrid group (Nova, Orri) Navel group (Washington, Lane late) | 3.3 | 3.7 | 4.1 |
| High density | Hybrid group (Fortune, Garbí, Moncada) | 4.1 | 4.6 | 5 |
| Orchard | Cultivar | Location Geografic Coordinates | Tree Spacing (m) (sprow × sptree) | Canopy Dimensions (m) (Height × Øacross row × Øalong row) | Apparent Canopy Volume (VT1, m3/tree) |
|---|---|---|---|---|---|
| P1 | Clemenules | 39° 26′ 32.3″ N, 0° 33′ 23.1″ W | 6 × 3 | 2.51 × 4.33 × 3.08 | 17.53 |
| P2 | Oronules | 39° 26′ 42.9″ N, 0° 32′ 17.9″ W | 7 × 2 | 2.12 × 4.26 × 2.30 | 10.88 |
| P3 | Clemenules | 39° 39′ 11.1″ N, 0° 18′ 25.1″ W | 6.8 × 5 | 2.15 × 3.39 × 3.34 | 12.75 |
| P4 | Clemenules | 38° 56′ 46.3″ N, 0° 14′ 15.1″ W | 5.5 × 5 | 2.38 × 4.28 × 4.57 | 24.37 |
| P5 | Clemenules | 38° 56′ 55.9″ N, 0° 14′ 31.7″ W | 6 × 2 | 1.99 × 2.93 × 1.96 | 5.98 |
| P6 | Clemenules | 39° 43′ 42.6″ N, 0° 35′ 27.7″ W | 6.5 × 2.5 | 2.47 × 3.90 × 2.60 | 13.11 |
| P7 | Clemenules | 39° 43′ 57.8″ N, 0° 35′ 32.5″ W | 6.5 × 3.5 | 2.45 × 4.84 × 3.70 | 22.97 |
| Orchard | Application Date | Pest | Pressure (Bar) | Forward Speed (km/h) | Air Volume (m3/h) | Number of Open Nozzles | |
|---|---|---|---|---|---|---|---|
| Vc | Va | ||||||
| P1 | 27 May 2016 | CRS (first generation) | 8 | 1.32 | 55342.15 | 38 | 30 |
| 27 July 2016 | CRS (second generation) and TSM | 8 | 1.32 | 55342.15 | 38 | 30 | |
| 11 October 2016 | TSM | 8 | 1.32 | 55342.15 | 38 | 30 | |
| P2 | 26 May 2016 | CRS (first generation) | 8 | 1.32 | 55342.15 | 38 | 28 |
| 22 June 2016 | TSM | 8 | 1.73 | 55342.15 | 38 | 30 | |
| 09 August 2016 | CRS (second generation) and TSM | 8 | 1.32 | 55342.15 | 38 | 28 | |
| 09 September 2016 | TSM | 8 | 1.73 | 55342.15 | 38 | 30 | |
| P3 | 09 June 2016 | CRS (first generation) | 13 | 1.75 | 101248.29 | 26 | 18 |
| P4 | 31 May 2016 | CRS (first generation) | 9 | 1.92 | 54828.19 | 36 | 14 |
| P5 | 31 May 2016 | CRS (first generation) | 9 | 1.92 | 54828.19 | 34 | 18 |
| P6 | 16 June 2016 | CRS (first generation) | 8 | 1.53 | 89268.43 | 26 | 22 |
| 12 August 2016 | CRS (second generation) | 8 | 1.48 | 89268.43 | 26 | 22 | |
| P7 | 14 June 2016 | CRS (first generation) | 8 | 1.53 | 89268.43 | 26 | 26 |
| 11 August 2016 | CRS (second generation) | 8 | 1.48 | 89268.43 | 26 | 26 | |
| Orchard | Application Date | Pest | Active Ingredient of PPP | PPP Concentration (%) | Water Volume | PPP Savings (kg PPP/ha or L PPP/ha) | ||
|---|---|---|---|---|---|---|---|---|
| Vc (L/ha) | Va (L/ha) | Reduction (%) | ||||||
| P1 | 27 May 2016 | CRS (first generation) | Chlorpyrifos | 0.20 | 4905 | 3255 | 33.64 | 3.30 |
| Pyriproxyfen | 0.05 | 0.83 | ||||||
| Abamectin | 0.04 | `0.66 | ||||||
| Spirodiclofen | 0.02 | 0.33 | ||||||
| 27 July 2016 | CRS (second generation) and TSM | Abamectin | 0.10 | 4905 | 3255 | 33.64 | 1.65 | |
| Spirotetramat | 0.04 | 0.66 | ||||||
| Spirodiclofen | 0.02 | 0.33 | ||||||
| 11 October 2016 | TSM | Abamectin | 0.10 | 4905 | 3255 | 33.64 | 1.65 | |
| P2 | 26 May 2016 | CRS (first generation) | Chlorpyrifos | 0.20 | 4204 | 2800 | 33.39 | 2.81 |
| Etoxazole | 0.05 | 0.70 | ||||||
| Pyriproxyfen | 0.05 | 0.70 | ||||||
| Abamectin | 0.04 | 0.56 | ||||||
| 22 June 2016 | TSM | Abamectin | 0.10 | 3215 | 2476 | 22.98 | 0.74 | |
| Spirodiclofen | 0.02 | 0.15 | ||||||
| 09 August 2016 | CRS (second generation) and TSM | Abamectin | 0.10 | 4204 | 2800 | 33.39 | 1.40 | |
| Spirotetramat | 0.04 | 0.56 | ||||||
| Tetrazine | 0.02 | 0.28 | ||||||
| 09 September 2016 | TSM | Abamectin | 0.10 | 3215 | 2476 | 22.28 | 0.74 | |
| Spirodiclofen | 0.02 | 0.15 | ||||||
| P3 | 09 June 2016 | CRS (first generation) | Abamectin | 0.04 | 3264 | 2294 | 29.70 | 0.39 |
| Spirotetramat | 0.02 | 0.19 | ||||||
| Clofentezine | 0.01 | 0.10 | ||||||
| P4 | 31 May 2016 | CRS (first generation) | Spirotetramat | 0.04 | 7311 | 3011 | 58.82 | 1.72 |
| P5 | 31 May 2016 | CRS (first generation) | Chlorpyrifos | 0.20 | 6702 | 1737 | 74.08 | 9.93 |
| Pyriproxyfen | 0.08 | 3.97 | ||||||
| Spirodiclofen | 0.02 | 0.99 | ||||||
| P6 | 13 June 2016 | CRS (first generation) | Chlorpyrifos | 0.27 | 3200 | 2535 | 20.81 | 1.80 |
| Abamectin | 0.13 | 0.86 | ||||||
| Pyriproxyfen | 0.07 | 0.47 | ||||||
| Clofentezine | 0.02 | 0.13 | ||||||
| 12 August 2016 | CRS (second generation) | Spirotetramat | 0.04 | 3318 | 1628 | 20.81 | 0.68 | |
| P7 | 14 June 2016 | CRS (first generation) | Chlorpyrifos | 0.27 | 3468 | 3065 | 11.61 | 1.09 |
| Abamectin | 0.13 | 0.52 | ||||||
| Pyriproxyfen | 0.07 | 0.28 | ||||||
| Clofentezine | 0.02 | 0.08 | ||||||
| 11 August 2016 | CRS (second generation) | Spirotetramat | 0.04 | 3595 | 3177 | 11.61 | 0.17 | |
| Orchard | Application Date | Tank Capacity (L) | Number of Tanks/ha | Time Savings of Tank Refill (h/ha) | Time Savings of Tank Refill (h/10 ha) | Time Savings of Tank Refill (h/100 ha) | |
|---|---|---|---|---|---|---|---|
| Vc | Va | ||||||
| P1 | 27 May 2016 | 1500 | 4 | 3 | 0.67 | 7.33 | 73.33 |
| 27 July 2016 | 4 | 3 | 0.67 | 7.33 | 73.33 | ||
| 11 October 2016 | 4 | 3 | 0.67 | 7.33 | 73.33 | ||
| P2 | 26 May 2016 | 1500 | 3 | 2 | 0.67 | 6.67 | 62.66 |
| 22 June 2016 | 3 | 2 | 0.67 | 3.33 | 32.66 | ||
| 09 August 2016 | 3 | 2 | 0.67 | 6.67 | 62.66 | ||
| 09 September 2016 | 3 | 2 | 0.67 | 3.33 | 32.66 | ||
| P3 | 09 June 2016 | 2000 | 2 | 2 | 0 | 3.33 | 32.66 |
| P4 | 31 May 2016 | 2000 | 4 | 2 | 1.33 | 14 | 143.33 |
| P5 | 31 May 2016 | 2000 | 4 | 1 | 2 | 16.67 | 166 |
| P6 | 16 June 2016 | 3000 | 2 | 1 | 0.67 | 1.33 | 14.66 |
| 12 August 2016 | 2 | 1 | 0.67 | 4 | 37.33 | ||
| P7 | 14 June 2016 | 3000 | 2 | 2 | 0 | 0.67 | 8.66 |
| 11 August 2016 | 2 | 2 | 0 | 0.67 | 9.33 | ||
| Orchard | Two-Spotted Spider Mite | California Red Scale | ||
|---|---|---|---|---|
| Vc | Va | Vc | Va | |
| P1 | 0 | 0.25 (0.25) | 0 | 0 |
| P2 | 1.00 (0.58) | 0.75 (0.41) | 0.25 (0.25) | 1.00 (0.58) |
| P3 | - | - | 0 | 0.25 (0.25) |
| P4 | - | - | 3.50 (1.15) | 3.75 (1.30) |
| P5 | - | - | 0.25 (0.25) | 0 |
| P6 | - | - | 0 | 0 |
| P7 | - | - | 0 | 0 |
© 2017 by the authors. Licensee MDPI, Basel, Switzerland. This article is an open access article distributed under the terms and conditions of the Creative Commons Attribution (CC BY) license (http://creativecommons.org/licenses/by/4.0/).
Share and Cite
Garcerá, C.; Fonte, A.; Moltó, E.; Chueca, P. Sustainable Use of Pesticide Applications in Citrus: A Support Tool for Volume Rate Adjustment. Int. J. Environ. Res. Public Health 2017, 14, 715. https://doi.org/10.3390/ijerph14070715
Garcerá C, Fonte A, Moltó E, Chueca P. Sustainable Use of Pesticide Applications in Citrus: A Support Tool for Volume Rate Adjustment. International Journal of Environmental Research and Public Health. 2017; 14(7):715. https://doi.org/10.3390/ijerph14070715
Chicago/Turabian StyleGarcerá, Cruz, Alberto Fonte, Enrique Moltó, and Patricia Chueca. 2017. "Sustainable Use of Pesticide Applications in Citrus: A Support Tool for Volume Rate Adjustment" International Journal of Environmental Research and Public Health 14, no. 7: 715. https://doi.org/10.3390/ijerph14070715