Worldwide Regulations of Standard Values of Pesticides for Human Health Risk Control: A Review


Abstract
:1. Introduction
2. Materials
2.1. Pesticide
2.2. CAS No.
2.3. Sources for Worldwide Pesticide Soil RGVs and Drinking Water MCLs
2.4. Sources for Worldwide Pesticide Agricultural Commodity MRLs
2.5. Sources for Pesticide Residential Air MCLs
3. Methods
3.1. Statistical Analysis of Pesticide Standard Values
3.2. Human Health Risk Models
- TR—Target risk (1 × 10⁻⁶ unit less)
- AT—Averaging time (365 days/year)
- LT—Lifetime (70 years) (70, 75)
- EF—Exposure frequency (350 days/year) (143, 365)
- IFSadj—Resident soil ingestion rate (114 mg-year/kg-day) (87, 127)
- DFSadj—Resident soil dermal contact factor (360.8 mg-year/kg-day), (253, 1257)
- PEFw—Particulate emission factor (1.4 × 10⁹ m3/kg), (7.8 × 10⁷–6.6 × 10⁹)
- ED—Exposure duration (30 years)
- ET—Exposure time (24 h/day), (2, 24)
- The pesticide soil RGV (mg/kg) non-cancer risk equations were expressed as follows,
- THQ—Target hazard quotient (1.0 unit less)
- EDc—Exposure duration for child (6 year), (5, 7)
- HWc—Human weight for child (15 kg), (15, 17)
- IRS—Soil ingestion rate for child (200 mg/day), (100, 200)
- SAc—Soil surface area for child (2800 cm2), (1750, 2960)
- AFc—Soil adhesion factor for child (0.2 mg/cm2), (0.2, 1.0)
3.3. Pesticide Agricultural Commodity Implied Exposure Dose (IED)
3.4. Implied Maximum Dose Limit
4. Results and Discussion
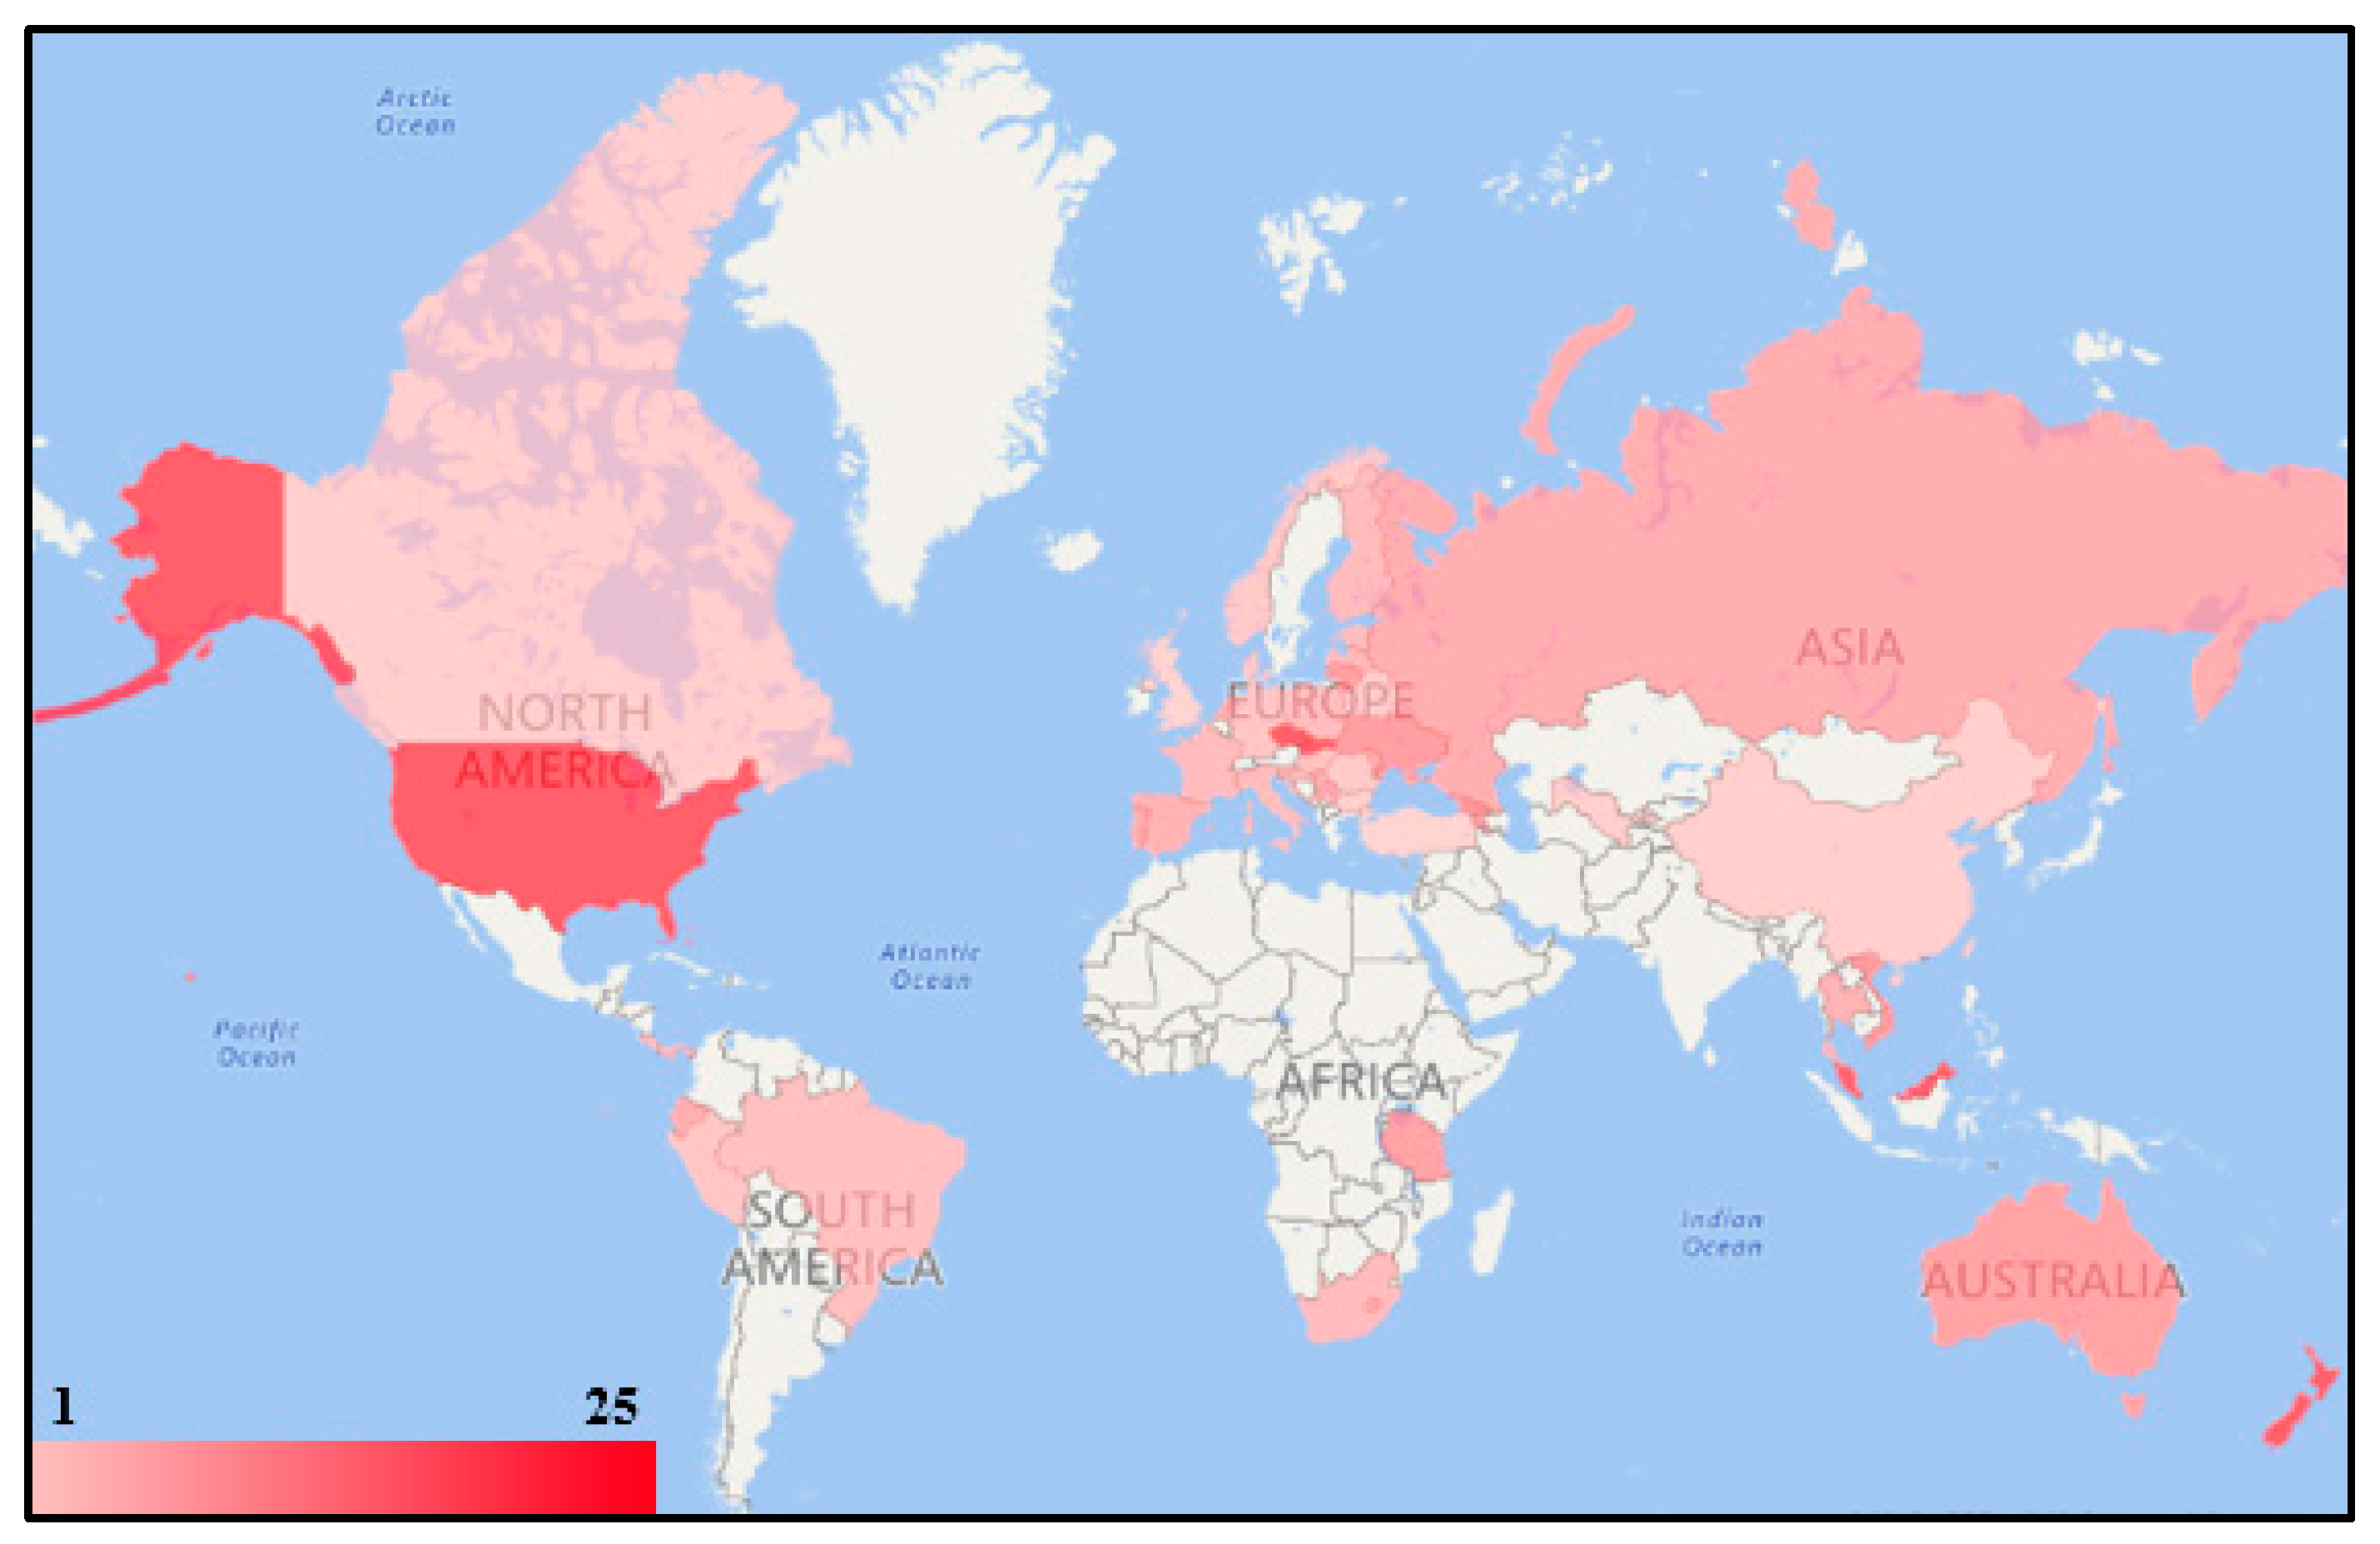
4.1. Numbers of RGVs and MCLs in Worldwide Jurisdictions
4.2. The Most Commonly Regulated Pesticides in Soil and Drinking Water
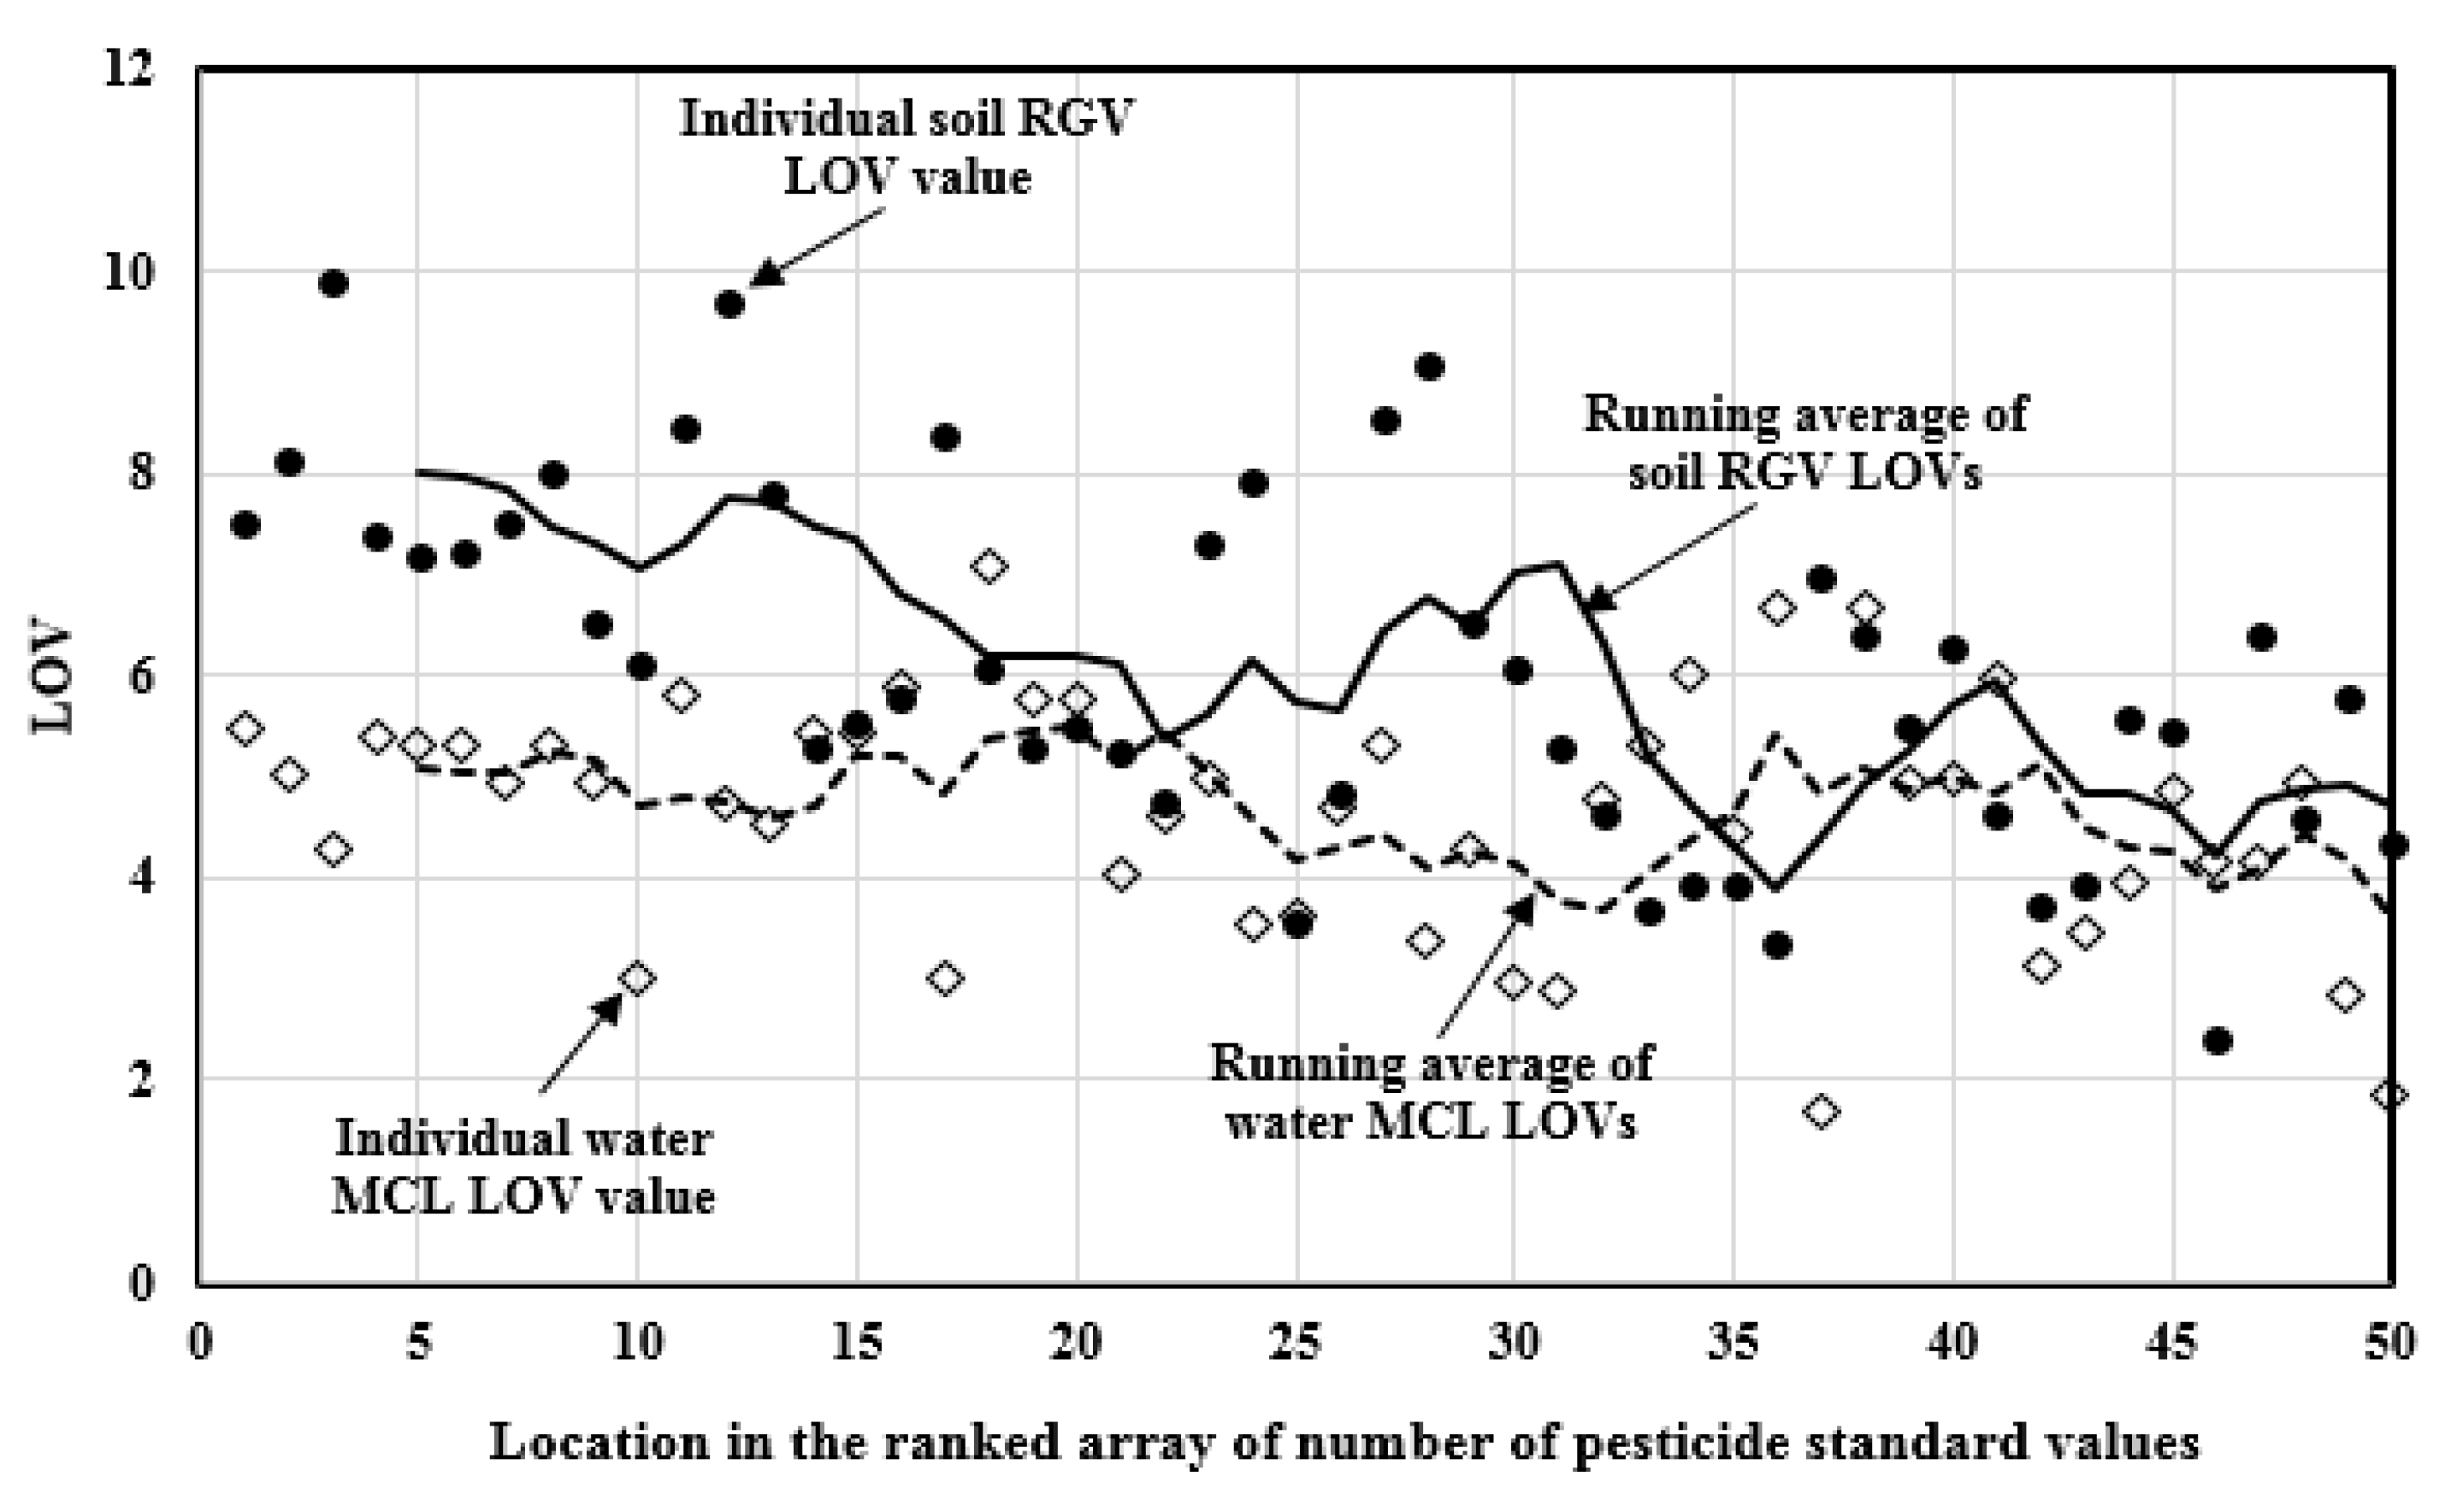
4.3. Analysis of Soil RGVs for the Commonly Regulated Pesticides
4.4. Analysis of Drinking Water MCLs for the Commonly Regulated Pesticides
4.5. Analysis of the IEDs for the Widely Used Pesticides in Agricultural Commodities
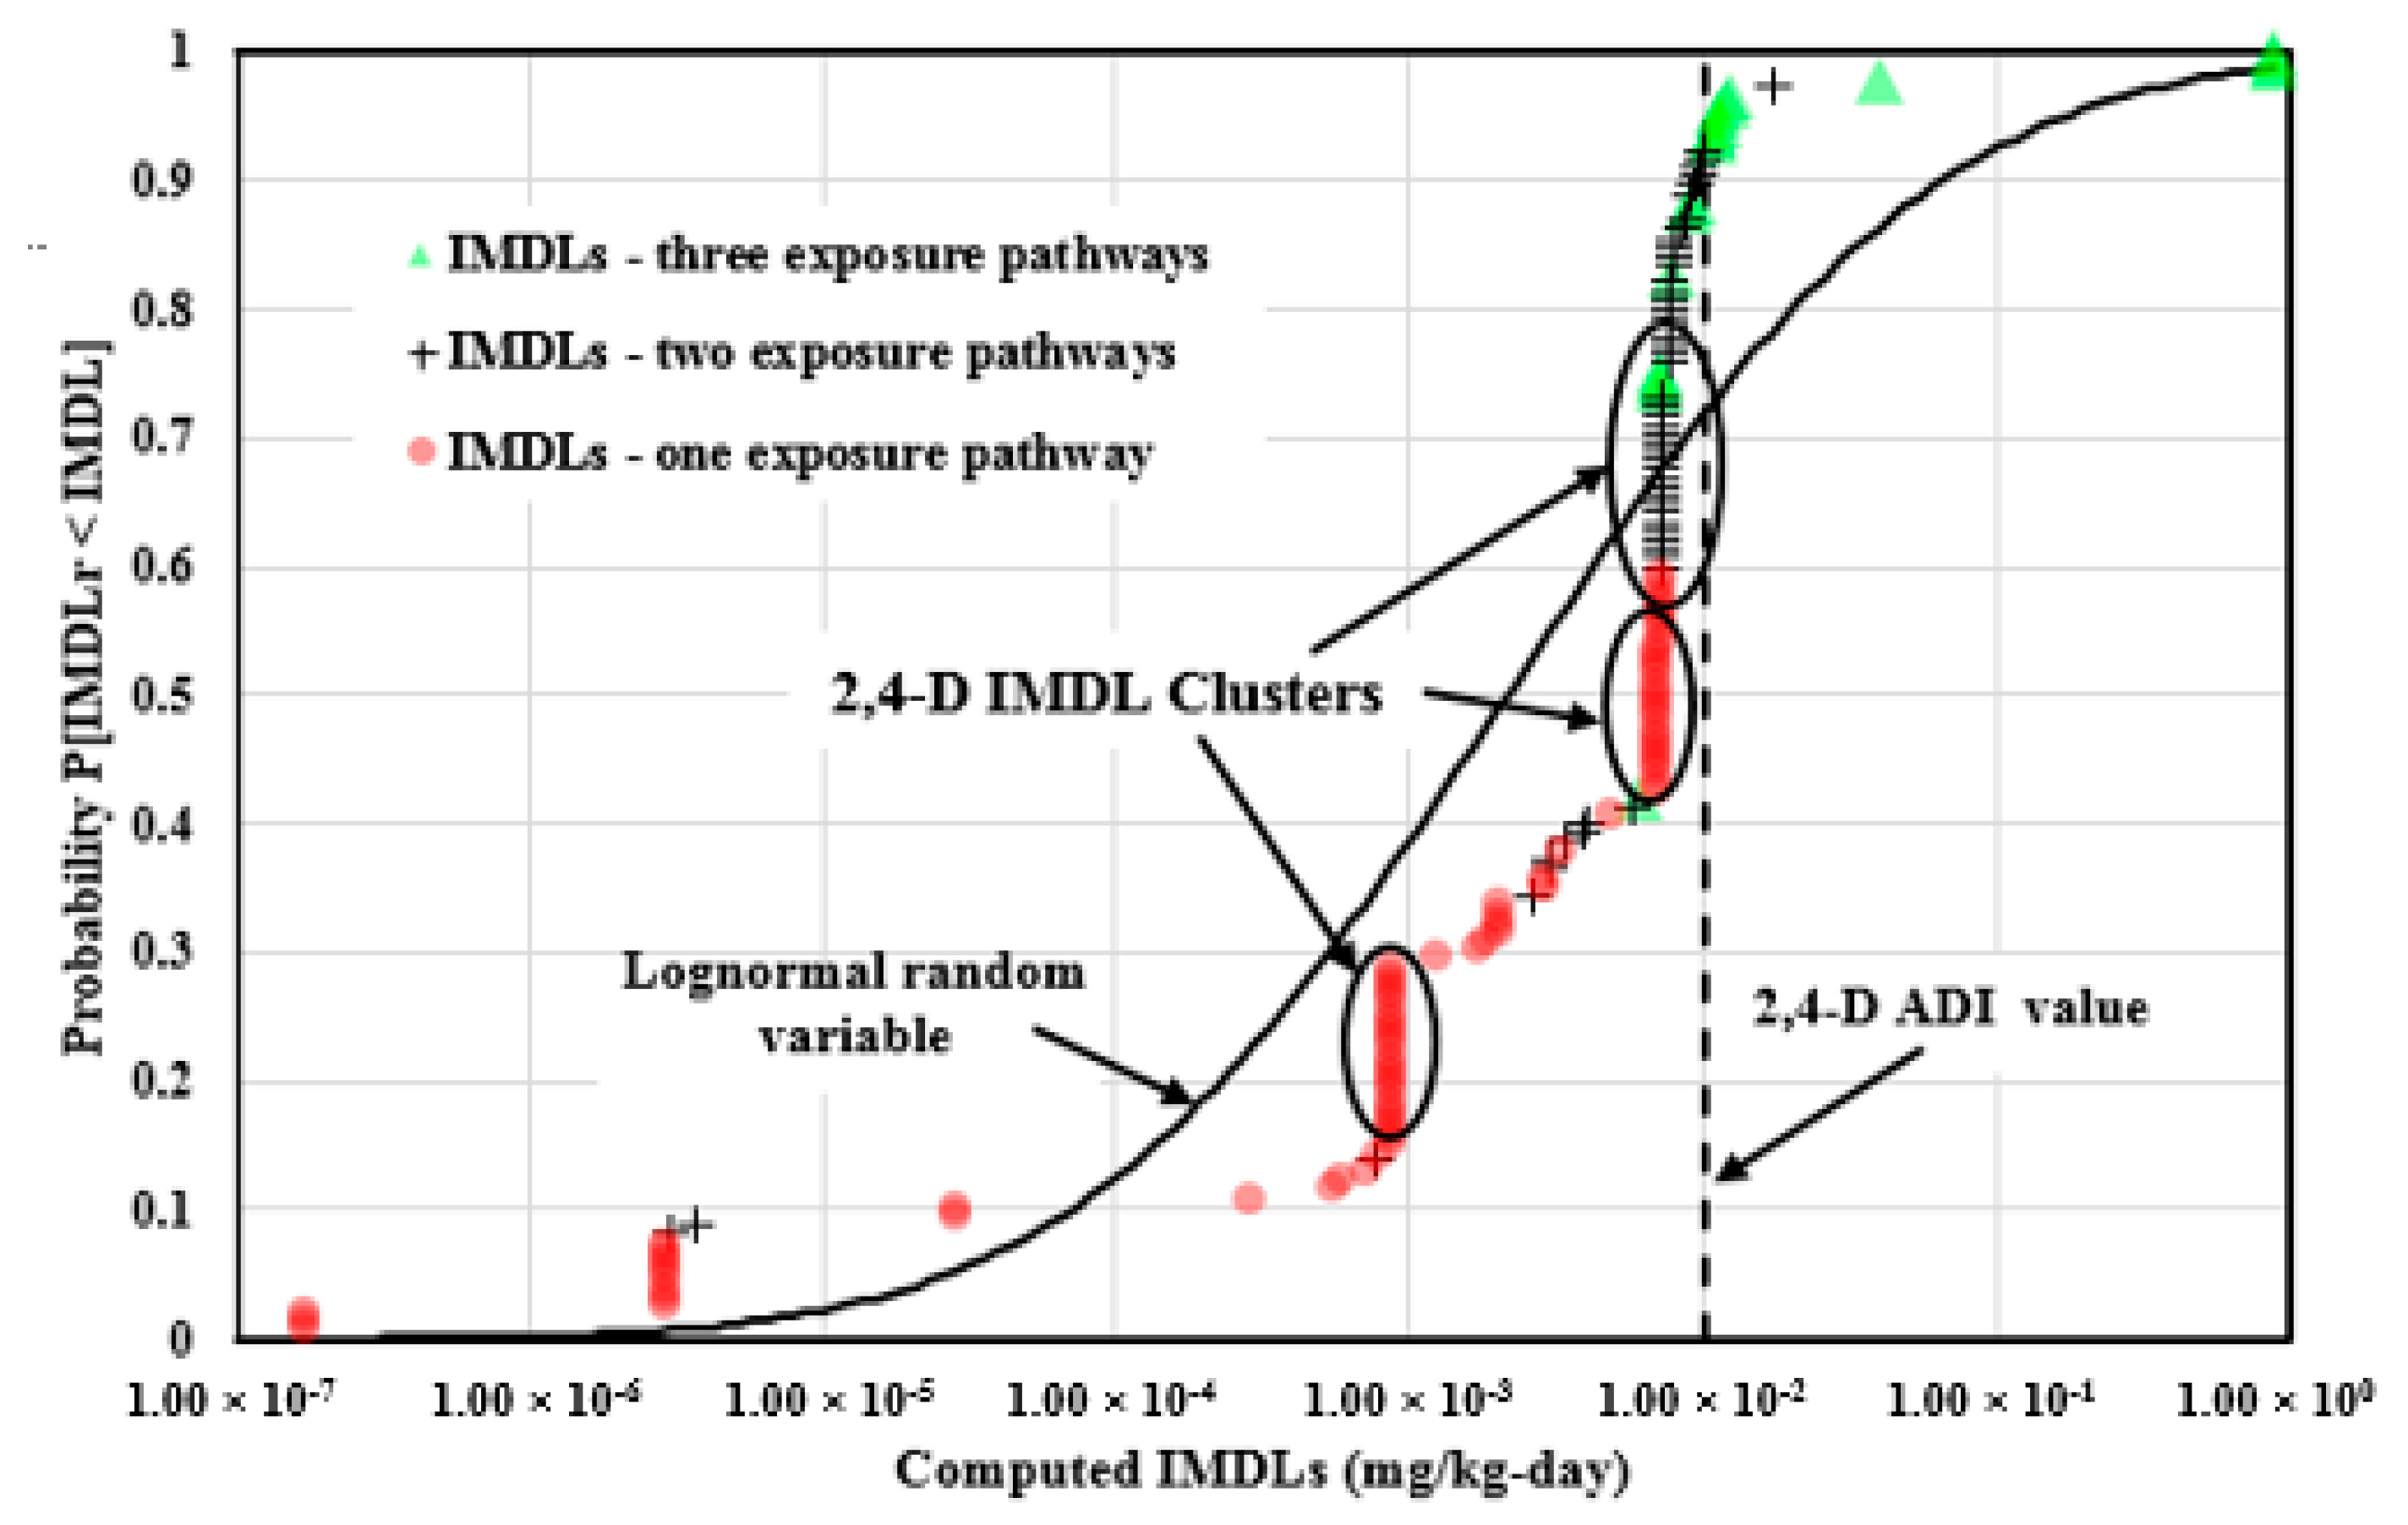
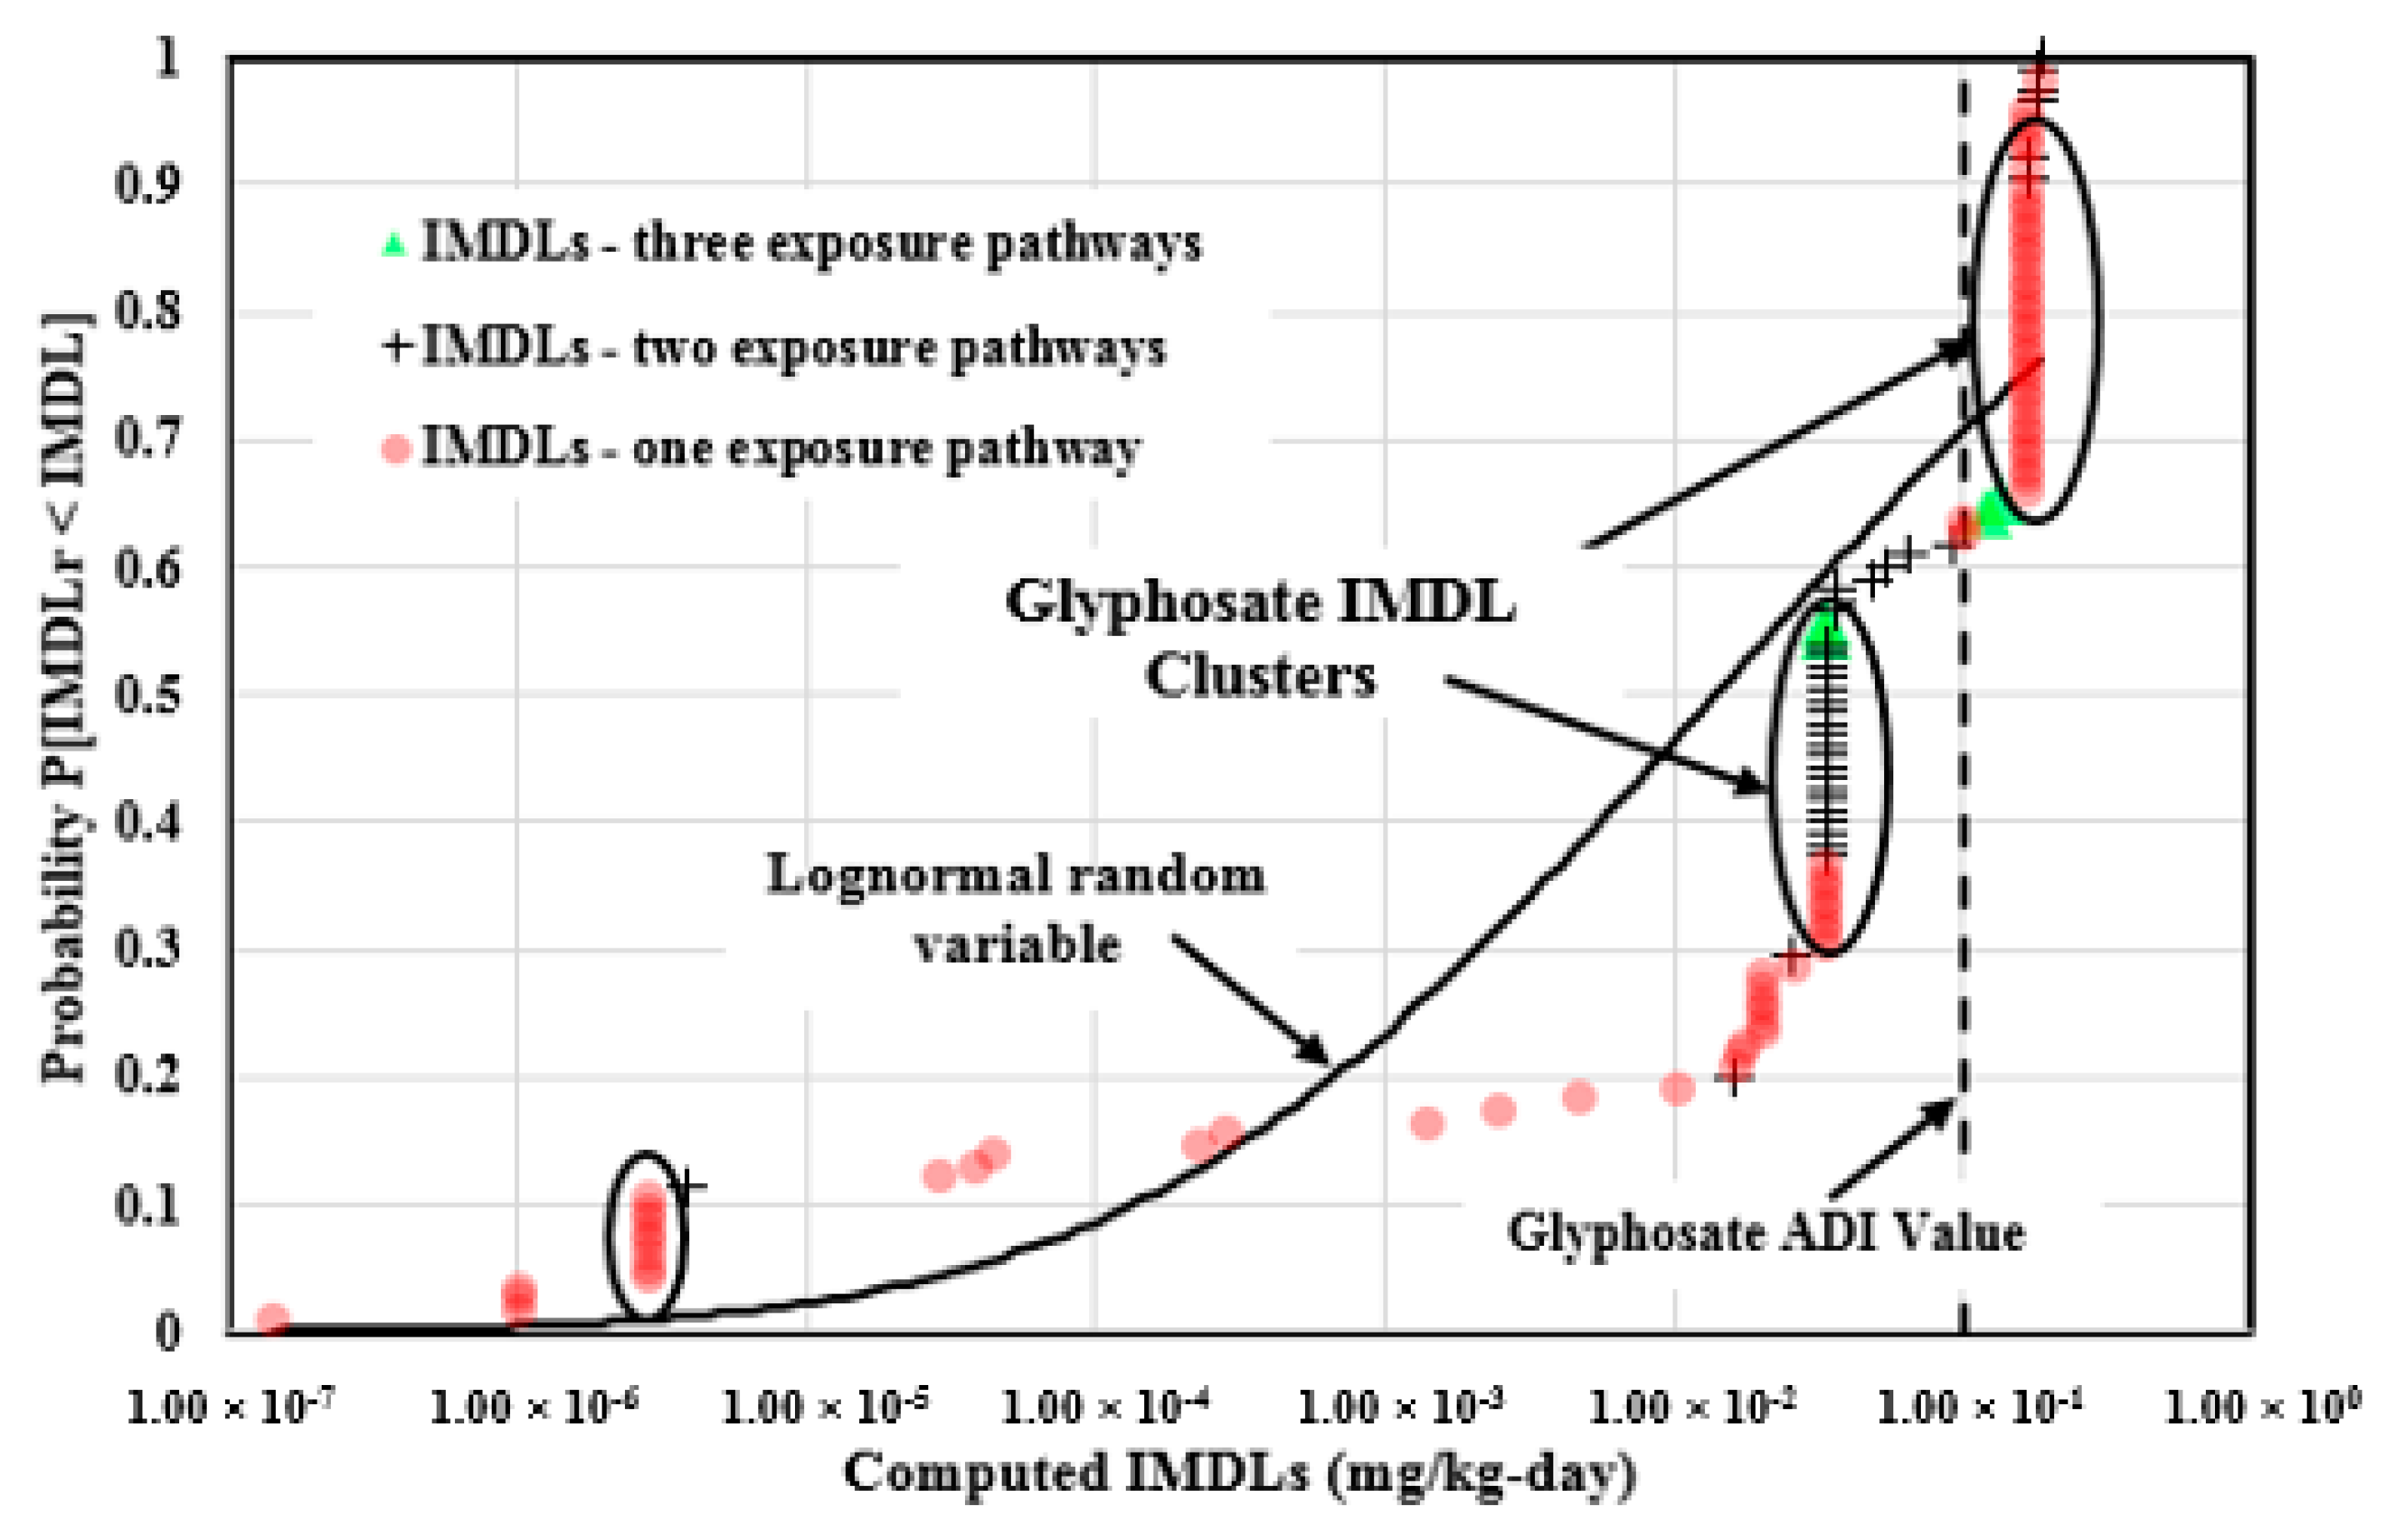
4.6. Analysis of the IMDLs for the Widely Used Pesticides
5. Conclusions
Supplementary Materials
Acknowledgments
Author Contributions
Conflicts of Interest
References
- Li, Z. Analysis of Worldwide Pesticide Regulatory Models and Standards for Controlling Human Health Risk. Ph.D. Thesis, Case Western Reserve University, Cleveland, OH, USA, 2016. [Google Scholar]
- Association of Environmental Health and Science. AEHS Foundation 2003 Survey of States’ Soil and Groundwater Cleanup Standards. Available online: http://www.aehsfoundation.org/State--Surveys.aspx (accessed on 19 October 2013).
- Bartsch, C.; Dorfman, B. Brownfields, VCPs and Housing: State-of-the-art Information and Data. Available online: http://nemw.org/NAHBresults.pdf (accessed on 2 February 2014).
- Davis, A.; Sherwin, D.; Ditmars, R.; Hoenke, K.A. An analysis of soil arsenic records of decision. Environ. Sci. Technol. 2001, 35, 2401–2406. [Google Scholar] [CrossRef] [PubMed]
- Proctor, D.M.; Shay, E.C.; Scott, P.K. Health-based soil action levels for trivalent and hexavalent chromium: A comparison with state and federal standards. J. Soil Contam. 1997, 6, 595–648. [Google Scholar]
- Schäfer, K.W. International Experience and Expertise in Registration Investigation, Assessment, and Clean-Up of Contaminated Military Sites, R&D Project 103 40 102/01, Berlin, Germany: Dames & Moore GmbH & Co. KG. Available online: http://www.umweltbundesamt.de/boden-und-altlasten/altlast/web1/berichte/mooreeng/ dmeng01.htm (accessed on 20 March 2014).
- Interstate Technology Regulatory Council. Examination of Risk-Based Screening Values and Approaches of Selected States. Available online: http://www.itrcweb.org/Documents/RISK-1.pdf (accessed on 21 September 2014).
- Paustenbach, D.J.; Fehling, K.; Scott, P.; Harris, M.; Kerger, B.D. Identifying soil cleanup criteria for dioxins in urban residential soils: How have 20 years of research and risk assessment experience affected the analysis? J. Toxicol. Environ. Health 2006, 9, 87–145. [Google Scholar] [CrossRef] [PubMed]
- California Department of Public Health. MCL Review in Response to PHGs. Available online: http://www.cdph.ca.gov/certlic/drinkingwater/Pages/MCLReview2013.aspx (accessed on 23 March 2014).
- Bamidele, C. Comparison and Contrast of WHO Drinking Water Standard with Regulatory Standards Such As EU, USEPA, NESREA and Canada. Available online: http://www.academia.edu/12231266/COMPARISON_AND_CONTRAST_OF_WHO_DRINKING_WATER_STANDARD_WITH_REGULATORY_STANDARDS_SUCH_AS_EU_USEPA_NESREA_AND_CANADA (accessed on 27 July 2016).
- Lenntech. EU’s Drinking Water Standards. Available online: http://www.lenntech.com/applications/drinking/standards/eu-s-drinking-water-standards.htm (accessed on 4 July 2017).
- World Health Organization. Health Topics: Pesticides. Available online: http://www.who.int/topics/pesticides/en/ (accessed on 15 May 2017).
- World Health Organization. The WHO Recommended Classification of Pesticides by Hazard and Guidelines to Classification 2009. Available online: http://www.who.int/ipcs/publications/pesticides_hazard_2009.pdf (accessed on 15 May 2017).
- Stoytcheva, M. Pesticides in the Modern World—Trends in Pesticides Analysis. In Tech. Available online: https://www.intechopen.com/books/pesticides-in-the-modern-world-trends-in-pesticides-analysis (accessed on 21 July 2017).
- National Institute of Standards and Technology (NIST). Lindane. Available online: http://webbook.nist.gov/cgi/cbook.cgi?ID=58-89-9&Units=SI (accessed on 16 May 2014).
- Global MRL Database. Agricultural Commodities Pesticide MRLs. Available online: http://www.mrldatabase.com/ (accessed on 1 December 2014).
- Netherlands Department of Agriculture, Nature and Food Quality. An Overview of China’s Fruit and Vegetables Industry. Available online: http://china.nlambassade.org/binaries/content/assets/postenweb/c/china/zaken-doen-inchina/import/kansen_en_sectoren/tuinbouw/rapporten_over_tuinbouw/an-overview-ofchinas-fruit-and-vegetables-industry.pdf (accessed on 9 October 2014).
- China Ministry of Agriculture. Chinese Agricultural Statistics Report (In Chinese). Available online: http://www.doc88.com/p-94355314872.html (accessed on 9 October 14).
- India for Safe Food Agency. Pesticide Use in India. Available online: http://indiaforsafefood.in/farminginindia (accessed on 19 July 2014).
- Philippine Statistics Authority. Agricultural Production by Type of Crop 2010 to 2012. Available online: http://www.nscb.gov.ph/secstat/d_agri.asp (accessed on 9 October 2014).
- Federal Office of Consumer Protection and Food Safety. Sales of Pesticides in the Federal Republic of Germany (In German). Available online: https://www.bund.net/fileadmin/bundnet/pdfs/chemie/pestizide/150213_bund_chemie_einkaufscheck_pestizidverkauf (accessed on 19 July 2014).
- Food and Environment Research Agency. Pesticide Usage Survey Report 254 Amenity Pesticides in the United Kingdom. Available online: https://secure.fera.defra.gov.uk/.../surveys/2012surveys.cfm (accessed on 19 July 2014).
- Health Canada. Pest Control Products Sales Report for 2009. Available online: http://www.hcsc.gc.ca/cps-spc/pubs/pest/_corp-plan/index-eng.php (accessed on 21 July 2014).
- Statistics Canada. World and Canadian Production of Major Grains and Oilseeds. Available online: http://www.statcan.gc.ca/pub/96-325-x/2014001/article/11913-eng.htm (accessed on 9 October 2014).
- U.S. Department of Agriculture; National Agricultural Statistics Service. Top Vegetable Crops. Available online: http://www.agcensus.usda.gov/Publications/2007/Online_Highlights/Fact_Sheets/Production/vpm.pdf (accessed on 8 October 2014).
- U.S. Department of Agriculture; National Agricultural Statistics Service. The 2007 Census of Agriculture. Fruit, Berries and Tree Nuts. Available online: http://www.agcensus.usda.gov/Publications/2007/Online_Highlights/Fact_Sheets/Production/fbn.pdf (accessed on 8 October 2014).
- U.S. Department of Agriculture; National Agricultural Statistics Service. Crop Production. Available online: http://www.epa.gov/agriculture/ag101/cropmajor.html (accessed on 8 October 2014).
- Mexico Ministry of Agriculture. Mexico’s Top Agricultural Products. Available online: http://www.tnvmanagement.com/mexecon-blog/2010/3/8/mexico's-top-agriculturalproducts.aspx (accessed on 9 October 2014).
- United Nations Environment Programme. Import of Pesticides in Costa Rica: Period 2007–2009. (In Spanish). Available online: http://cep.unep.org/repcar/informacion-depaises/costarica/Impoortaciones_07-09_REPCar.pdf (accessed on 21 July 2014).
- Brazilian Agricultural Research Corporation - Embrapa. Vegetable Production in Brazil (In Portuguese). Available online: http://www.cnph.embrapa.br/paginas/hortalicas_em_numeros/producao_hortalicas.pdf (accessed on 9 October 2014).
- Brazil Department of Rural Economy. Fruit Culture — Scenario Analysis of Agricultural (In Portuguese). Available online: http://www.agricultura.pr.gov.br/arquivos/File/deral/Prognosticos/fruticultura_2012_13.pdf (accessed on 9 October 2014).
- Manktelow, D.; Stevens, P.; Walker, J.; Gurnsey, S.; Park, N.; Zabkiewicz, J.; Teulon, D.; Rahman, A. Trends in Pesticide Use in New Zealand: 2004. Available online: http://www.dioxinnz.com/Spray-NZ-Hist/PDF/nz-pesticide-trends.pdf (accessed on 21 July 2017).
- Australian Department of Agriculture, Fisheries and Forestry. Statistical Tables. Available online: http://data.daff.gov.au/brs/data/warehouse/agcomd9abcc004/agcomd9abcc004201206/AgCommodities2012.Vol2.No2_Stats_Ver1.0.0.pdf (accessed on 9 October 2014).
- Australian Government. Australian Vegetable Growing Farms. Available online: http://data.daff.gov.au/data/warehouse/9aab/9aabf/2012/avfesd9abri20121127/AustVegGrwFrmEcoSurvey_1.0.0.pdf (accessed on 9 October 2014).
- James, M.D.; Justinus, M.S.; Victor, W. Prioritizing agricultural pesticides used in South Africa based on their environmental mobility and potential human health effects. Environ. Int. 2014, 62, 31–40. [Google Scholar]
- U.S. Environmental Protection Agency. Regional Screening Levels (RSLs)—Equations (May 2016). Available online: https://www.epa.gov/risk/regional-screening-levels-rsls-equations-may-2016 (accessed on 19 April 2017).
- Jennings, A.; Li, Z. Scope of the worldwide effort to regulate pesticide contamination in surface soils. J. Environ. Manag. 2014, 146, 420–443. [Google Scholar] [CrossRef] [PubMed]
- Jennings, A.; Li, Z. Residential surface soil guidance applied worldwide to the pesticides added to the Stockholm Convention in 2009 and 2011. J. Environ. Manag. 2015, 160, 226–240. [Google Scholar] [CrossRef] [PubMed]
- Jennings, A.; Li, Z. Residential surface soil guidance values applied worldwide to the original 2001 Stockholm Convention POP pesticides. J. Environ. Manag. 2015, 160, 16–29. [Google Scholar] [CrossRef] [PubMed]
- Jennings, A.; Li, Z. Worldwide Regulatory Guidance Values Applied to Direct Contact Surface Soil Pesticide Contamination: Part II—Noncarcinogenic Pesticides. Air Soil Water Res. 2017, 10, 1–14. [Google Scholar] [CrossRef]
- Jennings, A.; Li, Z. Worldwide regulatory guidance values applied to direct contact surface soil pesticide contamination: Part I—Carcinogenic Pesticides. Air Soil Water Res. 2017, 10, 1–12. [Google Scholar] [CrossRef]
- Dorne, J.L.C.M. Metabolism, variability and risk assessment. Toxicology 2010, 268, 156–164. [Google Scholar] [CrossRef] [PubMed]
- U.S. Environmental Protection Agency. Reference Dose (RfD): Description and Use in Health Risk Assessments. Background Document 1A March 15, 1993. Available online: https://www.epa.gov/iris/reference-dose-rfd-description-and-use-health-risk-assessments (accessed on 18 May 2017).
- Jennings, A.A. Analysis of regulatory guidance values for residential surface soil arsenic exposure. J. Environ. Eng. 2010, 136, 861–877. [Google Scholar] [CrossRef]
- Australian Drinking Water Guidelines (2011)—Updated February 2016. Available online: https://www.nhmrc.gov.au/guidelines-publications/eh52 (accessed on 6 July 2016).
- World Health Organization. Guidelines for Drinking-water Quality Fourth Edition. Available online: http://www.who.int/water_sanitation_health/publications/2011/dwq_chapters/en/ (accessed on 5 April 2014).
- Health Canada. Guidelines for Canadian Drinking Water Quality—Summary Table. Available online: http://www.hc-sc.gc.ca/ewh-semt/pubs/water-eau/2012-sum_guide-res_recom/index-eng.php (accessed on 20 August 2014).
- U.S. Department of Agriculture. Data and Statistics. Available online: http://www.usda.gov/wps/portal/usda/usdahome?navid=DATA_STATISTICS (accessed on 8 July 2015).
- Agency for Toxic Substances and Disease Registry. Public Health Assessment Guidance Manual (2005 Update). Available online: http://www.atsdr.cdc.gov/hac/PHAManual/appg.html (accessed on 8 July 2015).


| No. | Worldwide Jurisdictions | No. of Soil RGVs | No. of Water MCLs | Sources of Pesticide Soil RGVs 1 | Language (Soil RGVs) | Sources of Pesticide Water MCLs 1 | Language (Water MCLs) |
|---|---|---|---|---|---|---|---|
| Multinational organizations | |||||||
| 1 | East Africa Community | 17 | 19 | East Africa Community (2011) | English | East African Community (2012) | English |
| 2 | European Union | 14 | UNK 2 | European Union (2010) | English | European Union (1998) | English |
| 3 | Gulf Standardization Organization | --- 3 | 33 | --- | --- | Gulf Standardization Organization (2012) | Arabic & English |
| 4 | World Health Organization | 11 | 36 | World Health Organization (2002) | English | World Health Organization (2011) | English |
| United Nations member states | |||||||
| 1 | Republic of Albania | --- | 36 | --- | --- | Albania Institute for European Environmental Policy (2007) | Albanian |
| 2 | Principality of Andorra | 14 | 25 | Andorra Official Gazette (2010) | Catalan | Andorra Official Gazette (1999) | Catalan |
| 3 | Antigua and Barbuda | --- | 36 | --- | --- | Environmental Solutions Antigua Limited (2008) | English |
| 4 | Argentine Republic | --- | 49 | --- | --- | Argentine Official Gazette (1993) | Spanish |
| 5 | Republic of Armenia | 286 | --- | Armenia Minister of Health (2011) | Armenian | --- | |
| 6 | Commonwealth of Australia | 48 | 152 | Australia National Environmental Protection Council (1999) | English | National Health and Medical Research Council (2013) | English |
| (Australia) Australian Capital Territory | 48 | 152 | Australia National Environmental Protection Council (1999) | English | Australian Capital Territory Ministry of Health (2007) | English | |
| (Australia) Tasmania | 62 | 152 | Tasmania Environmental Protection Authority (2012) | English | Tasmania Department of Health and Human Services (1997) | English | |
| Australia National Environmental Protection Council (1999) | English | ||||||
| (Australia) New South Wales | 18 | 152 | New South Wales Department of Environment and Conservation (2006) | English | Australia Department of Health (2014) | English | |
| (Australia) Northern Australia | 48 | 152 | Australia National Environmental Protection Council (1999) | English | Australia Department of Health (2014) | English | |
| (Australia) Queensland | 48 | 145 | Australia National Environmental Protection Council (1999) | English | Government of Queensland (2014) | English | |
| (Australia) State of Victoria | 67 | --- | Victoria Environmental Protection Authority (2002) | English | --- | --- | |
| Australia National Environmental Protection Council (1999) | English | ||||||
| (Australia) South Australia | 66 | 152 | Australia National Environmental Protection Council (1999) | English | Government of South Australia (2011) | English | |
| South Australia Environment Protection Authority (2006) | English | ||||||
| (Australia) Western Australia | 18 | 152 | Western Australia Department of Environment and Conservation (2010) | English | Australia Department of Health (2014) | English | |
| 7 | Republic of Austria | --- | UNK | --- | --- | Austria Department of Health (2013) | German |
| 8 | Commonwealth of the Bahamas | 123 | 36 | Bahamas Ministry of Works and Transport (2008) | English | The Bahamas Water and Sewerage Corporation (1999) | English |
| 9 | People’s Republic of Bangladesh | 2 | Amio Water Treatment Limited (2010) | English | |||
| 10 | Republic of Belarus | 139 | 16 | Belarus Ministry of Health (2004) | Belarusian | Belarus Ministry of Health (2013) | Russian |
| 11 | Belize | --- | 36 | --- | --- | Belize Agricultural Health Authority (2003) | English |
| 12 | Kingdom of Bhutan | --- | 36 | --- | --- | Codex Alimentarius (2001) | English |
| 13 | Plurinational State of Bolivia | --- | UNK | --- | --- | Bolivia Ministry of Public Works and Services Vice of Basic Services (2004) | Spanish |
| 14 | Republic of Botswana | --- | UNK | --- | --- | Water Utilities Corporation (2000) | English |
| 15 | Federative Republic of Brazil | 8 | 26 | Brazil Ministry of the Environment (2009) | Portuguese | Brazil Ministry of Health (2004) | Portuguese |
| (Brazil) State of San Paolo | 8 | 36 | Environmental Company of Sao Paolo (2005) | Portuguese | Government of State of San Paolo (2008) | Portuguese | |
| 16 | Republic of Bulgaria | 64 | UNK | Bulgaria Ministry of Environment and Water (2008) | Bulgarian | Bulgaria Ministry of Health (2001) | Bulgarian |
| 17 | Kingdom of Cambodia | --- | 19 | --- | --- | Cambodia Ministry of Industry Mines and Energy (2004) | English |
| 18 | Canada | 4 | 25 | Canadian Council of Ministers of the Environment (CCME) (2011) | English | Health Canada (2012) | English |
| (Canada) Alberta | 86 | 25 | Alberta Environment (2010) | English | Alberta Health Services (2013) | English | |
| (Canada) British Columbia | 206 | 25 | --- | --- | British Columbia Ministry of Health (undated) | English | |
| British Columbia Regulations (2013) | English | ||||||
| British Columbia Regulations (2013) | English | ||||||
| (Canada) Province of Manitoba | 4 | --- | Manitoba Conservation (2011), CCME (2011) | English | --- | --- | |
| (Canada) Newfoundland and Labrador | 3 | 25 | Environment and Conservation, Government of Newfoundland and Labrador (2005) | English | Government of Newfoundland and Labrador (2013) | English | |
| (Canada) Northwest Territories | 4 | 25 | Northwest Territories Department of Environment and Natural Resources (2003) | English | Canada Northwest Territories Municipal and Community Affairs (undated) | English | |
| (Canada) Nova Scotia | 169 | 57 | Nova Scotia Environment (2013) | English | Government of Nova Scotia (2012), Nova Scotia Environment and Labor (undated) | English | |
| (Canada) Nunavut | 6 | 25 | Department of Environment, Government of Nunavut (2009) | English | National Collaborating Centre for Environmental Health (2014) | English | |
| (Canada) Ontario | 72 | 24 | Ontario Ministry of the Environment (2011) | English | Canadian Institute for Environmental Law and Policy (2003) | English | |
| (Canada) Prince Edward Island | 3 | 25 | Prince Edward Island Environment, Energy and Forestry (2010) | English | Prince Edward Island Department of Environment, Labor and Justice (2012) | English | |
| (Canada) Quebec | 1 | 34 | Quebec Ministry of Sustainable Development, Environment and Parks (1998) | French | Government of Quebec (2014) | English | |
| (Canada) Saskatchewan | --- | 12 | --- | --- | Saskatchewan Environment (2006) | English | |
| (Canada) Yukon | 5 | 25 | Yukon Regulations (2002) | English | Government of Yukon (2007) | English & French | |
| 19 | Republic of Chile | --- | 8 | --- | --- | Chile Ministry of Public Works (2005) | Spanish |
| 20 | People’s Republic of China | 20 | 17 | Peoples Republic of China (1995) | Chinese | China Department of Health (2007) | Chinese |
| People’s Republic of China Ministry of Environmental Protection (2006) | Chinese | ||||||
| China (Beijing) | 14 | --- | Beijing Municipal Environmental Protection Bureau (2011) | Chinese | --- | --- | |
| 21 | Republic of Colombia | --- | 16 | --- | --- | Colombian Institute for Technical Standards and Certification (1994) | Spanish |
| 22 | Republic of Costa Rica | 8 | 33 | Ministry of Health (2011) | Spanish | Costa Rica Minister of Finance (2005) | Spanish |
| 23 | Republic of Croatia | 15 | UNK | Agricultural University of Zagreb (2008) | Croatian | Croatia Ministry of Health and Social Welfare (2007) | Croatian |
| 24 | Republic of Cuba | --- | 16 | --- | --- | Cuba Government (1997) | Spanish |
| 25 | Republic of Cyprus | --- | UNK | --- | --- | Cyprus Ministry of Agriculture, Natural Resources and Environment (1999) | English |
| 26 | Czech Republic | 11 | UNK | Czech Republic Ministry of the Environment (1994) | English | European Commission (1998) | Czech |
| European Commission (2007) | English | ||||||
| 27 | Kingdom of Denmark | 9 | UNK | Danish Environmental Protection Agency (2010) | Danish | Nature Agency of Denmark (2014) | Danish |
| 28 | Dominican Republic | --- | UNK | --- | --- | Dominican Ministry of Public Health and Social Assistance (2005) | Spanish |
| 29 | Republic of Ecuador | 27 | 19 | Ecuador Ministry of the Environment (2004) | Spanish | Ecuadorian Institute of Standards (2011) | Spanish |
| 30 | Arab Republic of Egypt | --- | 33 | --- | --- | World Health Organization Regional Office for the Eastern Mediterranean (2006) | English |
| 31 | Republic of Estonia | 12 | UNK | Estonia Ministry of the Environment (2004) | Estonian | Estonia Minister of Social Affairs (2013) | Estonian |
| 32 | Federal Democratic Republic of Ethiopia | --- | 10 | --- | --- | World Health Organization (2010) | English |
| 33 | Republic of Fiji | --- | 36 | --- | --- | Secretariat of the Pacific Community (2005) | English |
| 34 | Republic of Finland | 12 | UNK | Finland Ministry of the Environment (2007) | Finish | Finland Minister of Social Affairs and Health (2001) | Finish |
| 35 | French Republic | 18 | UNK | European Commission (2007) | English | France Ministry of Ecology, Sustainable Development And Energy (1998) | French |
| 36 | Republic of the Gambia | --- | UNK | --- | --- | Gambia Environmental Quality Standards Board (1999) | English |
| 37 | Georgia | 231 | UNK | Georgia Minister of Environment and Minister of Natural Resources (2006) | Georgian | Georgia Ministry of Justice (2007) | Georgian |
| Minister of Health, labor and social affairs (2001) | Georgian | ||||||
| 38 | Federal Republic of Germany | 8 | UNK | German Federal Ministry of the Environment, Nature Conservation and Nuclear Safety (1999) | German | Germany Federal Ministry of Justice and Consumer Protection (2001) | German |
| 40 | Republic of Guatemala | --- | 55 | --- | --- | Guatemala Government (1999) | Spanish |
| 39 | Hellenic Republic | --- | UNK | --- | --- | Greece Central Public Health Laboratory (1998) | Greek |
| 41 | Republic of Honduras | --- | 33 | --- | --- | Honduras Department of Health (1995) | Spanish |
| 42 | Republic of Hungary | 68 | UNK | Hungary Ministry of the Environment (2000) | Hungarian | Hungary National Public Health and Medical Officer Service (2001) | Hungarian |
| 43 | Republic of Indonesia | --- | 17 | --- | --- | Indonesia Government (1990) | Indonesian |
| 44 | Republic of Iraq | --- | 3 | --- | --- | Iraq Central Agency for Meteorology and Quality Control (2001) | Arabic & English |
| 45 | Ireland | --- | UNK | --- | --- | Ireland EPA (2007) | English |
| 46 | State of Israel | --- | 7 | --- | --- | Israel Ministry of Health (2000) | Hebrew |
| 47 | Republic of Italy | 13 | 59 | Italy National Institute of Health (2006) | Italian | Navy Medicine (2012) | English |
| UNK | Italy Ministry of Health (2001) | Italian | |||||
| (Italy) Lombardi Region | 9 | --- | Tazzioli (1999) | Italian | --- | --- | |
| (Italy) Piedmont Region | 1 | --- | Tazzioli (1999) | Italian | --- | --- | |
| (Italy) Emili Romana Region | 1 | --- | Tazzioli (1999) | Italian | --- | --- | |
| (Italy) Liguria Region | 1 | --- | Tazzioli (1999) | Italian | --- | --- | |
| 48 | Japan | --- | 36 | --- | --- | Japan Ministry of Health, Labor and Welfare (2001) | English & Japanese |
| 49 | Hashemite Kingdom of Jordan | --- | 11 | --- | --- | The Jordanian Institute of Standards and Metrology (2001) | English |
| 50 | Republic of Kazakhstan | --- | 3 | --- | --- | Kazakhstan Government (2001) | Russian |
| 51 | Republic of Kiribati | --- | 36 | --- | --- | Secretariat of the Pacific Community (2005) | English |
| 52 | Republic of Korea | --- | 5 | --- | --- | Korea Ministry of Environment (2011) | English |
| 53 | State of Kuwait | --- | 36 | --- | --- | World Health Organization Regional Office for the Eastern Mediterranean (2006) | English |
| 54 | Republic of Latvia | 17 | UNK | Latvia Cabinet of Ministers (2005) | Latvian | Latvia Ministry of Health (2004) | Latvian |
| 55 | Lebanese Republic | --- | 4 | --- | --- | World Health Organization Regional Office for the Eastern Mediterranean (2006) | English |
| 56 | Principality of Liechtenstein | --- | UNK | --- | --- | Liechtenstein Drinking Water Inspectorate (1999) | English |
| 57 | Republic of Lithuania | 24 | UNK | Lithuania Ministry of the Environment (2008) | Lithuanian | Lithuania Ministry of Health (2003) | Lithuanian |
| 58 | Grand Duchy of Luxembourg | --- | UNK | --- | --- | Luxembourg Collection of Legislation (2002) | French |
| 59 | Malaysia | 194 | 23 | Malaysia Environment Protection Department (2009) | English | Malaysia Ministry of Health (2010) | English |
| 60 | Republic of Malta | --- | UNK | --- | --- | Malta Government (2009) | Maltese |
| 61 | Republic of Mauritius | --- | 10 | --- | --- | Mauritius Government Gazette (1996) | English |
| 62 | United Mexican States | --- | 18 | --- | --- | Government of Mexico (1994) | Spanish |
| 63 | Republic of Moldova | 166 | --- | Moldova Ministry of Ecology and Natural Resources (2004) | Romanian | --- | --- |
| 64 | Mongolia | --- | 5 | --- | --- | Government of Mongolia (2005) | Mongolian |
| 65 | Kingdom of Morocco | --- | 1 | --- | --- | World Health Organization Regional Office for the Eastern Mediterranean (2006) | English |
| 66 | Republic of Nauru | --- | 36 | --- | --- | Secretariat of the Pacific Community (2005) | English |
| 67 | Kingdom of the Netherlands | 61 | UNK | Netherlands National Institute for Public Health and the Environment (2006) | English | Government of Netherlands (2014) | Dutch |
| Netherlands Ministry of Economic Affairs, Agriculture and Innovation (2006) | English | ||||||
| Netherlands National Institute for Public Health and the Environment (2009) | English | ||||||
| 68 | New Zealand | 344 | 55 | New Zealand Ministry of the Environment (2012) | English | New Zealand Ministry of Health (2008) | English |
| New Zealand Ministry of the Environment | English | ||||||
| New Zealand Ministry of the Environment (1997) | English | ||||||
| New Zealand Ministry of the Environment (2006) | English | ||||||
| New Zealand Ministry of the Environment (2011) | English | ||||||
| New Zealand Ministry of the Environment | English | ||||||
| (New Zealand) Auckland City Council | 9 | --- | Cavanagh (2006) | English | --- | --- | |
| (New Zealand) Auckland Regional Council | 5 | --- | Cavanagh (2006) | English | --- | --- | |
| (New Zealand) Bay of Plenty | 4 | --- | Cavanagh (2006) | English | --- | --- | |
| (New Zealand) Hastings District Council | 3 | --- | Cavanagh (2006) | English | --- | --- | |
| (New Zealand) Tasmasn District Council | 10 | --- | Cavanagh (2006) | English | --- | --- | |
| (New Zealand) Waikato Region | 8 | --- | Cavanagh (2006) | English | --- | --- | |
| 69 | Republic of Nicaragua | --- | 35 | --- | --- | Nicaragua Ministry of Health (1994) | Spanish |
| 70 | Federal Republic of Nigeria | --- | UNK | --- | --- | Standards Organization of Nigeria (2007) | English |
| 71 | Kingdom of Norway | 3 | UNK | Norwegian Pollution Control Authority (1999) | English | Norway Ministry of Health and Care Services (2001) | Norwegian |
| 72 | Islamic Republic of Pakistan | --- | 19 | --- | --- | Pakistan Standards and Quality Control Authority (Undated) | English |
| 73 | Republic of Palau | --- | 6 | --- | --- | Environmental Quality Protection Board (Undated) | English |
| 74 | Republic of Panama | 20 | --- | Panama Ministry of Economy and Finance (2009) | Spanish | --- | --- |
| 75 | Republic of Peru | 4 | 45 | Peru Ministry of Environment (2013) | Spanish | Peru Ministry of Health (2011) | Spanish |
| 76 | Republic of the Philippines | --- | 17 | --- | --- | Philippines Department of Health (2007) | English |
| 77 | Republic of Poland | 14 | UNK | Poland Minister of the Environment (2002) | Polish | Poland Ministry of Health (2007) | Polish |
| 78 | Portuguese Republic | 15 | UNK | Ontario Ministry of Environment and Energy (1997) | Portuguese and English | Portugal Ministry of Environment, Planning and Regional Development (2007) | Portuguese |
| 79 | State of Qatar | 4 | 33 | Qatar Ministry of Environment (2007) | Arabic | The Gulf Cooperation Council (GCC) Standardization (2012) | Arabic & English |
| 80 | Russian Federation | 146 | 106 | Russian State Construction Code (1997) | Russian | Russian Ministry of Health (1998, 1999, 2002, 2007) | Russian |
| Russian Ministry Of Environment and Natural Resources (1993) | Russian | ||||||
| (Russia) City of Moscow | 1 | --- | Moscow Government (2004) | Russian | --- | --- | |
| (Russia) Republic of Tatarstan | 137 | --- | Republic of Tatarstan Ministry of Environment and Natural Resources (2002) | Russian | --- | --- | |
| 81 | Republic of Rwanda | --- | 19 | --- | --- | Rwanda Standards Board (2013) | English |
| 82 | Saint Lucia | --- | 40 | --- | --- | Caricom Regional Organization for Standards and Quality (undated) | English |
| 83 | Republic of Serbia | 56 | 28 | Serbia Ministry of Environment and Spatial Planning (1994) | English | Serbia Official Gazette (1999) | English |
| 84 | Republic of Singapore | 46 | 39 | Singapore National Environmental Agency (2010) | English | Government of Singapore (2008) | English |
| 85 | Slovak Republic | 5 | UNK | Slovakia Ministry of Agriculture (2004) | Slovak | Council Regulation Government of the Slovak Republic (2010) | Slovak |
| 86 | Republic of Slovenia | 45 | UNK | Slovenia Ministry of Environment and Spatial Planning (1996) | Slovenian | Slovenia Ministry of Health (2004) | Slovenian |
| 87 | Republic of South Africa | 10 | 1 | South Africa Department of Environmental Affairs (2010) | English | South Africa Department of Water and Sanitation (2005) | English |
| 88 | Kingdom of Spain | 14 | UNK | Spain Ministry of the Presidency (2005) | Spanish | Government of Spain (2003) | Spanish |
| (Spain) Autonomous Community of Andalusia | 19 | --- | Andalusia Ministry of Environment (2006) | Spanish | --- | --- | |
| (Spain) Autonomous Community of Aragon | 14 | --- | Government of Aragon (2005) | Spanish | --- | --- | |
| (Spain) Principality of Asturias | 14 | --- | The Government of the Principality of Asturias (2005) | Asturianu | --- | --- | |
| (Spain) Autonomous Community Balearic Islands | 14 | --- | Ministry of Agriculture, Environment and Territory of Balearic Islands (2013) | Catalan | --- | --- | |
| (Spain) Basque Country | 17 | --- | Basque Government, Department of Environment, Planning, Agriculture and Fisherie (2005) | Basque | --- | --- | |
| (Spain) Autonomous Community of Canary Islands | 14 | --- | Government of Canary Islands (2007) | Spanish | --- | --- | |
| (Spain) Autonomous Community of Cantabria | 14 | --- | Government of Cantabria (2006) | Spanish | --- | --- | |
| (Spain) Autonomous Community of Castile and Leon | 14 | --- | Government of Castile and Leon | Spanish | --- | --- | |
| (Spain) Autonomous Community of Castile La Mancha | 14 | --- | Jiménez Ballesta et al. (2010) | Spanish | --- | --- | |
| (Spain) Autonomous Community of Catalonia | 23 | --- | Waste Agency of Catalonia (2005) | Catalan | --- | --- | |
| Andalusia Ministry of Environment (2006) | Spanish | ||||||
| (Spain) Autonomous City of Ceuta | 14 | --- | Official Portal of Ceuta (2013) | Spanish | --- | --- | |
| (Spain) Autonomous Community of Extremadura | 14 | --- | Ministry of Agriculture and Rural Development (2010) | Spanish | --- | --- | |
| (Spain) Autonomous Community of Galicia | 23 | --- | Ministry of Environment and Sustainable Development of Galicia (2009) | Galician | --- | --- | |
| Andalusia Ministry of Environment (2006) | Spanish | ||||||
| (Spain) Autonomous Community of La Rioja | 14 | --- | Government of La Rioja (2007) | Spanish | --- | --- | |
| (Spain) Autonomous Community of Madrid | 14 | --- | Spain Ministry of the Presidency (2005) | Spanish | --- | --- | |
| (Spain) Autonomous City of Melilla | 14 | --- | Ministry of Environment of the Autonomous City of Melilla (undated) | Spanish | --- | --- | |
| (Spain) Region of Murcia | 14 | --- | Government of Region of Murcia (2011) | Spanish | --- | --- | |
| (Spain) Autonomous Community of Navarra | 14 | --- | Department of Rural Development, Environment and Local Government (undated) | Basque | --- | --- | |
| (Spain) Autonomous Community of Valencia | 14 | --- | Generalist at Valencian Regional Ministry of Infrastructure, Planning and the Environment (2007) | Catalan | --- | --- | |
| 89 | Republic of the Sudan | --- | 36 | --- | --- | World Health Organization Regional Office for the Eastern Mediterranean (2006) | English |
| 90 | Kingdom of Sweden | --- | UNK | --- | --- | Sweden Nutrition and Food Agency (2001) | Swedish |
| 91 | Swiss Confederation | --- | UNK | --- | --- | Switzerland Department of Consumer and Veterinary (2014) | French |
| 92 | Syrian Arab Republic | --- | 12 | --- | --- | World Health Organization Regional Office for the Eastern Mediterranean (2006) | English |
| 93 | United Republic of Tanzania | 17 | 1 | Tanzanian Bureau of Standards (2007) | English | Tanzania Bureau of Standards (2009) | English |
| 94 | Kingdom of Thailand | 9 | 1 | Thailand Ministry of Natural Resources and Environment (2004) | English | Thailand Ministry of Health (2001) | Thai |
| 95 | Kingdom of Tonga | --- | 36 | --- | --- | Secretariat of the Pacific Community (2005) | English |
| 96 | Republic of Turkey | 1 | --- | Turkey Ministry of Environment and Forestry (2001) | Turkish | --- | --- |
| 97 | Republic of Tunisia | --- | 1 | --- | --- | Global Water and Wastewater Quality Regulations (2012) | English |
| 98 | Tuvalu | --- | 36 | --- | --- | Secretariat of the Pacific Community (2005) | English |
| 99 | Republic of Uganda | --- | 34 | --- | --- | Uganda Ministry of Tourism, Trade and Industry (2008) | English |
| 100 | Ukraine | 286 | UNK | Ministry of Health of Ukraine (2001) | Ukrainian | Ukraine Water Health (Undated) | Russian |
| 101 | United Kingdom of Great Britain and Northern Ireland | --- | UNK | --- | --- | United Kingdom Drinking Water Inspectorate (2000) | English |
| (United Kingdom) Northern Ireland | --- | UNK | --- | --- | Statutory Rules of Northern Ireland (2007) | English | |
| (United Kingdom) Anglian Water Services | 1 | --- | Anglian Water Services Ltd. (2010) | English | --- | --- | |
| (United Kingdom) White Young Green Environmental Ltd | 2 | --- | White Young Green Environmental Ltd. (2008) | English | --- | --- | |
| (United Kingdom) Environmental Industries Commission | 36 | --- | Environmental Industries Commission (2010) | --- | --- | ||
| 102 | Eastern Republic of Uruguay | --- | 41 | --- | --- | Uruguay Administration of Sanitary Works (2006) | Spanish |
| 103 | Republic of Uzbekistan | 104 | 2 | Head of State health officer of the Republic of Uzbekistan (2005) | Russian | Uzbekistan Ministry of Health (2006) | Russian |
| 104 | Republic of Vanuatu | --- | 36 | --- | --- | Secretariat of the Pacific Community (2005) | English |
| --- | UNK | --- | --- | Secretariat of the Pacific Community (2005) | English | ||
| 105 | Bolivarian Republic of Venezuela | --- | 16 | --- | --- | Venezuela Ministry of Health And Welfare (1998) | Spanish |
| 106 | Socialist Republic of Vietnam | 60 | 36 | Republic of Vietnam (2008) | Vietnamese | Viet Nam Ministry of Health (2002) | Vietnamese |
| Republic of Vietnam (1995) | Vietnamese | ||||||
| Jurisdictions other than United Nations member states | |||||||
| 1 | Palestine | --- | 20 | --- | --- | Palestinian Water Authority (1997) | Arabic |
| 2 | Union of Soviet Socialist Republics (USSR) | 197 | 6 | The State Standard of the USSR (1983) | Russian | Medical Officer of the USSR (1981), State Sanitary of the USSR (1987) | Russian |
| State Medical Officer of the USSR (1982) | Russian | ||||||
| the USSR Ministry (1991) | Russian | ||||||
| Ministry of Health of the USSR (1980) | Russian | ||||||
| No. | U.S. Jurisdictions | No. of Soil RGVs | No. of Water MCLs | Sources of U.S. Pesticide Soil RGVs 1 | Sources of U.S. Pesticide Water MCLs 1 |
|---|---|---|---|---|---|
| U.S. national organization jurisdictions | |||||
| 1 | U.S. Environmental Protection Agency | 516 | 24 | U.S. Environmental Protection Agency (2013) | U.S. Environmental Protection Agency (2009) |
| 2 | National Oceanic and Atmospheric Administration | 39 | --- 2 | National Oceanic and Atmospheric Administration Office of Response and Restoration (2008) | --- |
| 3 | National Aeronautics and Space Administration | 20 | --- | Boeing Company, National Aeronautics and Space Administration and Department of Energy (2010) | --- |
| 4 | Department of Energy | 20 | --- | Boeing Company, National Aeronautics and Space Administration and Department of Energy (2010) | --- |
| 5 | Food and Drug Administration | --- | 24 | --- | Food and Drug Administration (2013) |
| 6 | U.S. Army Public Health Command | --- | 520 | U.S. Army Center for Health Promotion and Preventive Medicine (2013) | U.S. Army Public Health Command (2013) |
| U.S. Army | 259 | --- | --- | --- | |
| 7 | Agency of Toxic Substance and Disease Registry | 26 | --- | Agency of Toxic Substance and Disease Registry (2008, 2009a, f, 2010c, 2013) | --- |
| U.S. state and regional jurisdictions | |||||
| 1 | State of Alabama | 59 | 24 | Alabama Department of Environmental Management (2008) | Alabama Department of Environmental Management (undated *) |
| 2 | State of Alaska | 87 | 27 | Alaska Department of Environmental Conservation (2012) | Alaska Department of Environmental Conservation (2008) |
| 3 | State of Arizona | 523 | 24 | Arizona Administrative Code (2009) | Arizona Department of Environmental Quality (2008) |
| Arizona Department of Environmental Quality (2002) | |||||
| 4 | State of Arkansas | 519 | 24 | Arkansas Department of Environmental Quality (2008) | Arkansas Department of Environmental Quality (2013) |
| U.S. Environmental Protection Agency (2013) | |||||
| 5 | State of California | 16 | 35 | California Environmental Protection Agency Office of Environmental Health Hazard Assessment (2010) | California Office of Environment Health Hazard Assessment (2010) |
| 2 | California Department of Public Health (2010) | ||||
| 15 | California Department of Health Services (2010) | ||||
| 27 | California Department of Health Services (2014) | ||||
| (California) City of Oakland | 4 | --- | City of Oakland Public Works Agency (2000) | ||
| (California) San Francisco Bay Regional Water Quality Control Board | 40 | --- | San Francisco Bay Regional Water Quality Control Board (2013) | ||
| 6 | State of Colorado | 551 | 28 | Colorado Department of Public Health and Environment (2011) | Colorado Department of Public Health and Environment (2014) |
| 7 | State of Connecticut | 14 | 24 | Department of Energy and Environmental Protection (2013) | Connecticut Department of energy and environmental protection (2013) |
| 7 | Connecticut Department of energy and environmental protection (2014) | ||||
| 8 | State of Delaware | 413 | 24 | Delaware Department of Natural Resources and Environmental Control (1999, 2013) | Delaware Department of Natural Resources and Environmental Control (undated) |
| 9 | State of Florida | 143 | 85 | Florida Department of Environmental Protection (2005) | Florida Department of Health (2014) |
| (Florida) Miami-Dade County | 142 | --- | Code of Miami-Dade County (2008) | --- | |
| 10 | State of Georgia | 151 | --- | Georgia Department of Natural Resources (1993) | --- |
| 11 | State of Hawaii | 30 | 24 | Hawaii Department of Health (2011) | Hawaii Department of Health (2009) |
| 12 | State of Idaho | 47 | 24 | Idaho Department of Environmental Quality (2004) | Idaho Department of Environmental Quality (2014) |
| 13 | State of Illinois | 68 | 13 | Illinois Administrative Code (2010) | Illinois Environmental Protection Agency (undated) |
| Illinois Environmental Protection Agency (2011) | |||||
| 14 | State of Indiana | 215 | 24 | Indiana Department of Environmental Management (2013) | Indiana Department of Environmental Management (undated) |
| 24 | Indiana Department of Environmental Management (1996) | ||||
| 15 | State of Iowa | 94 | 24 | Iowa Department of Natural Resources (2013) | Iowa Department of Nature Resources (2012) |
| 16 | State of Kansas | 62 | 27 | Kansas Department of Health and Environment (2010) | Kansas Department of Health and Environment (2004) |
| 17 | Commonwealth of Kentucky | 516 | 24 | Kentucky Energy and Environmental Cabinet (2011) | Kentucky Department of environmental protection (2010) |
| U.S. Environmental Protection Agency (2013) | |||||
| 18 | State of Louisiana | 22 | 24 | Louisiana Department of Environmental Quality (2003) | Louisiana Department of Health and Hospital (undated) |
| 19 | State of Maine | 545 | 24 | Maine Department of Environmental Protection (2011, 2013) | Government of Maine (undated) |
| U.S. Environmental Protection Agency (2013) | |||||
| 20 | State of Maryland | 33 | 24 | Maryland Department of the Environment (2008) | Maryland Department of Environment (undated) |
| 21 | Commonwealth of Massachusetts | 119 | 24 | Massachusetts Department of Environmental Protection (2014) | Massachusetts Office of Energy and Environmental Affairs Energy and Environmental Affairs (2012) |
| 22 | State of Michigan | 62 | 24 | Michigan Department of Environmental Quality (2012) | Michigan Department of Environmental Quality (2014) |
| 23 | State of Minnesota | 132 | 27 | Minnesota Pollution Control Agency (2009) | Minnesota Department of Health (2011) |
| 24 | State of Mississippi | 113 | 24 | Mississippi Department of Environmental Quality (2002) | Mississippi Department of Health (2013) |
| 25 | State of Missouri | 309 | 24 | Missouri Department of Natural Resources (2010) | Missouri Department of Natural Resources (1996) |
| 26 | State of Montana | 516 | 24 | Montana Department of Environmental Quality (2012) | Montana Department of Environmental Quality (2004) |
| U.S. Environmental Protection Agency (2013) | |||||
| 27 | State of Nebraska | 215 | 24 | Nebraska Department of Environmental Quality (2012) | Nebraska Department of Health and Human Services (2012) |
| 28 | State of Nevada | 386 | 24 | Nevada Division of Environmental Protection (2009, 2013) | Nevada Division of Environmental Protection (2013) |
| 29 | State of New Hampshire | 87 | 27 | New Hampshire Code of Administrative Rules (2008) | New Hampshire Department of Environmental Services (2013) |
| 30 | State of New Jersey | 51 | 24 | New Jersey Department of Environmental Protection (1999, 2012) | New Jersey Department of Environmental Protection (2011) |
| 3 | New Jersey Department of Environmental Protection (2009) | ||||
| 31 | State of New Mexico | 511 | 24 | New Mexico Environment Department (2012) | New Mexico Environment Department (2003) |
| U.S. Environmental Protection Agency (2013) | |||||
| 32 | State of New York | 69 | 21 | New York State Department of Environmental Conservation (2006, 2010) | New York Department of Health (2011) |
| (New York) New York City | 63 | --- | New York State Department of Environmental Conservation (2006) | --- | |
| (New York) Suffolk County | 3 | --- | Suffolk County Department of Health Services (2011) | --- | |
| 33 | State of North Carolina | 304 | 24 | North Carolina Department of Environment and Natural Resources (2005, 2012, 2013) | North Carolina Division of Water Resources (2011) |
| 34 | State of North Dakota | 24 | North Dakota Department of Health (2005) | ||
| 35 | State of Ohio | 437 | 24 | Ohio Administrative Code (2009) | Ohio Environmental Protection Agency (UNDATED) |
| Ohio Environmental Protection Agency (2005, UNDATED) | |||||
| U.S. Environmental Protection Agency (2013) | |||||
| 36 | State of Oklahoma | 516 | 24 | Oklahoma Department of Environmental Quality (2013) | Oklahoma Department of Environmental Quality (2012) |
| U.S. Environmental Protection Agency (2013) | |||||
| 37 | State of Oregon | 608 | 24 | Oregon Department of Environmental Quality (2010, 2012) | Oregon Department of Environmental Quality (2000) |
| 20 | Oregon Public Health (2012) | ||||
| U.S. Environmental Protection Agency (2013) | |||||
| 38 | Commonwealth of Pennsylvania | 134 | 24 | Pennsylvania Department of Environmental Protection (2014) | Pennsylvania Department of Environmental Protection (2006) |
| 39 | Rhode Island | 7 | 24 | Rhode Island Department of Environmental Management (2011) | Rhode Island Department of Health (2011) |
| 40 | State of South Carolina | --- | 24 | --- | South Carolina Department of Health and Environment (2009) |
| 41 | State of South Dakota | --- | 27 | --- | South Dakota Department of Environment and Natural Resources (undated) |
| 42 | State of Tennessee | 516 | 24 | Tennessee Department of Environment and Conservation (2001) | Tennessee Department of Environment and Conservation (undated) |
| 43 | State of Texas | 1140 | 24 | Texas Commission on Environmental Quality (2003, 2006a, b, 2012) | Texas Commission on Environmental Quality (2013) |
| 44 | State of Utah | --- | 24 | --- | Utah Department of Environmental Quality (2014) |
| 45 | State of Vermont | 754 | 24 | Vermont Department of Environmental Conservation (2012) | Vermont Agency of Natural Resources (2010) |
| 2 | Vermont Department of Health (2002) | ||||
| U.S. Environmental Protection Agency (2013) | |||||
| 46 | Commonwealth of Virginia | 347 | 24 | Virginia Department of Environmental Control (UNDATED) | Virginia Department of Health (2014) |
| 47 | State of Washington | 252 | --- | Washington Department of Ecology (2007, 2014) | --- |
| 48 | State of West Virginia | 326 | 24 | West Virginia Department of Environmental Protection (2009a, b) | Business and Legal Resources (2014) |
| 49 | State of Wisconsin | 237 | 24 | Wisconsin Department of Natural Resources (2013) | Wisconsin Department of Natural Resources (2013) |
| 50 | State of Wyoming | 25 | 38 | Wyoming Department of Environmental Quality (2013) | Wyoming Department of Environmental Quality (2013) |
| U.S. territories | |||||
| 1 | Commonwealth of the Northern Mariana Islands | 128 | 23 | Commonwealth of the Northern Mariana Islands Division of Environmental Quality (2012) | CNMI Division of Environmental Quality (2005) |
| 2 | Unincorporated Territory of Guam | 128 | 6 | Guam Environmental Protection Agency (2012) | Guam Environmental Protection Agency (1997) |
| Autonomous native American jurisdictions | |||||
| 1 | The Confederated Tribes of the Colville Reservation | 1 | --- | Colville Confederated Tribes (2008) | --- |
| 2 | Confederated Tribes of the Coos-Lower Umpqua-Siuslaw Indians | 608 | --- | Confederated Tribes of the Coos-Lower Umpqua-Siuslaw Indians (2010) | --- |
| Oregon Department of Environmental Quality (2010, 2012a, b, 2014) | |||||
| U.S. Environmental Protection Agency (2013) | |||||
| 3 | Hoppa Valley Tribe | 239 | --- | Hoppa Valley Tribe (2008) | --- |
| U.S. Environmental Protection Agency Region IX (2004) | |||||
| 4 | Metlakatla Indian Community | 2 | --- | Metlakatla Indian Community (2011) | --- |
| 5 | Nez Perce Tribe | 41 | --- | Nez Perce Tribe (2009) | --- |
| 6 | Jamestown S'Klallam Tribe | 252 | --- | Jamestown S'Klallam Tribe (2010) | --- |
| Washington Department of Ecology (2001, 2014) | |||||
| 7 | Shoshone-Bannock Tribes | 20 | --- | Shoshone-Bannock Tribes (2010) | --- |
| Crop Type | Agricultural Commodity | Intake Rate Estimated (kg/day) |
|---|---|---|
| Fruit crops | Apple | 0.019 |
| Banana | 0.032 | |
| Grape | 0.009 | |
| Orange | 0.028 | |
| Vegetable crops | Potato | 0.042 |
| Tomato | 0.021 | |
| Onion | 0.023 | |
| Grain crops | Rice | 0.156 |
| Wheat | 0.223 | |
| Maize | 0.042 | |
| Drink crops | Tea | 0.001 |
| Coffee | 0.012 |
| No. | Pesticide Common Name | CAS No. | No. of RGVs (U.S., world) | RGV Lowest Value (mg/kg) | RGV Highest Value (mg/kg) | RGV LOV | No. of MCLs (U.S., world) | MCL Lowest Value (mg/L) | MCL Highest Value (mg/L) | MCL LOV |
|---|---|---|---|---|---|---|---|---|---|---|
| 1 | DDT | 50-29-3 | 319 (140, 179) | 0.00033; Oregon + 1 | 11,300.0; Netherlands | 7.53 | 115 (13, 102) | 0.00000022; CNMI 2 | 2.8; U.S. Military | 7.11 |
| 2 | Lindane | 58-89-9 | 247 (133, 114) | 0.000005; Poland | 707.0; New Zealand | 8.15 | 166 (58, 108) | 0.000019; CNMI | 2; Mexico + | 5.02 |
| 3 | Dieldrin | 60-57-1 | 247 (121, 126) | 0.0000081; Oregon + | 63,000.0; Illinois | 9.89 | 109 (6, 103) | 0.000000052; CNMI | 0.03; Mauritius + | 5.76 |
| 4 | DDE | 72-55-9 | 244 (118, 126) | 0.00033; Oregon + | 7830.0; Netherlands | 7.38 | 76 (4, 72) | 0.00000022; Wyoming + | 1.0; Mexico | 6.66 |
| 5 | DDD | 72-54-8 | 243 (122, 121) | 0.00033; Oregon + | 5160.0; U.S. Military | 7.19 | 74 (3, 71) | 0.00000022; Wyoming | 1.0; Mexico | 6.66 |
| 6 | Aldrin | 309-00-2 | 242 (119, 123) | 0.00006; Serbia + | 1000.0; Guam + | 7.22 | 110 (6, 104) | 0.000000049; Wyoming+ | 0.03; Hungary + | 5.79 |
| 7 | Chlordane | 57-74-9 or 12789-03-6 | 224 (143, 81) | 0.00003; Serbia + | 1000.0; Guam + | 7.52 | 163 (61, 102) | 0.0000008; Wyoming + | 0.2; Mexico + | 5.40 |
| 8 | Endrin | 72-20-8 | 217 (129, 88) | 0.00004; Singapore + | 4240.0; U.S. Military | 8.03 | 136 (60, 76) | 0.000005; Gambia | 0.28; U.S. Military | 4.75 |
| 9 | Heptachlor | 76-44-8 | 212 (136, 76) | 0.0003; Serbia | 1000.0; Guam + | 6.52 | 137 (59, 78) | 0.00000079; Wyoming + | 0.05; Russia | 5.80 |
| 10 | Pentachloropnenol | 87-86-5 | 191 (125, 66) | 0.005; Norway | 6500.0; Ohio | 6.11 | 153 (57, 96) | 0.0001; EU + | 9.0; Vietnam | 4.95 |
| 11 | Endosulfan | 115-29-7 | 177 (103, 74) | 0.00001; Singapore + | 3000.0; Massachusetts | 8.48 | 13 (1, 12) | 0.02; Australia + | 0.07; U.S. Military | 0.54 |
| 12 | Heptachlor Epoxide | 1024-57-3 | 166 (121, 45) | 0.0000002; Serbia + | 1000.0; Guam + | 9.70 | 117 (57, 60) | 0.00000039; Wyoming+ | 0.1; Croatia | 6.41 |
| 13 | α-HCH | 319-84-6 | 162 (90, 72) | 0.00011; North Carolina | 7100.0; Texas | 7.81 | 7 (4, 3) | 0.0000026; Wyoming+ | 0.02; (Australia) Queensland | 3.88 |
| 14 | Methoxychlor | 72-43-5 | 158 (118, 40) | 0.046; Alberta | 9170.0; Missouri | 5.30 | 159 (58, 101) | 0.0001; EU + | 20.0; Mauritius + | 5.30 |
| 15 | β-HCH | 319-85-7 | 154 (74, 80) | 0.00037; North Carolina | 127.0; U.S. Military | 5.54 | 10 (8, 2) | 0.0000091; Wyoming+ | 0.7; U.S. Military | 4.89 |
| 16 | 2,4-D | 94-75-7 | 147 (103, 44) | 0.04; Moldova | 12,000.0; Oregon + | 5.78 | 180 (59, 121) | 0.0001; EU + | 30.0; Mexico + | 5.48 |
| 17 | Atrazine | 1912-24-9 | 144 (76, 68) | 0.00005; Poland | 12,000.0; Texas | 8.38 | 163 (58, 105) | 0.0001; EU + | 2.0; Vietnam | 4.30 |
| 18 | Toxaphene | 8001-35-2 | 142 (102, 40) | 0.00042; SFBWQ | 500.0; Guam + | 6.08 | 99 (54, 45) | 0.0000028; Wyoming + | 0.014; U.S. Military | 4.70 |
| 19 | Bromomethane | 74-83-9 | 107 (106, 1) | 0.0501; Idaho + | 10,000.0; Massachusetts | 5.30 | 8 (0, 8) | 0.001; Australia + | 0.002; Argentina | 0.30 |
| 20 | o-Cresol | 95-48-7 | 105 (78, 27) | 0.33; New York + | 106,000.0; U.S. Military | 5.51 | 1 (1, 0) | 7.0; U.S. Military | 7.0; U.S. Military | 0.00 |
| 21 | Simazine | 122-34-9 | 103 (72, 31) | 0.01; Armenia + | 1800.0; Texas | 5.26 | 157 (56, 101) | 0.0001; EU + | 20.0; Vietnam | 5.30 |
| 22 | Chlorpyrifos | 2921-88-2 | 102 (66, 36) | 0.20; Russia + | 11,000.0; Michigan | 4.74 | 90 (6, 84) | 0.0001; EU + | 0.09, Argentina + | 2.95 |
| 23 | Aldicarb | 116-06-3 | 78 (68, 10) | 0.041; Idaho + | 360.0; Texas | 3.94 | 103 (16, 87) | 0.0001; EU + | 10.0; Vietnam | 5.00 |
| 24 | Oxamyl | 23135-22-0 | 71 (67, 4) | 0.386; Idaho + | 8900.0; Texas | 4.36 | 102 (52, 50) | 0.0001; EU + | 0.35; U.S. Military | 3.54 |
| 25 | Dinoseb | 88-85-7 | 85 (75, 10) | 0.163; Idaho + | 360.0; Texas | 3.34 | 100 (55, 45) | 0.0001; EU + | 0.42; U.S. Military | 3.62 |
| 26 | Methoxychlor | 72-43-5 | 158 (118, 40) | 0.046; Alberta | 9170.0; Missouri | 5.30 | 159 (58, 101) | 0.0001; EU + | 20.0; Mauritius + | 5.30 |
| 27 | Simazine | 122-34-9 | 103 (72, 31) | 0.01; Armenia + | 1800.0; Texas | 5.26 | 157 (56, 101) | 0.0001; EU + | 20.0; Vietnam | 5.30 |
| 28 | Alachlor | 15972-60-8 | 67 (62, 5) | 0.008; North Carolina | 3600.0; Texas | 5.65 | 141 (61, 80) | 0.0001; EU + | 20.0; Vietnam | 5.30 |
| 29 | 2,4,5-TP | 93-72-1 | 96 (94, 2) | 0.8; Minnesota + | 3000.0; Ohio | 3.57 | 138 (53, 85) | 0.0001; EU + | 9.0; Vietnam | 4.95 |
| 30 | Carbofuran | 1563-66-2 | 97 (63, 34) | 0.00002; Singapore + | 1800.0; Texas | 7.95 | 138 (41, 97) | 0.0001; EU + | 0.1; Serbia | 3.00 |
| 31 | DBCP | 96-12-8 | 31 (30, 1) | 0.003; Georgia | 16.0; Washington | 3.73 | 125 (51, 74) | 0.00003; Vermont | 1.0; Vietnam | 4.52 |
| 32 | Glyphosate | 1071-83-6 | 93 (73, 20) | 0.011; Guam + | 36,000.0; Texas | 6.51 | 122 (56, 66) | 0.0001; EU + | 28.0; U.S. Military | 5.45 |
| 33 | Picloram | 1918-02-1 | 91 (64, 27) | 0.022; Alberta | 25,000.0; Texas | 6.06 | 119 (54, 65) | 0.0001; EU + | 28.0; U.S. Military | 5.45 |
| 34 | Diquat | 85-00-7 | 71 (53, 18) | 0.109; Nez Perce Tribe | 480.0; Pennsylvania | 3.64 | 115 (26, 89) | 0.0001; EU + | 0.1; Argentina | 3.00 |
| 35 | Endothall | 145-73-3 | 70 (66, 4) | 0.335; Idaho + | 7100.0; Texas | 4.33 | 104 (54, 50) | 0.0001; EU + | 1.1; U.S. Military | 4.04 |
| 36 | Dalapon | 75-99-0 | 90 (75, 15) | 0.10; Vietnam | 19,000.0; Michigan | 5.28 | 104 (54, 50) | 0.0001; EU + | 4.2; U.S. Military | 4.62 |
| 37 | Aldicarb | 116-06-3 | 78 (68, 10) | 0.041; Idaho + | 360.0; Texas | 3.94 | 103 (16, 87) | 0.0001; EU + | 10.0; Vietnam | 5.00 |
| 39 | Dinoseb | 88-85-7 | 85 (75, 10) | 0.163; Idaho + | 360.0; Texas | 3.34 | 100 (55, 45) | 0.0001; EU + | 0.42; U.S. Military | 3.62 |
| No. | Pesticide | CAS No. | RGV Number | Arithmetic Mean (mg/kg) | Median (mg/kg) | Geometric Mean (mg/kg) | Pearson Coefficient | No. of RGVs in Data Clusters | % | Cancer risk Uncertainty Bounds (mg/kg) | Non-cancer risk Uncertainty Bounds (mg/kg) | No. of RGVs above All Risk Upper Bounds | % |
|---|---|---|---|---|---|---|---|---|---|---|---|---|---|
| 1 | 2,4-D | 94-75-7 | 147 | 12000 | 630 | 122 | 0.907 | 49 | 33% | --- 1 | (45.3, 690) | 6 | 4% |
| 2 | Aldrin | 309-00-2 | 241 | 11.3 | 0.1 | 0.24 | 0.977 | 89 | 37% | (0.016, 0.1) | (0.91, 9.61) | 27 | 11% |
| 3 | Atrazine | 1912-24-9 | 144 | 12000 | 2.2 | 3.61 | 0.983 | 52 | 36% | (1.2, 7.4) | (1100, 11200) | 1 | 1% |
| 4 | Carbaryl | 63-25-2 | 94 | 4079 | 905 | 177.1 | 0.918 | 49 | 52% | --- | (3000, 32,100) | 1 | 1% |
| 5 | Carbofuran | 1563-66-2 | 97 | 200.4 | 130 | 15 | 0.935 | 54 | 56% | --- | (150, 1610) | 1 | 1% |
| 6 | Chlordane | 57-74-9 or 12789-03-6 | 224 | 41.3 | 2.8 | 3 | 0.990 | 69 | 31% | (1.13, 5.63) | (23.0, 190.0) | 11 | 5% |
| 7 | Chlorpyrifos | 2921-88-2 | 102 | 235.8 | 61 | 37.7 | 0.960 | 50 | 49% | --- | (30, 321) | 12 | 12% |
| 8 | DDT | 50-29-3 | 319 | 93.2 | 2 | 3.38 | 0.977 | 97 | 30% | (1.25, 5.95) | (26.0, 200.0) | 31 | 10% |
| 9 | Diazinon | 333-41-5 | 86 | 38.8 | 35.5 | 10.1 | 0.945 | 56 | 65% | --- | (21, 220) | 2 | 2% |
| 10 | Dicamba | 1918-00-9 | 80 | 1340.6 | 1800 | 164.3 | 0.903 | 50 | 63% | --- | (910, 9600) | 1 | 1% |
| 11 | Dieldrin | 60-57-1 | 247 | 266.7 | 0.15 | 0.28 | 0.986 | 60 | 24% | (0.016, 0.11) | (1.5, 16.0) | 19 | 8% |
| 12 | Diuron | 330-54-1 | 88 | 138.2 | 120 | 38.5 | 0.948 | 41 | 47% | --- | (60, 640) | 3 | 3% |
| 13 | Endosulfan | 115-29-7 | 177 | 219.7 | 37 | 17.9 | 0.965 | 56 | 32% | --- | (181.5, 1928) | 2 | 1% |
| 14 | Endrin | 72-20-8 | 217 | 42.3 | 4.6 | 2.63 | 0.969 | 79 | 36% | --- | (9.1, 96.0) | 12 | 6% |
| 15 | Glyphosate | 1071-83-6 | 93 | 4715.7 | 1500 | 545.8 | 0.904 | 48 | 52% | --- | (3000, 32,000) | 1 | 1% |
| 16 | α-HCH | 319-84-6 | 162 | 84.7 | 0.1 | 0.24 | 0.952 | 100 | 62% | (0.04, 0.27) | (241.9, 2571) | 2 | 1% |
| 17 | β-HCH | 319-85-7 | 154 | 4.72 | 0.3 | 0.28 | 0.983 | 80 | 52% | (0.15, 0.95) | --- | 49 | 32% |
| 18 | γ-HCH (Lindane) | 58-89-9 | 247 | 16.1 | 0.52 | 0.51 | 0.989 | 117 | 47% | (0.56, 1.7) | (14.1, 114.2) | 9 | 4% |
| 19 | t-HCH | 608-73-1 | 84 | 11.8 | 0.3 | 0.438 | 0.934 | 36 | 43% | (0.15, 0.95) | --- | 22 | 26% |
| 20 | Heptachlor | 76-44-8 | 212 | 15.9 | 0.2 | 0.45 | 0.978 | 71 | 33% | (0.0615, 0.379) | (5.0, 160.0) | 4 | 2% |
| 21 | Malathion | 121-75-5 | 85 | 893 | 1200 | 195.8 | 0.922 | 52 | 61% | --- | (600, 6400) | 1 | 1% |
| 22 | MCPA | 94-74-6 | 98 | 153.9 | 31 | 14.1 | 0.965 | 65 | 66% | --- | (15, 160) | 20 | 20% |
| 23 | Metolachlor | 51218-45-2 | 83 | 6105.7 | 2000 | 635.8 | 0.908 | 48 | 58% | --- | (4500, 48,000) | 1 | 1% |
| 24 | Picloram | 1918-02-1 | 91 | 3581 | 4300 | 649.2 | 0.878 | 33 | 36% | --- | (2100, 22,000) | 1 | 1% |
| 25 | Simazine | 122-34-9 | 103 | 108 | 4.1 | 3.9 | 0.971 | 31 | 30% | (2.3, 14.0) | (150, 1600) | 1 | 1% |
| 26 | Toxaphene | 8001-35-2 | 142 | 23 | 0.6 | 1.71 | 0.952 | 53 | 37% | (0.252, 1.55) | --- | 58 | 41% |
| 27 | Trifluralin | 1582-09-8 | 95 | 287.5 | 63 | 47.1 | 0.900 | 47 | 49% | (26, 220) | (230, 2400) | 2 | 2% |
| No. | Pesticide | CAS No. | MCL No. | Arithmetic Mean (mg/L) | Median (mg/L) | Geometric Mean (mg/L) | Pearson Coefficient | No. of MCLs in Data Clusters | % | Health Risk Uncertainty Bounds (mg/L) | No. of MCLs above Risk Upper Bound | % |
|---|---|---|---|---|---|---|---|---|---|---|---|---|
| 1 | 2,4,5-TP | 93-72-1 | 138 | 0.088 | 0.009 | 0.0057 | 0.906 | 70 | 51% | (0.024, 0.37) | 1 | 1% |
| 2 | 2,4-D | 94-75-7 | 180 | 0.4 | 0.03 | 0.015 | 0.861 | 164 | 91% | (0.03, 0.47) | 6 | 3% |
| 3 | Alachlor | 15972-60-8 | 141 | 0.22 | 0.002 | 0.0066 | 0.952 | 123 | 87% | (0.03, 0.47) | 2 | 1% |
| 4 | Aldicarb | 116-06-3 | 103 | 0.1 | 0.004 | 0.0016 | 0.91 | 82 | 80% | (0.003, 0.047) | 2 | 2% |
| 5 | Aldrin | 309-00-2 | 110 | 0.003 | 0.00003 | 0.0000712 | 0.817 | 83 | 75% | (0.003, 0.047) | 1 | 1% |
| 6 | Atrazine | 1912-24-9 | 163 | 0.032 | 0.003 | 0.0027 | 0.948 | 130 | 80% | (0.015, 0.23) | 1 | 1% |
| 7 | Carbofuran | 1563-66-2 | 137 | 0.025 | 0.01 | 0.005 | 0.938 | 98 | 72% | (0.009, 0.14) | 0 | 0% |
| 8 | Chlordane | 57-74-9 or 12789-03-6 | 163 | 0.0067 | 0.0002 | 0.0005 | 0.939 | 137 | 84% | (0.0015, 0.023) | 8 | 5% |
| 9 | Chlorpyrifos | 2921-88-2 | 90 | 0.025 | 0.01 | 0.003 | 0.811 | 81 | 90% | (0.09, 1.4) | 0 | 0% |
| 10 | Dalapon | 75-99-0 | 104 | 0.26 | 0.2 | 0.014 | 0.872 | 89 | 86% | (0.09, 1.4) | 5 | 5% |
| 11 | DBCP | 96-12-8 | 125 | 0.013 | 0.00035 | 0.0002 | 0.909 | 112 | 90% | (0.0006, 0.0093) | 8 | 6% |
| 12 | DDT | 50-29-3 | 115 | 0.072 | 0.001 | 0.0011 | 0.945 | 82 | 71% | (0.006, 0.093) | 9 | 8% |
| 13 | Dieldrin | 60-57-1 | 141 | 0.003 | 0.00003 | 0.0000739 | 0.803 | 83 | 59% | (0.0003, 0.0047) | 9 | 6% |
| 14 | Dinoseb | 88-85-7 | 100 | 0.017 | 0.007 | 0.0017 | 0.878 | 91 | 91% | (0.003, 0.047) | 6 | 6% |
| 15 | Diquat | 85-00-7 | 115 | 0.019 | 0.02 | 0.0037 | 0.886 | 103 | 90% | (0.006, 0.093) | 1 | 1% |
| 16 | Endothall | C8H10O5 | 104 | 0.089 | 0.1 | 0.0089 | 0.855 | 98 | 94% | (0.09, 1.4) | 0 | 0% |
| 17 | Endrin | 72-20-8 | 136 | 0.0023 | 0.0006 | 0.0006 | 0.945 | 116 | 85% | (0.0006, 0.0093) | 4 | 3% |
| 18 | Glyphosate | 1071-83-6 | 122 | 1.04 | 0.7 | 0.042 | 0.864 | 91 | 75% | (0.9, 14) | 2 | 2% |
| 19 | Heptachlor | 76-44-8 | 137 | 0.0038 | 0.0003 | 0.0002 | 0.952 | 85 | 62% | (0.0015, 0.023) | 11 | 8% |
| 20 | Heptachlor Epoxide | 1024-57-3 | 120 | 0.003 | 0.0003 | 0.00013 | 0.921 | 93 | 78% | (0.000039, 0.00061) | 14 | 12% |
| 21 | Lindane | 58-89-9 | 167 | 0.064 | 0.0002 | 0.00076 | 0.935 | 145 | 87% | (0.009, 0.14) | 9 | 5% |
| 22 | MCPA | 94-74-6 | 94 | 0.041 | 0.02 | 0.015 | 0.948 | 80 | 85% | (0.03, 0.47) | 1 | 1% |
| 23 | Methoxychlor | 72-43-5 | 159 | 0.56 | 0.02 | 0.011 | 0.891 | 113 | 71% | (0.3, 4.67) | 4 | 3% |
| 24 | Oxamyl | 23135-22-0 | 104 | 0.11 | 0.2 | 0.0089 | 0.89 | 89 | 86% | (0.006, 0.093) | 55 | 53% |
| 25 | Pentachloropnenol | 87-86-5 | 153 | 0.081 | 0.001 | 0.0012 | 0.957 | 123 | 80% | (0.015, 0.23) | 4 | 3% |
| 26 | Picloram | 1918-02-1 | 119 | 0.98 | 0.3 | 0.031 | 0.871 | 103 | 87% | (0.21, 3.27) | 5 | 4% |
| 27 | Simazine | 122-34-9 | 157 | 0.15 | 0.004 | 0.002 | 0.936 | 148 | 94% | (0.015, 0.23) | 2 | 1% |
| 28 | Toxaphene | 8001-35-2 | 99 | 0.003 | 0.003 | 0.00072 | 0.881 | 90 | 91% | (0.006, 0.093) | 1 | 1% |
| 29 | Trifluralin | 1582-09-8 | 98 | 0.23 | 0.02 | 0.0039 | 0.907 | 78 | 80% | (0.06, 0.93) | 1 | 1% |
| No. | Pesticide | CAS No. | IED No. | Arithmetic mean (mg/kg-day) | Median (mg/kg-day) | Geometric Mean (mg/kg-day) | Pearson Coefficient | No. of IEDs in Data Clusters | % | ADI Value (mg/kg-day) | No. of IEDs above the ADI Value | % |
|---|---|---|---|---|---|---|---|---|---|---|---|---|
| 1 | 2,4-D | 94-75-7 | 91 | 0.0064 | 0.0069 | 0.0056 | 0.761 | 63 | 70% | 0.01 | 1 | 1% |
| 2 | Aldicarb | 116-06-3 | 88 | 0.00012 | 0.0000975 | 0.000764 | 0.763 | 67 | 76% | 0.001 | 0 | 0% |
| 3 | Atrazine | 1912-24-9 | 55 | 0.00031 | 0.00038 | 0.00023 | 0.830 | 35 | 64% | 0.005 | 0 | 0% |
| 4 | Chlorothalonil | 1897-45-6 | 88 | 0.0045 | 0.002 | 0.0027 | 0.897 | 59 | 67% | 0.015 | 0 | 0% |
| 5 | Chlorpyrifos | 2921-88-2 | 88 | 0.0037 | 0.0034 | 0.0031 | 0.929 | 58 | 66% | 0.001 | 85 | 97% |
| 6 | Diazinon | 333-41-5 | 88 | 0.0003 | 0.00026 | 0.00016 | 0.949 | 71 | 81% | 0.0007 | 12 | 14% |
| 7 | Dicamba | 1918-00-9 | 89 | 0.0059 | 0.0064 | 0.0048 | 0.645 | 76 | 85% | 0.03 | 0 | 0% |
| 8 | Diuron | 330-54-1 | 54 | 0.00049 | 0.0000505 | 0.00012 | 0.741 | 34 | 63% | 0.002 | 3 | 6% |
| 9 | Glyphosate | 1071-83-6 | 91 | 0.093 | 0.052 | 0.065 | 0.907 | 64 | 70% | 0.1 | 41 | 45% |
| 10 | Malathion | 121-75-5 | 94 | 0.045 | 0.043 | 0.048 | 0.951 | 57 | 61% | 0.02 | 92 | 98% |
| 11 | Mancozeb | 8018-01-7 | 90 | 0.0074 | 0.00026 | 0.00016 | 0.949 | 64 | 71% | 0.03 | 0 | 0% |
| 12 | MCPA | 94-74-6 | 86 | 0.00068 | 0.00064 | 0.00058 | 0.616 | 72 | 84% | 0.0005 | 76 | 88% |
| 13 | Metolachlor | 51218-45-2 | 51 | 0.0000887 | 0.0000757 | 0.0000798 | 0.703 | 42 | 82% | 0.15 | 0 | 0% |
| 14 | Trifluralin | 1582-09-8 | 53 | 0.00021 | 0.00021 | 0.00018 | 0.807 | 42 | 79% | 0.0075 | 0 | 0% |
| No. | Pesticide | CAS No. | IMDL No. | Arithmetic Mean (mg/kg-day) | Median (mg/kg-day) | Geometric Mean (mg/kg-day) | Pearson Coefficient | No. of IMDLs in Data Clusters | % | No. of IMDLs Computed from Three Exposures | % | ADI (mg/kg-day) | No. of IMDLs above the ADI Value | % |
|---|---|---|---|---|---|---|---|---|---|---|---|---|---|---|
| 1 | 2,4-D | 94-75-7 | 145 | 0.0231 | 0.00694 | 0.00214 | 0.881 | 71 | 49% | 17 | 12% | 0.01 | 13 | 9% |
| 2 | Aldicarb | 116-06-3 | 121 | 0.00259 | 0.0000975 | 0.0000971 | 0.977 | 74 | 61% | 5 | 4% | 0.001 | 3 | 2% |
| 3 | Atrazine | 1912-24-9 | 125 | 0.00167 | 0.000382 | 0.000148 | 0.917 | 59 | 47% | 22 | 18% | 0.005 | 2 | 2% |
| 4 | Chlorothalonil | 1897-45-6 | 105 | 0.004 | 0.0018 | 0.0013 | 0.925 | 74 | 70% | 2 | 2% | 0.015 | 0 | 0% |
| 5 | Chlorpyrifos | 2921-88-2 | 129 | 0.0031 | 0.0026 | 0.0015 | 0.861 | 78 | 60% | 7 | 5% | 0.001 | 100 | 78% |
| 6 | Diazinon | 333-41-5 | 108 | 0.00043 | 0.00026 | 0.00011 | 0.947 | 69 | 64% | 2 | 2% | 0.0007 | 20 | 19% |
| 7 | Dicamba | 1918-00-9 | 105 | 0.00538 | 0.00639 | 0.00198 | 0.713 | 67 | 64% | 2 | 2% | 0.03 | 0 | 0% |
| 8 | Diuron | 330-54-1 | 75 | 0.00112 | 0.0000533 | 0.000105 | 0.946 | 40 | 53% | 2 | 3% | 0.002 | 11 | 15% |
| 9 | Glyphosate | 1071-83-6 | 115 | 0.0765 | 0.0335 | 0.0139 | 0.854 | 73 | 63% | 4 | 3% | 0.1 | 42 | 37% |
| 10 | Malathion | 121-75-5 | 111 | 0.04 | 0.0482 | 0.0157 | 0.688 | 63 | 57% | 2 | 2% | 0.02 | 94 | 85% |
| 11 | Mancozeb | 8018-01-7 | 105 | 0.0067 | 0.00701 | 0.0024 | 0.719 | 71 | 68% | 2 | 2% | 0.03 | 0 | 0% |
| 12 | MCPA | 94-74-6 | 126 | 0.00161 | 0.00064 | 0.000289 | 0.917 | 82 | 65% | 12 | 10% | 0.0005 | 87 | 69% |
| 13 | Metolachlor | 51218-45-2 | 77 | 0.00143 | 0.0000786 | 0.0000905 | 0.921 | 47 | 61% | 3 | 4% | 0.15 | 0 | 0% |
| 14 | Trifluralin | 1582-09-8 | 98 | 0.00628 | 0.000213 | 0.00017 | 0.897 | 63 | 64% | 2 | 2% | 0.0075 | 1 | 1% |
© 2017 by the authors. Licensee MDPI, Basel, Switzerland. This article is an open access article distributed under the terms and conditions of the Creative Commons Attribution (CC BY) license (http://creativecommons.org/licenses/by/4.0/).
Share and Cite
Li, Z.; Jennings, A. Worldwide Regulations of Standard Values of Pesticides for Human Health Risk Control: A Review. Int. J. Environ. Res. Public Health 2017, 14, 826. https://doi.org/10.3390/ijerph14070826
Li Z, Jennings A. Worldwide Regulations of Standard Values of Pesticides for Human Health Risk Control: A Review. International Journal of Environmental Research and Public Health. 2017; 14(7):826. https://doi.org/10.3390/ijerph14070826
Chicago/Turabian StyleLi, Zijian, and Aaron Jennings. 2017. "Worldwide Regulations of Standard Values of Pesticides for Human Health Risk Control: A Review" International Journal of Environmental Research and Public Health 14, no. 7: 826. https://doi.org/10.3390/ijerph14070826
APA StyleLi, Z., & Jennings, A. (2017). Worldwide Regulations of Standard Values of Pesticides for Human Health Risk Control: A Review. International Journal of Environmental Research and Public Health, 14(7), 826. https://doi.org/10.3390/ijerph14070826